The authors would like to make the following corrections to the published paper [1]. The changes are as follows:
- Corrections in Figure/Table
Figures 3 and 4 with the legends were removed according to the remarks of a Reviewer. The authors state that the scientific conclusions are unaffected because the total tritium release is a separate treatment of the obtained data, which were included in the article, to compare the tritium release results at different heating rates. Since this comparison does not lend itself to logical interpretation, it was decided to remove it. Additional research work will be carried out and results published to determine the absolute values of the total tritium release from irradiated beryllium. After this removal, the figure numbers were changed as follows: Figure 5 to Figure 3, Figure 6 to Figure 4, Figure 7 to Figure 5,Figure 8 to Figure 6.
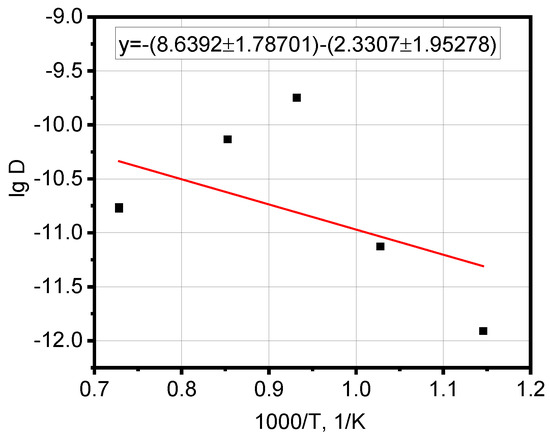
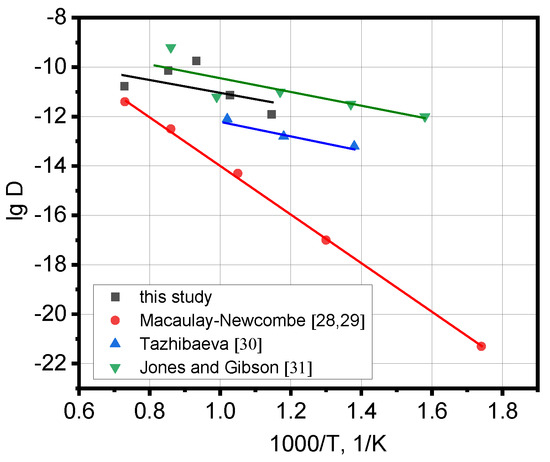
Figure 9 was removed. Figure 7 and Figure 8 with the new legends were added, as below. Figure 8 is the former Figure 9 with the experimental data after a specified linear approximation of the effective tritium diffusion coefficients in Figure 7.

Figure 7.
Dependence of lg D on 1000/T, where D, m2/s is the effective tritium diffusion coefficient, T, K is the temperature (D and T were taken from Table 7).

Figure 8.
Dependence of lg D on 1000/T from literature [28–31] and this study, where D, m2/s is the effective tritium diffusion coefficient, T, K is the temperature.
The content of Table 8 of the tritium diffusion path L in the irradiated Be sample was changed because of the changed linear correlation in the added Figure 7. The corrected Table 8 appears below.

Table 8.
Tritium diffusion path L in irradiated Be sample calculated using relation (8).
The Correlations (5) and (6) were specified as follows: for β1 the coefficient 2.2447 was changed by 2.02 and for β2 1.9006 was changed by 1.92 because the specified calculations of the pre-exponential factor of desorption ν. The corrected Correlations (5) and (6) appear below:
for β1 = 0.117 K/s, r [Bq/(g·s)] = 2.02 × 10⁴ [s−1]·Ө [Bq/g]·exp(−1.6 eV/kT)
for β2 = 0.017 K/s, r [Bq/(g·s)] = 1.92 × 10⁴ [s−1]·Ө [Bq/g]·exp(−1.6 eV/kT)
For Correlation (7), the coefficient 3.5597 was changed to 4.2412, degree −6 was replaced by −10, and the exponent −1.05 was replaced by −0.47 because the specified linear approximation of the effective tritium diffusion coefficients in Figure 7. The corrected Correlation (7) appears below:
D = 4.2412 × 10⁻¹⁰·exp (−0.47/kT)
- Text Correction
The following was added in Section 2 to clarify the tritium content in irradiated beryllium at the time of the thermal desorption tests:
“Due to the radioactive decay of tritium from 1995 to 2022, the content of tritium in beryllium to the time of the thermal desorption tests decreased to 440 appm.”
The following was added in Section 2 to correct the duration of each temperature step in the stepped heating mode:
“1-h exposure at each temperature”
The following were removed from Section 3.1. because Figures 3 and 4 were removed:
“Figure 3 shows the total tritium release results for the irradiated beryllium matrix fragments at three heating modes.”
“The total tritium release behavior for the different heating modes is illustrated in Figure 4. The results indicate that the largest total tritium release occurred under the higher permanent heating rate while the stepped heating mode showed the lowest total tritium release value.”
The following was added in Section 4.2. because Figure 7 was added:
“Figure 7 shows a linear approximation of the effective tritium diffusion coefficients D from Table 7 in the axes lg D to 1000/T.”
The following was corrected in the paragraph above Table 8 in Section 4.2. Please note that the changes have been marked in bold.
“The calculated L values are shown in Table 8. By comparing the calculated values of the tritium diffusion path L with radius R of the diameter d (see Table 1), it is possible to estimate the possibility for tritium total escaping the sample during the exposure time t at a given temperature T. Table 8 shows the results of these calculations. As follows from Table 8, the tritium atoms reach the outer surface of the samples after exposure at 1273 and 1373 K for 100 h as well as at 1473 K for 70 h. According to Table 2, the tritium release peaks are located in an interval of 1031–1136 K. Therefore, it is logical to use for detritiation of the irradiated beryllium waste the annealing temperatures that are higher than the tritium peak temperatures. Therefore, if there are fragments of irradiated beryllium with size of ~3 mm, a minimum annealing temperature for the tritium escaping can be 1273 K and an exposure time is 100 h. If sizes of irradiated beryllium fragments are larger than 3 mm, then, accordingly, the new annealing parameters can be selected using the relation (8).”
The following was removed in Section 4.3. because Figure 4 was removed:
“Figure 4 shows a significant difference between values of the total tritium release for different heating modes as the permanent heating at 0.117 and 0.017 K/s rates and the stepped heating. A similar situation occurred in an earlier study [18] in which the same setup for the TDS tests was used. At present, no clear explanation of this imbalance for the total tritium release at different heating modes during TPD testing of irradiated beryllium has been found. Possible reasons for this imbalance may be loss of tritium during movement in the pipe line from the furnace to the IC by temporary tritium adsorption on the inner walls of the pipes, the mode of operation of the IC or other factors.”
- Data Availability Statement Update
The original Data Availability Statement was updated to: “The data presented in this study are available in the article.”
The authors state that the scientific conclusions are unaffected. This correction was approved by the Academic Editor. The original publication has also been updated.
Reference
- Chakin, V.; Rolli, R.; Gaisin, R.; van Renterghem, W. Tritium Desorption Behavior and Microstructure Evolution of Beryllium Irradiated at Low Temperature Up to High Neutron Dose in BR2 Reactor. J. Nucl. Eng. 2023, 4, 552–564. [Google Scholar] [CrossRef]
Disclaimer/Publisher’s Note: The statements, opinions and data contained in all publications are solely those of the individual author(s) and contributor(s) and not of MDPI and/or the editor(s). MDPI and/or the editor(s) disclaim responsibility for any injury to people or property resulting from any ideas, methods, instructions or products referred to in the content. |
© 2024 by the authors. Licensee MDPI, Basel, Switzerland. This article is an open access article distributed under the terms and conditions of the Creative Commons Attribution (CC BY) license (https://creativecommons.org/licenses/by/4.0/).