Article

Effect of Extrusion on the Crystalline Structure of Starch during RS5 Formation

by
Angel H. Cabrera-Ramírez
1,
Eliel Cervantes-Ramírez
2,
Eduardo Morales-Sánchez
1,
Mario E. Rodriguez-García
3,
María de la Luz Reyes-Vega
2,* and
Marcela Gaytán-Martínez
4,*
1
Instituto Politécnico Nacional, CICATA-IPN Unidad Querétaro, Cerro Blanco No. 141. Col. Colinas del Cimatario, Querétaro 76090, Mexico
2
Centro Universitario Cerro de las Campanas s/n Col. Centro, Universidad Autónoma de Querétaro, Querétaro 76000, Mexico
3
Centro de Física Aplicada y Tecnología Avanzada, Departamento de Nanotecnología, Universidad Nacional Autónoma de México, Campus Juriquilla, Querétaro 76230, Mexico
4
Programa de Posgrado en Alimentos del Centro de la República (PROPAC), Facultad de Química, Universidad Autónoma de Querétaro, Centro Universitario Cerro de las Campanas s/n Col. Centro, Querétaro 76000, Mexico
*
Authors to whom correspondence should be addressed.
Polysaccharides 2021, 2(1), 187-201; https://doi.org/10.3390/polysaccharides2010013
Submission received: 19 February 2021 / Revised: 6 March 2021 / Accepted: 8 March 2021 / Published: 16 March 2021

Abstract

:
Amylose is well known to be organized helically with six glucose per turn, allowing it to form complexes with various ligands. This interaction can be affected by the type of crystalline structure present in the starch sources. This study evaluated the effect of extrusion on the crystalline structure of starch during RS5 formation. Rice and potato starches were extruded at 100 °C and 15 rpm with 5% and 10% oleic acid (OA), then the physical, thermal, paste properties, and resistant starch content (RS) were evaluated. Potato starch extruded with 10% OA showed granules embedded in a gelatinized starch matrix. The X-ray revealed that rice (orthorhombic) and potato (hexagonal) structures remain unchanged even after extrusion. Differential scanning calorimetry (DSC) evidenced the formation of type IIa amylose-lipid complexes in OA treatments, where potato extruded with 10% OA had the highest enthalpy (0.9 J/g). Moreover, the extruded potato showed the highest pasting temperature (87.19 °C), supporting the complex formation. The RS was reduced from 15.8 (isolated) to 4.14 mg/100 mg (extruded 10% OA) in rice. For potato, RS decreased from 17 to 13 mg/100 mg (isolated and extruded 10% OA). Overall, these findings suggest a tendency in potato starch (ortho-rhombic) to interact with OA during the extrusion process, promoting a crystalline lamellae growth when extruded with 10% OA; therefore, changing their properties.

1. Introduction

Starch is one of the main polysaccharides in plants and has been used extensively in the food industry. Starch is a sub or microparticle formed by lipids, proteins, minerals, water, bonded water, amylose, and amylopectin, and pyroglycans forming orthorhombic and hexagonal crystalline structures [1]. Amylose and amylopectin are glucose polymers that differ in their branching characteristics. Amylopectin consists of D-glucose units linked by α-(1→4), branched every 20 to 22 units by glycosidic links α-(1→6), with an incidence of ~5%. Amylopectin is organized in highly packaged clusters [2]. In contrast, amylose is linear chains of D-glucose linked by glycosidic bonds α-(1→4), with an occasional branching α-(1→6) less than 0.5%, typically for high molecular weight amylose. Amylose is arranged in helical structures containing 6 to 8 glucose units per turn [3]. This characteristic gives amylose the ability to interact with amphiphilic or hydrophobic molecules (ligands), forming helical inclusion complexes usually named type-5 resistant starch (RS5); this polymorphism is known as V-amylose. In that sense, V-amylose complexes are simple left-handed helixes grouped into crystalline lamellae and an amorphous phase. Such complexation can occur with various compounds such as iodine, alcohols, fatty acids, potassium hydroxide, or hydrophilic organic compounds [4]. Furthermore, based on their melting temperatures, two types of complexes can be identified: type I and type II. It is important to note that type I complexes result from the helix segments random organization, with melting temperatures below 100 °C. In contrast, type II complexes have a more ordered semicrystalline structure, with melting temperatures above 100 °C [5]. It has been suggested this type of complex arises during the starch gelatinization when processed in the presence of lipids and its subsequent cooling [6]. Recently Chao et al. [6] have proposed a mechanism to explain the formation of amylose-lipid complexes. In that sense, when the starch–lipid mixture is thermally processed, the starch gelatinizes, and amylose chains leach out, forming a small number of amylose-lipid complexes. However, during the cooling process, the most considerable number of amylose-lipid complexes are formed and packed into a V-type crystalline structure. However, the model from the crystallographic point of view does not make any physical sense because there is no crystallographic evidence of the formation of this complex, and there is no well-defined peak indexing that reveals the formation of any crystalline structure [1].
Several articles have evaluated the formation of amylose-lipid complexes during starch processing. D’Silva et al. [7] observed that holding the temperature at 91 °C for 120 min in RVA, a higher complexation index (52%) was obtained using teff and corn starch added with 1.5% of stearic acid. In the same direction, Arik Kibar et al. [8] evaluated the ability to form complexes of several fatty acids with corn starch at room temperature, finding short-chain and unsaturated fatty acids favored the formation of complexes. Furthermore, complexes from long-chain and saturated fatty acids were more thermally stable. De Pilli et al. [9] evaluated different extrusion conditions in rice starch and oleic acid mixtures, finding that 100 °C produced the highest complex formation. Finally, Cervantes-Ramírez et al. [10] evaluated the formation of amylose-lipid complexes during extrusion (100 °C) of mixtures of corn starch with fatty acids (oleic acid, stearic acid, and maize oil), finding that oleic and stearic acids had a higher affinity to interact with corn starch.
As noted, most of the studies evaluating the formation of starch–lipid complexes have been carried out on cereal starches. However, depending on the botanical source, the crystalline structure of starch will differ, having an orthorhombic (type-A) and hexagonal (type-B) structure in cereal and tuber starches, respectively. Whether the crystalline structure of starch can affect starch’s ability to form complexes with lipids or if the crystalline structure may influence the increase in its resistance to enzymatic digestion is still an unexplored field. Therefore, this study aimed to evaluate the effect of extrusion on the crystalline structure of starch during RS5 formation.

2. Materials and Methods

2.1. Materials

This study used two different starch sources, rice and potato isolated starches acquired from National Starch and Chemical S.A. de C.V. (Toluca, Mexico). On the other hand, it was used a commercial Oleic acid [C18:1] (brand “La Guadalupana®”, Querétaro, Qro. Mexico).

2.2. Starch Processing

2.2.1. Starch-Oleic Acid Blends

To obtain the starch-oleic acid blends, 120 ± 0.01 g of isolated starch was mixed with 5% and 10% of oleic acid (w/w); subsequently, the mixture was homogenized using a Black & Decker hand mixer (model Ergo 5, Maryland USA). The starch blend was adjusted to 35% of moisture and was left to rest in sealed bags at room temperature (27 °C) for 12 h before being subjected to the extrusion process [10]. Likewise, a sample of isolated starch without oleic acid was adjusted to 35% of moisture and left rest in the same conditions, being considered as the control.

2.2.2. Extrusion Process

The extrusion process was carried out as previously published by Cervantes-Ramírez et al. [10]. Briefly, the starch blends were extruded using a single screw extruder (Patent MX/a/2007/016262, CICATA-IPN Queretaro, Mexico) with two heating zones. The screw had a diameter of 1 inch, ratio L/D = 19, and a helix depth of 1/8 inch. The following conditions were used for the extrusion process: 15 rpm, 85 °C (first heating zone), 100 °C (second heating zone). For the control, the starch without oleic acid was extruded under the same conditions. The extruded starches were dried in a dehydrator (3900 B, Excalibur Dehydrators, Sacramento, CA, USA) at 40 °C for 24 h. Finally, the samples were ground and pass through a No. 60 US mesh (250 μm) to obtain a fine powder. The samples were stored in sealed bags at room temperature (27 °C) until use. This procedure was carried out in a triplicate.

2.3. Starch Morphology

The morphology of the isolated starches and extruded starches with and without oleic acid was evaluated using a JEOL scanning electron microscope SEM (model JSM-6060 LV, Tokyo, Japan). The SEM equipment was operated in a low vacuum, and using an electron beam of 10 kV, the sample (previously gold coated) was observed at a magnification of 2500×. Using the free software ImageJ (v1.52) and the SEM images, it was measured the starch size of the isolated starches from both rice and potato.

2.4. X-ray Diffraction Analysis

In order to know the crystalline structures in isolated and extruded starches, X-ray diffraction pattern of the isolated starches and extruded starches were studied, the samples place into a Rigaku diffractometer (model Ultima IV, TX-USA) equipped with a D/tex ultra-detector (operated with 35 kV and 15 mA). By using CuKα1 radiation (=1.5406 Å), the diffraction pattern was obtained from 5 to 70° (2 scale) with a step size of 0.02°. Finally, using the Laue law “nλ = 2dsin(θ)”, it was calculated the d spacing of the diffracted peaks. In which, λ represents the CuKα1 radiation (1.5406 Å), d means the interplanar distance, and θ correspond to the haft 2θ angle for each peak.

2.5. Thermal Properties

Utilizing a differential scanning calorimetric (DSC 142 Mettler Toledo, model 821, Greifensee, Switzerland), evaluated the thermal properties of the isolated and extruded starches. 0.5 g of the sample was adjusted to 60% of moisture and held for 30 min before the test. Subsequently, 10 mg of sample was placed into an aluminum standard pan (40 μL) and sealed. The pan was submitted to a heating ramp from 30 to 130 °C, with a heating rate of 10 °C/min [10]. From the obtained thermogram, it was evaluated the onset (T0), peak (Tp), and final (Te) temperature, as well as the enthalpy (ΔH) from both the gelatinization and the amylose-lipid fusion endotherms.

2.6. Viscosity Profile

The viscosity profile of the isolated starches and extruded starches was assessed using a rheometer Anton Paar (model MCR 101, St Albans, UK). In short, 1.5 g of the sample was mixed with 19.5 mL of distilled water and subjected to a heating/cooling ramp. The ramp consisted of heating the sample from 50 to 92 °C (5.6 °C/min), held at 92 for 5 min and then cooled to 50 °C (5.6 °C/min) [11]. The data were finally expressed as pasting temperature (Tp), initial (Vi), maximum (Vmax), minimum (Vmin), and final viscosity (Vf). A triplicate carried out each measurement.

2.7. Resistant Starch Content

The quantification of the resistant starch content in the isolated starches and extruded starches was carried out by using the Megazyme International kit “K-RSTAR” (Wicklow, Ireland), following the certified methods of the AOAC 2002 (method 2002.02) and AACC (2001) (method 32-40.01).

2.8. Infrared Spectroscopy

Using an IR spectrometer (Perkin Elmer model Spectrum Two, Waltham, MA, USA) with ATR (using a Diamond/ZnSe crystal), the IR spectra of isolated and extruded starches were obtained. The IR spectra were acquired from 600 to 4000 cm−1.

2.9. Experimental Design and Statistical Analysis

It was used a completely randomized experimental design, in which the sources of variation were the type of starch (rice or potato) and the concentration of oleic acid (0%, 5% and 10%). Finally, the data were analyzed by using an ANOVA with means comparison by the Tukey’s test.

3. Results and Discussions

3.1. Morphological Analysis

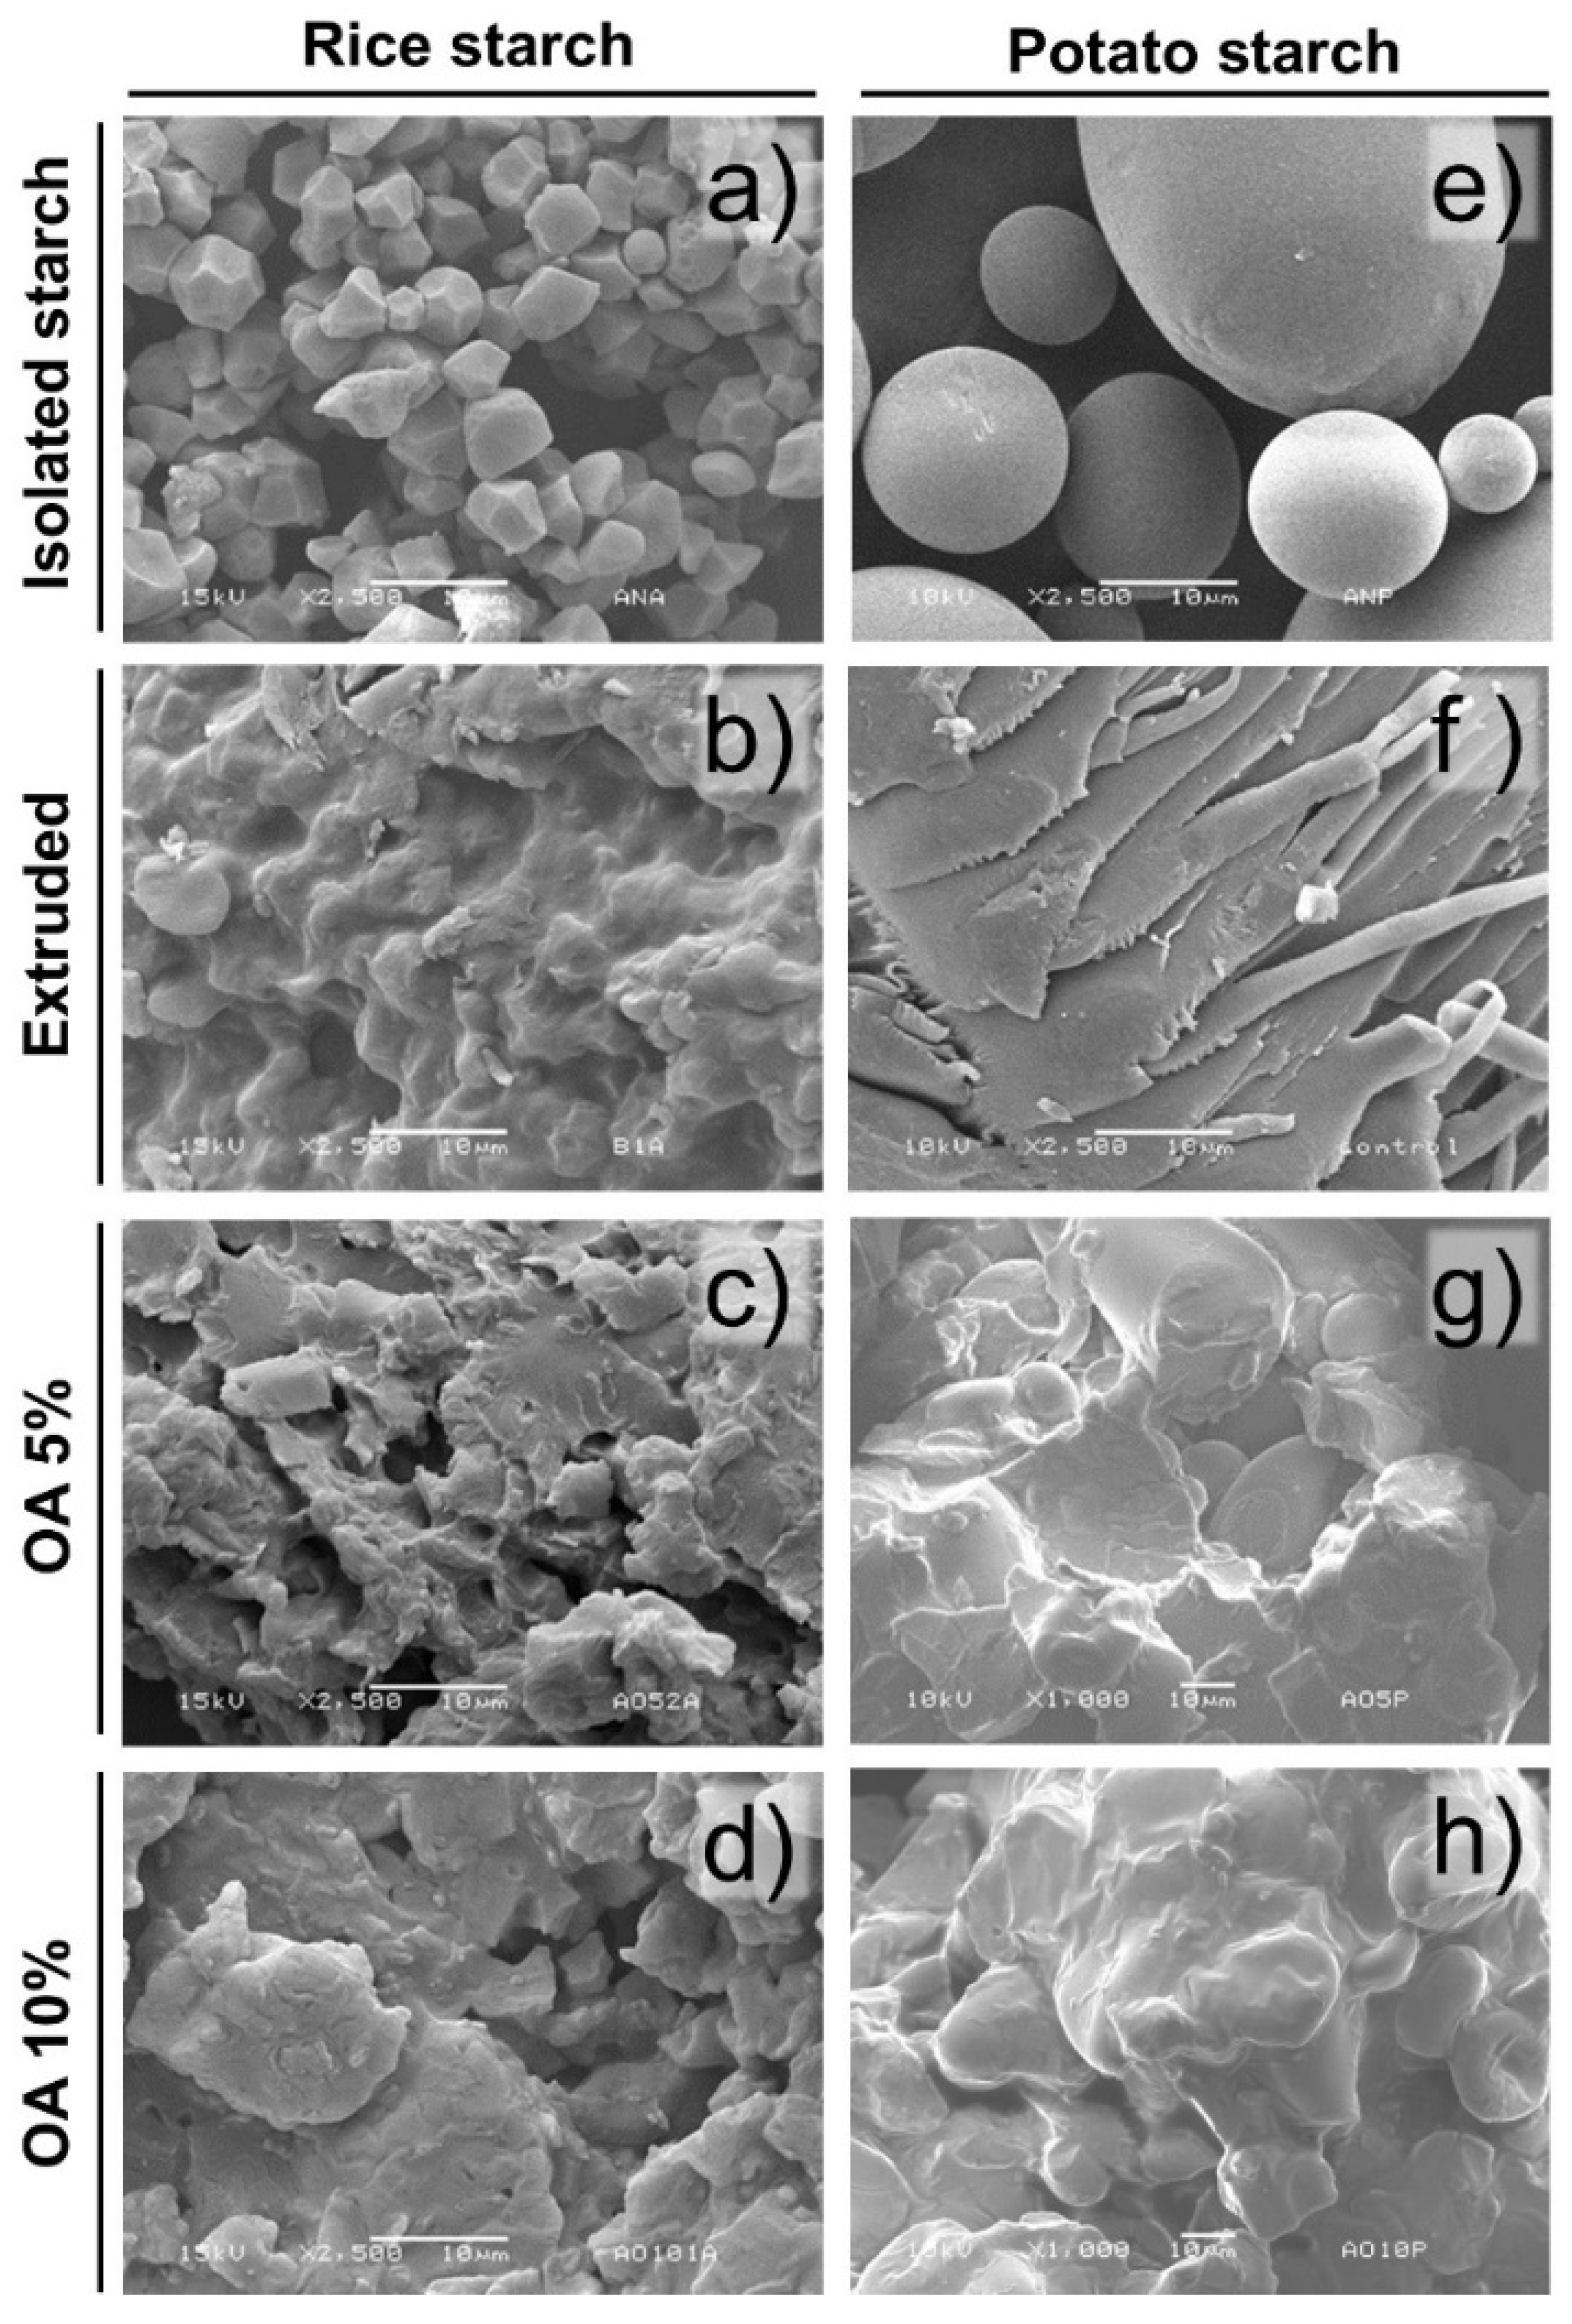
Figure 1 shows the morphology of isolated starches extruded and extruded with 5% and 10% of oleic acid. The isolated rice and potato starches both showed structural integrity since they did not present ruptures or fissures. In that sense, isolated rice starch presented starch granules with polygonal shapes arranged in a packaged matrix with a low incidence of intergranular spaces (Figure 1a). These granules showed an average of 7 ± 1.94 μm, considered small granules, agreeing with the literature [12].
On the other hand, potato isolated starch was shown to have a semi-spherical structure (Figure 1e), constituted by two granule sizes 25.42 ± 5.01 μm and 76.28 ± 8.35 μm, suggesting a bimodal distribution. Likewise, these granules were arranged in a slightly loose matrix compared to rice starch. The results coincide with those reported for potato starch, where the presence of small semi-spherical granules (1 to 20 μm) and large granules (20 to 110 μm) has been observed [13].
Regarding the extruded starches, disruption of the granules was observed due to the high temperatures, pressure, moisture, and mechanical stress (shear) generated during processing. In that sense, the extruded rice starch (Figure 1b) showed a partial loss of the granular morphology, showing a matrix constituted by some integer starches embedded in a gelatinized starch matrix. Meanwhile, in extruded potato starch (Figure 1f), the extrusion process lost the granular structure obtaining a gelatinized starch matrix.
Regarding the starches extruded with oleic acid, a similar morphology was found in rice and potato (Figure 1c,g). These starch granules were partially destroyed and integrated into a granular fused matrix. Furthermore, some granules maintain their integrity. Remarkably, the extruded potato starch showed partial integrity of large granules, being observed displayed into the starch fusion matrix. The same tendency was observed in the extruded starches with 10% of oleic acid (Figure 1d,h). Regardless of the starch type, an apparent amorphous matrix involved the remanent starch granules. However, this may result from a water diffusion effect since smaller starch granules have a larger contact surface; therefore, increasing their probability of absorbing more water than large granules. Likewise, a coating of the starch granule can be generated during the extrusion with fatty acids, reducing shear friction and the ability of the granule to absorb water [10]. Moreover, rice starch showed more susceptibility to microstructure damage after extrusion, regardless of the oleic acid concentration used. The extrusion process generates damage in granules due to pressure, shear, and heat, which produces gelatinization in the presence of water [14].

3.2. X-ray Diffraction

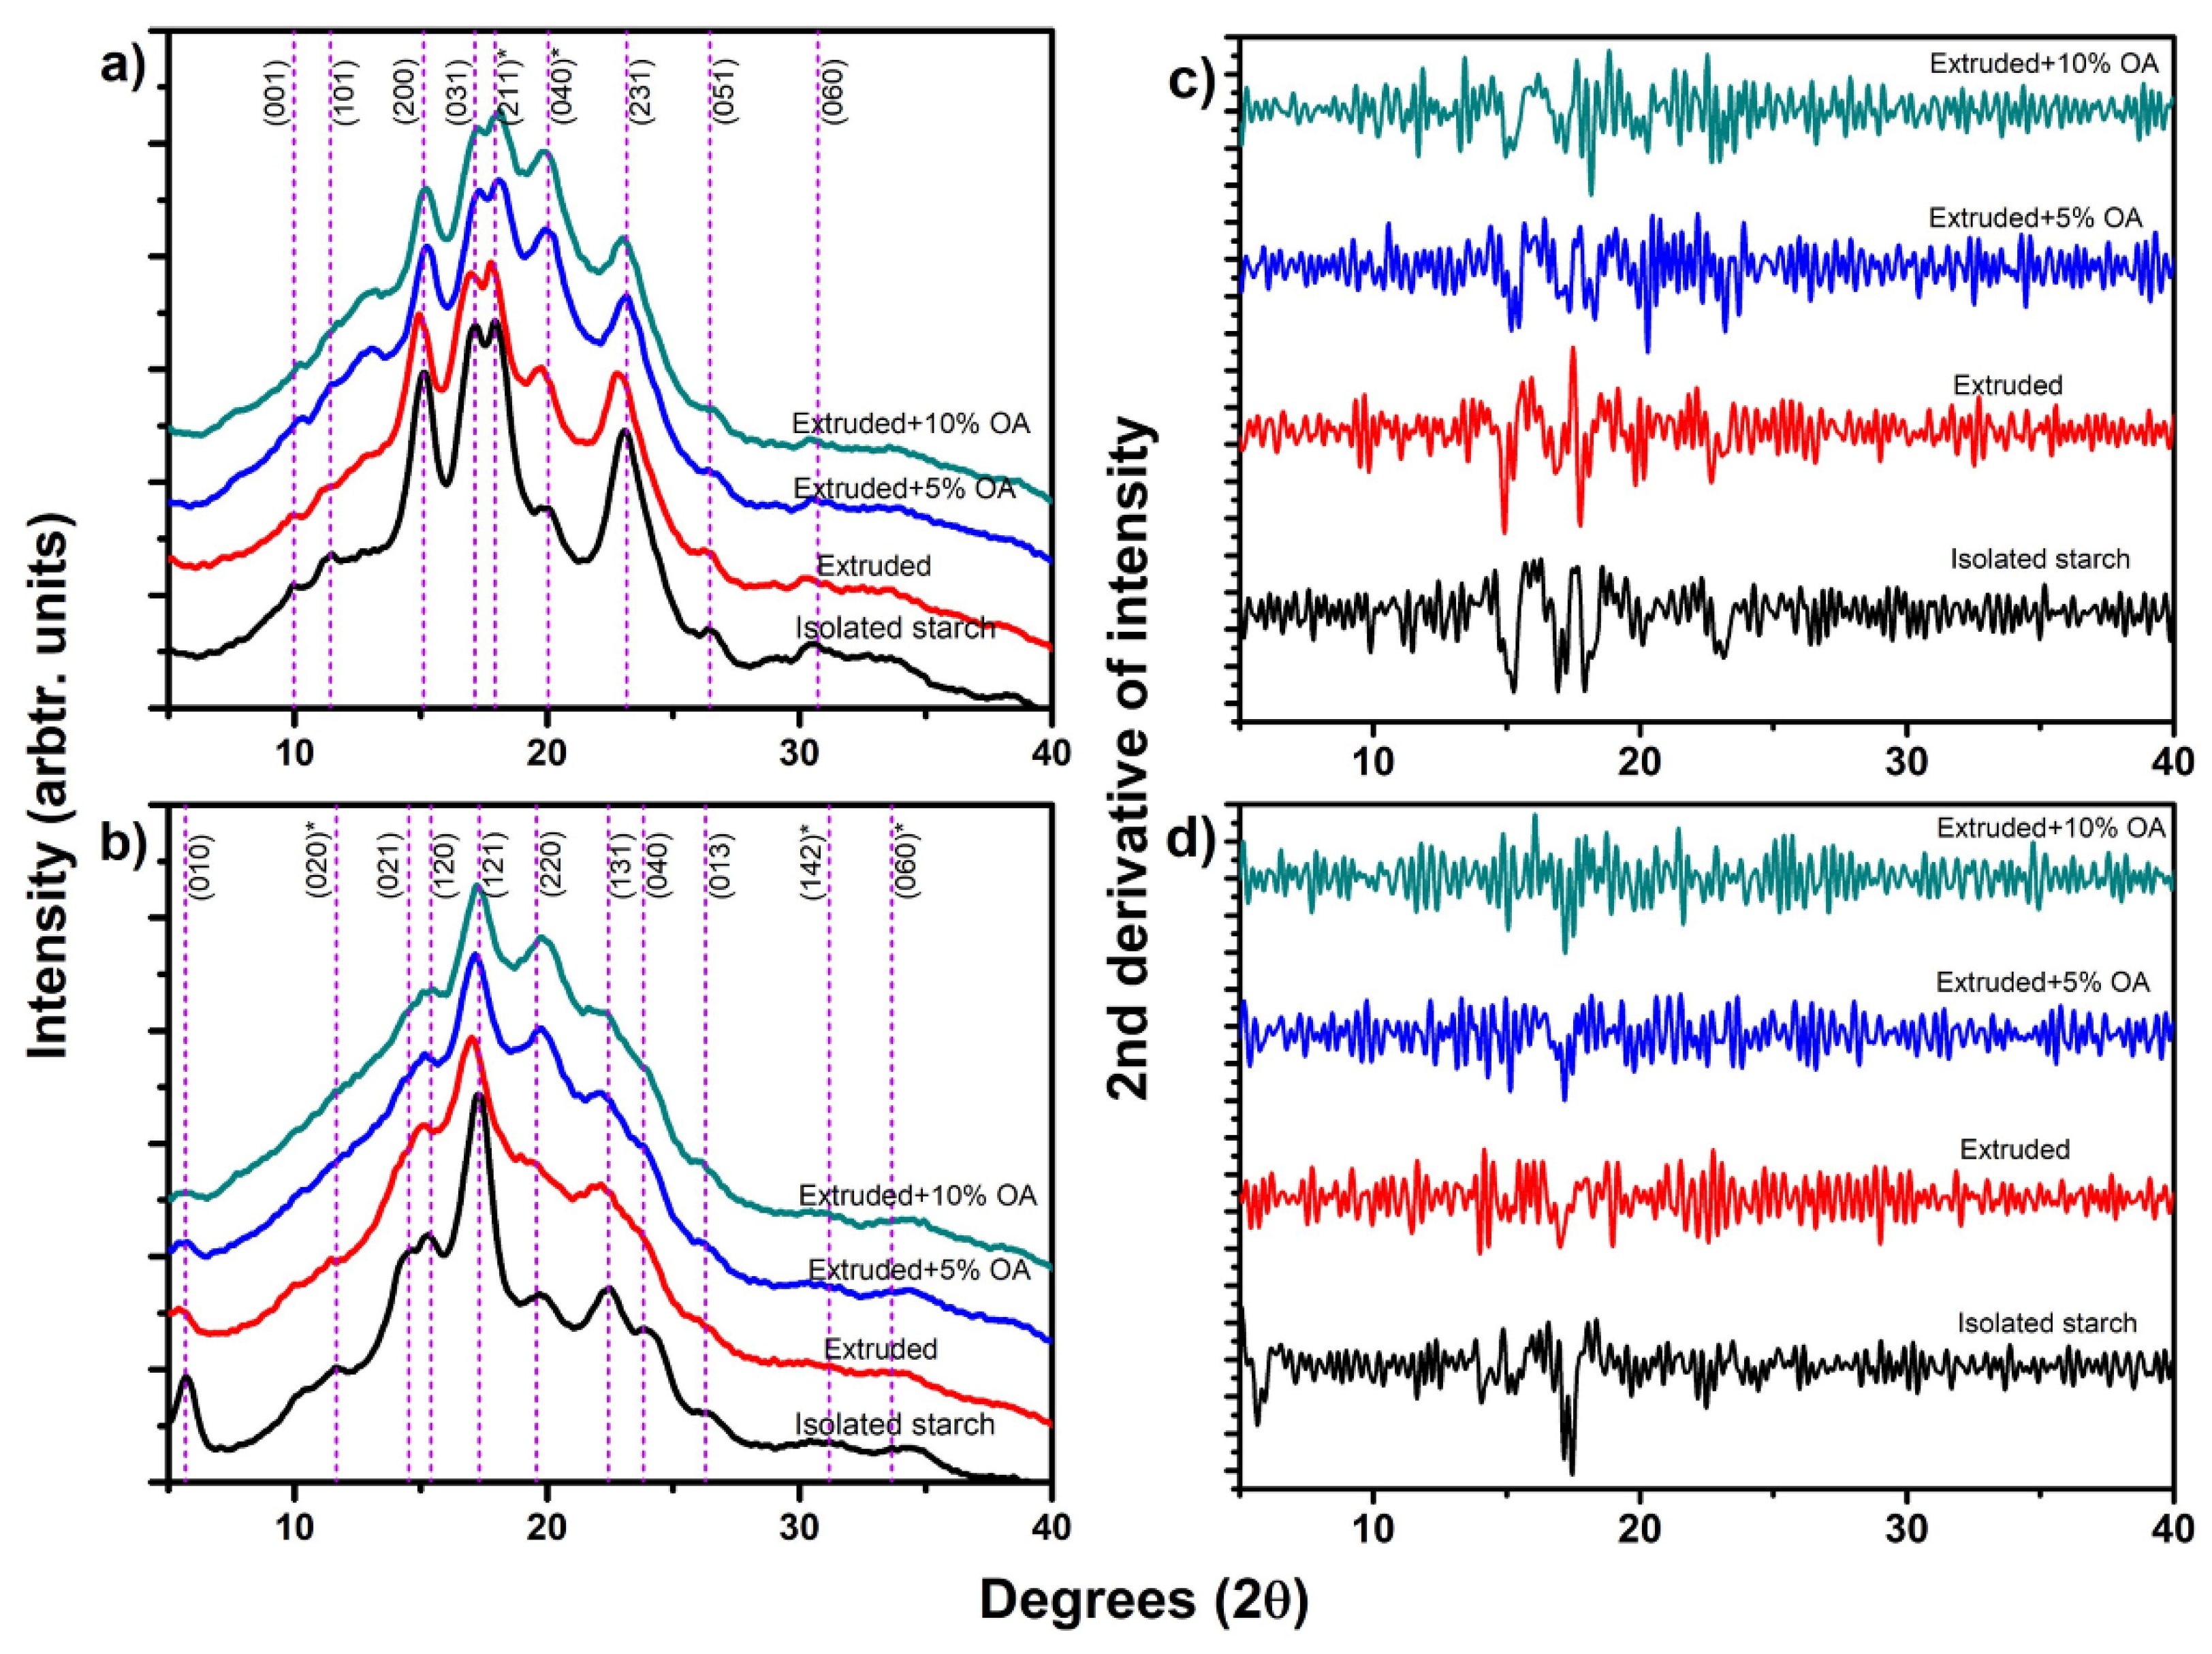
Figure 2a shows the X-ray diffraction pattern of isolated and extruded starches with oleic acid: rice starch (a) and potato starch (b). The dash lines in this figure correspond to the indexing of these crystalline structures [1]. The isolated rice starch showed a type-A starch with an orthorhombic crystalline structure [1]. For extruded rice starch (Figure 2a, red line), a slight shift to the left was observed at peaks (200), (031), (211), and (231), suggesting an increase in the interplanar distance after the extrusion process [10]. Meanwhile, when extruding rice starch with 5% and 10% of oleic acid (Figure 2a, blue and green line, respectively), an increase in the relative intensity was observed near to 13.6° and 19.9° (2θ scale), tending to be more sharped in extruded rice starch with 10% oleic acid. Regarding the rice extruded starches with and without oleic acid, a reduction in the relative intensity of peaks (200), (031), (211), and (231) were observed, produced by the crystal damage of the extrusion (Figure 2a).
Potato isolated starch (Figure 2b) displayed a type-B starch with a hexagonal crystalline structure. The dash lines in this figure correspond to the indexing of these crystalline structures [1,15]. After the extrusion process, a reduction of the relative intensity of the peaks of potato starch was observed for the (010), (021), (131), and (013) directions (Figure 2b). This reduction in the relative intensity has been associated with partial damage during gelatinization and disruption of the starch granules due to the temperature, shear, and pressure reached during extrusion [16]. As for the potato extruded starches with and without oleic acid, a reduction of the relative intensity of potato starch was observed at peaks located at (010), (021), (131), and (013) (Figure 2b). Therefore, suggesting a loss in the relative crystallinity of the starch compared to the isolated one. This relative intensity reduction is associated with the gelatinization and disruption of the starch granule due to the temperature, shear, and pressure reached during extrusion [16]. All these results agree with the observations in the microstructure of extruded potato starch (Figure 1). Furthermore, a slight left shift was observed in peaks (010), (121), and (131), suggesting an increase in the interplanar distance of the crystalline structure as a result again of the tangential force. These same shifts were observed by Cervantes-Ramírez et al. [10] in the diffraction pattern of extruded corn starch with oleic acid, attributable to the modification of the crystalline structure.
As shown in Figure 2a,b, both isolated and extruded starches had a similar diffractogram with slight reductions in the relative intensity. Contrary, extruded starches with oleic acid showed an increase in certain Bragg’s angles, which does not correspond to the isolated X-ray patterns.
Therefore, the second derivative criteria (Figure 2c,d) was used to identify these changes accurately. In that sense, Table 1 shows the Bragg’s angles (2θ) found in rice and potato extruded starches with oleic acid (OA), excluding those peaks that directly corresponded to the isolated crystalline structure. Table 1 also shows the direct calculation of the d spacing (interplanar distance) of each peak determined by using Laue’s law.
The rice starch extruded with 5% OA (Figure 2c) showed an increase in the relative intensity of the peaks near 18.30 (4.8437 Å), 20.3 (4.3708 Å), and 23.70° (3.7509 Å) 2θ. Whereas rice starch extruded with 10% OA showed an increase in peaks at 11.70 (7.5571 Å), 13.26 (6.6713 Å), 14.96 (5.9168 Å), and 20.28° (4.3751 Å) in 2θ scale. According to the d spacings of these peaks and considering those d spacing of the orthorhombic crystalline structure indexed by Rodríguez-García et al. [1], the peaks at 14.96 (10% OA), 18.30 (5% OA), 20.28 (10% OA), and 23.70° (5% OA) found in rice extruded starches, directly corresponded to the peaks of the directions (121), (220), (040), and (132) with an RSD of 0.37, 0.27 and 0.60%, respectively. In the case of the peaks at 11.70 and 13.26° (2θ) found in rice starch extruded with 10% OA, these peaks are not found in an orthorhombic structure. However, the half d value (3.779 Å and 3.336 Å, respectively) corresponded to the hkl directions (132) and (051), with an RSD of 0.79 and 0.09%, respectively.
On the other hand, the potato starch extruded with 5% OA (Figure 2d) increased the relative intensity of 12.34 (7.1665 Å), 13.16 (6.7218 Å), and 22.5° (3.9447 Å) 2θ scale. Meanwhile, extruded potato starch with 10% OA showed peaks at 7.72 (11.4418 Å), 15.04 (5.8855 Å), 17.20 (5.1510 Å), 18.92 (4.6864 Å), 21.62 (4.1068 Å), and 25.24° (3.5254 Å) 2θ. Applying the same analysis, the peaks at 22.52 (5% OA), 15.04 (10% OA), and 17.20 (10% OA) directly correspond to the hkl directions (040), (120), and (121) of the hexagonal crystalline structure, with an RSD respect to the reported value [1] of 0.54, 0.39, and 0.15%, respectively. Meanwhile, peaks at 7.72 (10% OA), 12.34 (5% OA), 13.16 (5% OA), 18.92 (10% OA), 21.62 (10% OA), and 25.24° (10% OA) does not belong to a hexagonal crystalline structure. However, the half d value (5.7209, 3.5834, 3.3609, 2.3432, 2.0534, and 1.7627 Å, respectively) correspond with the hkl directions (120), (032), (013), (161), (442), and/(452) of the hexagonal structure [1], with an RSD of 5.72, 3.58, 3.36, 2.34, 2.05, and 1.76%, respectively.
It is known that the X-ray pattern of starch depends directly on its crystalline structure, being the lamella its main morphological component. The behavior observed in rice and potato extruded starches without OA suggest partial destruction of the crystalline structure. However, the d spacings and the RSD found in extruded starches with OA may suggest a lamellae growth due to the thermomechanical processing generated during the extrusion process a possible interaction of lamellae with the OA. In that sense, the OA could be working as a stabilizer agent of the lamellae structure, being more evident in the potato starch extruded with 10% OA due to the number of peaks differing with the isolated hexagonal crystalline structure. The above could be due to the large number of water molecules presented in the hexagonal structure, where the extrusion process loses part of these molecules. Therefore, the lipid can be placed into the helical structure, stabilizing this. However, detailed research is needed to understand the mechanism behind this phenomenon accurately.

3.3. Thermal Properties

Table 2 shows the thermal properties of isolated, extruded, and extruded starches with 5% and 10% oleic acid. Regarding the rice starch, the gelatinization was found between 64.4 and 76.5 °C, with an enthalpy (ΔH) of 1.77 ± 0.04 J/g for isolated starch. It has been reported temperature ranges for rice starch gelatinization ranging from 57 to 97 °C, and enthalpy of up to 1 J/g, depending on the variety and the amylose/amylopectin ratio [17]. After the extrusion process, the gelatinization enthalpy was reduced to 1.59 ± 0.03 J/g, indicating a partial gelatinization of the starch due to the pressure, temperature, and shear reached the process. Meanwhile, in extruded starches with 5% and 10% of oleic acid, the gelatinization enthalpy was reduced to 0.64 ± 0.01 and 0.96 ± 0.02 J/g, a higher enthalpy using 10% of oleic acid.
As for the potato starches, the gelatinization for isolated starch was found between 61.9 and 68.5 °C, with an enthalpy of 2.13 ± 0.03 J/g (Table 2). After extrusion, the gelatinization enthalpy decreased to 1.80 ± 0.04 J/g, suggesting partial starch gelatinization and crystal damage. Finally, in potato starch extruded with oleic acid, the gelatinization enthalpy decreased to 0.97 ± 0.02 and 1.56 ± 0.03 J/g for 5% and 10% OA, showing a greater enthalpy when using 10% of oleic acid.
The enthalpy reduction is mainly related to damage of the starch granules and intermolecular bonds rupture by the temperature, pressure, and mechanical work applied during the extrusion, modifying its physical properties [18]. The extruded starch showed partially gelatinized granules (Figure 1), and loss of its relative crystallinity (Figure 2), producing an amorphous material that requires less energy to reach complete gelatinization. It means that the gelatinization in starch is closely related to the nanocrystal solvation (orthorhombic and hexagonal).
Additionally, it was observed some variations in the initial (T0), peak (Tp), and final temperature (Te) of the gelatinization, depending on the treatment. Such behavior is attributed to the fact that the gelatinization temperature is influenced by intrinsic factors such as amylose content, distribution of amylopectin chains, lipid-amylose complexes, and crystal structures [19]. Likewise, it has been reported that the parameters of T0, Tp, Te, and ΔH are influenced by the architecture of the crystalline regions [20]. Such intrinsic crystallinity of the granules can be altered and diminished during gelatinization through the extrusion process to a more amorphous state [21]. These can explain the variations observed in the gelatinization temperatures. Our results show that the crystallinity changes due to the extrusion produce damage in the crystal, but not necessarily a more amorphous state. The gelatinization enthalpies hint that there are some starch granules without gelatinization in extruded starches with 10% of oleic acid, being more marked in rice starch. The above agrees with what was observed in the microstructure (Figure 1, 10% OA).
On the other hand, the thermogram of extruded starches with 5% and 10% of oleic acid showed a second transition between 101 to 120 °C, which is typical of the fusion of the type IIa amylose lipid complexes. As for the rice starch, this transition was observed in extruded starch with 5% oleic acid, with an enthalpy of 0.14 ± 0.03 J/g. The potato starches extruded with 5% and 10% oleic acid showed amylose-lipid complex type IIa, with an enthalpy of 0.14 ± 0.01 and 0.91 ± 0.02 J/g for 5% and 10% oleic acid. The above indicated a more significant interaction between potato amylose and oleic acid. In that sense, it has been reported that short and medium-chain fatty acids (<12 carbon units) demonstrate low susceptibility to the formation of complexes with amylose since these can easily precipitate in aqueous solutions [22]. For our study, the samples were extruded with oleic acid, constituted by 18 carbon units, so it is more probable the amylose-lipid interaction. In that sense, the amylose-lipid complex’s dissociation energy in potato extruded starches increased as the OA concentration rose. Such behavior may be related to the d spacing displacement compared to the isolated hexagonal structure (Table 1), where oleic acid-amylose complexes could be one of the responsible factors for this displacement stabilization of the crystalline lamellae.

3.4. Viscosity Profiles

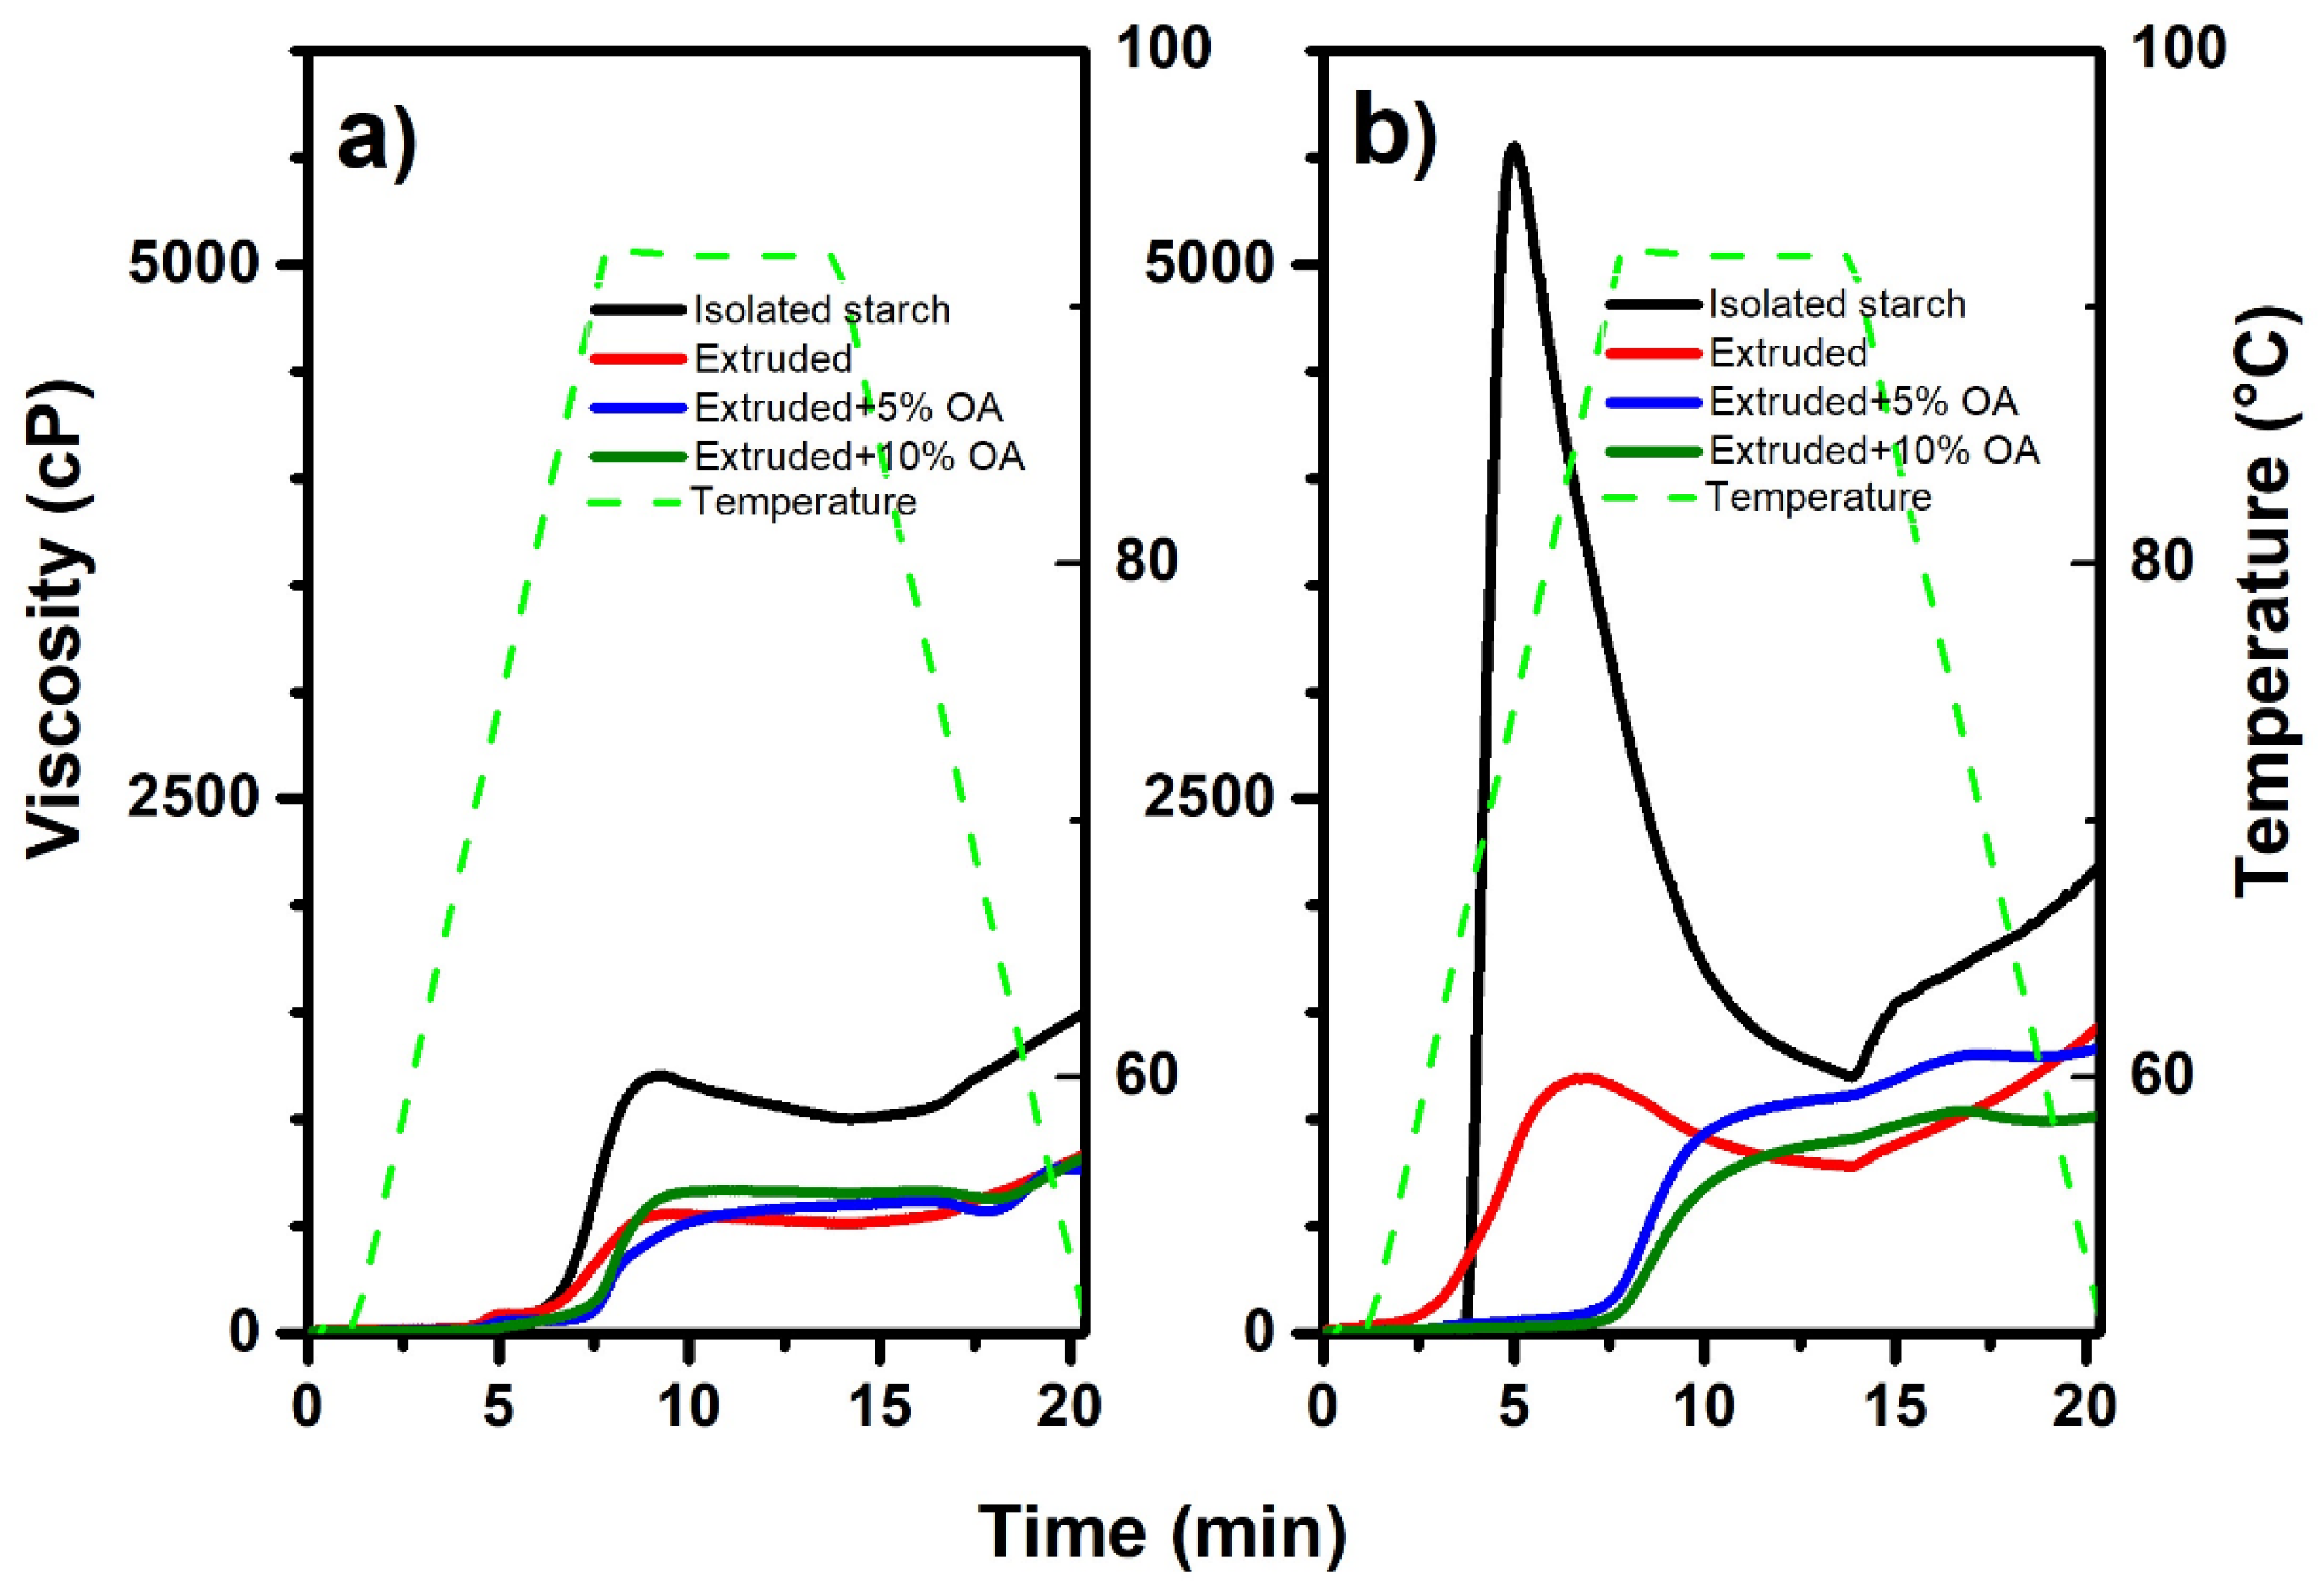
Figure 3 shows the viscosity profile of isolated, extruded, and extruded starches with 5% and 10% of oleic acid. Figure 1a,b shows the viscosity profile of rice and potato starch treatments, respectively. The extrusion process showed a significant effect (p < 0.05) on the viscosity profile, regardless of the source. In that sense, in rice extrudates, the maximum viscosity was reduced from 1523 ± 26 cP (isolated) to 850 ± 15 cP (extruded) (Figure 3a). The same reduction was observed regarding the potato starch treatments (Figure 3b), starting from 5499 ± 78 cP in isolated and decreasing to 1425 ± 24 cP when extruded. The above may result from heat treatment and mechanical work (shearing) that the starch granules were subjected to during extrusion, which damaged their structural integrity, causing the disruption of inter and intramolecular hydrogen bonds, hindering their ability to absorb water and gelling [21]. Consequently, low viscosities at the maximum peak are a characteristic of extruded starches, corresponding to the results obtained, where it seems that partial hydrolysis of the granules has occurred (as observed in Figure 1 and Figure 2 and Table 2).
The paste properties of an extruded starch have been demonstrated to be dependent on the processing conditions. Therefore, sample moisture, temperature, and processing time significantly influence the properties of starches. In that sense, higher temperatures and moisture favor the gelatinization of starch [21].
Regarding rice starches extruded with 10% oleic acid, the maximum viscosity was statistically (p < 0.05) equal to that of extruded starch. In contrast, the use of 5% gives the lowest viscosity with 740 ± 30 cP, indicating that with 5% oleic acid, rice starch presents more significant damage, which can be due to friction between granules, temperature, and pressure reached in the extrusion. On the other hand, extruded potato starch had the highest viscosity with 5% oleic acid (1322 ± 23 cP). These differences between rice and potato starch behavior can be mainly attributed to the potato chemical characteristics of the starch. In that sense, it has been reported that potato starch has phosphate groups distributed mainly along amylopectin and amylose linked in the C-3 and C-6 positions of glucose units. Phosphorylated starches, such as potato starch, have been shown to have a high hydration capacity and form highly viscous clear pastes [23]. Therefore, it explains the differences between the low viscosity profile observed in isolated rice and the high viscosity profile of potato isolated starch. During the extrusion with 10% oleic acid, part of the fatty acid could be interacting with both phosphate groups and amylose, thus reducing its capacity to absorb water, obtaining a less viscous gel.
Interestingly, both potato and rice starch, when extruded with 5% and 10% oleic acid, showed a slight increase in viscosity by keeping a stable temperature of 92 °C, indicating more thermal stability. D’Silva et al. [7] and Cervantes-Ramírez et al. [10] had previously reported this unusual behavior in teff and corn starches added with stearic and oleic acid; suggesting that this increase in viscosity was partly due to an amylose interaction with the added fatty acid.
The final viscosity and pasting temperatures differed depending on the type of starch and the oleic acid concentration used in the extrusion. In that sense, the final viscosity of extruded rice starches with and without oleic acid behaved statistically equal (p < 0.05), ranging from 740 to 850 cP. In contrast, potato starch, both extruded and extruded starch with 5% oleic acid was statistically equal (p < 0.05), with an average of 1373 ± 73 cP. Whereas potato starch extruded with 10% oleic acid showed the lowest final viscosity (964 ± 78 cP). Regarding the pasting temperature, it was observed a tendency to increase according to the oleic acid concentration, where the extruded potato starch with 10% oleic acid exhibited the highest temperature with 87.19 ± 0.1 °C, with an increase of ~20 ° compared to the isolated starch (64.4 ± 0.2 °C). Multiple factors may be responsible for the rise in pasting temperature, such as the presence of ungelatinized starches (as shown in Figure 1g,h). However, amylose inhibits the water absorption capacity of starches by forming lipid complexes during thermal processing, resulting in low peak viscosity and higher pasting temperature [24]. The above is consistent with the thermal properties, where the potato starch extruded with 10% oleic acid showed the highest fusion enthalpy of the amylose lipid complex type IIa (Table 2). In that sense, this behavior may be associated with the crystalline structure changes observed in extruded potato starch with 10% OA (Table 1), where the stabilized crystalline lamellae could be needing more energy to disrupt and the subsequent paste formation.
The viscosity profiles found showed that the presence of oleic acid decreases the water absorption capacity of starches, leading to a decrease in the viscosity profile. Likewise, according to the thermal properties (Table 2) and pasting temperatures, this change in the viscosity profile could be due to an amylose-lipid complex formation.

3.5. Resistant Starch Content

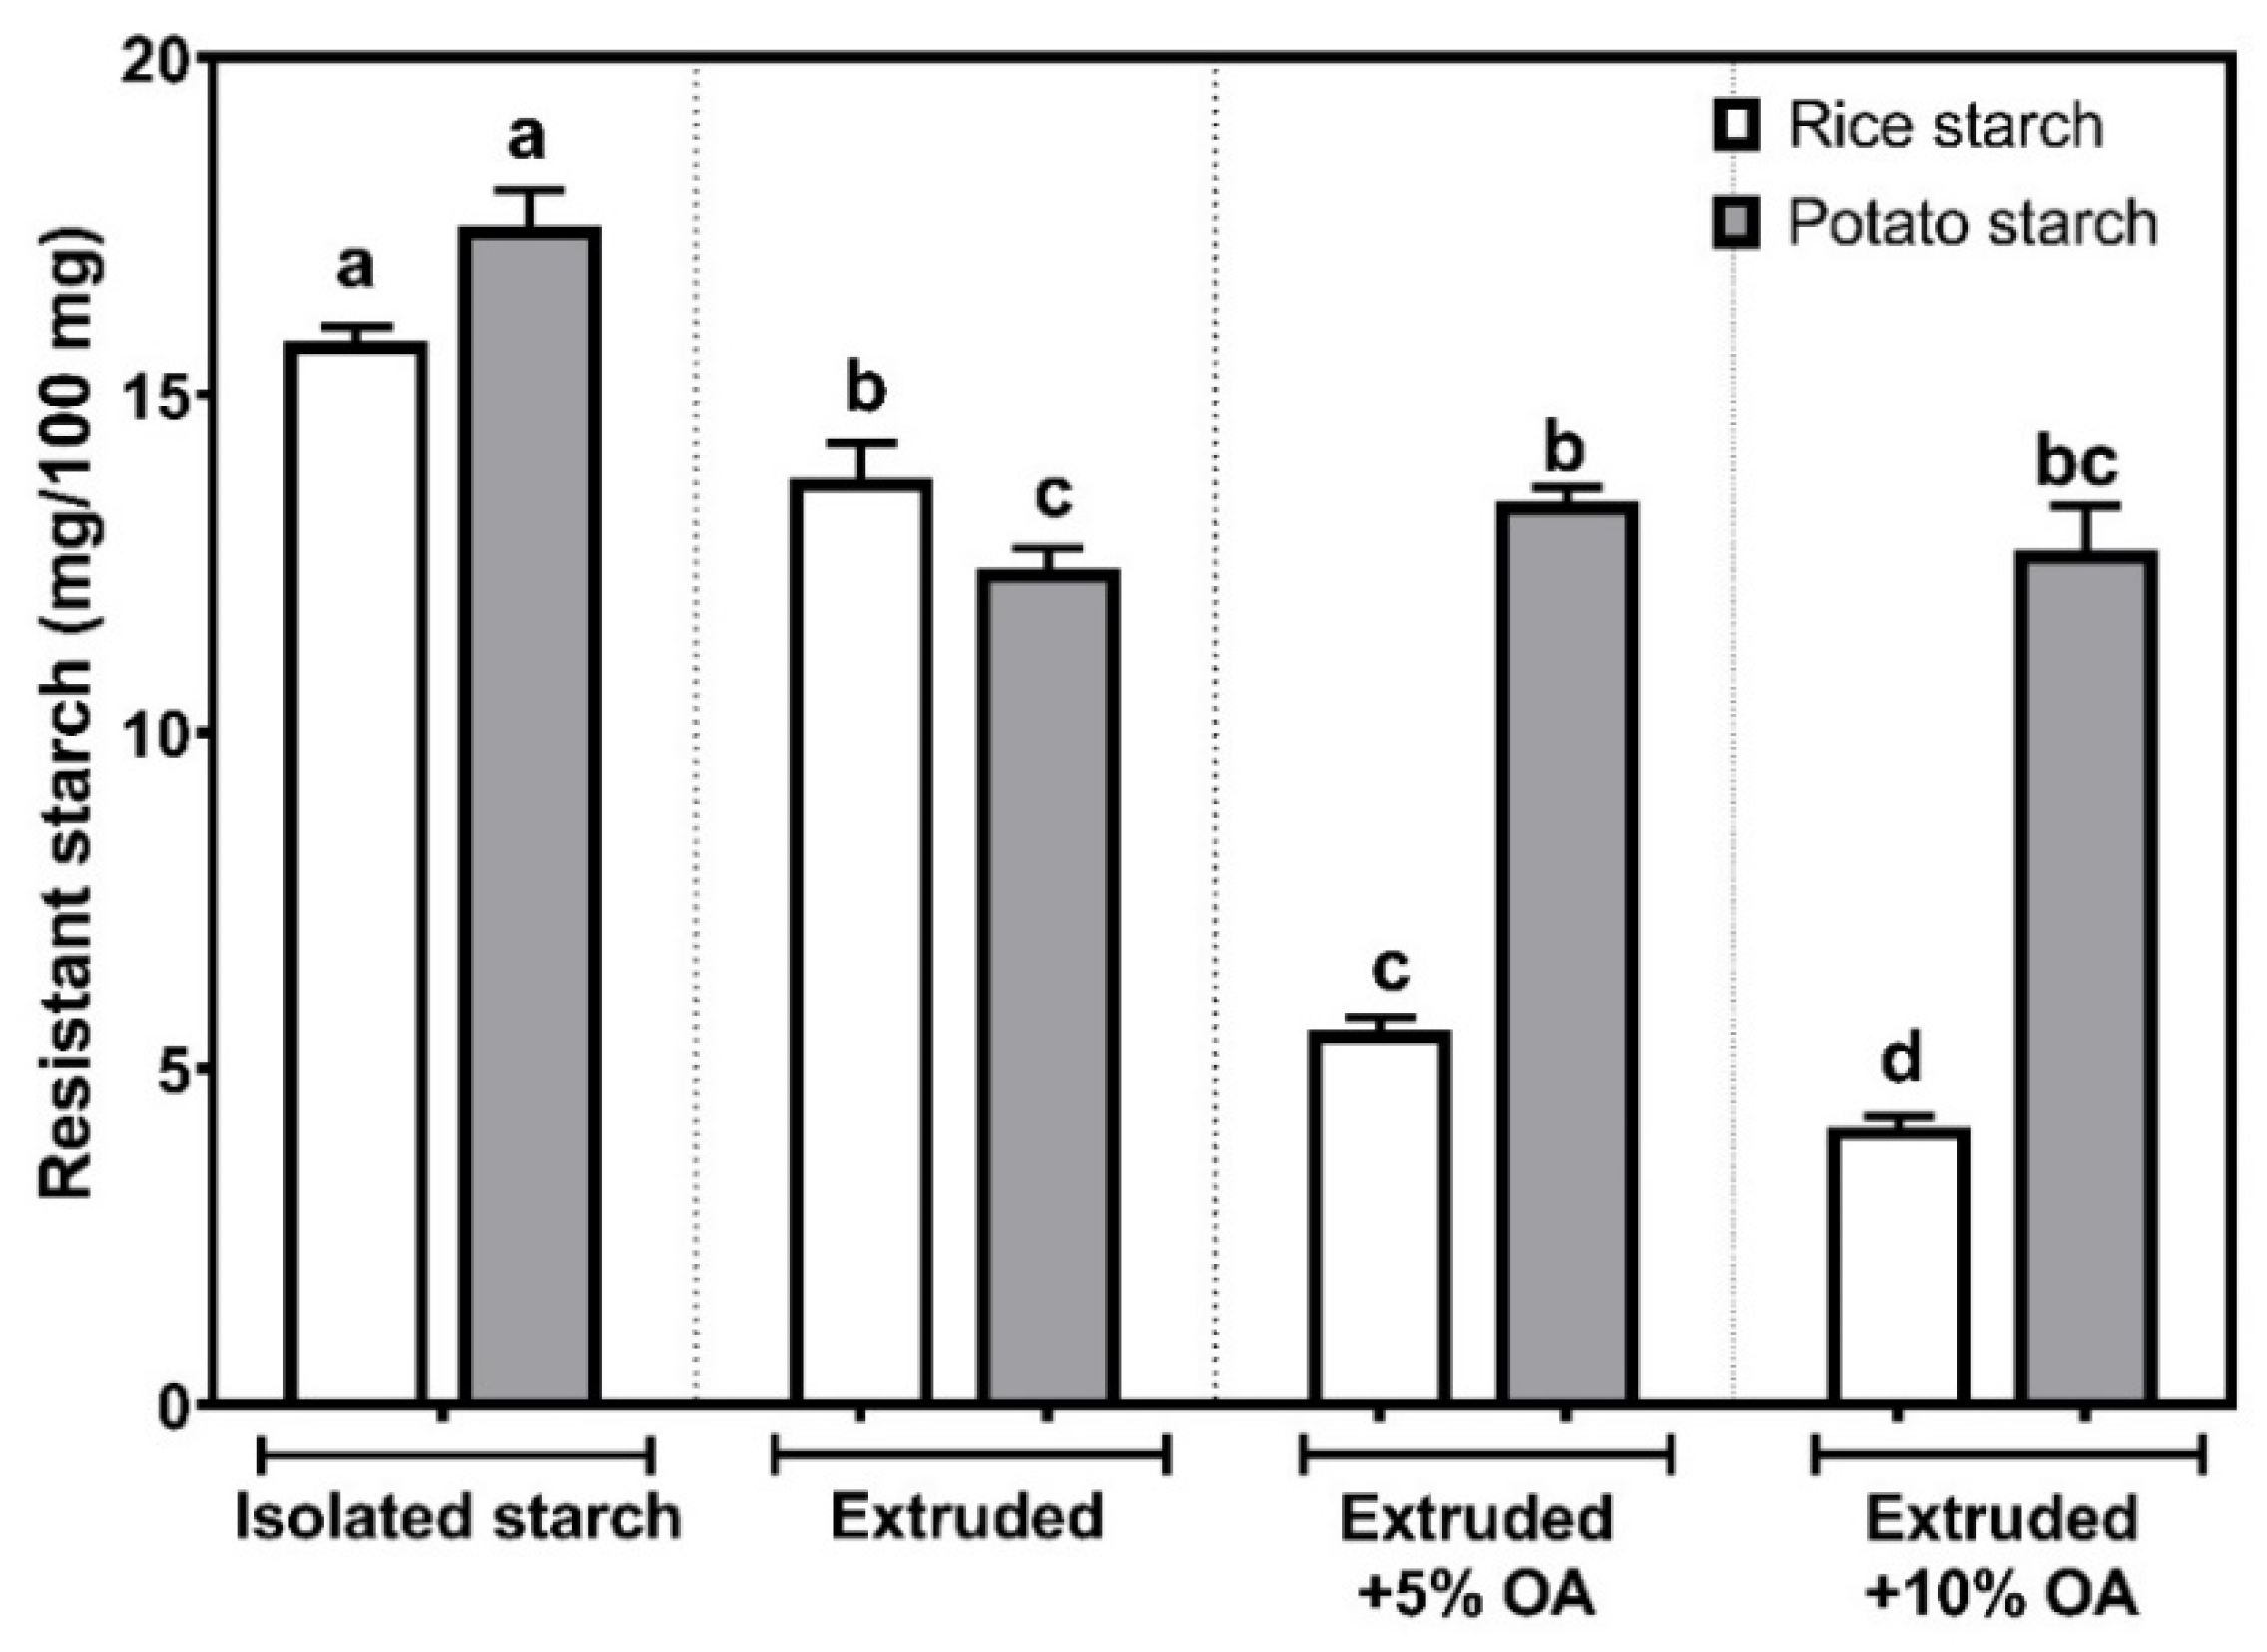
Figure 4 shows the resistant starch content (RS) in isolated, extruded, and extruded starches with 5% and 10% of oleic acid (OA). In isolated rice starch, the RS showed a content of 15.80 ± 0.21 mg/100 mg. The above agrees with 15.5% of resistant starch found in isolated rice by Zheng et al. [25]. On the other hand, a significant reduction (p < 0.05) in the RS was observed after the extrusion process, reaching 13.77 ± 0.51 mg/100 mg. Whereas, after being extruded with 5% and 10% oleic acid, the RS was reduced to 5.56 ± 0.04 and 4.14 ± 0.07 mg/100 mg.
Regarding potato starch treatments, isolated starch presented a RS of 17.51 ± 0.54 mg/100 mg, consistent with the broad range of 2 to 69% reported [26,27]. On the other hand, in potato starch extruded without oleic acid, the RS decreased to 12.41 ± 0.31, being the lowest value (p < 0.05) among potato starches, representing a reduction of about 29%, compared to the isolated one. After extruding potato starch with oleic acid, no statistical differences (p < 0.05) were observed between the concentration, ranging from 12.69 to 13.41 mg/100 mg.
Overall, it was observed that the extrusion process significantly reduces (p < 0.05) the resistant starch content in rice, reducing it up to 74% when extruded with 10% oleic acid, compared with the isolated one. The above may be due to the loss of the granular structure observed in the microstructure after the extrusion process (Figure 1, 10% OA). Likewise, this starch showed the lowest gelatinization enthalpy, lowest maximum viscosity, and the lowest final viscosity (Figure 3a). Furthermore, rice starch extruded with 10% oleic acid did not dissociate the amylose-lipid complex type IIa transition (Table 2). Hence, there was no affinity for rice starch to form complexes with oleic acid during extrusion, reducing its crystallinity and resistant starch content.
In the case of potato starches, it was observed that the starch extruded with oleic acid showed up to 8% more resistant starch content than that found in the extruded starch without oleic acid. It is important to highlight that potato starch extruded with oleic acid showed the highest pasting temperatures (Figure 3b) and the highest melting enthalpies of the amylose-lipid complexes type IIa (Table 2). The above may suggest that the 8% increase in RS in extruded potato starch with oleic acid is due to the formation of amylose-lipid complexes during thermal processing. Furthermore, it should be noted that this RS was only formed in a hexagonal structure of tuber starch, contrary to what happened in the orthorhombic structure of the cereal, where the AR content decreased. As shown in the X-ray, the potato starch promoted the lamellae crystalline growth due to amylose-lipid complexation during the extrusion with OA, generating a more thermally stable starch. Therefore, this complexation could be explaining the high RS contents observed in potato starch extruded with OA.

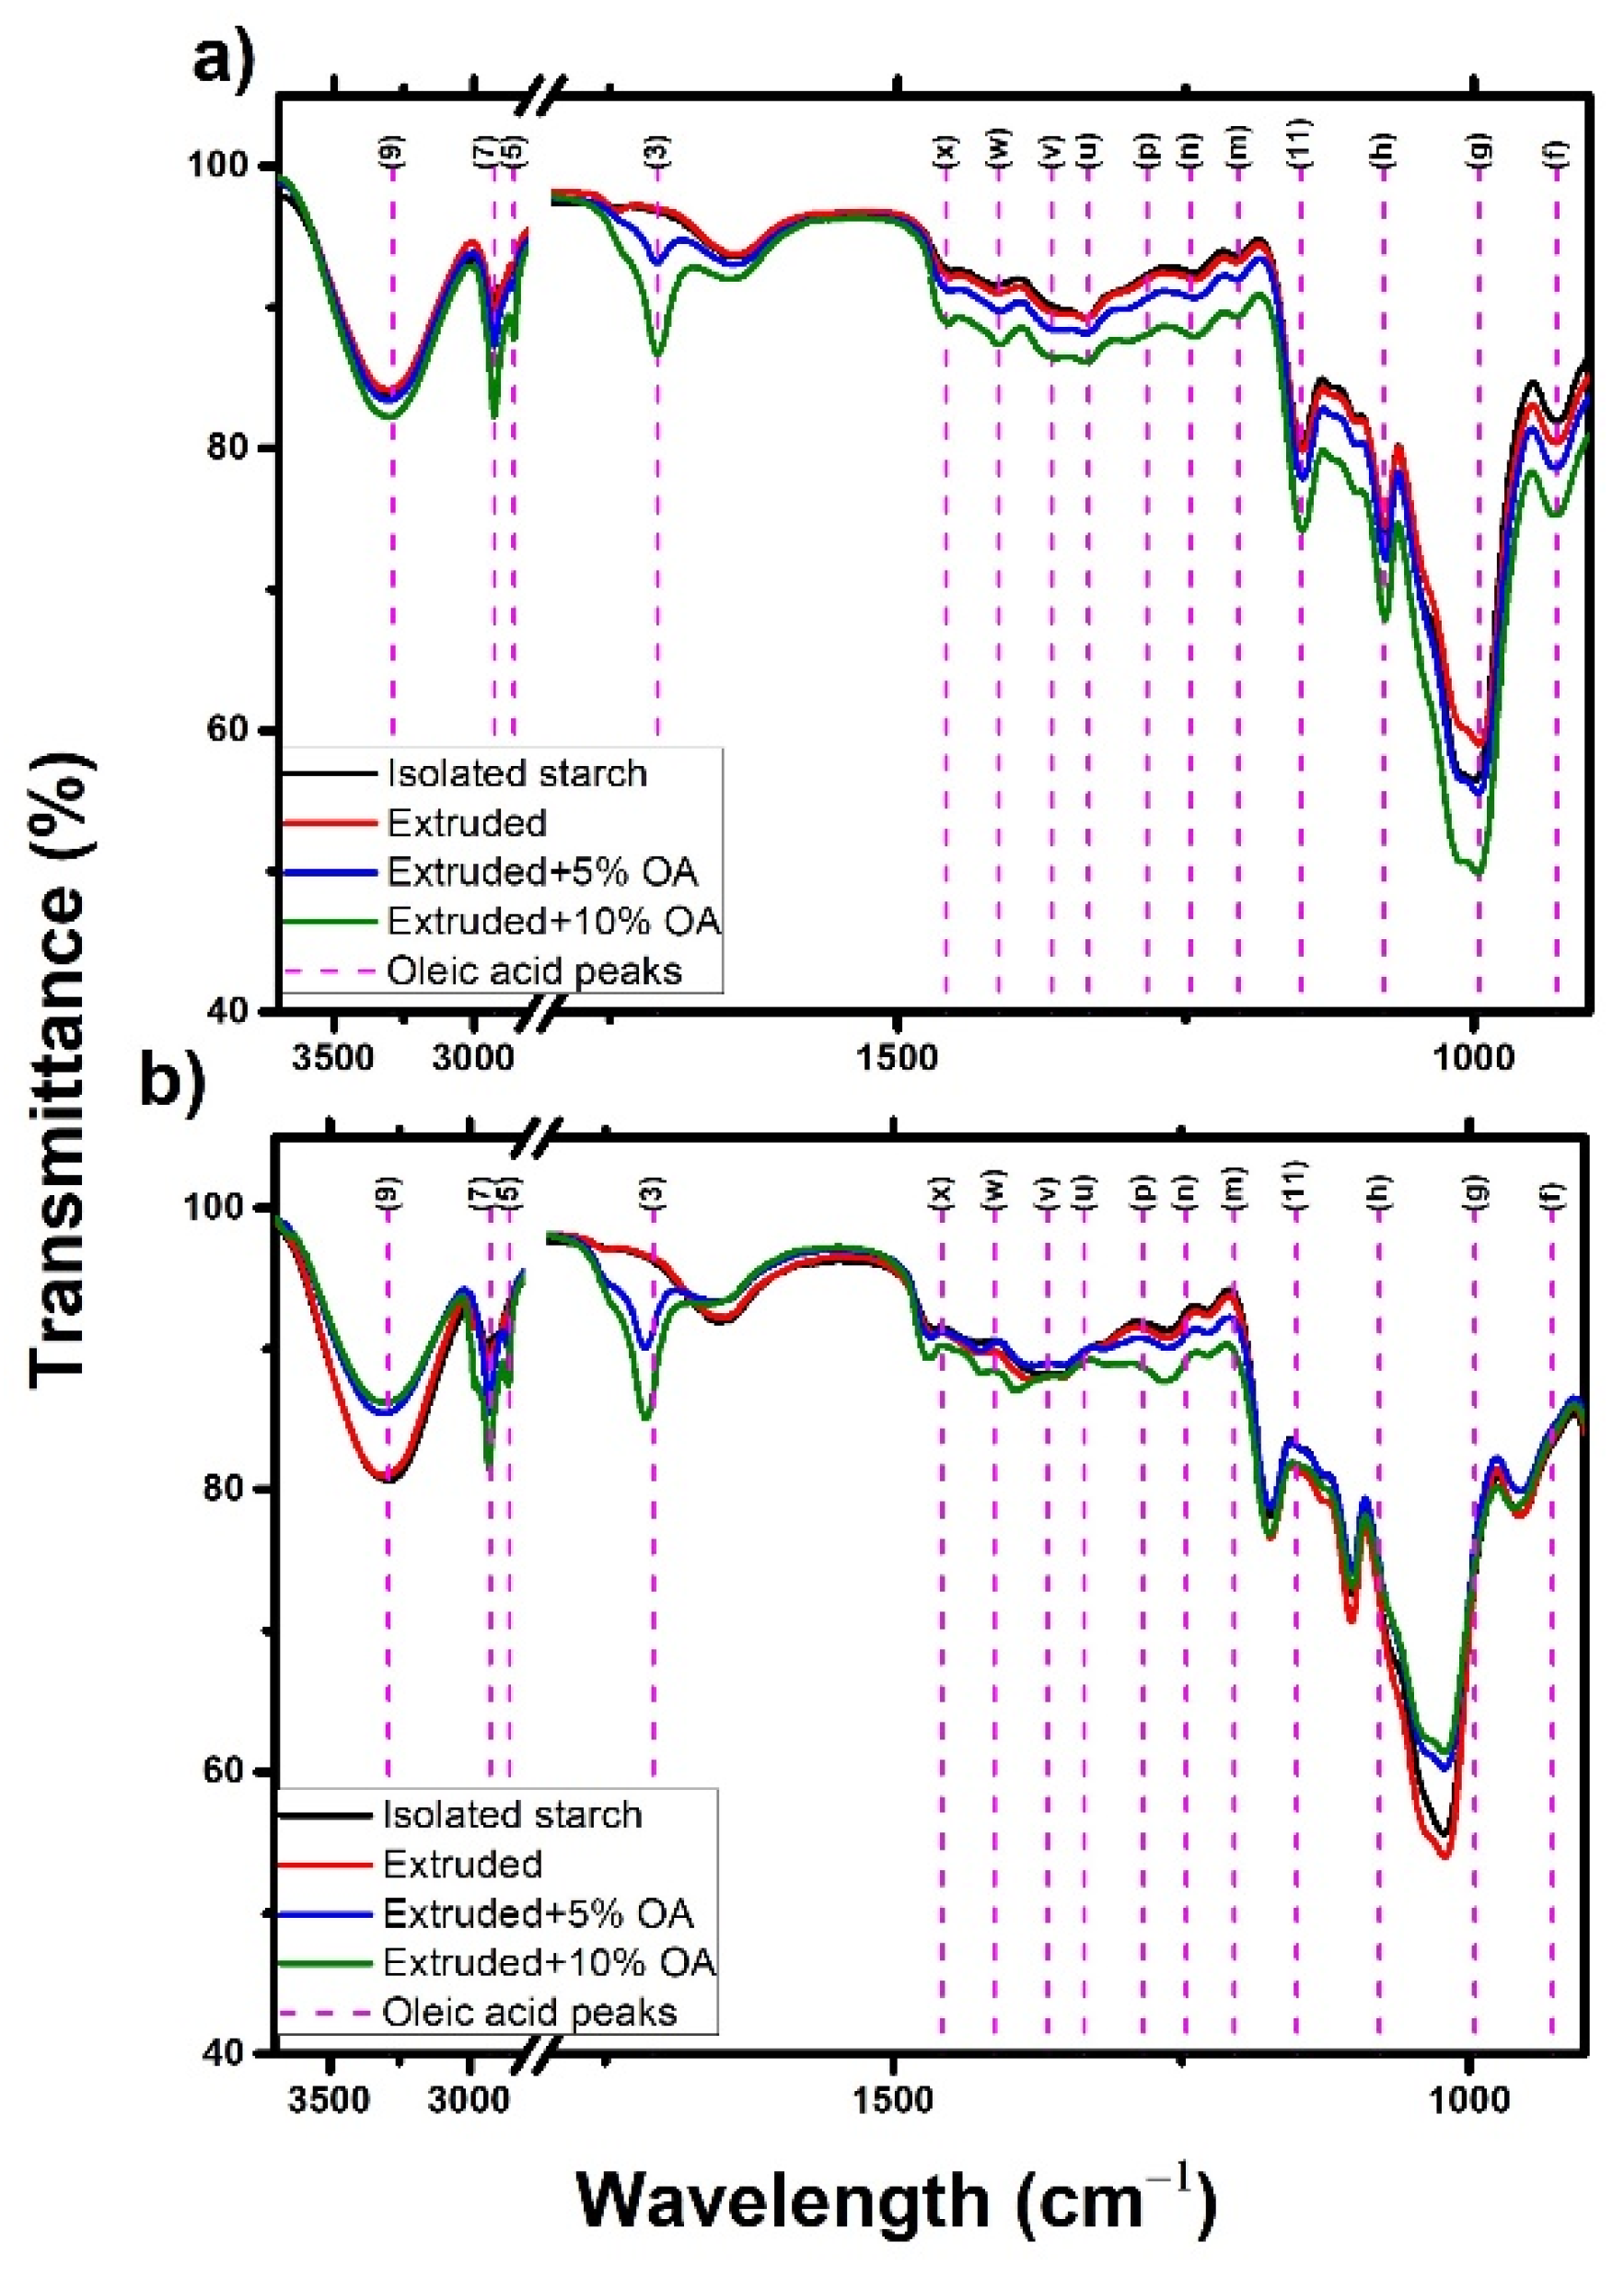
3.6. Infrared Spectroscopy

Figure 5 shows the infrared spectra of isolated, extruded, and extruded starches with 5% and 10% of oleic acid. Regardless of the starch source and treatment, all the starches showed the same characteristic peaks. The peak at 3289 cm−1 (9) was associated with the symmetric stretching of the O–H and C–H groups from both oleic acid, water, and starch [28]. On the other hand, the peaks at 2923 cm−1 (7) and 2854 cm−1 (5) were associated with the antisymmetric and symmetric stretching of the –CH2– and C–H groups, respectively. Meanwhile, the elongation and scissoring vibrations of the C=O and H–C–H groups were observed in the peaks 1708 cm−1 (3) and 1458 cm−1 (x). The peaks found at 1366 cm−1 (v) and 1334 cm−1 (u) were associated with the bending and deformation vibration of the functional groups C–H, C–OH, and –CH3. The peaks located around 1300 to 1000 cm−1 correspond to the stretching (11 m, n, h), elongation (p), and bending (n) vibrations of the CO–H, C–C, and C–O groups of starch and fatty acid. Finally, 995 cm−1 (g) was associated with the starch C–C skeleton bending vibration [29]. Furthermore, the potato starch peaks located at 1150 cm−1 (11), and 1078 cm−1 (h) also exhibited the stretching vibration of the P=O, C–O–P, and O–P–O groups, typical of potato phosphorylated starch [30]. Overall, it was observed that the IR spectra of starches remained unchanged, indicating that no new structures have been generated in the starch after the extrusion with and without OA.
It has been reported that a peak at 1715 cm−1 is attributed to the formation of the lipid-amylose complex [31]. However, as shown in Figure 5, this peak is characteristic of oleic acid, representing the C=O stretching vibration from the carboxylic group (present in all fatty acids). Hence, this peak intensity will increase as the fatty acid concentration increases and does not necessarily mean that a significant number of amylose-lipid complexes have been formed.
According to the results, potato starch showed higher stability to the damage caused by the extrusion process. In contrast, rice starch was more susceptible to damage during extrusion, losing up to 21% of its order degree (OD), in agreement with the data observed in the resistant starch content (Figure 4), in which a 74% reduction in the resistant starch content was observed compared to the isolated starch.

4. Conclusions

This work evaluated the effect of extrusion on the crystalline structure of starch during RS5 formation. In that sense, it was observed that a hexagonal crystalline structure (type-B) such as potato starch can interact better with oleic acid, leading to increased amylose-lipid complexes. However, it is important to recall that this interaction does not produce any new crystalline structure, as has been pointed out elsewhere. Nevertheless, X-ray points out the hexagonal starch showed a tendency to interact with OA during the extrusion, promoting a crystalline lamellae growth when extruded with 10% OA.
The above was supported by the thermal properties, where potato starches extruded with oleic acid presented the highest type IIa amylose-lipid complex dissociation enthalpy with 0.9 J/g. Likewise, potato starch reduced its viscosity profile after being extruded with 10% of oleic acid, presenting the lowest viscosity profile and the highest pasting temperature. Finally, IR analysis showed that rice starch became more susceptible to thermo-mechanical damage during extrusion, losing up to 21% of its order.
This study showed that the crystalline structure of starch could affect its ability to produce starch–lipid complexes. Future research could evaluate the mechanisms by which this complexing occurs and the role of the crystalline structure of starch. Finally, understanding the complexing mechanisms may produce starches with improved resistance to enzymatic hydrolysis, thereby serving as low-calorie or low-glycemic additives in the diet.

Author Contributions

Conceptualization, M.G.-M.; methodology, E.C.-R.; software, A.H.C.-R.; validation, M.G.-M., E.M.-S., M.d.l.L.R.-V. and M.E.R.-G.; formal analysis, M.G.-M., M.d.l.L.R.-V. and A.H.C.-R.; investigation, A.H.C.-R. and E.C.-R.; resources, M.G.-M., M.E.R.-G. and E.M.-S.; data curation, E.C.-R. and A.H.C.-R.; writing—original draft preparation, A.H.C.-R.; writing—review and editing, M.G.-M., E.M.-S., M.d.l.L.R.-V. and M.E.R.-G.; visualization, writing and edition, A.H.C.-R. and M.E.R.-G.; supervision, M.G.-M.; project administration, M.G.-M.; funding acquisition, M.G.-M. All authors have read and agreed to the published version of the manuscript.

Funding

This research received no external funding.

Institutional Review Board Statement

Not applicable.

Informed Consent Statement

Not applicable.

Data Availability Statement

Not applicable.

Acknowledgments

We thank the support of the Universidad Autónoma de Queretaro (UAQ) for the scholarship granted to the author Juan E. Cervantes-Ramírez, through the FOPER-UAQ 2019 program. This research was supported by the Universidad Autónoma de Querétaro (Fondos “Química somos todos” 2020) and by IPN with project SIP20200568 and SIP20211175.

Conflicts of Interest

The authors of this study declare that there is no conflict of interest of any kind.

References

  1. Rodriguez-Garcia, M.E.; Hernandez-Landaverde, M.A.; Delgado, J.M.; Ramirez-Gutierrez, C.F.; Ramirez-Cardona, M.; Millan-Malo, B.M.; Londoño-Restrepo, S.M. Crystalline structures of the main components of starch. Curr. Opin. Food Sci. 2021, 37, 107–111. [Google Scholar] [CrossRef]
  2. Pérez, S.; Bertoft, E. The molecular structures of starch components and their contribution to the architecture of starch granules: A comprehensive review. Starch Stärke 2010, 62, 389–420. [Google Scholar] [CrossRef]
  3. Manthey, F.A. Starch: Sources and Processing, 1st ed.; Elsevier Ltd.: Amsterdam, The Netherlands, 2015; ISBN 9780123849533. [Google Scholar]
  4. Obiro, W.C.; Sinha Ray, S.; Emmambux, M.N. V-amylose Structural characteristics, methods of preparation, significance, and potential applications. Food Rev. Int. 2012, 28, 412–438. [Google Scholar] [CrossRef] [Green Version]
  5. Di Marco, A.E.; Ixtaina, V.Y.; Tomás, M.C. Inclusion complexes of high amylose corn starch with essential fatty acids from chia seed oil as potential delivery systems in food. Food Hydrocoll. 2020, 108, 106030. [Google Scholar] [CrossRef]
  6. Chao, C.; Huang, S.; Yu, J.; Copeland, L.; Wang, S.; Wang, S. Molecular mechanisms underlying the formation of starch-lipid complexes during simulated food processing: A dynamic structural analysis. Carbohydr. Polym. 2020, 244, 116464. [Google Scholar] [CrossRef] [PubMed]
  7. D’Silva, T.V.; Taylor, J.R.N.; Emmambux, M.N. Enhancement of the pasting properties of teff and maize starches through wet–heat processing with added stearic acid. J. Cereal Sci. 2011, 53, 192–197. [Google Scholar] [CrossRef] [Green Version]
  8. Arik Kibar, E.A.; Gönenç, İ.; Us, F. Effects of fatty acid addition on the physicochemical properties of corn starch. Int. J. Food Prop. 2014, 17, 204–218. [Google Scholar] [CrossRef]
  9. De Pilli, T.; Derossi, A.; Talja, R.A.; Jouppila, K.; Severini, C. Starch–lipid complex formation during extrusion-cooking of model system (rice starch and oleic acid) and real food (rice starch and pistachio nut flour). Eur. Food Res. Technol. 2012, 234, 517–525. [Google Scholar] [CrossRef]
  10. Cervantes-Ramírez, J.E.; Cabrera-Ramirez, A.H.; Morales-Sánchez, E.; Rodriguez-García, M.E.; de la Reyes-Vega, M.L.; Ramírez-Jiménez, A.K.; Contreras-Jiménez, B.L.; Gaytán-Martínez, M. Amylose-lipid complex formation from extruded maize starch mixed with fatty acids. Carbohydr. Polym. 2020, 246, 116555. [Google Scholar] [CrossRef] [PubMed]
  11. Ménera-López, I.; Gaytán-Martínez, M.; Reyes-Vega, M.L.; Morales-Sánchez, E.; Figueroa, J.D.C. Physico-chemical properties and quality assessment of corn flour processed by a continuous ohmic heating system and traditional nixtamalization. Cyta J. Food 2013, 11, 8–14. [Google Scholar] [CrossRef] [Green Version]
  12. Wani, A.A.; Singh, P.; Shah, M.A.; Schweiggert-Weisz, U.; Gul, K.; Wani, I.A. Rice starch diversity: Effects on structural, morphological, thermal, and physicochemical properties—A Review. Compr. Rev. Food Sci. Food Saf. 2012, 11, 417–436. [Google Scholar] [CrossRef]
  13. Pineda-Gomez, P.; González, N.M.; Contreras-Jimenez, B.; Rodriguez-Garcia, M.E. Physicochemical characterisation of starches from six potato cultivars native to the Colombian andean region. Potato Res. 2020. [Google Scholar] [CrossRef]
  14. Villada, J.A.; Sánchez-Sinencio, F.; Zelaya-Ángel, O.; Gutiérrez-Cortez, E.; Rodríguez-García, M.E. Study of the morphological, structural, thermal, and pasting corn transformation during the traditional nixtamalization process: From corn to tortilla. J. Food Eng. 2017, 212, 242–251. [Google Scholar] [CrossRef]
  15. Pinto, C.C.; Campelo, P.H.; Michielon de Souza, S. Rietveld-based quantitative phase analysis of B-type starch crystals subjected to ultrasound and hydrolysis processes. J. Appl. Polym. Sci. 2020, 137, 49529. [Google Scholar] [CrossRef]
  16. Ali, S.; Singh, B.; Sharma, S. Effect of processing temperature on morphology, crystallinity, functional properties, and in vitro digestibility of extruded corn and potato starches. J. Food Process. Preserv. 2020, 44, 1–8. [Google Scholar] [CrossRef]
  17. Singh, J.; Colussi, R.; McCarthy, O.J.; Kaur, L. Potato Starch and Its Modification. In Advances in Potato Chemistry and Technology; Elsevier: Amsterdam, The Netherlands, 2016; pp. 195–247. [Google Scholar]
  18. Mościcki, L.; Mitrus, M.; Wójtowicz, A.; Oniszczuk, T.; Rejak, A.; Janssen, L. Application of extrusion-cooking for processing of thermoplastic starch (TPS). Food Res. Int. 2012, 47, 291–299. [Google Scholar] [CrossRef]
  19. Ma, M.; Wang, Y.; Wang, M.; Jane, J.; Du, S. Physicochemical properties and in vitro digestibility of legume starches. Food Hydrocoll. 2017, 63, 249–255. [Google Scholar] [CrossRef]
  20. Ai, Y.; Jane, J. Understanding Starch Structure and Functionality. In Starch in Food; Elsevier: Amsterdam, The Netherlands, 2018; pp. 151–178. ISBN 9780081008683. [Google Scholar]
  21. Ye, J.; Hu, X.; Luo, S.; Liu, W.; Chen, J.; Zeng, Z.; Liu, C. Properties of starch after extrusion: A Review. Starch Stärke 2018, 70. [Google Scholar] [CrossRef]
  22. Hasjim, J.; Ai, Y.; Jane, J. Novel Applications of amylose-lipid complex as resistant starch Type 5. In Resistant Starch; John Wiley & Sons, Inc.: Hoboken, NJ, USA, 2013; pp. 79–94. [Google Scholar]
  23. Bertoft, E.; Blennow, A. Structure of potato Starch. In Advances in Potato Chemistry and Technology; Elsevier: Amsterdam, The Netherlands, 2016; pp. 57–73. ISBN 9780128000021. [Google Scholar]
  24. Sang, Y.; Bean, S.; Seib, P.A.; Pedersen, J.; Shi, Y.-C. Structure and functional properties of sorghum starches differing in amylose content. J. Agric. Food Chem. 2008, 56, 6680–6685. [Google Scholar] [CrossRef]
  25. Zheng, Y.; Tian, J.; Ogawa, Y.; Kong, X.; Chen, S.; Liu, D.; Ye, X. Physicochemical properties and in vitro digestion of extruded rice with grape seed proanthocyanidins. J. Cereal Sci. 2020, 95, 103064. [Google Scholar] [CrossRef]
  26. Calvo-López, A.D.; Martínez-Bustos, F. Optimization of extrusion process of directly expanded snacks based on Potato starch in a single step for the formation of Type IV Resistant Starch. Plant Foods Hum. Nutr. 2017, 72, 243–249. [Google Scholar] [CrossRef]
  27. Nayak, B.; De, J.; Berrios, J.; Tang, J. Impact of food processing on the glycemic index (GI) of potato products. Food Res. Int. 2014, 56, 35–46. [Google Scholar] [CrossRef]
  28. Ma, G.; Allen, H.C. Handbook of Spectroscopy, 2nd ed.; 2004; Volume 126; Wiley-VCH Verlag GmbH & Co. KGaA:  Weinheim. J. Am. Chem. Soc. 2004, 126, 8859–8860. [Google Scholar] [CrossRef]
  29. Basiak, E.; Lenart, A.; Debeaufort, F. How glycerol and water contents affect the structural and functional properties of Starch-Based Edible Films. Polymers 2018, 10, 412. [Google Scholar] [CrossRef] [PubMed] [Green Version]
  30. Sá-Lima, H.; Caridade, S.G.; Mano, J.F.; Reis, R.L. Stimuli-responsive chitosan-starch injectable hydrogels combined with encapsulated adipose-derived stromal cells for articular cartilage regeneration. Soft Matter 2010, 6, 5184. [Google Scholar] [CrossRef] [Green Version]
  31. Marinopoulou, A.; Papastergiadis, E.; Raphaelides, S.N.; Kontominas, M.G. Morphological characteristics, oxidative stability and enzymic hydrolysis of amylose-fatty acid complexes. Carbohydr. Polym. 2016, 141, 106–115. [Google Scholar] [CrossRef] [PubMed]
Figure 1. Microstructure of isolated, extruded, and extruded starch with 5% and 10% oleic acid. (a) isolated rice starch; (b) extruded rice starch; (c) rice starch extruded with 5% OA; (d) rice starch extruded with 10% OA; (e) isolated potato starch; (f) extruded potato starch; (g) potato starch extruded with 5% OA; (h) potato starch extruded with 10% OA.
Polysaccharides 02 00013 g001
Figure 2. X-ray diffraction of isolated starches, extruded, and extruded starches with 5% and 10% of oleic acid. (a) rice starch extruded with oleic acid (OA); (b) potato starch extruded with oleic acid (OA); (c) 2nd derivative of the intensity of rice starches; (d) 2nd derivative of the intensity of potato starches.
Polysaccharides 02 00013 g002
Figure 3. Viscosity profile of isolated, extruded, and extruded starches with 5% and 10% of oleic acid. (a) rice isolated starch (black line), extruded rice starch (red line), rice starch extruded with 5% OA (blue line), and rice starch extruded with 10% OA (green line); (b) potato isolated starch (black line), extruded potato starch (red line), potato starch extruded with 5% OA (blue line) and potato starch extruded with 10% OA (green line); OA: Oleic acid.
Polysaccharides 02 00013 g003
Figure 4. Resistant starch content in isolated, extruded, and extruded starches with 5% and 10% of oleic acid (OA). The mean ± standard deviation of three independent experiments is shown. Different letters represent statistical differences (p < 0.05) between treatments.
Polysaccharides 02 00013 g004
Figure 5. Infrared spectra of isolated, extruded, and extruded starches with 5% and 10% of oleic acid. (a) rice starch + oleic acid; (b) potato starch + oleic acid. OA: oleic acid.
Polysaccharides 02 00013 g005
Table 1. Experimental d spacing calculation of each Bragg’s angle found in rice and potato extruded starches with 5% and 10% of OA.
TreatmentEd (Å) EhklRd (Å) RRSD (%)
Rice starch (orthorhombic structure)
5% OA18.304.8437(220)4.86890.37
5% OA20.304.3708 *(040)4.39620.41
5% OA23.703.7509(132)3.73650.27
10% OA11.707.5571 *(132)3.73650.79
10% OA13.266.6713 *(051)3.33990.09
10% OA14.965.9168(121)5.86720.60
10% OA20.284.3751(040)4.39620.34
Potato starch (hexagonal structure)
5% OA12.347.1665 *(032)3.67841.85
5% OA13.166.7218 *(013)3.37530.30
5% OA22.523.9447(040)3.91470.54
10% OA7.7211.4418 *(120)5.91842.40
10% OA15.045.8855(120)5.91840.39
10% OA17.205.1510(121)5.14010.15
10% OA18.924.6864 *(161)2.32700.49
10% OA21.624.1068 *(442)2.07180.63
10% OA25.243.5254 *(452)1.87004.18
An asterisk means that the experimental d spacing value does not directly belong to the isolated starch crystalline structure (orthorhombic or hexagonal). 2θ: Bragg’s angle; d: interplanar distance; hkl: Miller index; E: experimental data; R: Bragg’s angle and d spacing of the indexed orthorhombic and hexagonal starch crystalline structures [1]. RSD: The relative standard deviation between experimental and indexed d spacing.
Table 2. Thermal properties of isolated, extruded, and extruded starches with 5% and 10% of oleic acid.
TreatmentGelatinizationAmylose-Lipid Complex
T0 (°C)Tp (°C)Te (°C)ΔH (J/g)T0 (°C)Tp (°C)Te (°C)ΔH (J/g)
Rice starch
Isolated starch64.4 ± 1.3 b69.9 ± 1.5 bc76.5 ± 1.6 bc1.77 ± 0.04 bNDNDNDND
Extruded71.4 ± 1.5 a77.1 ± 1.6 a85.5 ± 1.8 a1.59 ± 0.03 cNDNDNDND
Extruded + 5% OA70.9 ± 1.4 a75.4 ± 1.6 ab80.9 ± 1.7 ab0.64 ± 0.01 e107.2 ± 2.2 a108.9 ± 2.3 a113.1 ± 2.4 a0.14 ± 0.03 b
Extruded + 10% OA71.6 ± 1.3 a78.0 ± 1.5 a85.2 ± 1.8 a0.97 ± 0.02 dNDNDNDND
Potato starch
Isolated starch61.9 ± 1.3 b64.9 ± 1.4 cd68.5 ± 1.4 d2.13 ± 0.03 aNDNDNDND
Extruded46.6 ± 1.0 c60.4 ± 1.3 d71.1 ± 1.5 d1.80 ± 0.04 bNDNDNDND
Extruded + 5% OA42.2 ± 0.9 c51.6 ± 1.1 e66.6 ± 1.4 d0.97 ± 0.02 d103.3 ± 2.2 a108.2 ± 2.3 a112.0 ± 2.3 a0.14 ± 0.01 b
Extruded + 10% OA42.2 ± 0.9 c52.8 ± 1.1 e68.3 ± 1.4 d1.56 ± 0.03 c97.0 ± 2.0 b107.5 ± 2.2 a114.6 ± 2.4 a0.91 ± 0.02 a
The mean ± standard deviation of three independent experiments is shown. Different letter per row indicates statistical differences (p < 0.05) between treatments in the same parameter. OA: Oleic acid; T0: initial temperature; Tp: peak temperature; Te: final temperature; ΔH: enthalpy (J/g); ND: non-detected.
Publisher’s Note: MDPI stays neutral with regard to jurisdictional claims in published maps and institutional affiliations.

