3.1. Morphological Analysis
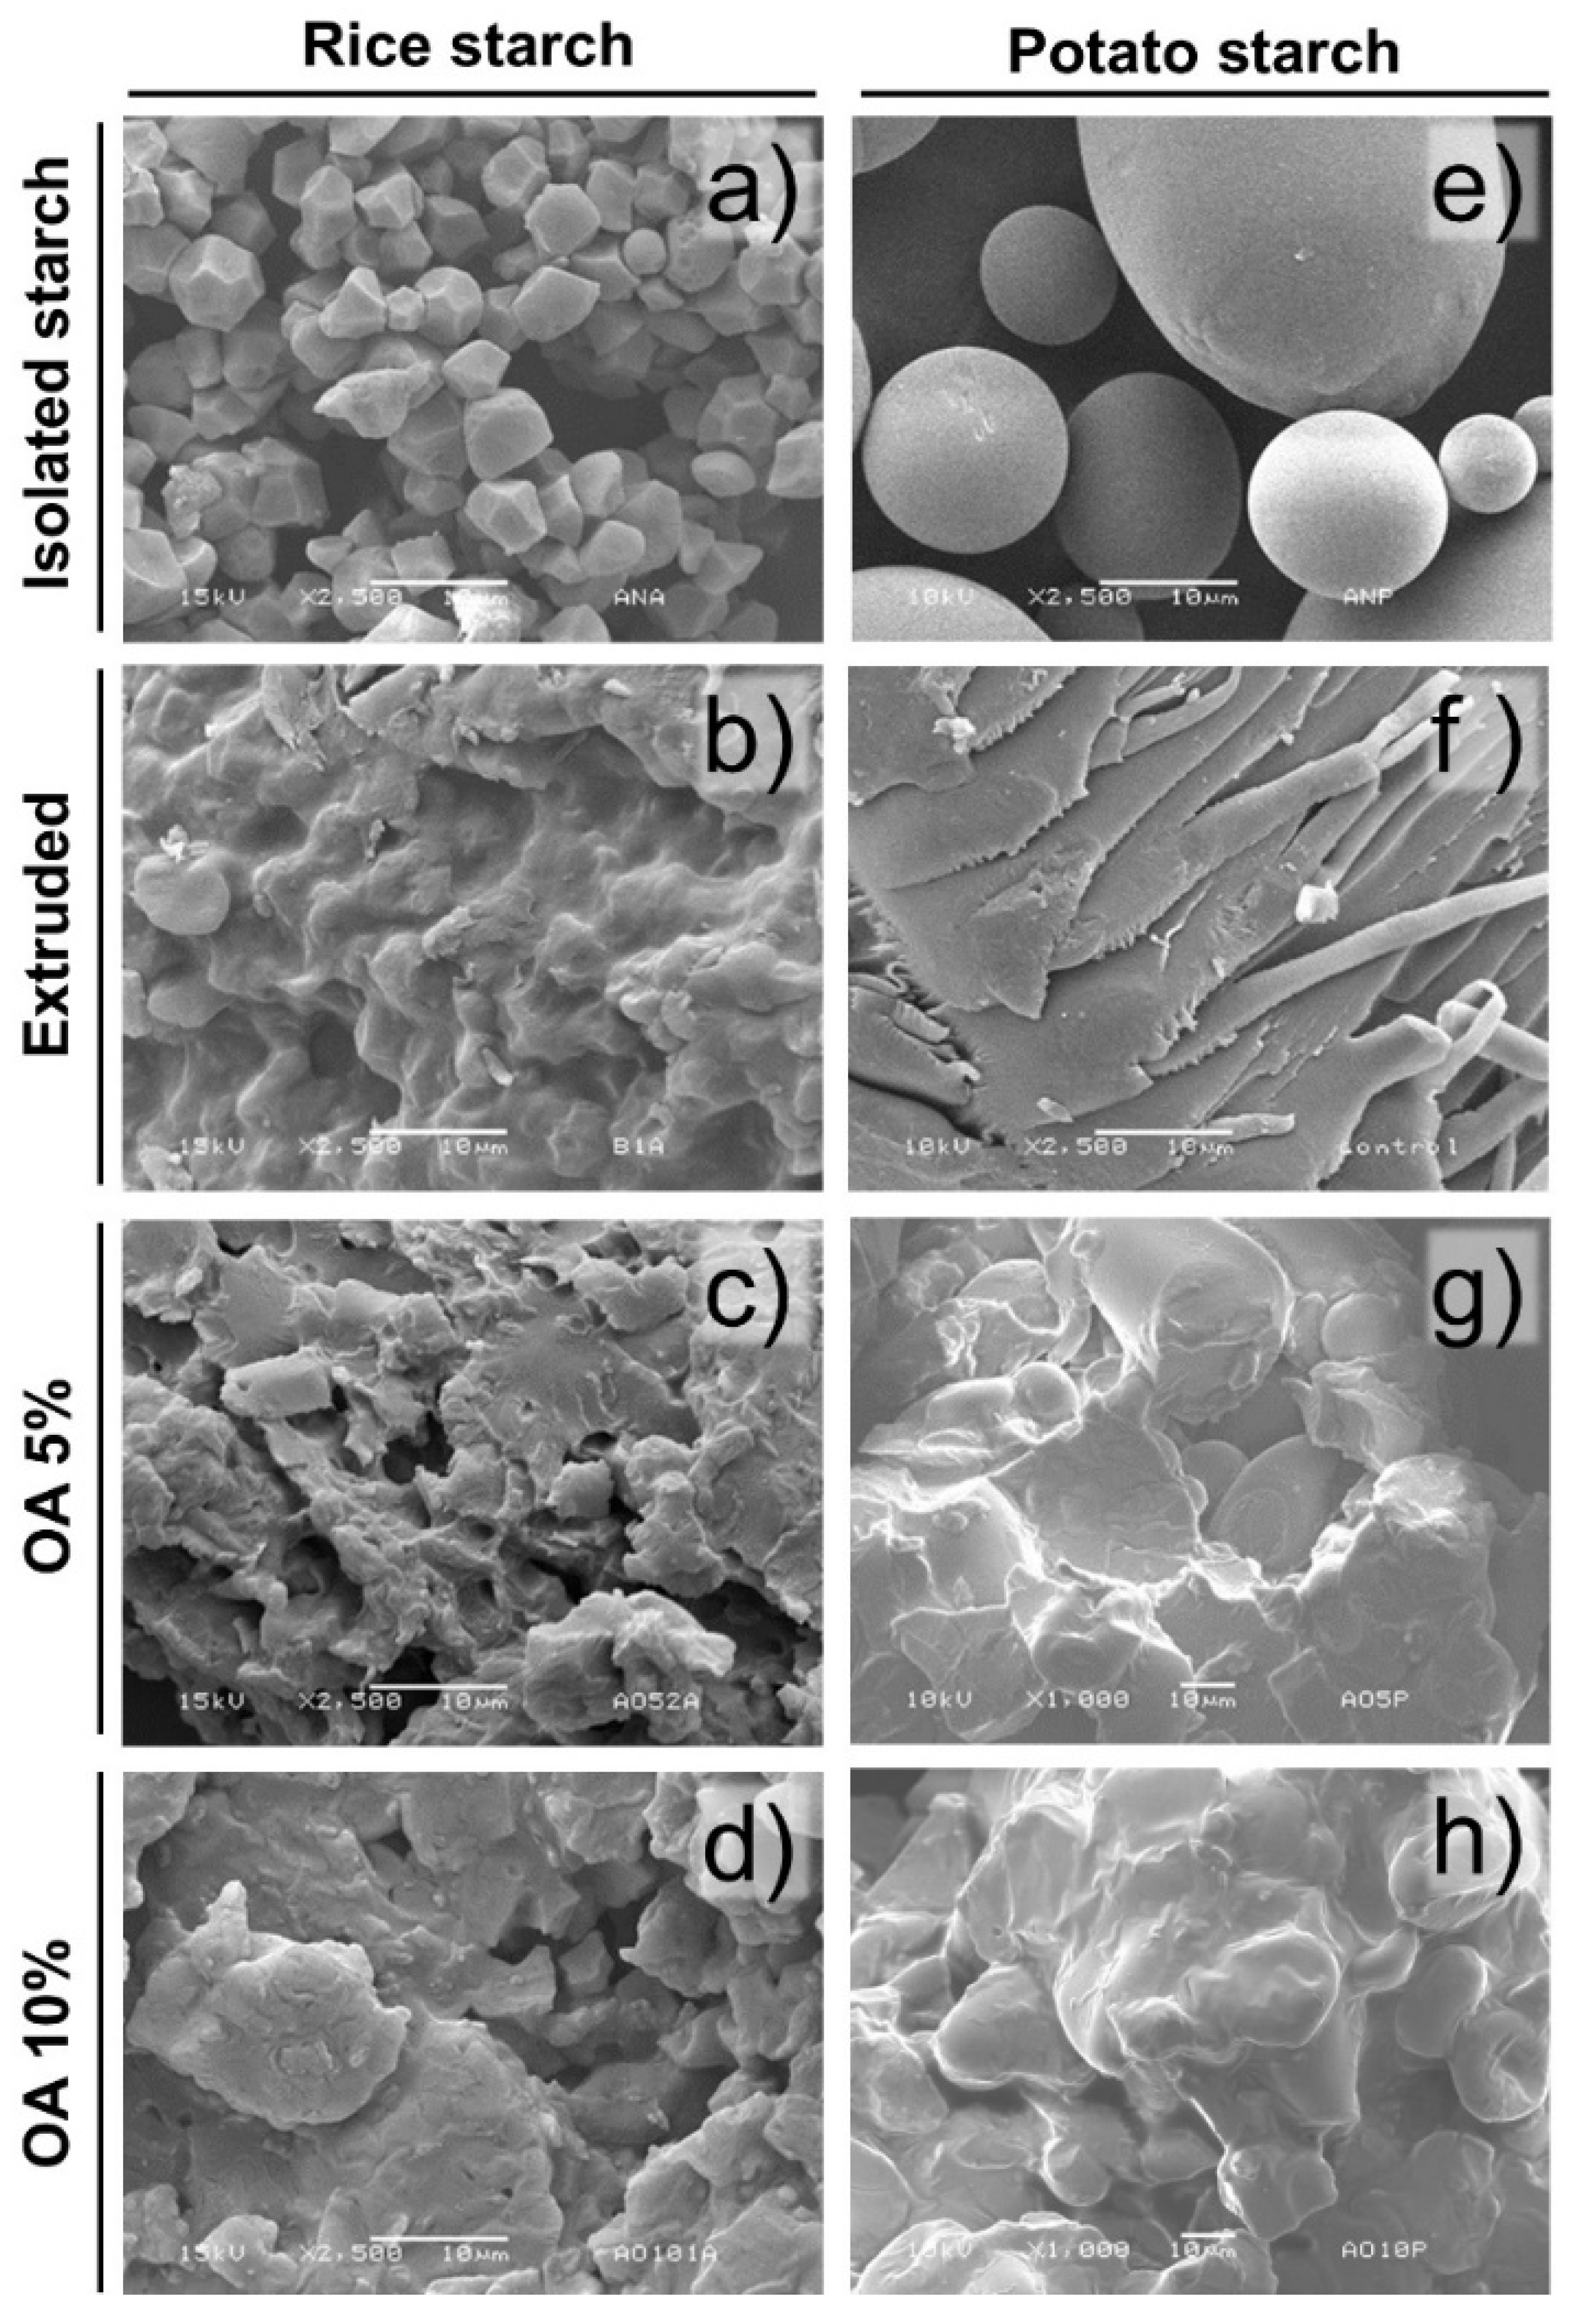
Figure 1 shows the morphology of isolated starches extruded and extruded with 5% and 10% of oleic acid. The isolated rice and potato starches both showed structural integrity since they did not present ruptures or fissures. In that sense, isolated rice starch presented starch granules with polygonal shapes arranged in a packaged matrix with a low incidence of intergranular spaces (
Figure 1a). These granules showed an average of 7 ± 1.94 μm, considered small granules, agreeing with the literature [
12].
On the other hand, potato isolated starch was shown to have a semi-spherical structure (
Figure 1e), constituted by two granule sizes 25.42 ± 5.01 μm and 76.28 ± 8.35 μm, suggesting a bimodal distribution. Likewise, these granules were arranged in a slightly loose matrix compared to rice starch. The results coincide with those reported for potato starch, where the presence of small semi-spherical granules (1 to 20 μm) and large granules (20 to 110 μm) has been observed [
13].
Regarding the extruded starches, disruption of the granules was observed due to the high temperatures, pressure, moisture, and mechanical stress (shear) generated during processing. In that sense, the extruded rice starch (
Figure 1b) showed a partial loss of the granular morphology, showing a matrix constituted by some integer starches embedded in a gelatinized starch matrix. Meanwhile, in extruded potato starch (
Figure 1f), the extrusion process lost the granular structure obtaining a gelatinized starch matrix.
Regarding the starches extruded with oleic acid, a similar morphology was found in rice and potato (
Figure 1c,g). These starch granules were partially destroyed and integrated into a granular fused matrix. Furthermore, some granules maintain their integrity. Remarkably, the extruded potato starch showed partial integrity of large granules, being observed displayed into the starch fusion matrix. The same tendency was observed in the extruded starches with 10% of oleic acid (
Figure 1d,h). Regardless of the starch type, an apparent amorphous matrix involved the remanent starch granules. However, this may result from a water diffusion effect since smaller starch granules have a larger contact surface; therefore, increasing their probability of absorbing more water than large granules. Likewise, a coating of the starch granule can be generated during the extrusion with fatty acids, reducing shear friction and the ability of the granule to absorb water [
10]. Moreover, rice starch showed more susceptibility to microstructure damage after extrusion, regardless of the oleic acid concentration used. The extrusion process generates damage in granules due to pressure, shear, and heat, which produces gelatinization in the presence of water [
14].
3.2. X-ray Diffraction
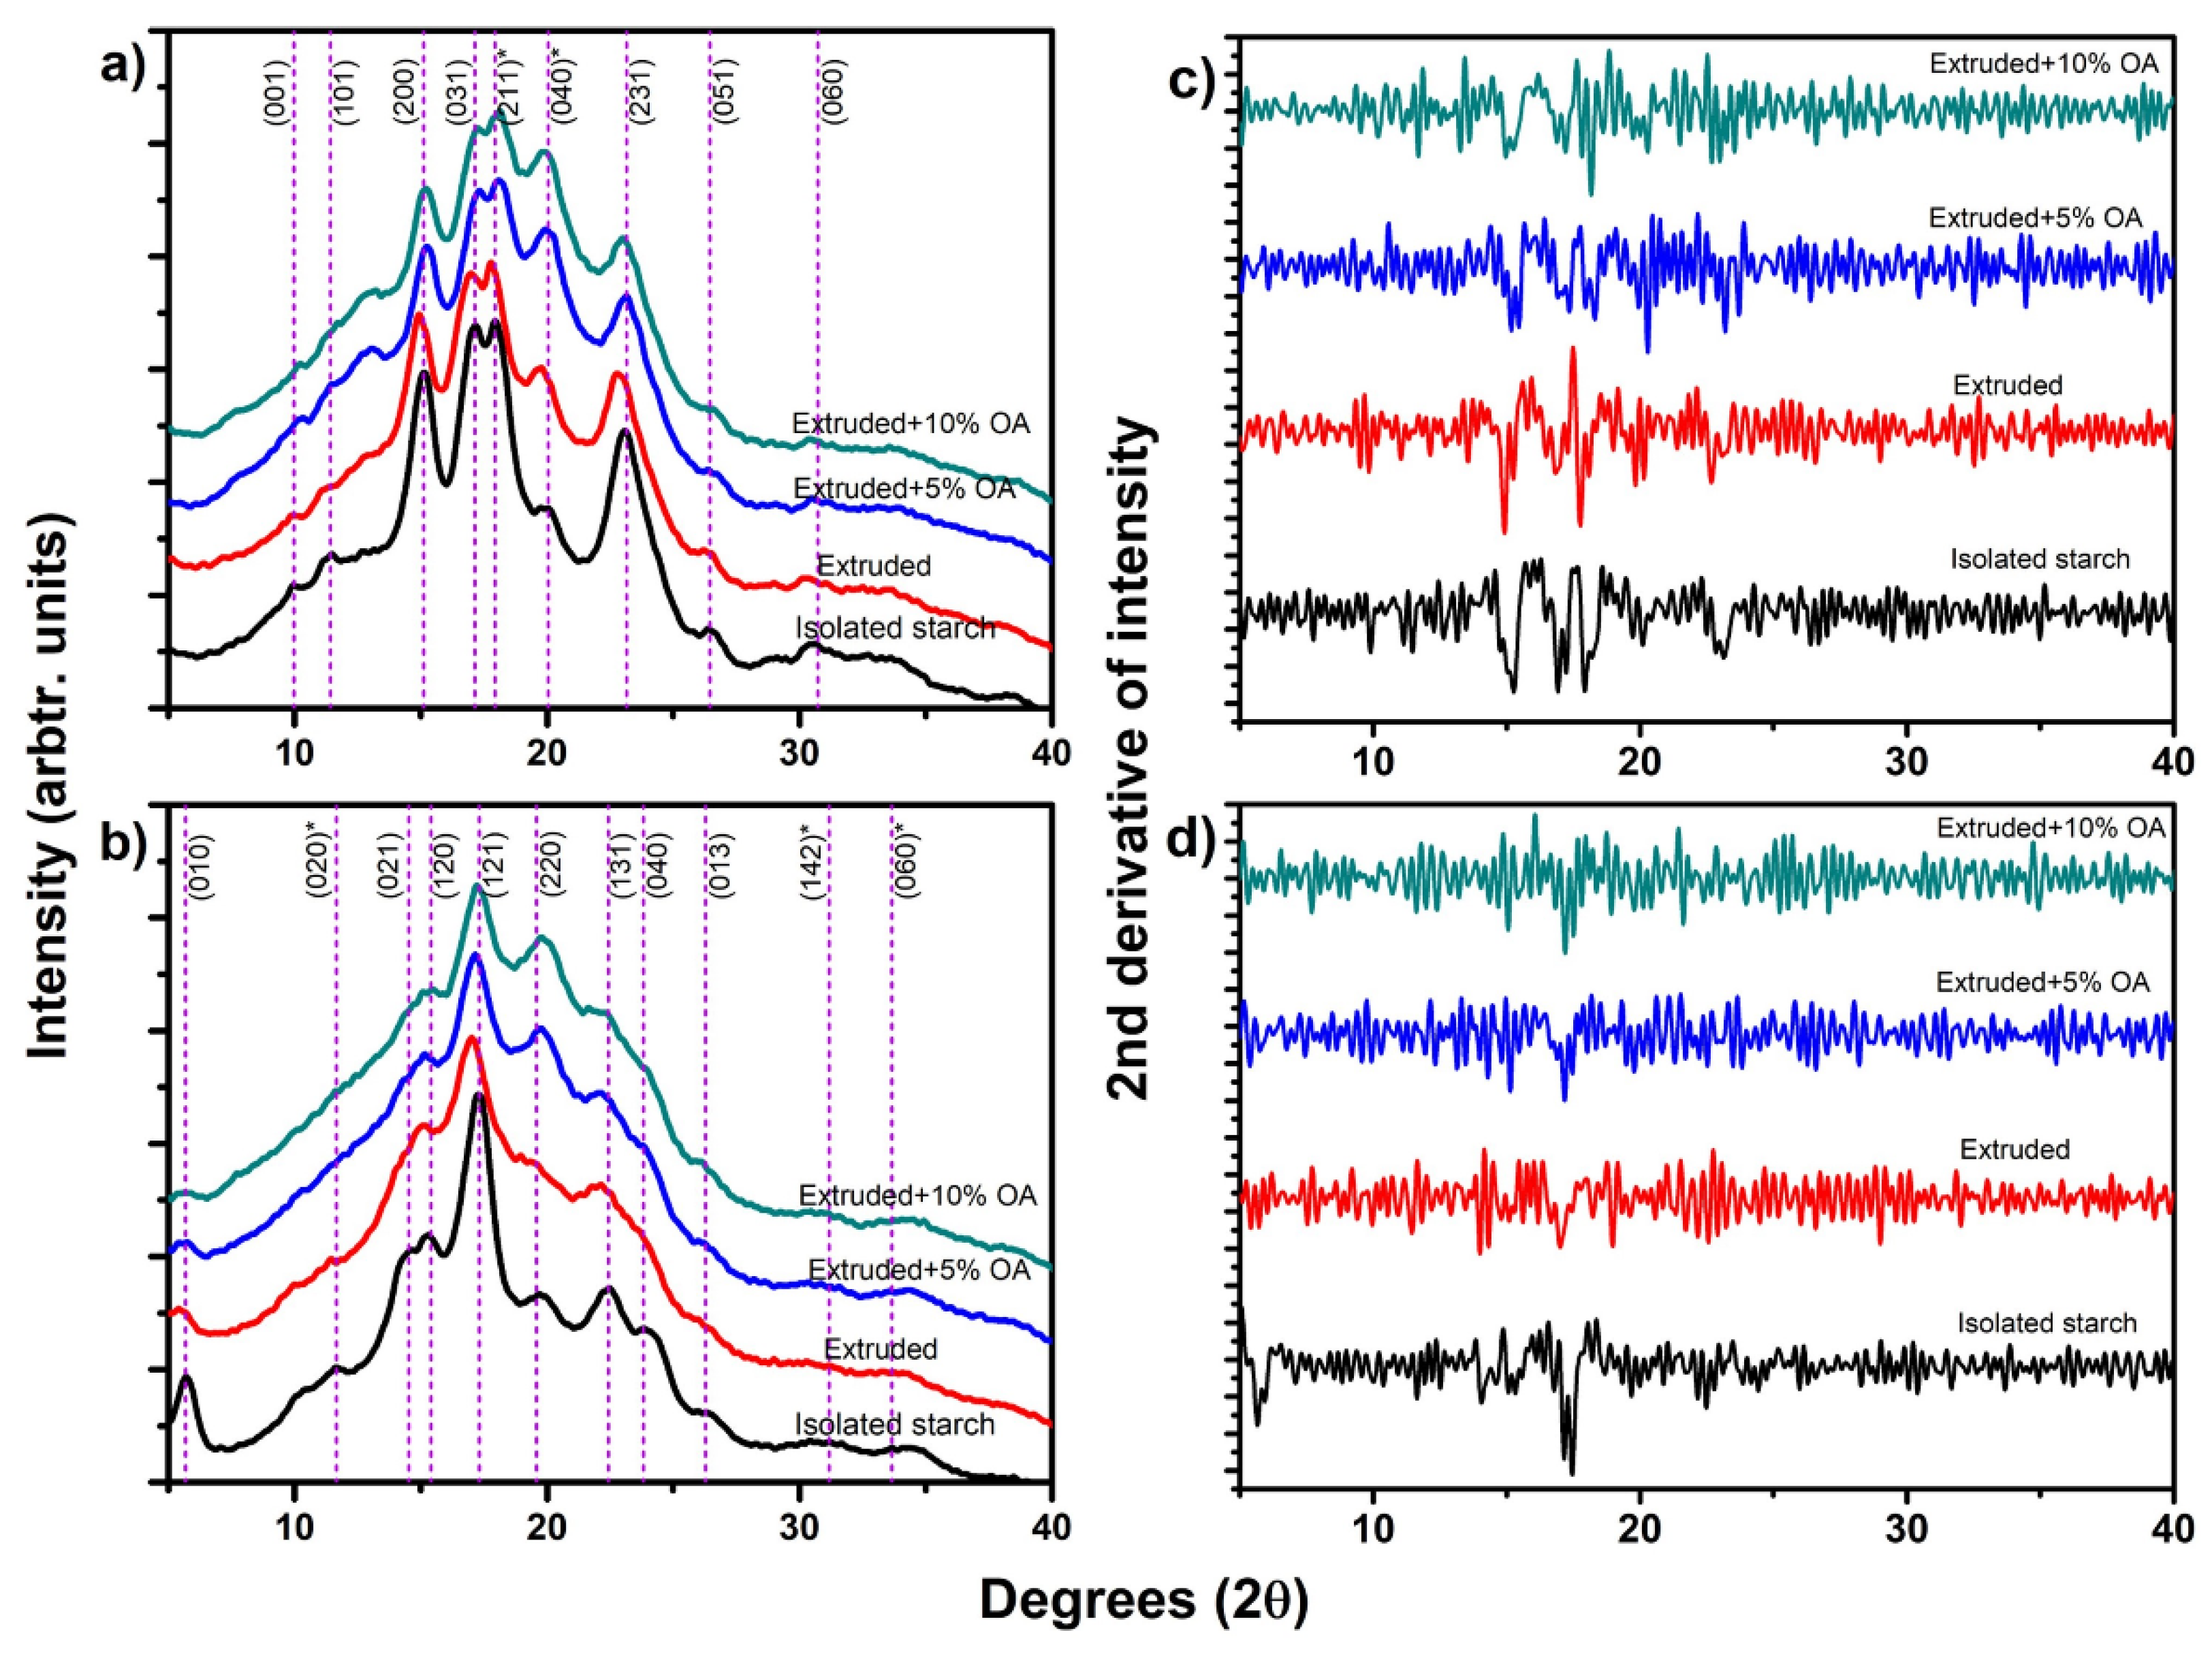
Figure 2a shows the X-ray diffraction pattern of isolated and extruded starches with oleic acid: rice starch (a) and potato starch (b). The dash lines in this figure correspond to the indexing of these crystalline structures [
1]. The isolated rice starch showed a type-A starch with an orthorhombic crystalline structure [
1]. For extruded rice starch (
Figure 2a, red line), a slight shift to the left was observed at peaks (200), (031), (211), and (231), suggesting an increase in the interplanar distance after the extrusion process [
10]. Meanwhile, when extruding rice starch with 5% and 10% of oleic acid (
Figure 2a, blue and green line, respectively), an increase in the relative intensity was observed near to 13.6° and 19.9° (2θ scale), tending to be more sharped in extruded rice starch with 10% oleic acid. Regarding the rice extruded starches with and without oleic acid, a reduction in the relative intensity of peaks (200), (031), (211), and (231) were observed, produced by the crystal damage of the extrusion (
Figure 2a).
Potato isolated starch (
Figure 2b) displayed a type-B starch with a hexagonal crystalline structure. The dash lines in this figure correspond to the indexing of these crystalline structures [
1,
15]. After the extrusion process, a reduction of the relative intensity of the peaks of potato starch was observed for the (010), (021), (131), and (013) directions (
Figure 2b). This reduction in the relative intensity has been associated with partial damage during gelatinization and disruption of the starch granules due to the temperature, shear, and pressure reached during extrusion [
16]. As for the potato extruded starches with and without oleic acid, a reduction of the relative intensity of potato starch was observed at peaks located at (010), (021), (131), and (013) (
Figure 2b). Therefore, suggesting a loss in the relative crystallinity of the starch compared to the isolated one. This relative intensity reduction is associated with the gelatinization and disruption of the starch granule due to the temperature, shear, and pressure reached during extrusion [
16]. All these results agree with the observations in the microstructure of extruded potato starch (
Figure 1). Furthermore, a slight left shift was observed in peaks (010), (121), and (131), suggesting an increase in the interplanar distance of the crystalline structure as a result again of the tangential force. These same shifts were observed by Cervantes-Ramírez et al. [
10] in the diffraction pattern of extruded corn starch with oleic acid, attributable to the modification of the crystalline structure.
As shown in
Figure 2a,b, both isolated and extruded starches had a similar diffractogram with slight reductions in the relative intensity. Contrary, extruded starches with oleic acid showed an increase in certain Bragg’s angles, which does not correspond to the isolated X-ray patterns.
Therefore, the second derivative criteria (
Figure 2c,d) was used to identify these changes accurately. In that sense,
Table 1 shows the Bragg’s angles (2θ) found in rice and potato extruded starches with oleic acid (OA), excluding those peaks that directly corresponded to the isolated crystalline structure.
Table 1 also shows the direct calculation of the d spacing (interplanar distance) of each peak determined by using Laue’s law.
The rice starch extruded with 5% OA (
Figure 2c) showed an increase in the relative intensity of the peaks near 18.30 (4.8437 Å), 20.3 (4.3708 Å), and 23.70° (3.7509 Å) 2θ. Whereas rice starch extruded with 10% OA showed an increase in peaks at 11.70 (7.5571 Å), 13.26 (6.6713 Å), 14.96 (5.9168 Å), and 20.28° (4.3751 Å) in 2θ scale. According to the d spacings of these peaks and considering those d spacing of the orthorhombic crystalline structure indexed by Rodríguez-García et al. [
1], the peaks at 14.96 (10% OA), 18.30 (5% OA), 20.28 (10% OA), and 23.70° (5% OA) found in rice extruded starches, directly corresponded to the peaks of the directions (121), (220), (040), and (132) with an RSD of 0.37, 0.27 and 0.60%, respectively. In the case of the peaks at 11.70 and 13.26° (2θ) found in rice starch extruded with 10% OA, these peaks are not found in an orthorhombic structure. However, the half d value (3.779 Å and 3.336 Å, respectively) corresponded to the
hkl directions (132) and (051), with an RSD of 0.79 and 0.09%, respectively.
On the other hand, the potato starch extruded with 5% OA (
Figure 2d) increased the relative intensity of 12.34 (7.1665 Å), 13.16 (6.7218 Å), and 22.5° (3.9447 Å) 2θ scale. Meanwhile, extruded potato starch with 10% OA showed peaks at 7.72 (11.4418 Å), 15.04 (5.8855 Å), 17.20 (5.1510 Å), 18.92 (4.6864 Å), 21.62 (4.1068 Å), and 25.24° (3.5254 Å) 2θ. Applying the same analysis, the peaks at 22.52 (5% OA), 15.04 (10% OA), and 17.20 (10% OA) directly correspond to the
hkl directions (040), (120), and (121) of the hexagonal crystalline structure, with an RSD respect to the reported value [
1] of 0.54, 0.39, and 0.15%, respectively. Meanwhile, peaks at 7.72 (10% OA), 12.34 (5% OA), 13.16 (5% OA), 18.92 (10% OA), 21.62 (10% OA), and 25.24° (10% OA) does not belong to a hexagonal crystalline structure. However, the half d value (5.7209, 3.5834, 3.3609, 2.3432, 2.0534, and 1.7627 Å, respectively) correspond with the
hkl directions (120), (032), (013), (161), (442), and/(452) of the hexagonal structure [
1], with an RSD of 5.72, 3.58, 3.36, 2.34, 2.05, and 1.76%, respectively.
It is known that the X-ray pattern of starch depends directly on its crystalline structure, being the lamella its main morphological component. The behavior observed in rice and potato extruded starches without OA suggest partial destruction of the crystalline structure. However, the d spacings and the RSD found in extruded starches with OA may suggest a lamellae growth due to the thermomechanical processing generated during the extrusion process a possible interaction of lamellae with the OA. In that sense, the OA could be working as a stabilizer agent of the lamellae structure, being more evident in the potato starch extruded with 10% OA due to the number of peaks differing with the isolated hexagonal crystalline structure. The above could be due to the large number of water molecules presented in the hexagonal structure, where the extrusion process loses part of these molecules. Therefore, the lipid can be placed into the helical structure, stabilizing this. However, detailed research is needed to understand the mechanism behind this phenomenon accurately.
3.3. Thermal Properties
Table 2 shows the thermal properties of isolated, extruded, and extruded starches with 5% and 10% oleic acid. Regarding the rice starch, the gelatinization was found between 64.4 and 76.5 °C, with an enthalpy (ΔH) of 1.77 ± 0.04 J/g for isolated starch. It has been reported temperature ranges for rice starch gelatinization ranging from 57 to 97 °C, and enthalpy of up to 1 J/g, depending on the variety and the amylose/amylopectin ratio [
17]. After the extrusion process, the gelatinization enthalpy was reduced to 1.59 ± 0.03 J/g, indicating a partial gelatinization of the starch due to the pressure, temperature, and shear reached the process. Meanwhile, in extruded starches with 5% and 10% of oleic acid, the gelatinization enthalpy was reduced to 0.64 ± 0.01 and 0.96 ± 0.02 J/g, a higher enthalpy using 10% of oleic acid.
As for the potato starches, the gelatinization for isolated starch was found between 61.9 and 68.5 °C, with an enthalpy of 2.13 ± 0.03 J/g (
Table 2). After extrusion, the gelatinization enthalpy decreased to 1.80 ± 0.04 J/g, suggesting partial starch gelatinization and crystal damage. Finally, in potato starch extruded with oleic acid, the gelatinization enthalpy decreased to 0.97 ± 0.02 and 1.56 ± 0.03 J/g for 5% and 10% OA, showing a greater enthalpy when using 10% of oleic acid.
The enthalpy reduction is mainly related to damage of the starch granules and intermolecular bonds rupture by the temperature, pressure, and mechanical work applied during the extrusion, modifying its physical properties [
18]. The extruded starch showed partially gelatinized granules (
Figure 1), and loss of its relative crystallinity (
Figure 2), producing an amorphous material that requires less energy to reach complete gelatinization. It means that the gelatinization in starch is closely related to the nanocrystal solvation (orthorhombic and hexagonal).
Additionally, it was observed some variations in the initial (T
0), peak (T
p), and final temperature (T
e) of the gelatinization, depending on the treatment. Such behavior is attributed to the fact that the gelatinization temperature is influenced by intrinsic factors such as amylose content, distribution of amylopectin chains, lipid-amylose complexes, and crystal structures [
19]. Likewise, it has been reported that the parameters of T
0, T
p, T
e, and ΔH are influenced by the architecture of the crystalline regions [
20]. Such intrinsic crystallinity of the granules can be altered and diminished during gelatinization through the extrusion process to a more amorphous state [
21]. These can explain the variations observed in the gelatinization temperatures. Our results show that the crystallinity changes due to the extrusion produce damage in the crystal, but not necessarily a more amorphous state. The gelatinization enthalpies hint that there are some starch granules without gelatinization in extruded starches with 10% of oleic acid, being more marked in rice starch. The above agrees with what was observed in the microstructure (
Figure 1, 10% OA).
On the other hand, the thermogram of extruded starches with 5% and 10% of oleic acid showed a second transition between 101 to 120 °C, which is typical of the fusion of the type IIa amylose lipid complexes. As for the rice starch, this transition was observed in extruded starch with 5% oleic acid, with an enthalpy of 0.14 ± 0.03 J/g. The potato starches extruded with 5% and 10% oleic acid showed amylose-lipid complex type IIa, with an enthalpy of 0.14 ± 0.01 and 0.91 ± 0.02 J/g for 5% and 10% oleic acid. The above indicated a more significant interaction between potato amylose and oleic acid. In that sense, it has been reported that short and medium-chain fatty acids (<12 carbon units) demonstrate low susceptibility to the formation of complexes with amylose since these can easily precipitate in aqueous solutions [
22]. For our study, the samples were extruded with oleic acid, constituted by 18 carbon units, so it is more probable the amylose-lipid interaction. In that sense, the amylose-lipid complex’s dissociation energy in potato extruded starches increased as the OA concentration rose. Such behavior may be related to the d spacing displacement compared to the isolated hexagonal structure (
Table 1), where oleic acid-amylose complexes could be one of the responsible factors for this displacement stabilization of the crystalline lamellae.
3.4. Viscosity Profiles
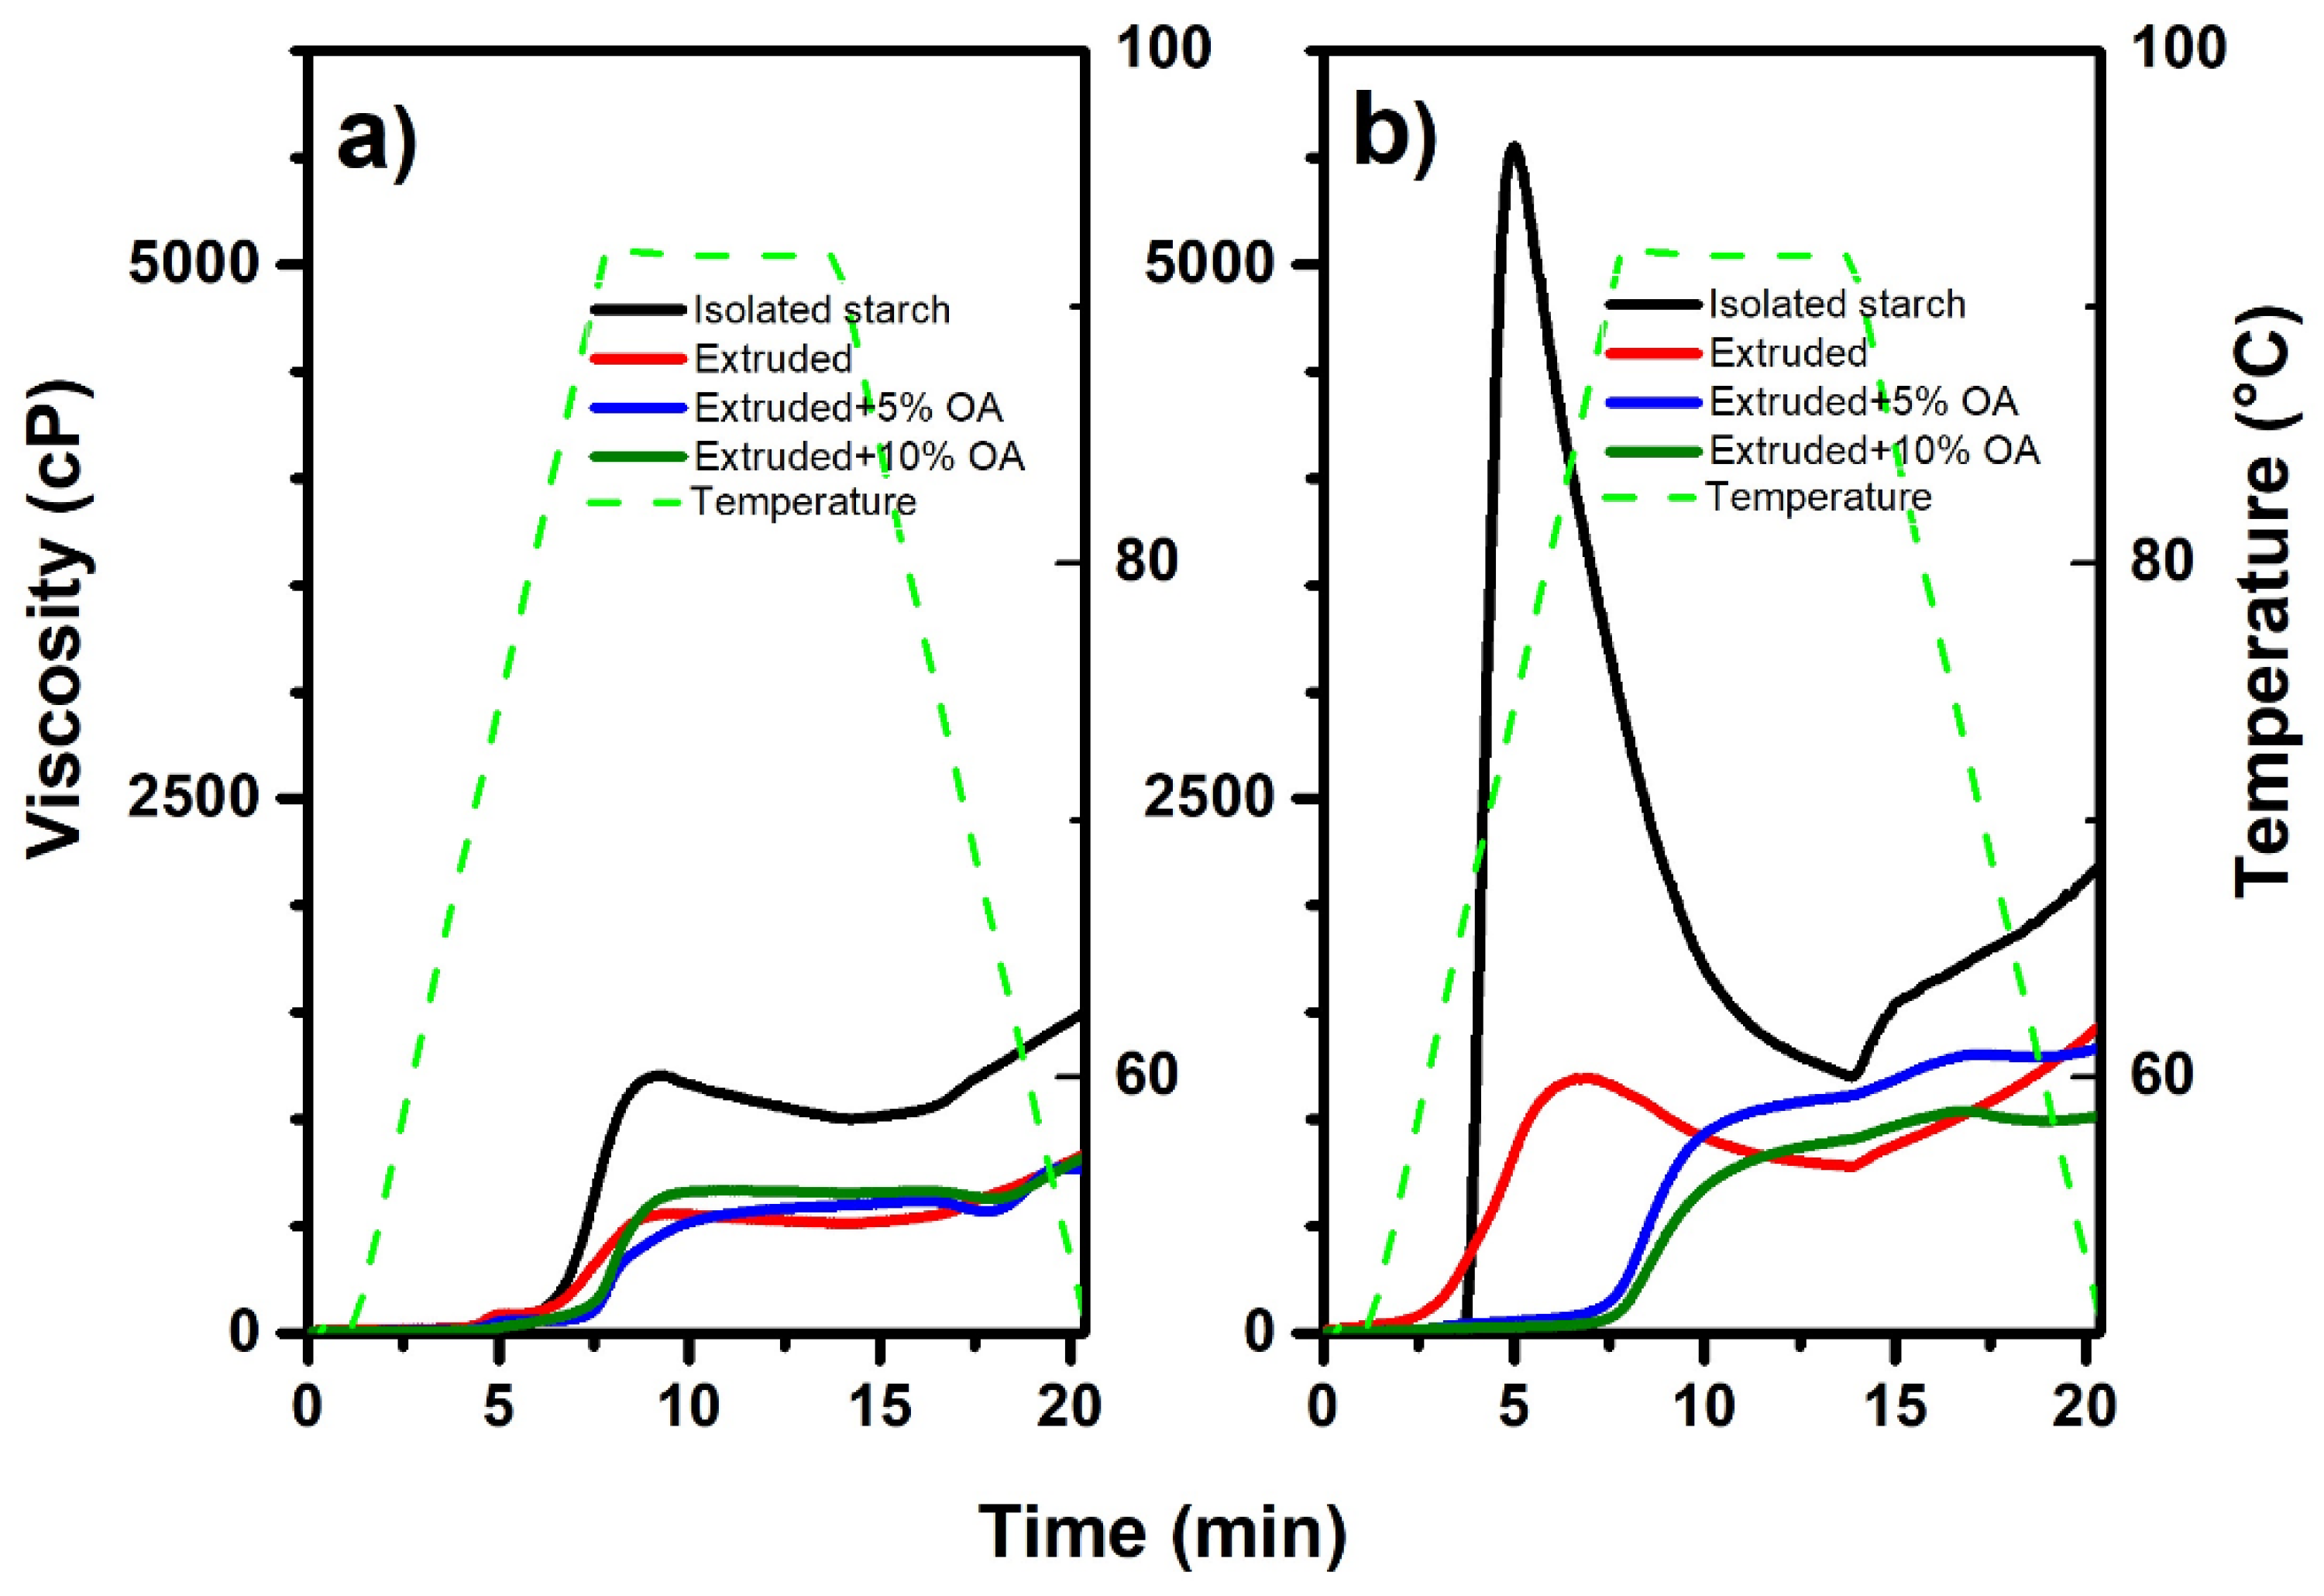
Figure 3 shows the viscosity profile of isolated, extruded, and extruded starches with 5% and 10% of oleic acid.
Figure 1a,b shows the viscosity profile of rice and potato starch treatments, respectively. The extrusion process showed a significant effect (
p < 0.05) on the viscosity profile, regardless of the source. In that sense, in rice extrudates, the maximum viscosity was reduced from 1523 ± 26 cP (isolated) to 850 ± 15 cP (extruded) (
Figure 3a). The same reduction was observed regarding the potato starch treatments (
Figure 3b), starting from 5499 ± 78 cP in isolated and decreasing to 1425 ± 24 cP when extruded. The above may result from heat treatment and mechanical work (shearing) that the starch granules were subjected to during extrusion, which damaged their structural integrity, causing the disruption of inter and intramolecular hydrogen bonds, hindering their ability to absorb water and gelling [
21]. Consequently, low viscosities at the maximum peak are a characteristic of extruded starches, corresponding to the results obtained, where it seems that partial hydrolysis of the granules has occurred (as observed in
Figure 1 and
Figure 2 and
Table 2).
The paste properties of an extruded starch have been demonstrated to be dependent on the processing conditions. Therefore, sample moisture, temperature, and processing time significantly influence the properties of starches. In that sense, higher temperatures and moisture favor the gelatinization of starch [
21].
Regarding rice starches extruded with 10% oleic acid, the maximum viscosity was statistically (
p < 0.05) equal to that of extruded starch. In contrast, the use of 5% gives the lowest viscosity with 740 ± 30 cP, indicating that with 5% oleic acid, rice starch presents more significant damage, which can be due to friction between granules, temperature, and pressure reached in the extrusion. On the other hand, extruded potato starch had the highest viscosity with 5% oleic acid (1322 ± 23 cP). These differences between rice and potato starch behavior can be mainly attributed to the potato chemical characteristics of the starch. In that sense, it has been reported that potato starch has phosphate groups distributed mainly along amylopectin and amylose linked in the C-3 and C-6 positions of glucose units. Phosphorylated starches, such as potato starch, have been shown to have a high hydration capacity and form highly viscous clear pastes [
23]. Therefore, it explains the differences between the low viscosity profile observed in isolated rice and the high viscosity profile of potato isolated starch. During the extrusion with 10% oleic acid, part of the fatty acid could be interacting with both phosphate groups and amylose, thus reducing its capacity to absorb water, obtaining a less viscous gel.
Interestingly, both potato and rice starch, when extruded with 5% and 10% oleic acid, showed a slight increase in viscosity by keeping a stable temperature of 92 °C, indicating more thermal stability. D’Silva et al. [
7] and Cervantes-Ramírez et al. [
10] had previously reported this unusual behavior in teff and corn starches added with stearic and oleic acid; suggesting that this increase in viscosity was partly due to an amylose interaction with the added fatty acid.
The final viscosity and pasting temperatures differed depending on the type of starch and the oleic acid concentration used in the extrusion. In that sense, the final viscosity of extruded rice starches with and without oleic acid behaved statistically equal (
p < 0.05), ranging from 740 to 850 cP. In contrast, potato starch, both extruded and extruded starch with 5% oleic acid was statistically equal (
p < 0.05), with an average of 1373 ± 73 cP. Whereas potato starch extruded with 10% oleic acid showed the lowest final viscosity (964 ± 78 cP). Regarding the pasting temperature, it was observed a tendency to increase according to the oleic acid concentration, where the extruded potato starch with 10% oleic acid exhibited the highest temperature with 87.19 ± 0.1 °C, with an increase of ~20 ° compared to the isolated starch (64.4 ± 0.2 °C). Multiple factors may be responsible for the rise in pasting temperature, such as the presence of ungelatinized starches (as shown in
Figure 1g,h). However, amylose inhibits the water absorption capacity of starches by forming lipid complexes during thermal processing, resulting in low peak viscosity and higher pasting temperature [
24]. The above is consistent with the thermal properties, where the potato starch extruded with 10% oleic acid showed the highest fusion enthalpy of the amylose lipid complex type IIa (
Table 2). In that sense, this behavior may be associated with the crystalline structure changes observed in extruded potato starch with 10% OA (
Table 1), where the stabilized crystalline lamellae could be needing more energy to disrupt and the subsequent paste formation.
The viscosity profiles found showed that the presence of oleic acid decreases the water absorption capacity of starches, leading to a decrease in the viscosity profile. Likewise, according to the thermal properties (
Table 2) and pasting temperatures, this change in the viscosity profile could be due to an amylose-lipid complex formation.
3.5. Resistant Starch Content
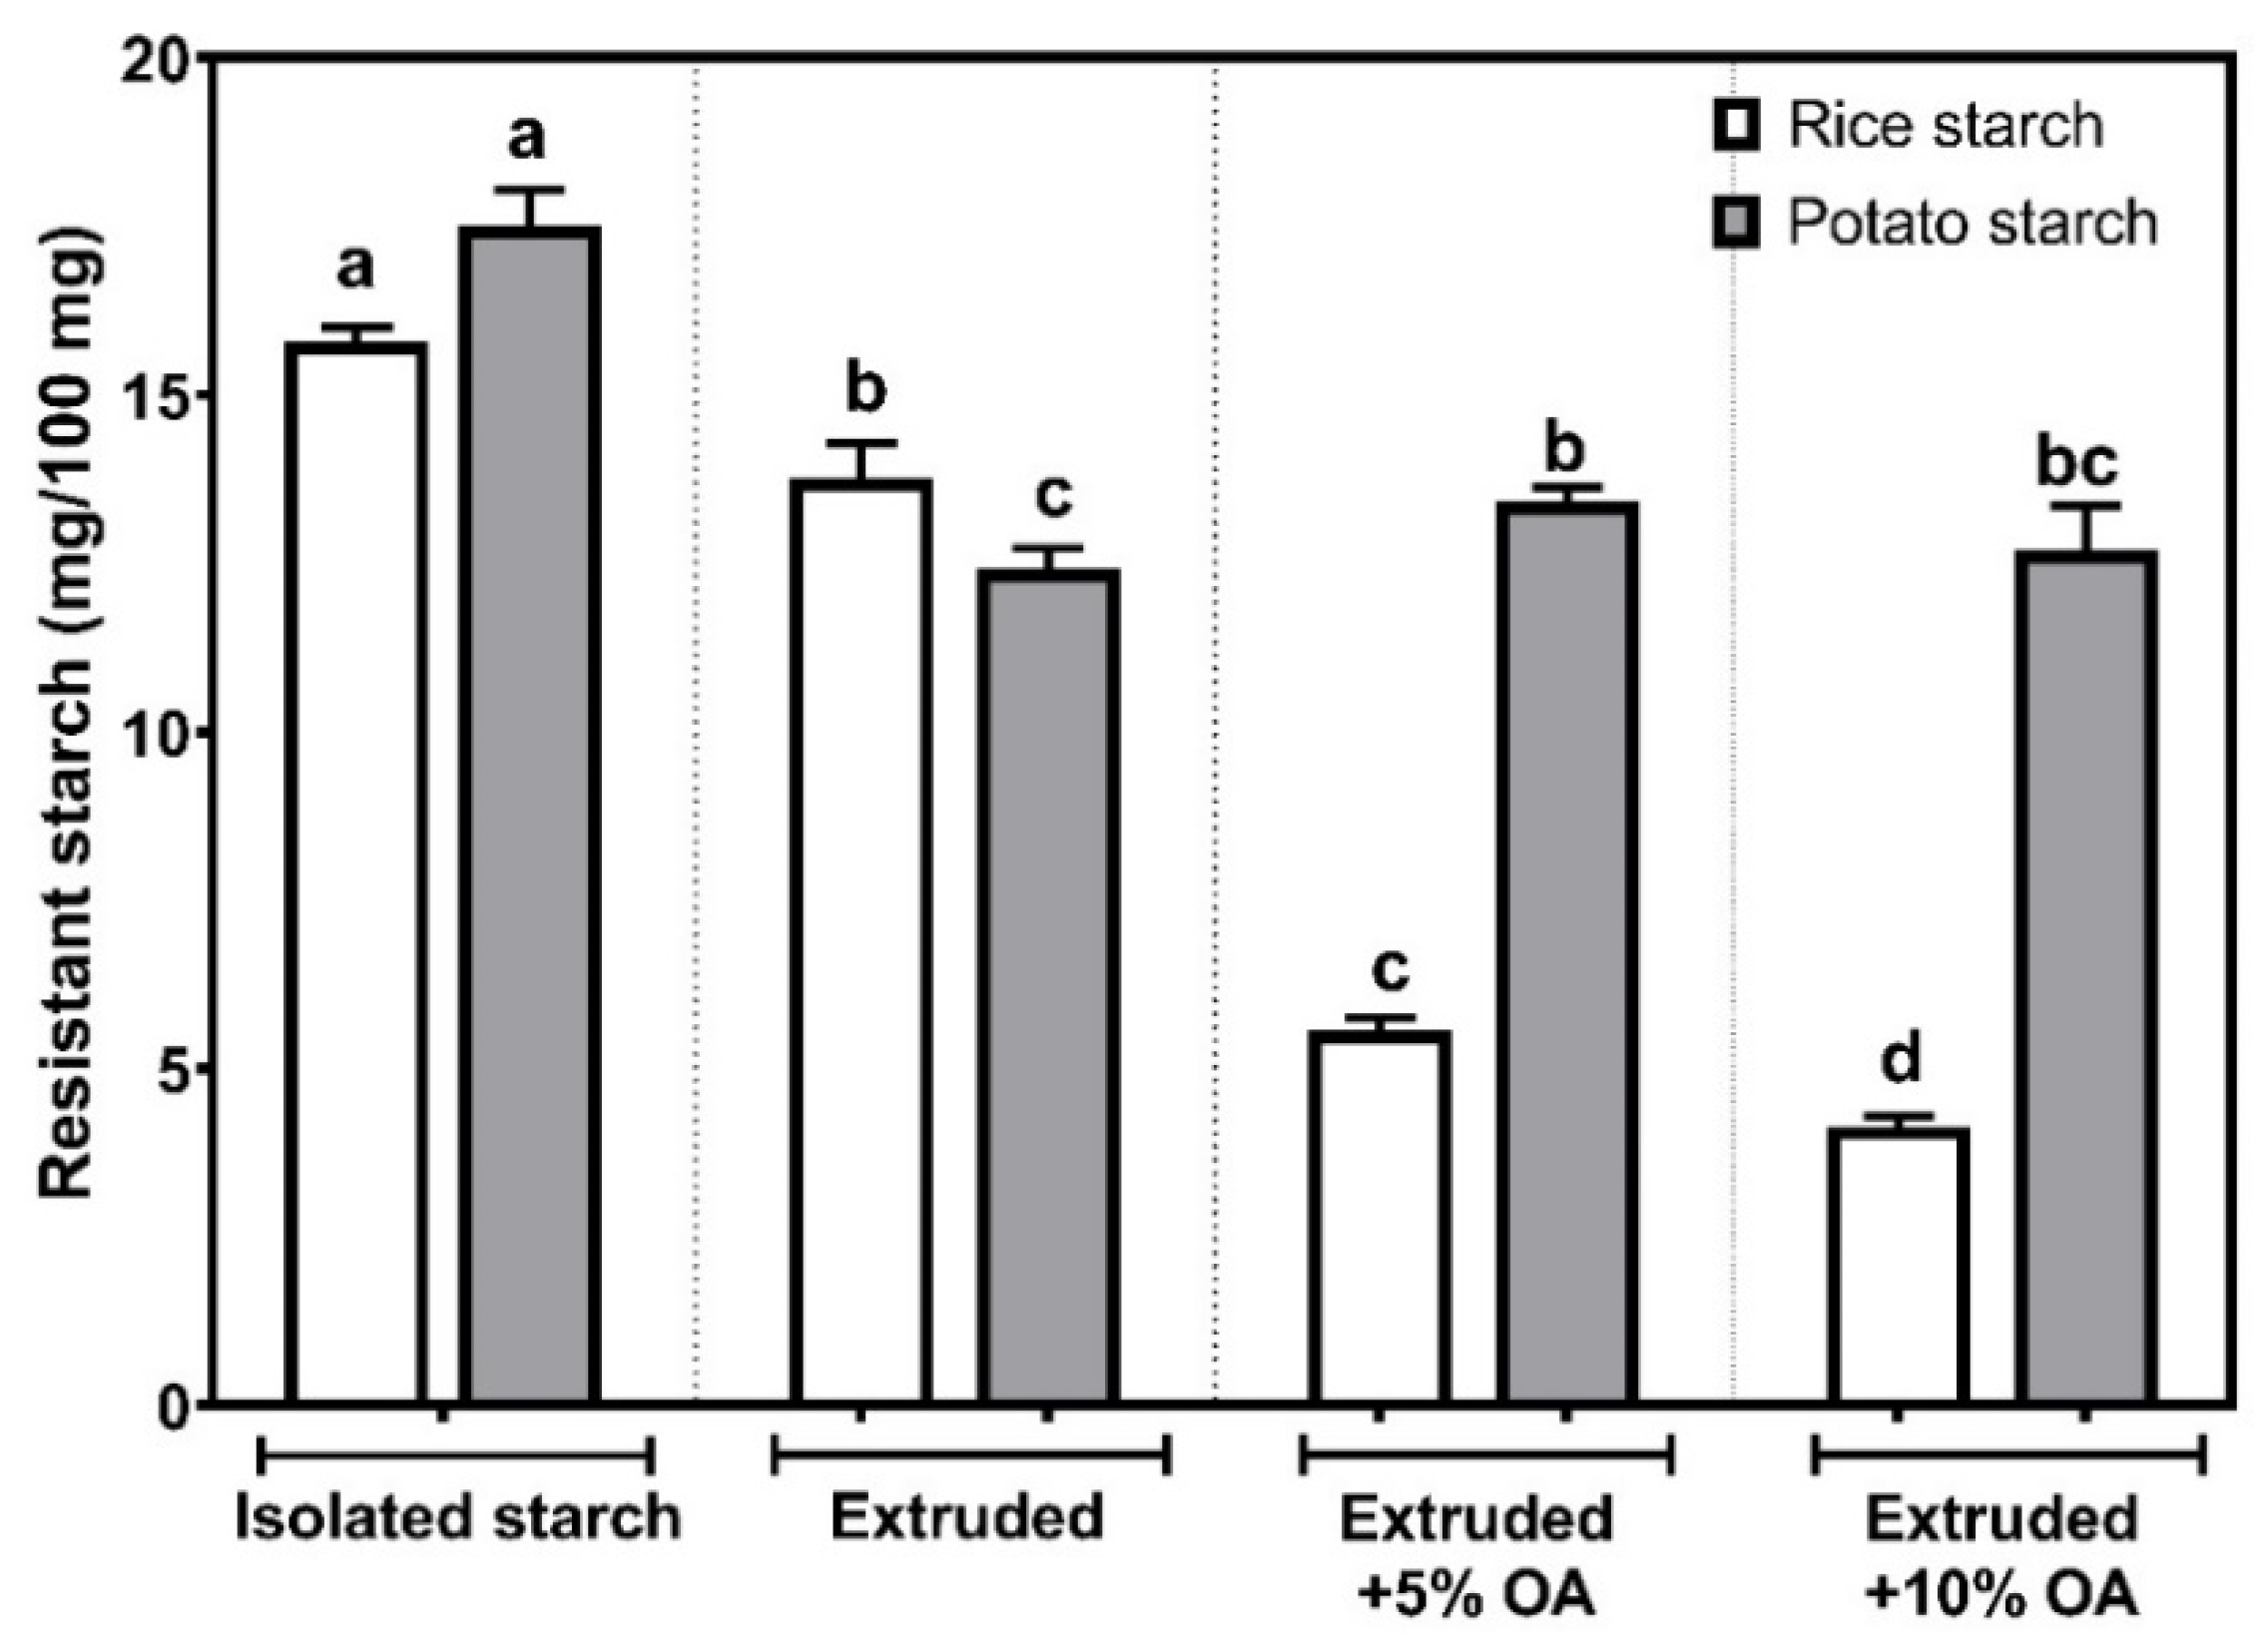
Figure 4 shows the resistant starch content (RS) in isolated, extruded, and extruded starches with 5% and 10% of oleic acid (OA). In isolated rice starch, the RS showed a content of 15.80 ± 0.21 mg/100 mg. The above agrees with 15.5% of resistant starch found in isolated rice by Zheng et al. [
25]. On the other hand, a significant reduction (
p < 0.05) in the RS was observed after the extrusion process, reaching 13.77 ± 0.51 mg/100 mg. Whereas, after being extruded with 5% and 10% oleic acid, the RS was reduced to 5.56 ± 0.04 and 4.14 ± 0.07 mg/100 mg.
Regarding potato starch treatments, isolated starch presented a RS of 17.51 ± 0.54 mg/100 mg, consistent with the broad range of 2 to 69% reported [
26,
27]. On the other hand, in potato starch extruded without oleic acid, the RS decreased to 12.41 ± 0.31, being the lowest value (
p < 0.05) among potato starches, representing a reduction of about 29%, compared to the isolated one. After extruding potato starch with oleic acid, no statistical differences (
p < 0.05) were observed between the concentration, ranging from 12.69 to 13.41 mg/100 mg.
Overall, it was observed that the extrusion process significantly reduces (
p < 0.05) the resistant starch content in rice, reducing it up to 74% when extruded with 10% oleic acid, compared with the isolated one. The above may be due to the loss of the granular structure observed in the microstructure after the extrusion process (
Figure 1, 10% OA). Likewise, this starch showed the lowest gelatinization enthalpy, lowest maximum viscosity, and the lowest final viscosity (
Figure 3a). Furthermore, rice starch extruded with 10% oleic acid did not dissociate the amylose-lipid complex type IIa transition (
Table 2). Hence, there was no affinity for rice starch to form complexes with oleic acid during extrusion, reducing its crystallinity and resistant starch content.
In the case of potato starches, it was observed that the starch extruded with oleic acid showed up to 8% more resistant starch content than that found in the extruded starch without oleic acid. It is important to highlight that potato starch extruded with oleic acid showed the highest pasting temperatures (
Figure 3b) and the highest melting enthalpies of the amylose-lipid complexes type IIa (
Table 2). The above may suggest that the 8% increase in RS in extruded potato starch with oleic acid is due to the formation of amylose-lipid complexes during thermal processing. Furthermore, it should be noted that this RS was only formed in a hexagonal structure of tuber starch, contrary to what happened in the orthorhombic structure of the cereal, where the AR content decreased. As shown in the X-ray, the potato starch promoted the lamellae crystalline growth due to amylose-lipid complexation during the extrusion with OA, generating a more thermally stable starch. Therefore, this complexation could be explaining the high RS contents observed in potato starch extruded with OA.
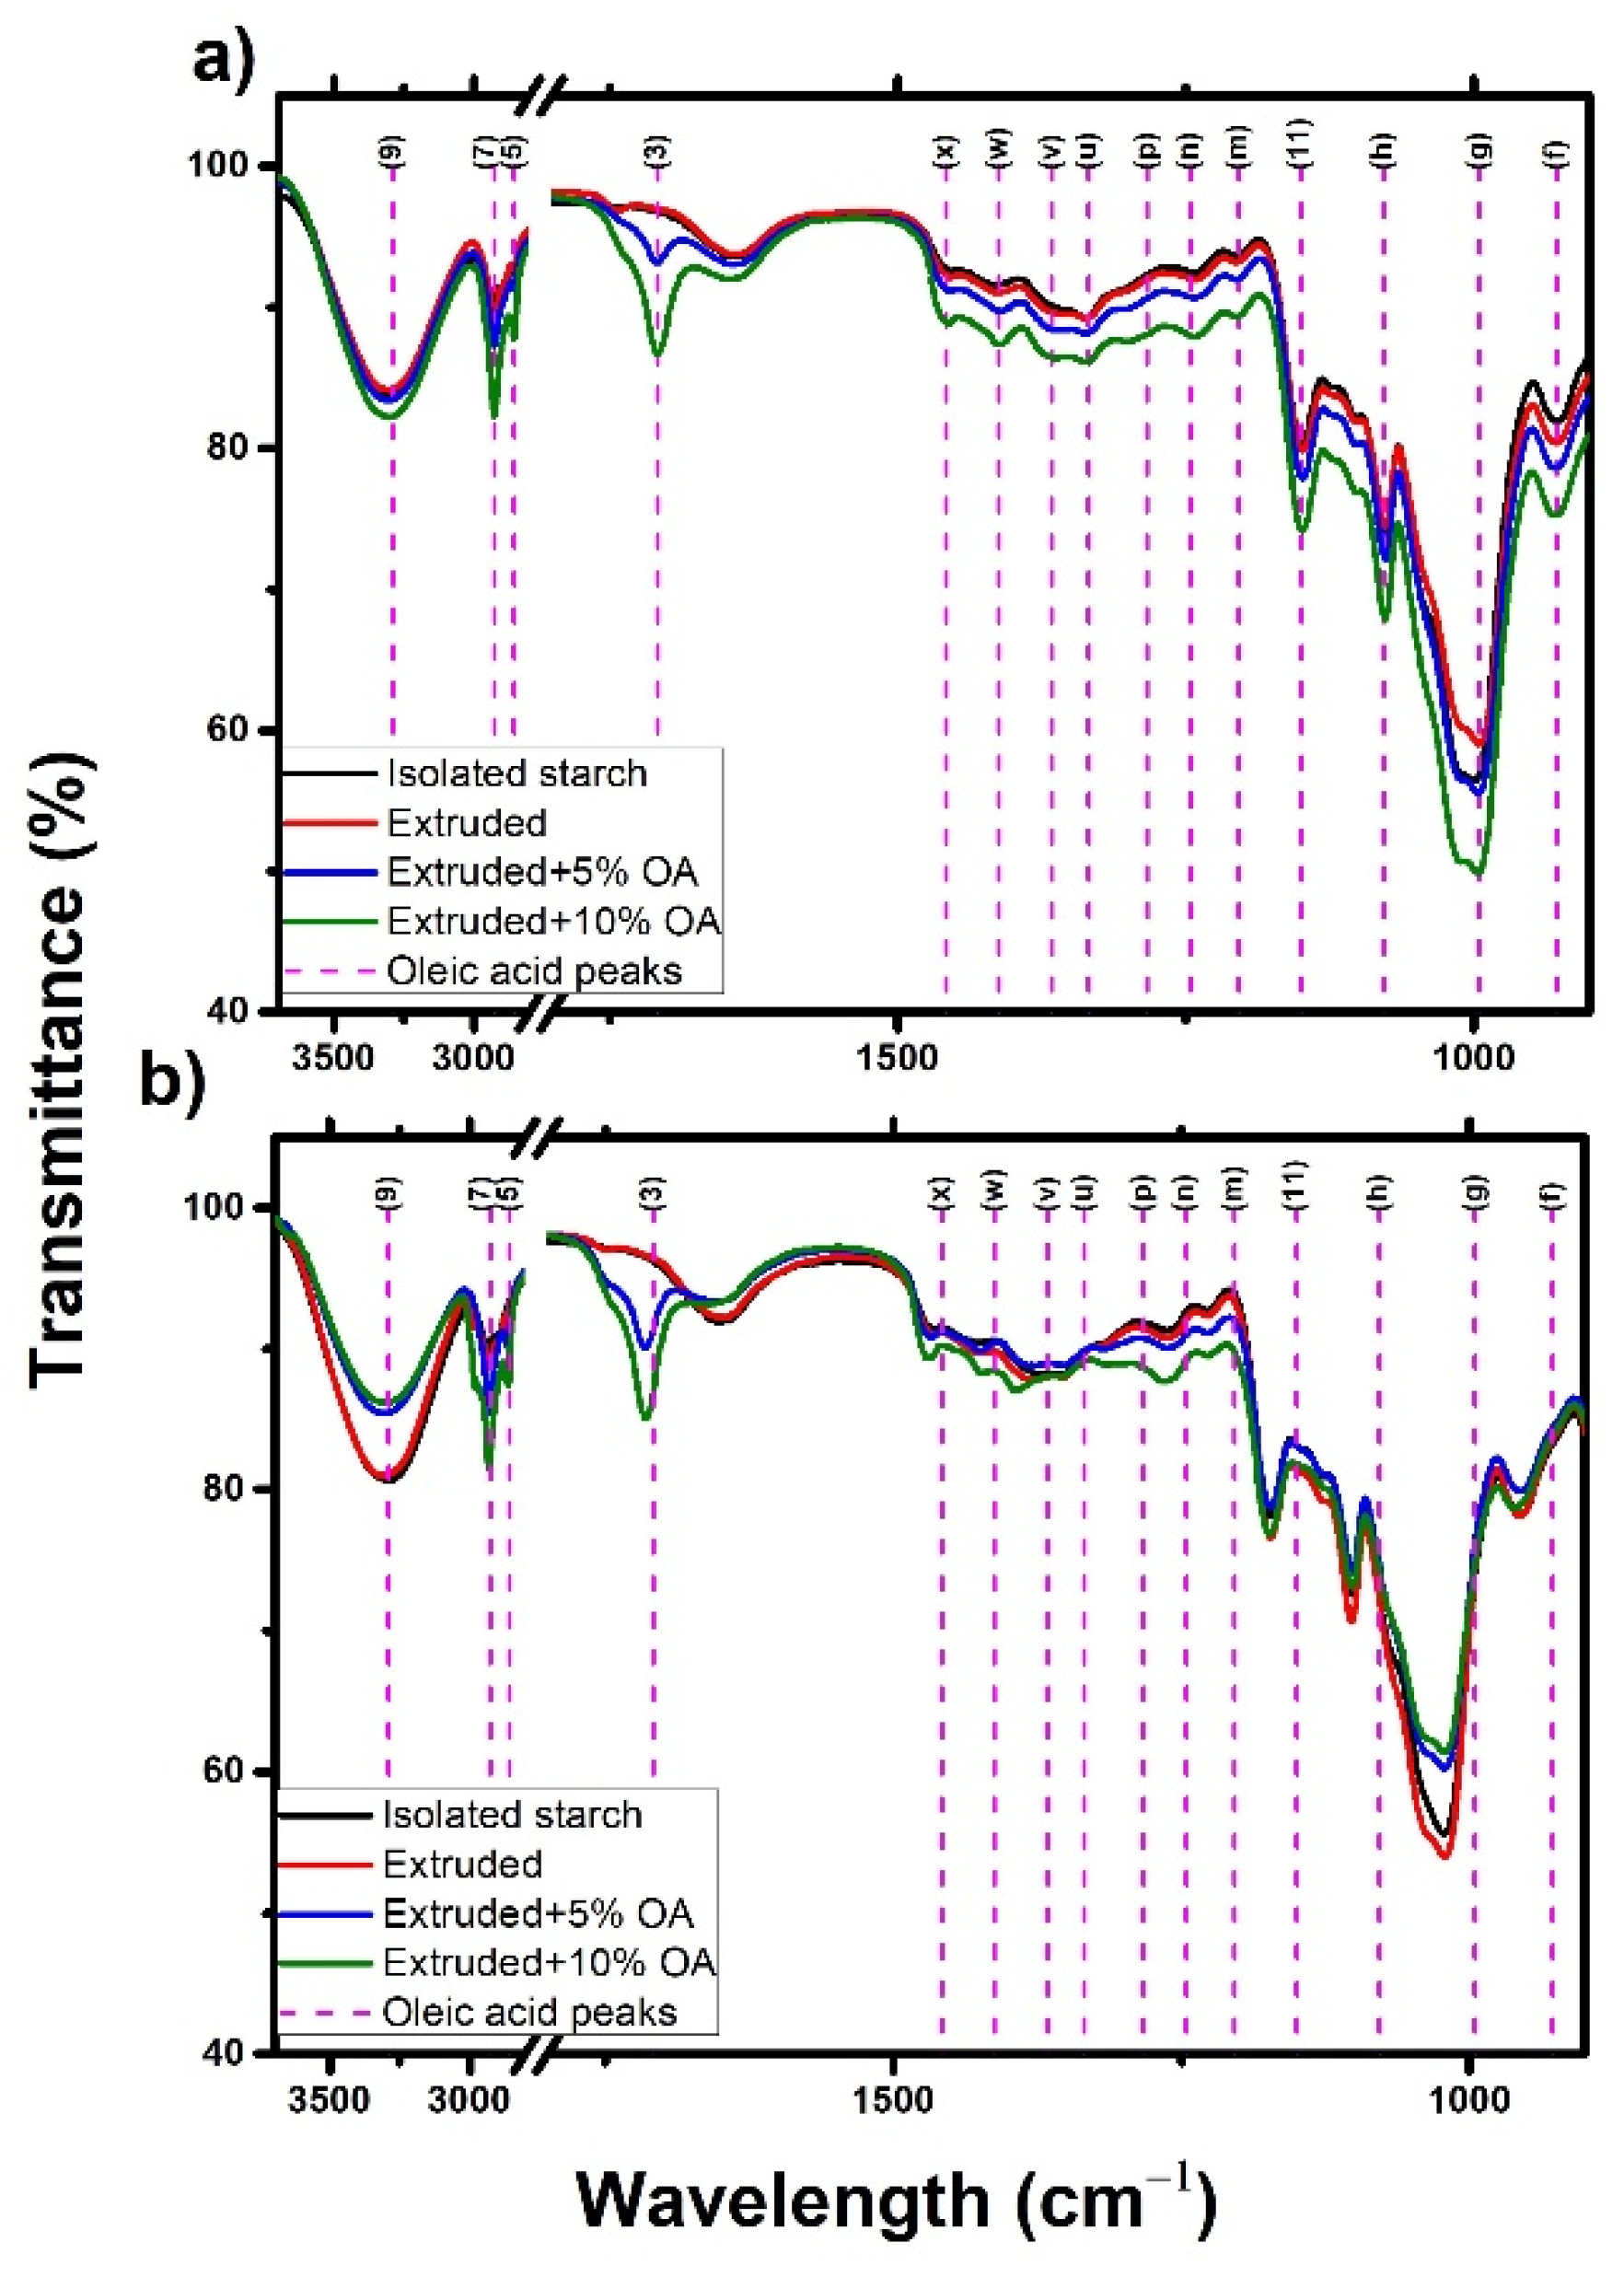
3.6. Infrared Spectroscopy
Figure 5 shows the infrared spectra of isolated, extruded, and extruded starches with 5% and 10% of oleic acid. Regardless of the starch source and treatment, all the starches showed the same characteristic peaks. The peak at 3289 cm
−1 (9) was associated with the symmetric stretching of the O–H and C–H groups from both oleic acid, water, and starch [
28]. On the other hand, the peaks at 2923 cm
−1 (7) and 2854 cm
−1 (5) were associated with the antisymmetric and symmetric stretching of the –CH2– and C–H groups, respectively. Meanwhile, the elongation and scissoring vibrations of the C=O and H–C–H groups were observed in the peaks 1708 cm
−1 (3) and 1458 cm
−1 (x). The peaks found at 1366 cm
−1 (v) and 1334 cm
−1 (u) were associated with the bending and deformation vibration of the functional groups C–H, C–OH, and –CH3. The peaks located around 1300 to 1000 cm
−1 correspond to the stretching (11 m, n, h), elongation (p), and bending (n) vibrations of the CO–H, C–C, and C–O groups of starch and fatty acid. Finally, 995 cm
−1 (g) was associated with the starch C–C skeleton bending vibration [
29]. Furthermore, the potato starch peaks located at 1150 cm
−1 (11), and 1078 cm
−1 (h) also exhibited the stretching vibration of the P=O, C–O–P, and O–P–O groups, typical of potato phosphorylated starch [
30]. Overall, it was observed that the IR spectra of starches remained unchanged, indicating that no new structures have been generated in the starch after the extrusion with and without OA.
It has been reported that a peak at 1715 cm
−1 is attributed to the formation of the lipid-amylose complex [
31]. However, as shown in
Figure 5, this peak is characteristic of oleic acid, representing the C=O stretching vibration from the carboxylic group (present in all fatty acids). Hence, this peak intensity will increase as the fatty acid concentration increases and does not necessarily mean that a significant number of amylose-lipid complexes have been formed.
According to the results, potato starch showed higher stability to the damage caused by the extrusion process. In contrast, rice starch was more susceptible to damage during extrusion, losing up to 21% of its order degree (OD), in agreement with the data observed in the resistant starch content (
Figure 4), in which a 74% reduction in the resistant starch content was observed compared to the isolated starch.
