Abstract
Westernization of traditional diets has been implicated in the rising burden of overweight/obesity and type 2 diabetes, especially in developing countries. In recent times, diet therapy is increasingly being recognized as an essential component of diabetes care. This study assessed the effect of diet therapy on body composition, antioxidant nutrient intake, and glycemic status in individuals living with type 2 diabetes (ILWT2D). In this prospective observational cohort study, 45 ILWT2D who were receiving diet therapy (personalized dietary counseling) in addition to standard medical treatment (intervention group) were compared with 45 ILWT2D receiving only standard medical treatment (comparator group). Antioxidant micronutrient intake was assessed using a 24-h dietary recall. Body composition indices, including body mass index (BMI), percentage body fat (%BF), and visceral fat (VF), were assessed. Participants’ fasting blood glucose (FBG), glycated hemoglobin (HbA1C) levels, and blood pressure (BP) were measured. All measurements were performed before and after a three-month period. There were significant improvements in BMI (27.8 ± 6.0 kg/m2 vs. 26.9 ± 5.5 kg/m2, p = 0.003), %BF (37.8 ± 11.9% vs. 35.5 ± 10.5%, p < 0.001), visceral fat (9.8 ± 3.4 vs. 9.1 ± 3.2, p < 0.001), systolic BP (136.9 ± 19.9 mmHg vs. 124.6 ± 13.0 mmHg, p < 0.001), FBG (8.8 ± 2.8 mmol/L vs. 6.7 ± 1.5 mmol/L, p < 0.001), and HbA1c (7.3 ± 1.0% vs. 6.4 ± 0.8%, p < 0.001) in the intervention group from baseline to endline, but not in the comparator group. In contrast, %BF increased within the comparator group (39.9 ± 7.8 vs. 40.7 ± 7.4; p = 0.029). Vitamin A intake increased significantly (227.5 ± 184.3 µg vs. 318.8 ± 274.7 µg, p = 0.038) within the intervention group but not in the comparator group (174.9 ± 154.3 µg, 193.7 ± 101.4 µg, p = 0.54). There were no significant changes in zinc, copper, selenium, and vitamin C intakes (p > 0.05) in the intervention group from the baseline to endline, unlike those in the comparator group who showed a significant increase in the intake of these nutrients. There was a significant increase in vitamin A intake among the ILWT2D who received dietary counseling as an intervention compared to those who did not. Additionally, the ILWT2D who received dietary counseling had significant improvements in their body composition (BMI, body fat, and visceral fat) and systolic blood pressure, compared to those who did not. The ILWT2D who received the intervention had significantly better glycemic control (FBG and HbA1c) than their counterparts who did not. Thus, this study suggests the potential of diet therapy as a viable non-pharmacological treatment approach for individuals living with type 2 diabetes.
1. Introduction
Diabetes mellitus (diabetes) is a disease that imposes a huge burden on global public health systems, especially in low- and middle-income countries (LMICs) [1,2]. It is well known that diabetes is a metabolic disorder characterized by chronic hyperglycemia, with disturbances in macronutrient metabolism resulting from impaired insulin secretion, insulin action, or both. Persistent hyperglycemia could pave the way for several life-threatening [3,4,5,6] complications leading to high healthcare costs, low productivity, and low quality of life at the individual, community, and national levels [3,4,5,6].
Globally, diabetes is a major contributor to morbidity and mortality, accounting for a significant proportion of the 41 million annual deaths attributed to non-communicable diseases, with approximately 78% of these deaths occurring in LMICs [1]. The world’s population with diabetes is projected to increase to 578 million (10.2%) by 2030 and to 700 million (10.9%) by 2045 [7]. In sub-Saharan Africa, 19.4 million people were living with diabetes in 2019, and this is estimated to rise to 28.8 million by 2030 and 47.1 million by 2045. In Ghana, the prevalence of type 2 diabetes increased from 6.5% in 2019 [8] to 7.5% in 2023 [9].
Generally, diabetes management involves both pharmacological treatment and lifestyle interventions [10]. The lifestyle interventions, mainly dietary and lifestyle modification, are recognized as a cornerstone in diabetes management, especially type 2 diabetes [11,12]. In recent times, diet therapy for type 2 diabetes has gained a lot of attention due to its clinical efficacy and cost-effectiveness [11,13,14,15]. There is evidence that lifestyle interventions for managing type 2 diabetes are effective when delivered by healthcare professionals in a hospital setting, especially in LMICs [11,16]. Previous studies have also highlighted the value of incorporating personalized diet prescription as a key component of these interventions [15,17].
Although the main underlying mechanism for the development of type 2 diabetes is insulin resistance, oxidative stress has been implicated in the pathogenesis and progression of type 2 diabetes [18,19,20,21]. Persistently elevated blood glucose concentration leads to increased reactive oxygen species (ROS) production, intensifying oxidative stress [22,23,24]. This oxidative stress condition impairs beta-cell function, enhances insulin resistance, stimulates oxidation of biomolecules, and promotes atherosclerotic complications, including hypertension [25,26]. It has been well established that diabetes independently confers atherosclerotic cardiovascular disease risk, which explains the high prevalence of hypertension and other cardiovascular disorders in individuals with type 2 diabetes [27]. In view of this, clinical management of diabetes has primarily focused on controlling blood glucose and blood pressure to prevent the onset of micro and macrovascular complications [10,13,28], while comparatively less emphasis has been placed on addressing oxidative stress. Additionally, dietary management of type 2 diabetes in the clinical setting has also primarily focused on modification of macronutrient intakes [13] with little emphasis on the role of antioxidant nutrition despite the increasing evidence in recent times [29,30,31,32,33].
In view of the potential deleterious effects of hyperglycemia-induced oxidative stress, antioxidant nutrition is increasingly being recognized as essential for optimal glycemic control and prevention of diabetes complications [29,30,31,32,33]. Aside from diet therapy having the potential to promote weight loss and improve insulin sensitivity and clinical outcomes in individuals living with type 2 diabetes (ILWT2D) [11,13,14,34], it also has the potential to boost antioxidant nutrient intake. A study in Ghana by Osei et al. [16] reported improvements in metabolic syndrome characteristics among patients who followed diet therapy for three months. Evidence from previous studies has also shown an association between intake of antioxidant nutrients and improved glycemic control [30,31,33].
Studies have shown that the majority of ILWT2D who are receiving treatment continue to experience poor glycemic control [21,22], especially in low-income countries [35,36]. In LMIC settings like Ghana, where healthcare budgets have been constrained following austerity measures implemented by governments still grappling with the post-COVID-19 economic crisis [37,38,39], integrating diet therapy into the management of ILWT2D could be a cost-effective strategy, potentially freeing up resources for other pressing socioeconomic needs. For instance, in Ghana diet therapy services/consultation costs about GHS 50 or less (~USD 3) per month, while a monthly supply of biguanides (metformin) medicine, the first line treatment option for type 2 diabetes costs the healthcare system between GHS 150–225 (USD 10–15). Antioxidant supplements are usually very expensive and are not financially accessible to many ILWT2D in low-income settings like Ghana. A recent study by Appiah et al. [29] showed that ILWT2D who regularly consume an antioxidant-rich tea had higher antioxidant status compared to those who did not. This suggests that diet could serve as a viable means for improving antioxidant status in ILWT2D in resource-limited settings where antioxidant supplements are likely unaffordable.
It is well known that a diversified diet increases the intake of micronutrients, including antioxidant nutrients [40,41,42]. In this regard, an overly restrictive diet therapy could potentially restrict the intake of micronutrients, including antioxidant micronutrients. There is limited documented information on the effect of diet therapy on antioxidant nutrient intake, body composition, blood pressure, and glycemic status in ILWT2D in Ghana. Therefore, this study sought to assess antioxidant nutrient intake, body composition, blood pressure, and glycemic status in ILWT2D receiving personalized dietary counseling intervention compared to those who did not.
2. Materials and Methods
2.1. Study Design and Participants
This was a prospective observational cohort study [43] conducted in two general hospitals in the Ashanti region of Ghana, between February and June 2021. Body composition, dietary intake of antioxidant nutrients, blood pressure, fasting blood glucose, and glycated hemoglobin were assessed in a group of ILWT2D receiving diet therapy (personalized dietary counseling) in addition to standard medical treatment (intervention group) in one of the hospitals with a resident dietitian compared to another group of ILWT2D who received only standard medical treatment (comparator group) in a different hospital without a resident dietitian. The intervention group consisted of 45 ILWT2D recruited from the diet therapy clinic of the intervention hospital, while the comparator group also comprised 45 ILWT2D recruited at the outpatient diabetes clinic in the comparator hospital. It is important to note that not all hospitals in Ghana are equipped with dietetic professionals to provide diet therapy for patients with diet-related conditions, primarily because of the limited availability of trained dietitians in the country. Additionally, constrained healthcare budgets often result in the prioritization of hiring medical and nursing staff over allied health professionals, like dietitians.
Participants in the intervention group received personalized dietary counseling following the low glycemic diet guidelines from the resident dietitian at the diet therapy clinic. The low glycemic diet has been shown to improve glycemic control, weight status, and other metabolic outcomes in persons with type 2 diabetes [44,45]. Each participant in the intervention group was counseled on dietary modification based on individualized calories and nutrient requirements, emphasizing portion control, whole grains, lean proteins, and low saturated and trans fats food sources. Participants in the intervention group attended routine monthly follow-up reviews with the dietitian in line with the protocol at the diet therapy clinic. However, for this study, a follow-up assessment was performed three months after the baseline assessment.
Withdrawing a patient from available treatment for research purposes is ethically unacceptable. Therefore, an external comparator group was [46], drawn from a general hospital without a resident dietitian during the study period, where participants received only standard medical treatment for diabetes independently provided by their physician. Participants were assessed within the same time frame as the intervention group. The endline assessment was performed three months after the baseline assessment. Additionally, to limit potential confounding effects of baseline differences, participants were purposively selected to reflect similar demographic characteristics and clinical status (both had poor glycemic control) at baseline.
2.2. Sample Size Determination
The sample size was determined using the formula by Charan & Biswas [47] for comparison between two groups when the outcome is quantitative data, as follows:
Sample size (n) = 2SD2(Z_(α/2) + Z_β)2/d2
Using the standard deviation (SD) of the mean HbA1c (8.9 ± 4.9%) in ILWT2D reported in a previous study in Ghana by Mobula et al. [48], an 80% power, a 95% confidence interval, and a minimum sample size of 64 participants was obtained (32 from in the treatment group and 32 in the comparator group). However, a total of 90 participants were enrolled in this study (45 in each group).
2.3. Sampling and Recruitment of Participants
The two hospitals where this study was conducted—one with a resident dietitian and the other without a resident dietitian—were purposively selected. Participants were conveniently recruited into the intervention and comparator groups from among eligible ILWT2D attending the intervention and the comparator hospitals, respectively. Eligible outpatients with type 2 diabetes who were 18 years and above, had not been diagnosed for more than a year prior to this study, and who had no other oxidative stress-inducing health conditions (such as diabetic foot ulcer, cancer, kidney disease, or liver disease) were recruited.
2.4. Measurements
2.4.1. Baseline Data Collection
At baseline, sociodemographic, anthropometric, dietary intake and biochemical data were collected.
- Sociodemographic Data
A semi-structured interview questionnaire was used to collect data on the sociodemographic characteristics of participants. Information collected at baseline included gender, age, marital status, educational status, occupation, monthly income, and medical history.
- Anthropometric Data
The height of participants was measured using a Seca® stadiometer (Seca, Hamburg, Germany), mounted against a wall and on a leveled floor. Participants were requested to remove their footwear and stand erect on the stadiometer with their arms hanging loosely before readings were documented. A weighing scale with body composition monitor (Omron HBF-514C, Dalian, China) was used to measure participants’ weight, percentage body fat (%BF), visceral fat (VF), and body mass index (BMI).
- Dietary Data
A 3-day 24 h dietary recall, including two weekdays and one weekend day, was used to assess the dietary intake of participants [49]. The 24 h recall was applied starting from the most recent meal backwards to limit recall bias. Research assistants were trained and closely supervised on the application of the 24 h recall by the researchers, who are registered dietitians. Ghanaian household handy measures [50] were used to estimate the quantity of the various foods consumed. A list of Ghanaian foods and their handy measures and equivalent weights in grams was used to convert the quantities of foods recorded in the 24 h recalls into grams. A Nutrient Analysis Program (Department of Food Science and Nutrition, University of Ghana), based on the Ghanaian and West African food composition databases, was used to analyze the macronutrient (carbohydrate, protein, fat) and antioxidant micronutrient (vitamin C, vitamin E, vitamin A, selenium, zinc, and copper) intake of participants.
- Biochemical Data
A 5 mL venous blood sample was collected from each study participant by a professional phlebotomist at the two hospitals to determine HbA1c. The blood samples were stored in a blood collection cold box at 2–8 °C and transported to the clinical analysis laboratory at the Department of Biochemistry and Biotechnology, Kwame Nkrumah University of Science and Technology (KNUST), Kumasi, Ghana for analysis using the automated CLOVER A1c® Self system analyzer (Infopia Co., Ltd., Anyang-si, Republic of Korea) [51]. FBG was assessed onsite using a drop of blood from a finger prick using Exactive Vital digital glucometer (MicroTech Medical, Hangzhou, China) after an 8 to 12 h overnight fast.
- Fasting Blood Glucose Determination
A digital glucometer (ExActive vital from MicroTech Medical, Hangzhou, China) was used to measure the FBG of participants after an 8 to 12 h overnight fast using a drop of blood from a finger prick.
- Determination of Glycated Hemoglobin
The HbA1c levels of whole blood from venous samples, collected by the phlebotomist, from the study participants were determined using the CLOVER A1c® Self system at the Clinical Analysis laboratory, Department of Biochemistry and Biotechnology, KNUST, Kumasi, Ghana.
- Blood Pressure Measurement
A digital sphygmomanometer (Omron, Kyoto, Japan) was used to measure the blood pressure (systolic and diastolic BP) of participants. Following a minimum of 10 min rest, participants’ blood pressure was measured while seated. The measurement was repeated, and the average was documented.
2.4.2. Endline Data Collection
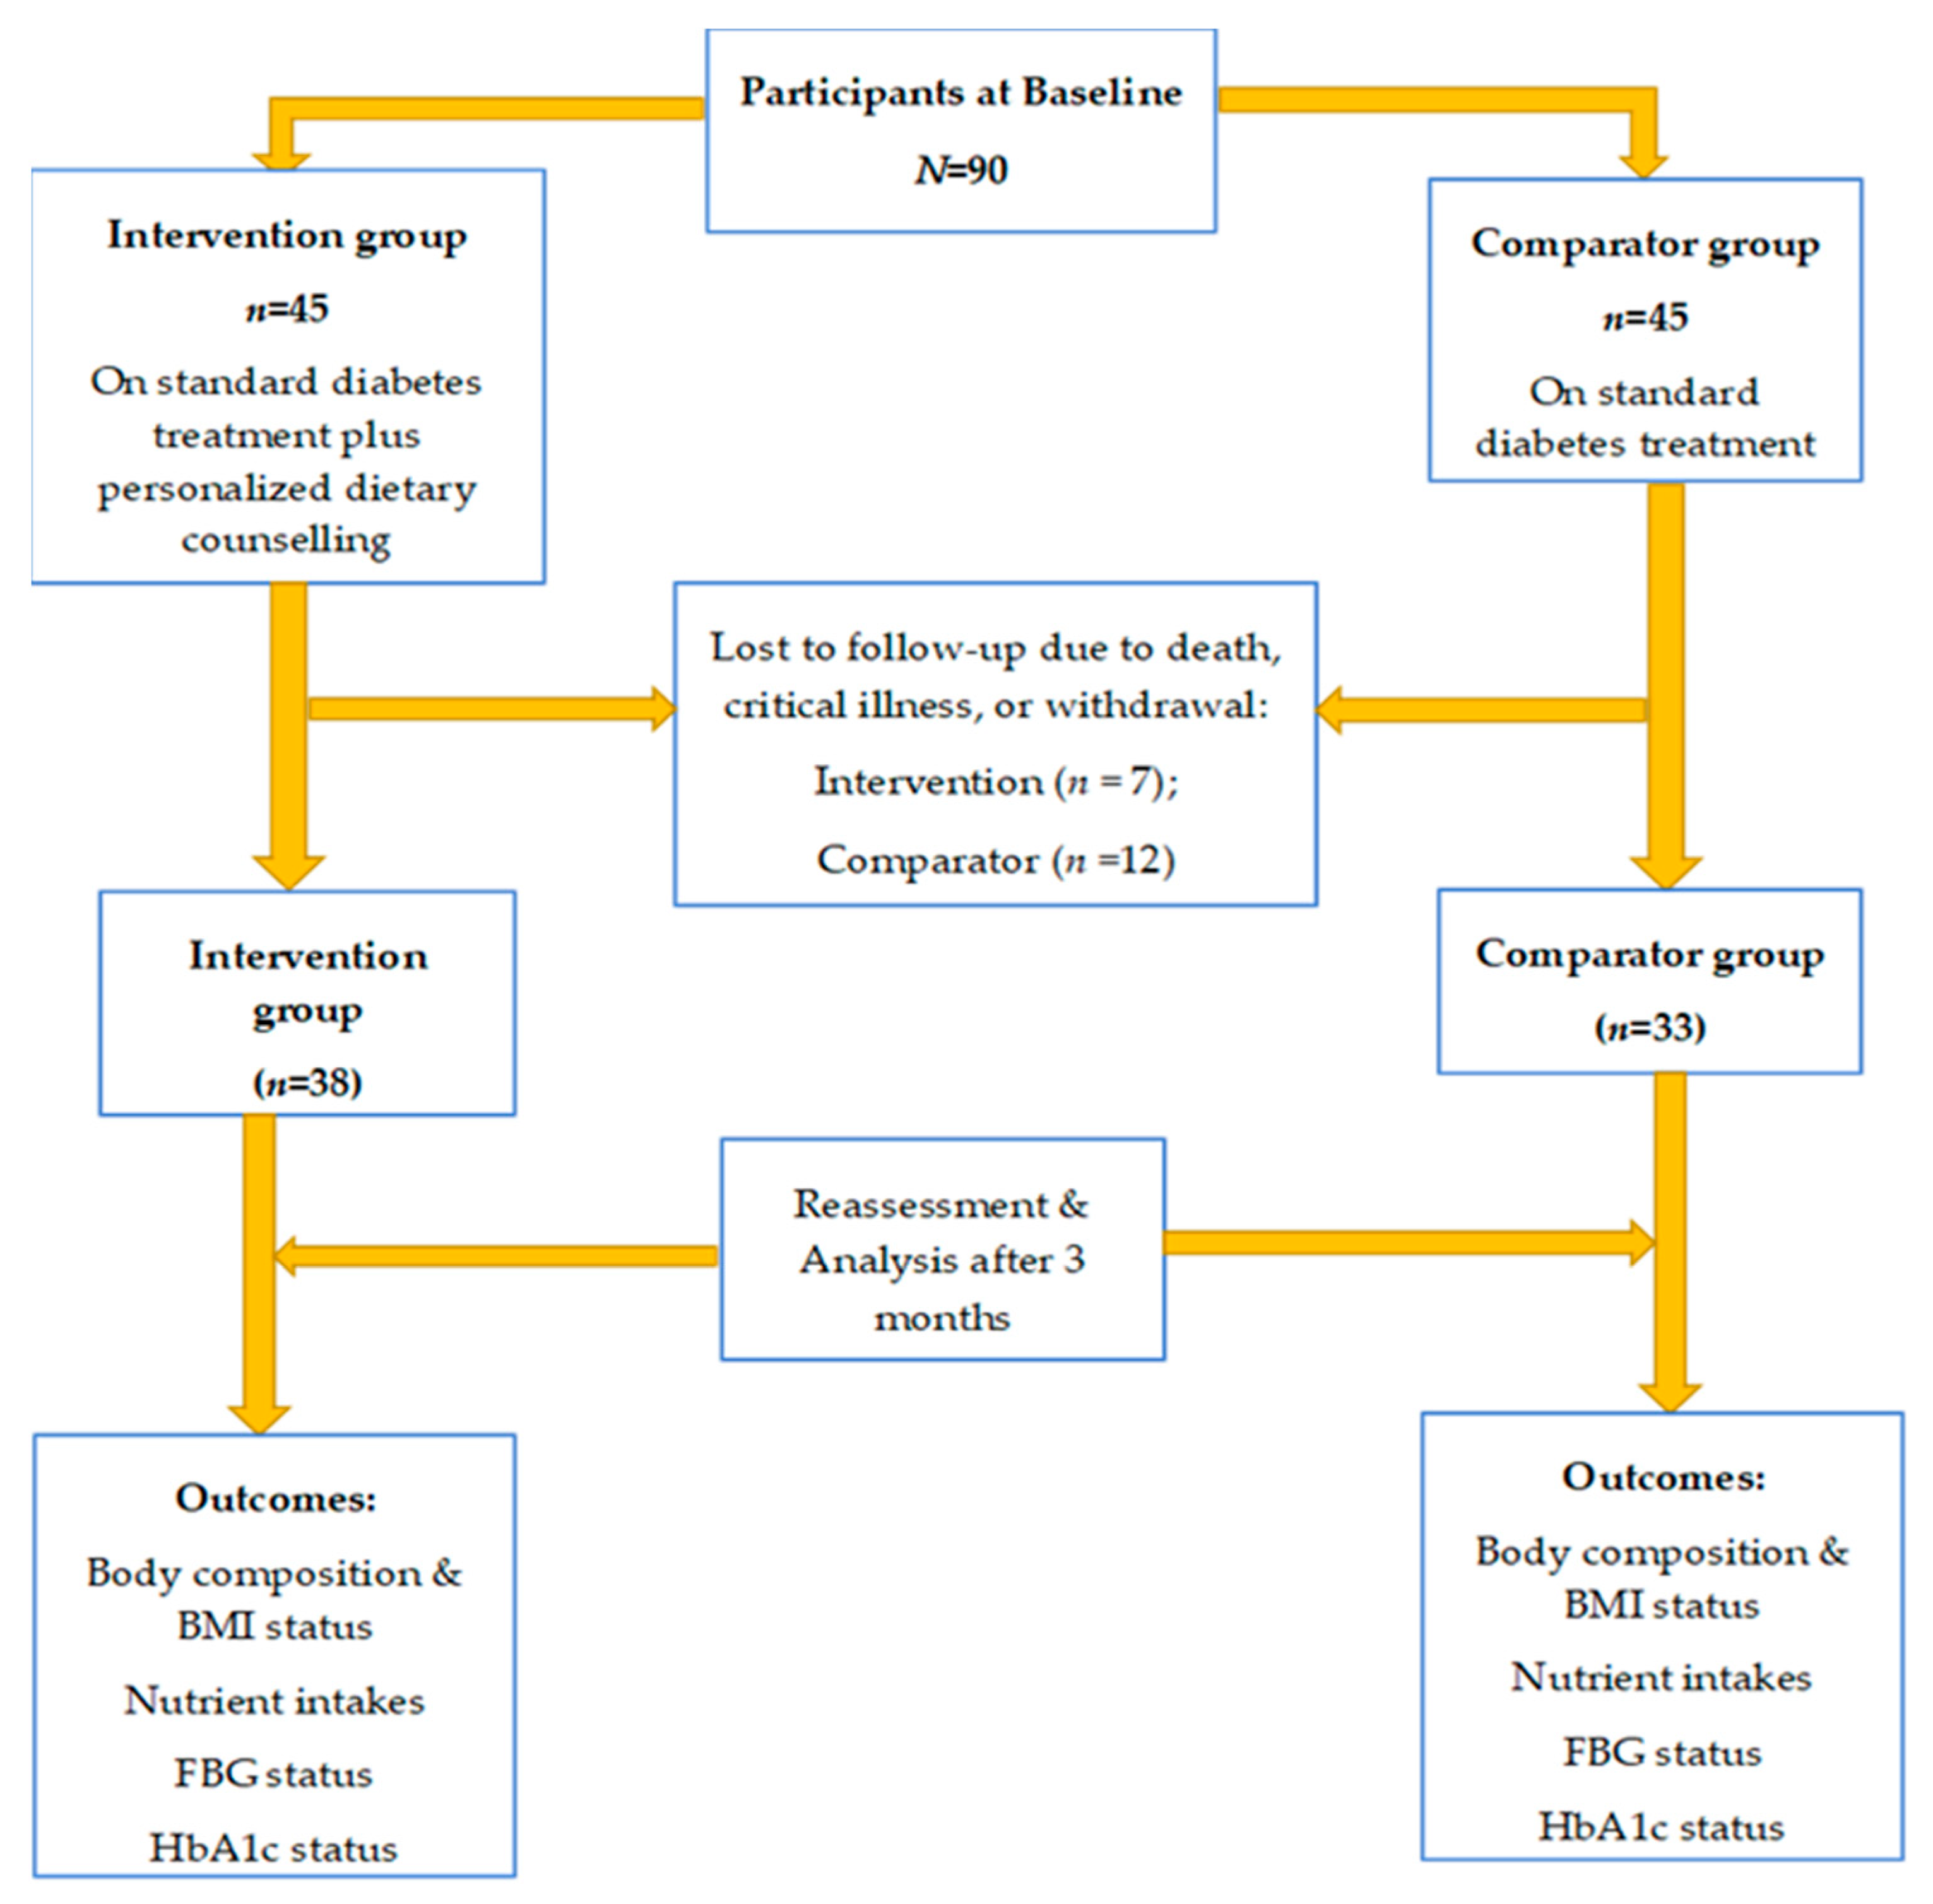
The participants in the intervention and comparator groups were reassessed on the same baseline parameters after three months. At the endline, three participants died, one was bedridden with a stroke and 15 dropped out of this study (due to personal reasons since participation was voluntary and participants could decide to drop out at any point in this study); hence, only 71 participants (38 in the intervention and 33 in the comparator) completed this study and were reassessed at endline (Figure 1).
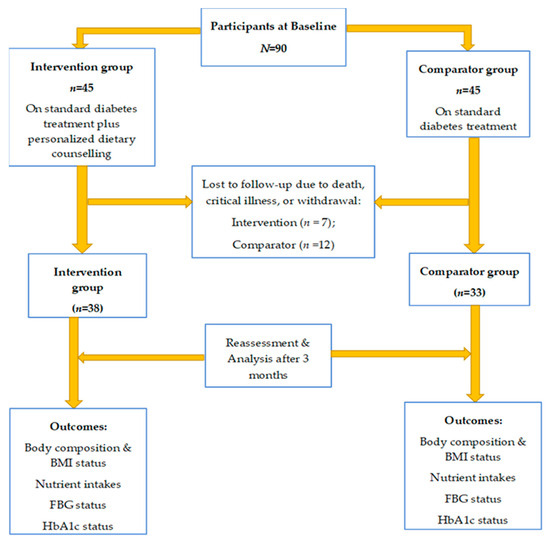
Figure 1.
Study procedure at baseline and endline.
2.5. Ethical Approval
Ethical approval for this study was obtained from the Committee of Human Research Publications and Ethics of Kwame Nkrumah University of Science and Technology (reference number: CHRPE/AP/085/21; approval date: 24 February 2021). Approval was also obtained from the management of the study hospitals (reference number: TH/ADM/25/1/21; approval date: 25 January 2021, and reference number: EJ/EGH/EJ-209/20; approval date: 20 January 2021). The principles of the World Medical Association’s Declaration of Helsinki were followed throughout this study. Informed consent was obtained from participants before recruitment into this study, and participation was completely voluntary.
2.6. Statistical Analysis
The data were analyzed using IBM Statistical Package for Social Sciences version 25 (SPSS, IBM Inc Chicago, IL, USA). The Kolmogorov–Smirnov test was used to assess whether all continuous variables met the assumption of normality. All the continuous variables (e.g., nutrients, anthropometric, and biochemical parameters) were normally distributed. Descriptive statistics were performed to describe the background demographic characteristics of study participants. Fisher’s exact test was performed to determine the statistical differences between categorical variables. An independent t-test was used to determine differences between continuous variables across the groups. Analysis was per-protocol. Statistical significance was set at p < 0.05.
3. Results
3.1. Participant Characteristics
Table 1 shows that there were no significant differences in the background characteristics of the participants in the intervention and comparator groups at baseline (p > 0.05). The majority of the participants in the comparator (84.4%) and intervention (71.1%) groups were females. More than half (51.1%) of the comparator group were middle-aged adults, while most (60%) of the participants in the intervention group were older-aged adults. A high proportion of the participants in the comparator (77.8%) and intervention (73.3%) groups had low educational status.

Table 1.
Sociodemographic characteristics of participants by study group.
3.2. Nutrient Intake of Participants Within Study Groups
The nutrient intake of participants within this study group at baseline and endline is shown in Table 2. Energy intake in the intervention group did not change significantly from baseline to endline (1454.6 ± 646.5 kcal vs. 1519.4 ± 534.7 kcal, p = 0.55). In contrast, the comparator group showed a significant increase in energy at endline (1584.7 kcal vs. 1283.3 kcal, p = 0.005). The energy intake among participants in the two groups was lower than the recommended dietary allowance (RDA) for adults [Male (40–70 years): 2857–2557 kcal; Female (40–70 years): 2256–2046 kcal]. Within the intervention group, there were no significant differences in dietary carbohydrates, fat and protein intakes between baseline and endline (226.9 ± 74.9 g vs. 215.3 ± 76.6 g, p = 0.41; 49.8 ± 25.1 g vs. 46.5 ± 28.4 g, p = 0.53; and 45.5 ± 18.6 g vs. 39.7 ± 17.1 g, p = 0.17), respectively. However, in the comparator group, intake of carbohydrates and protein increased significantly from baseline to endline (197.9 ± 54.6 g vs. 234.7 ± 50.6 g, p = 0.007 and 39.8 ± 13.0 g vs. 52.6 ± 14.8 g, p < 0.001). Although the mean vitamin A intake was below the RDA in both groups, a significant increase in intake from baseline to endline was observed in the intervention group (227.5 ± 184.3 µg vs. 318.8 ± 274.7 µg; p = 0.038) but not within the comparator group (p = 0.54). In both groups, vitamin C intake was within the RDA. There was a significant increase in vitamin C intake in the comparator group from baseline to endline (84.7 ± 30.4 mg vs. 102.6 ± 40.2 mg, p = 0.017); however, within the intervention group, there was no significant change in vitamin C intake (p = 0.24). Vitamin E intake remained below the RDA and did not significantly change within the two groups from baseline to endline (p > 0.05).
Table 2.
Nutrient intake of participants within the comparator and intervention groups.
3.3. Nutrient Intake of Participants Between Study Groups
Table 3 shows the nutrient intake between participants in the intervention and comparator groups at baseline and endline. The intervention group consumed significantly higher amounts of energy than the comparator group at baseline (1656.2 ± 837.1 kcal vs. 1320.4 ± 398 kcal, p = 0.024) but had a similar intake at endline (1454.6 ± 646.5 kcal vs. 1584.7 ± 374.9 kcal, p = 0.056). The intervention group had a higher fat intake than the comparator group at baseline (53.0 ± 29.1 g vs. 41.5 ± 19.3 g, p = 0.024) but similar intake at endline (46.5 ± 28.4 g vs. 48.1 ± 17.3 g, p = 0.33). Protein intake was similar between the intervention and comparator groups at baseline (48.1 ± 20.0 g vs. 40.6 ± 14.0 g, p = 0.08); however, the intervention group had significantly lower intake than the comparator group at endline (39.7 ± 17.1 g vs. 52.6 ± 14.8 g, p < 0.001). Carbohydrate intakes were similar between the two groups at baseline (p > 0.05) and endline (p > 0.05). The intervention group had significantly higher vitamin A intake than the comparator group at baseline (285.4 ± 235.8 µg vs. 169.2 ± 136.9 µg, p = 0.046) but statistically similar intakes at endline (318.8 ± 274.7 µg vs. 193.7 ± 101.4 µg, p = 0.05). There was similar selenium intake between the two groups at baseline (p = 0.22); however, at endline, the comparator group had higher selenium intake than the intervention group (80.6 ± 29.6 µg vs. 55.0 ± 24.4 µg, p < 0.001). Participants in both groups had similar intakes of vitamins C and E at baseline (p > 0.05) and endline (p > 0.05).
Table 3.
Dietary intake between participants in the intervention and comparator groups.
3.4. Anthropometric, Blood Pressure, and Blood Glucose Status of Participants Between Study Groups
At baseline, there was no significant difference in anthropometric parameters, blood pressure, and fasting blood glucose levels between the comparator and intervention groups (p ˃ 0.05). Although participants in the two groups had poor glycemic control (HbA1c > 7%), those in the intervention group had significantly higher HbA1c levels than those in the comparator group (p = 0.035). However, at endline, the intervention group had significantly better glycemic control than the comparator group (6.4 ± 0.8% vs. 8.0 ± 1.6%, p < 0.001). At endline, the intervention group had significantly lower systolic blood pressure, BMI, %body fat, visceral fat, fasting blood glucose, and HbA1c than the participants in the comparator group (p < 0.05) (Table 4).
Table 4.
Blood pressure, anthropometric, and biochemical parameters between these study groups.
3.5. Anthropometric, Blood Pressure, and Blood Glucose Status of Participants Within Study Groups
In Table 5, there were no significant differences in the BMI, visceral fat, blood pressure, and blood glucose parameters from baseline to endline within the comparator group (p > 0.05). Only %body fat increased significantly at endline within the comparator group (39.9 ± 7.8 vs. 40.7 ± 7.4%, p = 0.029). However, there were significant improvements in the BMI (27.8 ± 6.0 kg/m2 vs. 26.9 ± 5.5 kg/m2, p = 0.003), %body fat (37.8 ± 11.9% vs. 35.5 ± 10.5%, p < 0.001), systolic blood pressure (136.9 ± 19.9 mmHg vs. 124.6 ± 13.0 mmHg, p < 0.001), fasting blood glucose (8.8 ± 2.8 mmol/L vs. 6.7 ± 1.5 mmol/L, p < 0.001), and HbA1c (7.3 ± 1.0% vs. 6.4 ± 0.8%, p < 0.001) in the intervention group from baseline to endline.
Table 5.
Blood pressure and anthropometric and biochemical parameters within the treatment and comparator groups.
4. Discussion
In this non-randomized prospective observational cohort study, dietary intake, body composition, blood pressure, and blood glucose status were assessed and compared within and between two groups of ILWT2D: one group receiving personalized dietary counseling intervention in addition to standard diabetes treatment, while the other received standard diabetes treatment alone. The dietary counseling intervention involved dietary modification based on individualized calories and nutrient requirements, emphasizing portion control, whole grains, lean proteins, and low saturated and trans fat food sources. Participants who received dietary counseling intervention had significant improvement in BMI, percent body fat, systolic blood pressure, and glycemic control than those who did not.
For context, it is noteworthy that the non-randomized design applied in the present study could not inherently control potential confounding factors [43,55]. However, we observed that the demographic characteristics of the study participants did not differ significantly between the intervention and comparator groups. There were similarities in gender, age, educational level, marital status, and income distribution between the participants in the intervention and comparator groups. Additionally, although there were statistical differences between the HbA1c status of the two groups at baseline, the difference is not of clinical significance because the levels for both groups indicate poor glycemic control. Thus, at baseline, the glycemic status between the two groups was clinically similar. In the intervention hospital, where standard care included both diet therapy and medical treatment, healthcare professionals typically prioritised participants’ clinical status in treatment decisions. Although the comparison between the invention and comparator groups could be potentially confounded by inherent factors [43,46,55] as well as the differences observed in the study variables between the two groups at baseline, the comparison within the groups provides additional insights on the improvements observed in the outcome variables among the participants who received dietary counseling.
Excessive energy intake could lead to overweight/obesity, which could worsen insulin resistance and glycemic control [56]. In the present study, although the energy intake in the intervention and comparator groups seems lower than the RDA for physically active adults, the actual requirements by the study participants could potentially be lower depending on their physical activity status. Within the intervention group, there were non-significant reductions in energy, carbohydrate, fat, and protein intake over the three-month period. However, the comparator group exhibited significant increases in energy, carbohydrate, and protein intake during the same period. The observed differences may be attributed to the personalized dietary counseling intervention provided to the intervention group, which may have encouraged portion control and moderation in dietary intake, unlike the comparator group that did not receive such counseling. This suggests the potential of dietary counseling intervention in improving dietary intake in ILWT2D. Previous studies by Miller et al. [57] show that mindful eating practice among participants receiving nutrition intervention could improve dietary intake, weight loss, and glycemic control.
After the three-month period, a significant increase in levels of zinc, copper, and selenium intake was observed within the comparator group but not in the intervention group. The lack of significant change in the intake of these antioxidant nutrients observed within the intervention group at endline could potentially be due to over-restriction of intakes of foods rich in these nutrients, especially animal source proteins, which are good sources, in order to limit the intake of animal fats. It is possible that the prescribed diet for the intervention group was overly restrictive in animal-sourced protein, or that the participants may have further limited their intakes following the initiation of diet therapy in order to rapidly improve their clinical outcomes. This could partly explain why the participants in the intervention group had significantly lower selenium intake at endline. Thus, the insignificant change in these antioxidant nutrient intakes within the intervention group could reflect the protein intake within the group, which also did not change significantly. Furthermore, the location of the hospital where the comparators were enrolled could potentially be a factor in terms of the high intake of the nutrients as compared to the intervention group. The hospital from which the comparators were recruited is situated within a municipality that has a fresh food market supplied by traders and farmers from the neighboring farming communities, unlike the intervention hospital, which is closer to the city center, where food is generally more expensive. During the endline data collection period, fresh foods were in season and relatively cheaper, potentially increasing the accessibility and consumption of fresh food produce, including animal-sourced foods, among the comparator group. Furthermore, as they did not receive any dietary intervention at their clinic, it is likely that there were no restrictions on their macronutrient and micronutrient intake.
The recommendation to increase vegetable consumption as part of the dietary counseling received by the intervention group may account for the significant increase in vitamin A intake at endline in this group compared to the comparator group. Vegetables, particularly green leafy vegetables, are rich sources of pro-carotenoids, which are precursors of vitamin A. Prolonged adherence to the dietary prescription beyond the three-month duration of this study has the potential to promote adequate vitamin A intake that meets or approaches the RDA. Although vitamin C intake was within the RDA for participants in both groups at baseline and endline, there was no significant increase within the intervention group at endline compared to the comparator group that had significantly increased intake. Oranges, which are mainly produced locally, are the predominant source of vitamin C in the Ghanaian diet. In addition to vitamin C and various phytonutrients, oranges also contain naturally occurring sugars. As part of the dietary intervention, the dietitian may have recommended portion size control to limit excessive sugar intake from fruits. This could have limited the consumption of oranges and consequently, vitamin C intake, within the intervention group compared to the comparator group, who did not receive dietary counseling. Although this study did not report on the serum antioxidant status of the participants, previous studies among ILWT2D in Ghana suggest improvement in serum total antioxidant capacity in ILWT2D who had higher antioxidant intake [29].
This study shows significant changes in anthropometric parameters in participants in the intervention group compared to those in the comparator group at the end of the study. At endline, significant improvements were observed in body composition indices (BMI, %body fat, and visceral fat) within the treatment group compared to the comparator group. The improvements in these body composition indices could be influenced by the relative improvements observed in participants’ energy and macronutrient consumption highlighted above. A previous study by Osei et al. [16] reported improvement in anthropometric parameters of individuals with metabolic syndrome who received dietary intervention for three months.
Blood glucose status and blood pressure levels also improved significantly within the intervention group to within the cut-off range recommended by the American Diabetes Association guidelines [27,28] than the comparator group after the three-month period. The relative improvement in the calorie and macronutrient intake of the participants receiving the diet therapy, although not statistically significant, could have contributed to the improvement in their glycemic status. Additionally, the significant reduction in the anthropometric indices in the intervention group, as described above, could have also contributed to the improvement in their glycemic status and blood pressure. In type 2 diabetes, weight reduction is known to improve insulin sensitivity, glycemic control [19], and cardiovascular indices, including blood pressure [27]. Thus, the findings of this study are consistent with the observed improvement in glycemic control after weight loss in previous studies [34,57,58]. It is well documented that high body fat distribution is linked with the development of hypertension [14,27,59]. Thus, the significant improvement in body composition indices in the present study could have potentially accounted for the significant reduction in systolic blood pressure levels observed within the intervention group after the three-month period.
The present study has strengths and limitations. This study emphasizes individualized dietary intervention, which aligns with guidelines that prioritize personalized nutrition prescription over generic recommendations [13,14]. The focus on antioxidant nutrient intake aligns with evidence that dietary antioxidants mitigate oxidative stress in ILWT2D [29,30,31,32,33]. However, some limitations could limit the generalizability of the findings. This study focused on the impact of dietary counseling intervention on the study outcome variables. Physical activity status, which could potentially confound body composition, blood pressure, and blood glucose status, was not included. Future studies should include physical activity levels to provide a broader insight into the outcome variables. Although the 24 h recall is routinely used in dietetic practice settings like the present study, future studies should include dietary diversity/food source data to better appreciate the context of participants’ dietary intake.
Additionally, due to COVID-19-related disruptions in international shipping prior to the implementation of this study, antioxidant reagents could not be procured in time for the determination of the serum antioxidant status of participants. In view of this, only dietary antioxidant micronutrients were measured in this study, which is a limitation. Future studies should include the determination of serum antioxidant status of participants to better understand the impact of the changes in dietary intake of antioxidant micronutrients.
5. Conclusions
There were significant improvements in vitamin A intake of the ILWT2D who received dietary counseling intervention compared to those who did not. Additionally, the ILWT2D who received dietary counseling had significant improvements in their systolic blood pressure, body composition, and blood pressure compared to those who did not. The ILWT2D who received the intervention had significantly better glycemic control than their counterparts who did not. Thus, this study suggests the potential of diet therapy as a viable non-pharmacological treatment approach for individuals living with type 2 diabetes.
Author Contributions
Conceptualization, C.A.A. and H.W.; methodology, C.A.A., H.W., M.A., M.A.W. and F.E.A.H.; formal analysis, C.A.A., H.W. and J.A.C.; investigation, C.A.A. and H.W.; resources, C.A.A. and H.W.; data curation, C.A.A., and H.W.; writing—original draft preparation, C.A.A. and H.W.; writing—review and editing, C.A.A., H.W., J.A.C., M.A., M.A.W. and F.E.A.H.; visualization, C.A.A., H.W., J.A.C., M.A., M.A.W. and F.E.A.H.; supervision, C.A.A.; project administration, C.A.A. and H.W.; funding acquisition, C.A.A. and H.W. All authors have read and agreed to the published version of the manuscript.
Funding
This study did not receive any external funding. The APC was covered by the 2024 Book and Research funding provided by the government of Ghana to CAA, MA, FEAH, and MAW. The APC was also supported by the Open Access Publication Fund of the University of the Free State, South Africa.
Institutional Review Board Statement
Ethical approval for the study was obtained from the Committee of Human Research Publications and Ethics of Kwame Nkrumah University of Science and Technology (reference number: CHRPE/AP/085/21); approval date: 24 February 2021). Approval was also obtained from the management of the study hospitals (reference number: TH/ADM/25/1/21; approval date: 25 January 2021 and reference number: EJ/EGH/EJ-209/20; approval date: 20 January 2021). The principles of the World Medical Association’s Declaration of Helsinki were followed throughout this study. Informed consent was obtained from participants before recruitment into the study, and participation was completely voluntary.
Informed Consent Statement
Informed consent was obtained from all subjects involved in this study.
Data Availability Statement
Data is not openly available due to the sensitivity of patient information. However, upon reasonable request, the corresponding authors can make the data available with permission from the research ethics committee of the Kwame Nkrumah University of Science and Technology, Ghana (Email: chrpe@knustedu.gh).
Acknowledgments
The authors acknowledge the management of the two general hospitals for granting permission to conduct this study in their facilities. We acknowledge the staff of the two hospitals for their cooperation and support during the data collection exercise. The authors also appreciate all the participants for participating in this study.
Conflicts of Interest
The authors declare that there is no conflict of interest regarding the publication of this research article.
Abbreviations
The following abbreviations are used in this manuscript:
| ILWT2D | Individuals living with type 2 diabetes |
| BMI | Body mass index |
| BF | Body fat |
| VF | Visceral fat |
| FBG | Fasting blood glucose |
| BP | Blood pressure |
| LMICs | Low- and middle-income countries |
| ROS | Reactive oxygen species |
| COVID-19 | Coronavirus disease 2019 |
| GHS | Ghana cedis |
| HbA1c | Glycated hemoglobin |
| SD | Standard deviation |
| USD | United States dollars |
| RDA | Recommended dietary allowance |
| SBP | Systolic blood pressure |
| DBP | Diastolic blood pressure |
References
- WHO. WHO Noncommunicable Diseases Country Profiles; WHO: Geneva, Switzerland, 2018. [Google Scholar]
- Ong, K.L.; Stafford, L.K.; McLaughlin, S.A.; Boyko, E.J.; Vollset, S.E.; Smith, A.E.; Dalton, B.E.; Duprey, J.; Cruz, J.A.; Hagins, H.; et al. Global, Regional, and National Burden of Diabetes from 1990 to 2021, with Projections of Prevalence to 2050: A Systematic Analysis for the Global Burden of Disease Study 2021. Lancet 2023, 402, 203–234. [Google Scholar] [CrossRef]
- Fu, A.Z.; Qiu, Y.; Radican, L.; Wells, B.J. Health Care and Productivity Costs Associated with Diabetic Patients with Macrovascular Comorbid Conditions. Diabetes Care 2009, 32, 2187–2192. [Google Scholar] [CrossRef] [PubMed]
- Yang, W.; Dall, T.M.; Beronjia, K.; Lin, J.; Semilla, A.P.; Chakrabarti, R.; Hogan, P.F.; Petersen, M.P. Economic Costs of Diabetes in the U.S. in 2017. Diabetes Care 2018, 41, 917–928. [Google Scholar] [CrossRef]
- Lui, J.N.M.; Lau, E.S.H.; Yang, A.; Wu, H.; Fu, A.; Lau, V.; Loo, K.; Yeung, T.; Yue, R.; Ma, R.C.W.; et al. Temporal Associations of Diabetes-Related Complications with Health-Related Quality of Life Decrements in Chinese Patients with Type 2 Diabetes: A Prospective Study among 19 322 Adults—Joint Asia Diabetes Evaluation (JADE) Register (2007–2018). J. Diabetes 2023, 16, e13503. [Google Scholar] [CrossRef]
- Palmer, K.N.B.; Crocker, R.M.; Marrero, D.G.; Tan, T.W. A Vicious Cycle: Employment Challenges Associated with Diabetes Foot Ulcers in an Economically Marginalized Southwest US Sample. Front. Clin. Diabetes Healthc. 2023, 4, 1027578. [Google Scholar] [CrossRef]
- IDF. IDF Diabetes Atlas Ninth; IDF: Tel Aviv, Israel, 2019; ISBN 9782930229874. [Google Scholar]
- Asamoah-Boaheng, M.; Sarfo-Kantanka, O.; Tuffour, A.B.; Eghan, B.; Mbanya, J.C. Prevalence and Risk Factors for Diabetes Mellitus among Adults in Ghana: A Systematic Review and Meta-Analysis. Int. Health 2019, 11, 83–92. [Google Scholar] [CrossRef] [PubMed]
- WHO Ghana Country Office. Ghana on the Offensive Against Diabetes; WHO Ghana Country Office: Accra, Ghana, 2023. [Google Scholar]
- American Diabetes Association Professional Practice Committee Pharmacologic Approaches to Glycemic Treatment: Standards of Care in Diabetes—2024. Diabetes Care 2024, 47, S158–S178. [CrossRef]
- O’donoghue, G.; O’sullivan, C.; Corridan, I.; Daly, J.; Finn, R.; Melvin, K.; Peiris, C. Lifestyle Interventions to Improve Glycemic Control in Adults with Type 2 Diabetes Living in Low-and-Middle Income Countries: A Systematic Review and Meta-Analysis of Randomized Controlled Trials (Rcts). Int. J. Environ. Res. Public Health 2021, 18, 6273. [Google Scholar] [CrossRef]
- Pozzilli, P.; Fallucca, F. Diet and Diabetes: A Cornerstone for Therapy. Diabetes Metab. Res. Rev. 2014, 30, 1–3. [Google Scholar] [CrossRef]
- American Diabetes Association Professional Practice Committee. Facilitating Positive Health Behaviors and Well-Being to Improve Health Outcomes: Standards of Care in Diabetes—2025. Diabetes Care 2025, 48, S86–S127. [Google Scholar] [CrossRef]
- American Diabetes Association Professional Practice Committee. Obesity and Weight Management for the Prevention and Treatment of Type 2 Diabetes: Standards of Care in Diabetes–2025. Diabetes Care 2025, 48, S167–S180. [Google Scholar] [CrossRef]
- Chen, R.; Chen, G. Personalized Nutrition for People with Diabetes and at Risk of Diabetes Has Begun. J. Future Foods 2022, 2, 193–202. [Google Scholar] [CrossRef]
- Osei, P.K.; Appiah, C.; Anderson, A.K. Impact of Dietetic Intervention on Metabolic Syndrome Patients Attending Diet Therapy Clinic: A Prospective, Single-Arm Intervention Study. Glob. J. Health Sci. 2021, 13, 89. [Google Scholar] [CrossRef]
- Khazrai, Y.M.; Defeudis, G.; Pozzilli, P. Effect of Diet on Type 2 Diabetes Mellitus: A Review. Diabetes Metab. Res. Rev. 2014, 30, 24–33. [Google Scholar] [CrossRef] [PubMed]
- Świątkiewicz, I.; Wróblewski, M.; Nuszkiewicz, J.; Sutkowy, P.; Wróblewska, J.; Woźniak, A. The Role of Oxidative Stress Enhanced by Adiposity in Cardiometabolic Diseases. Int. J. Mol. Sci. 2023, 24, 6382. [Google Scholar] [CrossRef]
- Newsholme, P.; Cruzat, V.F.; Keane, K.N.; Carlessi, R.; de Bittencourt, P.I.H., Jr. Molecular Mechanisms of ROS Production and Oxidative Stress in Diabetes. Biochem. J. 2016, 473, 4527–4550. [Google Scholar] [CrossRef] [PubMed]
- Rains, J.L.; Jain, S.K. Oxidative Stress, Insulin Signaling, and Diabetes. Free Radic. Biol. Med. 2011, 50, 567–575. [Google Scholar] [CrossRef]
- Monnier, L.; Mas, E.; Ginet, C.; Michel, F.; Villon, L.; Cristol, J.-P.; Colette, C. Activation of Oxidative Stress by Acute Glucose Fluctuations in Patients with Type 2 Diabetes. J. Am. Med. Assoc. 2006, 295, 1681–1687. [Google Scholar] [CrossRef]
- Evans, J.L.; Goldfine, I.D.; Maddux, B.A.; Grodsky, G.M. Are Oxidative StressnActivated Signaling Pathways Mediators of Insulin Resistance and β-Cell Dysfunction? Diabetes 2003, 52, 1–8. [Google Scholar] [CrossRef]
- Banerjee, M.; Vats, P. Redox Biology Reactive Metabolites and Antioxidant Gene Polymorphisms in Type. Redox Biol. 2014, 2, 170–177. [Google Scholar] [CrossRef]
- Valko, M.; Leibfritz, D.; Moncol, J.; Cronin, M.T.D.; Mazur, M.; Telser, J. Free Radicals and Antioxidants in Normal Physiological Functions and Human Disease. Int. J. Biochem. Cell Biol. 2007, 39, 44–84. [Google Scholar] [CrossRef]
- Ceriello, A. Possible Role of Oxidative Stress in the Pathogenesis of Hypertension. Diabetes Care 2008, 31 (Suppl. S2), S181–S184. [Google Scholar] [CrossRef]
- Griendling, K.K.; Camargo, L.L.; Rios, F.J.; Alves-Lopes, R.; Montezano, A.C.; Touyz, R.M. Oxidative Stress and Hypertension. Circ. Res. 2021, 128, 993–1020. [Google Scholar] [CrossRef]
- American Diabetes Association Professional Practice Committee. Cardiovascular Disease and Risk Management: Standards of Care in Diabetes—2025. Diabetes Care 2025, 48, S207–S238. [Google Scholar] [CrossRef] [PubMed]
- American Diabetes Association Professional Practice Committee. Glycemic Goals and Hypoglycemia: Standards of Care in Diabetes—2025. Diabetes Care 2025, 48, S128–S145. [Google Scholar] [CrossRef] [PubMed]
- Appiah, C.A.; Ngounda, J.; Boakye-Yiadom, M.; Mills-Robertson, F.C.; Nel, M.; Johnson, R.; Walsh, C. Bridelia Ferruginea Tea Consumption Improves Antioxidant Status in Individuals Living with Type 2 Diabetes. Diabetology 2025, 6, 6. [Google Scholar] [CrossRef]
- Alipoor, B.; Homayouni, A.; Vaghef, E. Diabetes, Oxidative Stress and Tea. In Oxidative Stress—Environmental Induction and Dietary Antioxidants; IntechOpen: London, UK, 2012. [Google Scholar] [CrossRef]
- Zemestani, M.; Rafraf, M.; Asghari-Jafarabadi, M. Chamomile Tea Improves Glycemic Indices and Antioxidants Status in Patients with Type 2 Diabetes Mellitus. Nutrition 2016, 32, 66–72. [Google Scholar] [CrossRef] [PubMed]
- Pieme, C.A.; Tatangmo, J.A.; Simo, G.; Cabral, P.; Nya, B.; Jocelyne, V.; Moor, A.; Moukette, B.M.; Nzufo, F.T.; Legrand, B.; et al. Relationship between Hyperglycemia, Antioxidant Capacity and Some Enzymatic and Non—Enzymatic Antioxidants in African Patients with Type 2 Diabetes. BMC Res. Notes 2017, 10, 141. [Google Scholar] [CrossRef]
- Tuell, D.S.; Los, E.A.; Ford, G.A.; Stone, W.L. The Role of Natural Antioxidant Products That Optimize Redox Status in the Prevention and Management of Type 2 Diabetes. Antioxidants 2023, 12, 1139. [Google Scholar] [CrossRef]
- Celli, A.; Barnouin, Y.; Jiang, B.; Blevins, D.; Colleluori, G.; Mediwala, S.; Armamento-Villareal, R.; Qualls, C.; Villareal, D.T. Lifestyle Intervention Strategy to Treat Diabetes in Older Adults: A Randomized Controlled Trial. Diabetes Care 2022, 45, 1943–1952. [Google Scholar] [CrossRef]
- Camara, A.; Baldé, N.M.; Sobngwi-Tambekou, J.; Kengne, A.P.; Diallo, M.M.; Tchatchoua, A.P.K.; Kaké, A.; Sylvie, N.; Balkau, B.; Bonnet, F.; et al. Poor Glycemic Control in Type 2 Diabetes in the South of the Sahara: The Issue of Limited Access to an HbA1c Test. Diabetes Res. Clin. Pract. 2015, 108, 187–192. [Google Scholar] [CrossRef]
- Aschner, P.; Gagliardino, J.J.; Ilkova, H.; Lavalle, F.; Ramachandran, A.; Mbanya, J.C.; Shestakova, M.; Chantelot, J.; Chan, J.C.N. Persistent Poor Glycaemic Control in Individuals with Type 2 Diabetes in Developing Countries: 12 Years of Real-World Evidence of the International Diabetes Management Practices Study (IDMPS). Diabetologia 2020, 63, 711–721. [Google Scholar] [CrossRef]
- Hlovor, I.K. The ‘Second U-Turn’: Domestic Politics and Foreign Economic Policy Choice in Ghana. Afr. Rev. 2023, 1, 1–43. [Google Scholar] [CrossRef]
- Sureshkumar, S.; Mwangi, K.J.; Mustapha, F.; Quint, J.; Tabrizi, R.; Palafox, B.; Etchebehere, M.; Kengne, A.P.; Madhu, P.P.; Peer, N.; et al. Exploring Key-Stakeholder Perceptions on Non-Communicable Disease Care during the COVID-19 Pandemic in Kenya. Pan Afr. Med. J. 2023, 44, 153. [Google Scholar]
- Devi, R.; Goodyear-Smith, F.; Subramaniam, K.; Mccormack, J.; Calder, A.; Parag, V.; Huang, P. The Impact of COVID-19 on the Care of Patients With Noncommunicable Diseases in Low- and Middle-Income Countries: An Online Survey of Patient Perspectives. J. Patient Exp. 2021, 8, 1–8. [Google Scholar] [CrossRef]
- Apprey, C.; Addae, H.Y.; Boateng, G.; Aduku, L.E.; Annan, R.A. Dietary Diversity and Nutrient Adequacy among Women in Bosomtwe District, Ghana. Matern. Child Nutr. 2024, 21, e13757. [Google Scholar] [CrossRef] [PubMed]
- Puwanant, M.; Boonrusmee, S.; Jaruratanasirikul, S.; Chimrung, K.; Sriplung, H. Dietary Diversity and Micronutrient Adequacy among Women of Reproductive Age: A Cross-Sectional Study in Southern Thailand. BMC Nutr. 2022, 8, 127. [Google Scholar] [CrossRef] [PubMed]
- Gómez, G.; Monge-Rojas, R.; Vargas-Quesada, R.; Previdelli, A.N.; Quesada, D.; Kovalskys, I.; Herrera-Cuenca, M.; Cortes, L.Y.; García, M.C.Y.; Liria-Domínguez, R.; et al. Exploring the FAO Minimum Dietary Diversity Indicator as a Suitable Proxy of Micronutrient Adequacy in Men and Women Across Reproductive and Non-Reproductive Ages in 8 Latin American Countries. Food Nutr. Bull. 2024, 45, S55–S65. [Google Scholar] [CrossRef]
- Mann, C.J. Observational Research Methods. Research Design II: Cohort, Cross Sectional, and Case-Control Studies. Emerg. Med. J. 2003, 20, 54–60. [Google Scholar] [CrossRef]
- Ni, C.; Jia, Q.; Ding, G.; Wu, X.; Yang, M. Low-Glycemic Index Diets as an Intervention in Metabolic Diseases: A Systematic Review and Meta-Analysis. Nutrients 2022, 14, 307. [Google Scholar] [CrossRef]
- Chiavaroli, L.; Lee, D.; Ahmed, A.; Cheung, A.; Khan, T.A.; Blanco, S.; Mejia; Mirrahimi, A.; Jenkins, D.J.A.; Livesey, G.; et al. Effect of Low Glycaemic Index or Load Dietary Patterns on Glycaemic Control and Cardiometabolic Risk Factors in Diabetes: Systematic Review and Meta-Analysis of Randomised Controlled Trials. BMJ 2021, 374, n1651. [Google Scholar] [CrossRef] [PubMed]
- Rippin, G.; Largent, J.; Hoogendoorn, W.E.; Sanz, H.; Bosco, J.; Mack, C. External Comparator Cohort Studies—Clarification of Terminology. Front. Drug Saf. Regul. 2024, 3, 1321894. [Google Scholar] [CrossRef]
- Charan, J.; Biswas, T. How to Calculate Sample Size for Different Study Designs in Medical Research? Indian J. Psychol. Med. 2013, 35, 121–126. [Google Scholar] [CrossRef]
- Mobula, L.M.; Sarfo, F.S.; Carson, K.A.; Burnham, G.; Arthur, L.; Ansong, D.; Sarfo-Kantanka, O.; Plange-Rhule, J.; Ofori-Adjei, D. Predictors of Glycemic Control in Type-2 Diabetes Mellitus: Evidence from a Multicenter Study in Ghana. Transl. Metab. Syndr. Res. 2018, 1, 1–8. [Google Scholar] [CrossRef]
- Bailey, R.L. Overview of Dietary Assessment Methods for Measuring Intakes of Foods, Beverages, and Dietary Supplements in Research Studies. Curr. Opin. Biotechnol. 2021, 70, 91–96. [Google Scholar] [CrossRef] [PubMed]
- Appiah, C.; Samwini, A.; Brown, P.; Hayford, F.; Asamoah-Boakye, O. Proximate Composition and Serving Sizes of Selected. Afr. J. Food Agric. Nutr. Dev. 2020, 20, 15898–15918. [Google Scholar] [CrossRef]
- Maan, H.B.; Meo, S.A.; Rouq, F.A.; Meo, I.M.U. Impact of Glycated Hemoglobin (HbA1c) on Cognitive Functions in Type 2 Diabetic Patients. Eur. Rev. Med. Pharmacol. Sci. 2021, 25, 5978–5985. [Google Scholar] [PubMed]
- GSS. Ghana 2021 Population and Housing Census: General Report Highlights; GSS: Accra, Ghana, 2022; Volume 3. [Google Scholar]
- GSS. 2010 Population & Housing Census Report: The Elderly in Ghana; GSS: Accra, Ghana, 2013. [Google Scholar]
- Standing Committee on the Scientific Evaluation of Dietary Reference Intakes; Subcommittee on Interpretation, Uses of Dietary Reference Intakes; Subcommittee on Upper Reference Levels of Nutrients; Panel on the Definition of Dietary Fiber; Panel on Macronutrients. Dietary Reference Intakes for Energy, Carbohydrate, Fiber, Fat, Fatty Acids, Cholesterol, Protein, and Amino Acids (Macronutrients); National Academies Press: Washington, DC, USA, 2005; ISBN 030908525X. [Google Scholar]
- Noordzij, M.; Dekker, F.W.; Zoccali, C.; Jager, K.J. Study Designs in Clinical Research. Nephron Clin. Pract. 2009, 113, 9–12. [Google Scholar] [CrossRef]
- Wali, J.A.; Solon-Biet, S.M.; Freire, T.; Brandon, A.E. Macronutrient Determinants of Obesity, Insulin Resistance and Metabolic Health. Biology 2021, 10, 336. [Google Scholar] [CrossRef]
- Miller, C.K.; Kristeller, J.L.; Headings, A.; Nagaraja, H.; Miser, W.F. Comparative Effectiveness of a Mindful Eating Intervention to a Diabetes Self-Management Intervention among Adults with Type 2 Diabetes: A Pilot Study. J. Acad. Nutr. Diet. 2012, 112, 1835–1842. [Google Scholar] [CrossRef]
- Lindström, J.; Louheranta, A.; Mannelin, M.; Rastas, M.; Salminen, V.; Eriksson, J.; Uusitupa, M.; Tuomilehto, J. The Finnish Diabetes Prevention Study (DPS). Diabetes Care 2003, 26, 3230–3236. [Google Scholar] [CrossRef] [PubMed]
- Malden, D.; Lacey, B.; Emberson, J.; Karpe, F.; Allen, N.; Bennett, D.; Lewington, S. Body Fat Distribution and Systolic Blood Pressure in 10,000 Adults with Whole-Body Imaging: UK Biobank and Oxford BioBank. Obesity 2019, 27, 1200–1206. [Google Scholar] [CrossRef] [PubMed]
Disclaimer/Publisher’s Note: The statements, opinions and data contained in all publications are solely those of the individual author(s) and contributor(s) and not of MDPI and/or the editor(s). MDPI and/or the editor(s) disclaim responsibility for any injury to people or property resulting from any ideas, methods, instructions or products referred to in the content. |
© 2025 by the authors. Licensee MDPI, Basel, Switzerland. This article is an open access article distributed under the terms and conditions of the Creative Commons Attribution (CC BY) license (https://creativecommons.org/licenses/by/4.0/).