Article

Cross-Sectional Analysis of Food Group Consumption and Obesity in Children Aged 6–23 Months with Normal and Stunted Growth Patterns in Pakistan

1
School of Public Health & Social Work, Queensland University of Technology, Kelvin Grove Campus, Brisbane 4059, Australia
2
Department of Medicines, Dow International Medical College, Dow University of Health Sciences, Karachi 75280, Pakistan
3
Ziauddin Medical College, Ziauddin University, Karachi 74800, Pakistan
4
FMH College of Medicine and Dentistry, Lahore 54000, Pakistan
5
Northwest School of Medicine, Khyber Medical University, Peshawar 25000, Pakistan
6
Khyber Medical College, Khyber Medical University, Peshawar 25000, Pakistan
*
Author to whom correspondence should be addressed.
Obesities 2025, 5(3), 55; https://doi.org/10.3390/obesities5030055
Submission received: 25 May 2025 / Revised: 21 June 2025 / Accepted: 8 July 2025 / Published: 16 July 2025

Abstract

Background: Worldwide, the awareness about childhood obesity as a public health concern is increasing, particularly in developing countries like Pakistan. Obesity during early childhood may persist into later ages, increasing the risk of chronic illnesses such as diabetes and hypertension. Objective: The aim of this study was to examine the relationship of different types of food groups with obesity among children with normal and stunted growth trajectories in Pakistan. Methods: This cross-sectional study conducted a secondary analysis of Pakistan Demographic and Health Surveys (PDHSs) conducted in the years 2012–2013 and 2017–2018. Data of 1230 healthy and obese children with either normal or stunted growth were analysed after excluding those who were aged below six months, wasted, underweight, or had missing anthropometric or dietary data. The relationship of different food groups with obesity among the children with normal and stunted growth was analysed by bivariate logistic regression. Results: The prevalence of paediatric obesity dropped from 7.3% in 2012–2013 to 2.4% in 2017–2018. However, the coexistence of stunting with obesity—termed the nutritional paradox—slightly increased from 2.8% in 2012–2013 to 3% in 2017–2018. Among the different food groups, the continuation of breastmilk was associated with lowering the odds of obesity by 69% (25% to 88%) among children with normal growth. Conversely, among children with stunted growth, the continuation of breastmilk was associated with an increase in the odds of obesity by 3.71 (1.08 to 12.62) times. Conclusion: Despite the 4.9% reduction in paediatric obesity, cases of the nutritional paradox are still escalating in Pakistan. This reflects an urgent need for targeted nutritional interventions to mitigate the impact of obesogenic diets and reduce the prevalence of childhood obesity in Pakistan.

1. Introduction

The first 1000 days of life, spanning from conception to a child’s second birthday, represent a critical window for growth and development [1,2]. This period establishes lifelong dietary patterns and eating behaviours, which, in turn, influence long-term health outcomes, such as increased susceptibility to chronic diseases, including obesity [2,3]. Childhood obesity has become a global public health concern, particularly among young children [4]. In recent years, there has been growing concern about the prevalence of obesity among young children, particularly those aged 6 to 23 months. This developmental stage is marked by rapid growth and significant nutritional needs [5,6]. Children in this age group are particularly vulnerable to obesogenic foods due to their high calorie count, low nutritional value, and likelihood of being overeaten [3].
Ensuring nutritional adequacy in children aged 6–23 months is crucial for supporting their rapid growth and development [7,8]. The World Health Organization (WHO) and UNICEF have established Infant and Young Child Feeding (IYCF) guidelines for promoting better health and preventing nutritional adversities, including paediatric obesity [9]. These guidelines emphasise the importance of exclusive breastfeeding (EBF) for the first six months, followed by the introduction of appropriate complementary foods (CFs) alongside continued breastfeeding up to two years or beyond. Despite these recommendations, many children in low- and middle-income countries (LMICs) fail to meet the complementary feeding standards, leading to micronutrient deficiencies and poor growth outcomes, including paediatric obesity [10].
Paediatric obesity was once thought to be a problem in high-income countries but is now an emerging concern of LMICs, including Asia and Africa, where more than half of children below five years are either overweight or obese [11]. An increased risk of paediatric obesity is significantly associated with short breastfeeding duration, short infant sleep duration, mother gestational diabetes mellitus, and excessive prenatal weight increase [12,13]. Moreover, the increasing availability and consumption of non-nutritive, energy-dense, and harmful-fat-containing obesogenic foods—such as sugary snacks, fried foods, and sweetened beverages—pose a significant threat of paediatric obesity among children with normal as well as stunted growth trajectories [14]. These foods are often high in unhealthy fats, sugars, and salt but low in essential nutrients, contributing to the dual burden of malnutrition, where undernutrition and obesity coexist [15]. Furthermore, the consumption of obesogenic foods during early childhood has been linked to poor growth trajectories, increased adiposity, and a higher risk of developing non-communicable diseases (NCDs) such as diabetes and hypertension later in life [12]. Understanding CF habits and behaviours during the first two years is crucial for identifying obesogenic foods and developing effective interventions for preventing paediatric obesity [16,17].
Despite the growing recognition of this issue, there is limited research on the types of obesogenic foods consumed by children in LMICs, particularly in the context of stunted growth. Pakistan is also an LMIC, where paediatric malnutrition remains a pressing public health challenge, with 45% of children under five experiencing stunted growth and 11% suffering from wasting [18]. In parallel, the prevalence and trends of paediatric obesity are rising, driven by the increasing consumption of processed and energy-dense foods [19,20]. To date, the 2017–2018 Pakistan Demographic and Health Survey (PDHS) remains the most recent national dataset that comprehensively addresses paediatric obesity as an emerging public health problem in Pakistan [20,21]. Since the 2017–2018 survey, Pakistan has not participated in a subsequent DHS round, primarily due to funding constraints from USAID. In the absence of more recent nationally representative data, this study utilised the datasets of the last two waves of PDHSs conducted in 2012–2013 and 2017–2018 for exploring the relationship of different types of food with paediatric nutrition status. While stunting is often associated with poverty and food insecurity, the role of obesogenic foods in exacerbating poor growth outcomes among stunted children is poorly understood. Studies have shown that children in Pakistan often consume diets lacking in diversity, with limited intake of nutrient-rich foods such as fruits, vegetables, and animal-source proteins, while simultaneously consuming high amounts of sugary and fried foods [20,21,22]. This dietary pattern not only fails to address micronutrient deficiencies but also increases the risk of obesity and related metabolic disorders. The main objective of this research project is to identify and highlight different eating habits of children aged 6–23 months, focusing on how they signify the risk of obesity in these children. By examining the interplay between obesity and energy dense-low nutritive (obesogenic) food consumption, this research aims to inform targeted interventions with the goal of preventing childhood obesity and promoting a healthier generation capable of making better food choices [12].

2. Methodology

2.1. Study Design and Study Setting

This was a community-based cross-sectional study, in which a secondary data analysis of the last two waves of Pakistan Demographics and Health Surveys (PDHSs) implemented in 2012–2013 and 2017–2018 was used. For each PDHS, a team of trained and experienced data collectors collected the data from the different regions and provinces of Pakistan, such as Punjab, Sindh, Baluchistan, Khyber Pakhtunkhwa (KPK), Gilgit Baltistan (GB), Azad Jammu Kashmir (AJK), the Federally Administered Tribal Areas (FATA), and Islamabad Capital Territory (ICT). However, the demographic survey of 2012–2013 did not collect data from AJK or the FATA because of geopolitical and security reasons [23].

2.2. Study Participants, Sample Size, and Sampling Techniques

This study analysed the data of 1230 children aged between 6 and 23 months who were classified as healthy or obese, with either normal or stunted growth patterns. Children who were underweight or wasted regardless of their growth status were excluded. Additionally, children with missing, incomplete, or biologically implausible anthropometric data were also excluded. The sampling method employed in each Pakistan Demographic and Health Survey was conducted using a multistage, stratified cluster sampling technique [23,24].

2.3. Study Variables

2.3.1. Exposure Variables

From each DHS, the team of data collectors gathered the data regarding different types of foods and their frequencies from the mothers of children using 24 h dietary recall methods. The content of the complementary feeding questionnaire was adopted from the food group questionnaire of the Infants and Young Children Feeding (IYCF) guidelines of 2010 [9,21,22]. This food group questionnaire consists of 18 questions, and each has three responses: Yes, No, and Don’t know. From these 18 questions, eight different food groups were derived, such as breastmilk, cereals and grains, nuts and legumes, eggs, meat and seafood, dairy products, vitamin A-rich vegetables and fruits, and other vegetables and fruits.

2.3.2. Outcome Variables

The nutritional status of the children aged between 6 and 23 months was the outcome variable of this study. The nutritional status of each child was examined at three different steps. At first, the anthropometric measurement of each child was performed by two trained anthropometrists. During the anthropometric measurement, the anthropometrists recorded the child’s age in months, weight in kilograms, height in centimetres, and measurement position (lying or standing). This data was then used to calculate the z-score for different types of anthropometric indices, such as the height-for-age (HAZ), weight-for-age (WAZ), and weight-for-height (WHZ) indices. Following the z-score calculations, anthropometric outliers were removed. The anthropometric outlier for the HAZ was ±6.00 S.D., that for the WHZ was ±5.00, and that for the WAZ was −6 and +5 [20,21].
Secondly, the valid and complete z-score value for each anthropometric index was categorised based on the z-score cut-off values. Children with z-score values for the HAZ, WAZ, and WHZ below −2.00 S.D. were classified as stunted, underweight, and wasted. Conversely, children were classed under the category overweight/obesity if their WAZ and/or WHZ z-score values exceeded over +2.00 S.D. The remaining children with z-score values −1.99 S.D. to +1.99 S.D. were considered normal. Finally, the nutritional status of each child after performing computational analysis was analysed. A total of nine nutritional statuses were derived from the computational analysis: normal, stunting, wasting, underweight, overweight/obese, the coexistence of underweight with stunting, the coexistence of underweight with wasting, the coexistence of underweight with both wasting and stunting, and the nutritional paradox, also known as the coexistence of stunting with overweight/obesity [20,21]. However, in this study, the data of only overweight/obese children either with normal growth or stunted growth (nutritional paradox children) was considered for identifying the obesogenic diet.

2.3.3. Study Covariates

The covariates of this study were selected from each dataset based on the evidence supported from the previous literature and theoretical considerations [20,21,22]. The list of covariates selected were grouped into different factors, such as child factors (child age, child sex, birthweight, birth size, diarrhoea, cough, and fever), maternal factors (maternal age, maternal education, maternal work, maternal body mass index (BMI), and last birth caesarean section), households factors (wealth index, family size), community factors (region and type of place of residence), and periodic factors (years of surveys). The data collection procedure for most of the covariates was self-reporting, except for the disease assessment, maternal BMI, and wealth index, which were assessed by calculating several standardised parameters. For example, information related to paediatric illness was collected following the Integrated Management of Childhood Illness guidelines. The maternal BMI was measured considering the weight and height of each mother by trained and experienced anthropometrists. However, the wealth index was a derived variable calculated by applying the Principal Component Analysis (PCA) statistical approach.

2.4. Data Access and Cleaning Methods

The data in this study was retrieved from the data repository of the Demographic and Health Survey (DHS), which contains datasets of various demographic and health surveys conducted at different time points. In this study, datasets of the last two waves of demographic and health surveys conducted in 2012–2013 and 2017–2018 in Pakistan were downloaded. Following the downloading of each dataset, variable screening, variable cleaning, variable coding, and variable transformation were performed.

2.5. Statistical Analysis

The data from each dataset used in this study was initially analysed descriptively, which involved assessing the percentage (%) of each categorical variable and the mean (X) ± standard deviation (S.D.) for each numerical variable. A cumulative descriptive analysis was carried out by combining the two datasets after each dataset had undergone a descriptive analysis.
Inferentially, the data was analysed by performing bivariate and multivariate logistic regression. During the bivariate logistic regression, the individual relationships of each study covariate with the outcome variables were measured, while in the multivariate logistic regression analysis, the relationships of the study outcome variables with all the study variables were analysed simultaneously. A p-value of <0.05 and a confidence interval of 95% was considered significant. Variables with p-values over 0.05 were sequentially removed from the model by adopting the backward elimination method unless the final model contained only significant variables with p-values < 0.05. The relationship of each form of obesity (obesity among children with normal growth and obesity among children with stunted growth) with the different types of food groups was assessed separately because the obesities among children with normal growth trajectories and stunted growth trajectories are mutually exclusive. Considering these assumptions, a binomial logistic regression model for each type of outcome variable (obesity vs. normal, paradox vs. normal) was used for assessing the relationships between the various food groups and study covariates. The statistical analysis was performed using Jamovi software version 2.6.44.

2.6. Ethical Considerations

The data obtained from the DHS repository was deidentified and anonymous; i.e., the data used in this study was devoid of identifiers, such as names, phone numbers, residential addresses, and national identification numbers. None of the study participants and/or investigators had any approach to the original data and were not involved in the data collection, data entry, or data management of the original DHS data.

3. Results

3.1. Characteristics of Study Sample

This study targeted children aged between 6 and 23.9 months; the average age of the children was 13.5 ± 4.89 months. Across the two survey periods, significantly different age proportionate distributions among children of different age groups were observed. Children aged between 6 and 11.9 months were the most dominant group in the 2012–2013 survey; however, in the 2017–2018 survey, the majority of children were aged between 12 and 17.9 months (i.e., 43.2%). The gender distributions between the male and female children across the two survey periods were almost homogenous (p-value ~ 0.500). However, the recent survey of 2017–2018 showed a 1.2% higher population of male children than female children. In general, more than a quarter of the mothers across the two survey periods reported the recent prevalence of either diarrhoea and/or cough and/or fever in their children below five years of age. Among the various paediatric illnesses, such as diarrhoea, fever, and cough, only a significant difference in the prevalence of cough was observed. The 2017–2018 survey reported a 7.1% higher prevalence of paediatric cough, compared to the former survey of 2012–2013. Regarding the reporting of birthweights, more than half of the mothers did not remember the birthweights of their children. The percentage of children with “do not weigh at birth” was 16.3% in 2012–2013, which increased to 23.1% in 2017–2018. Nevertheless, almost all the mothers reported birth sizes, of which around 20% were either small or very small at the time of birth.
In both PDHS surveys, more than 75% of the women were of the age group ranging between 20 and 34 years. Both surveys consistently reported over 40% illiteracy among the women of Pakistan. The recent survey of 2017–2018 showed an over 5% increase in maternal higher education compared to the former survey of 2012–2013. In terms of maternal health, a significant difference in the nutrition statuses of the mothers was insighted between the two survey periods. The 2017–2018 survey underscored the increased proliferation of overweight and obese mothers compared with the previous survey of 2012–2013. The cumulative percentage of overweight/obese mothers in 2012–2013 was 32.7%, which increased to 47.3% in the succeeding survey of 2017–2018. Similarly, the 2017–2018 survey also showed a 7.8% increase in the practice of caesarean sections compared with the former survey of 2012–2013 (16.7% in 2012–2013 vs. 24.5% in 2017–2018).
Over half of the sample from the 2012–2013 survey was of richer and the richest people, while the 2017–2018 survey showed no specific pattern of sample distribution. Similarly, more than half of the Pakistani residents had an average family size of five to nine family members. The urban–rural distributions of data across the two survey periods were constant, with around 52% of the study participants from rural areas and the rest (48%) from urban regions of Pakistan (Table 1).

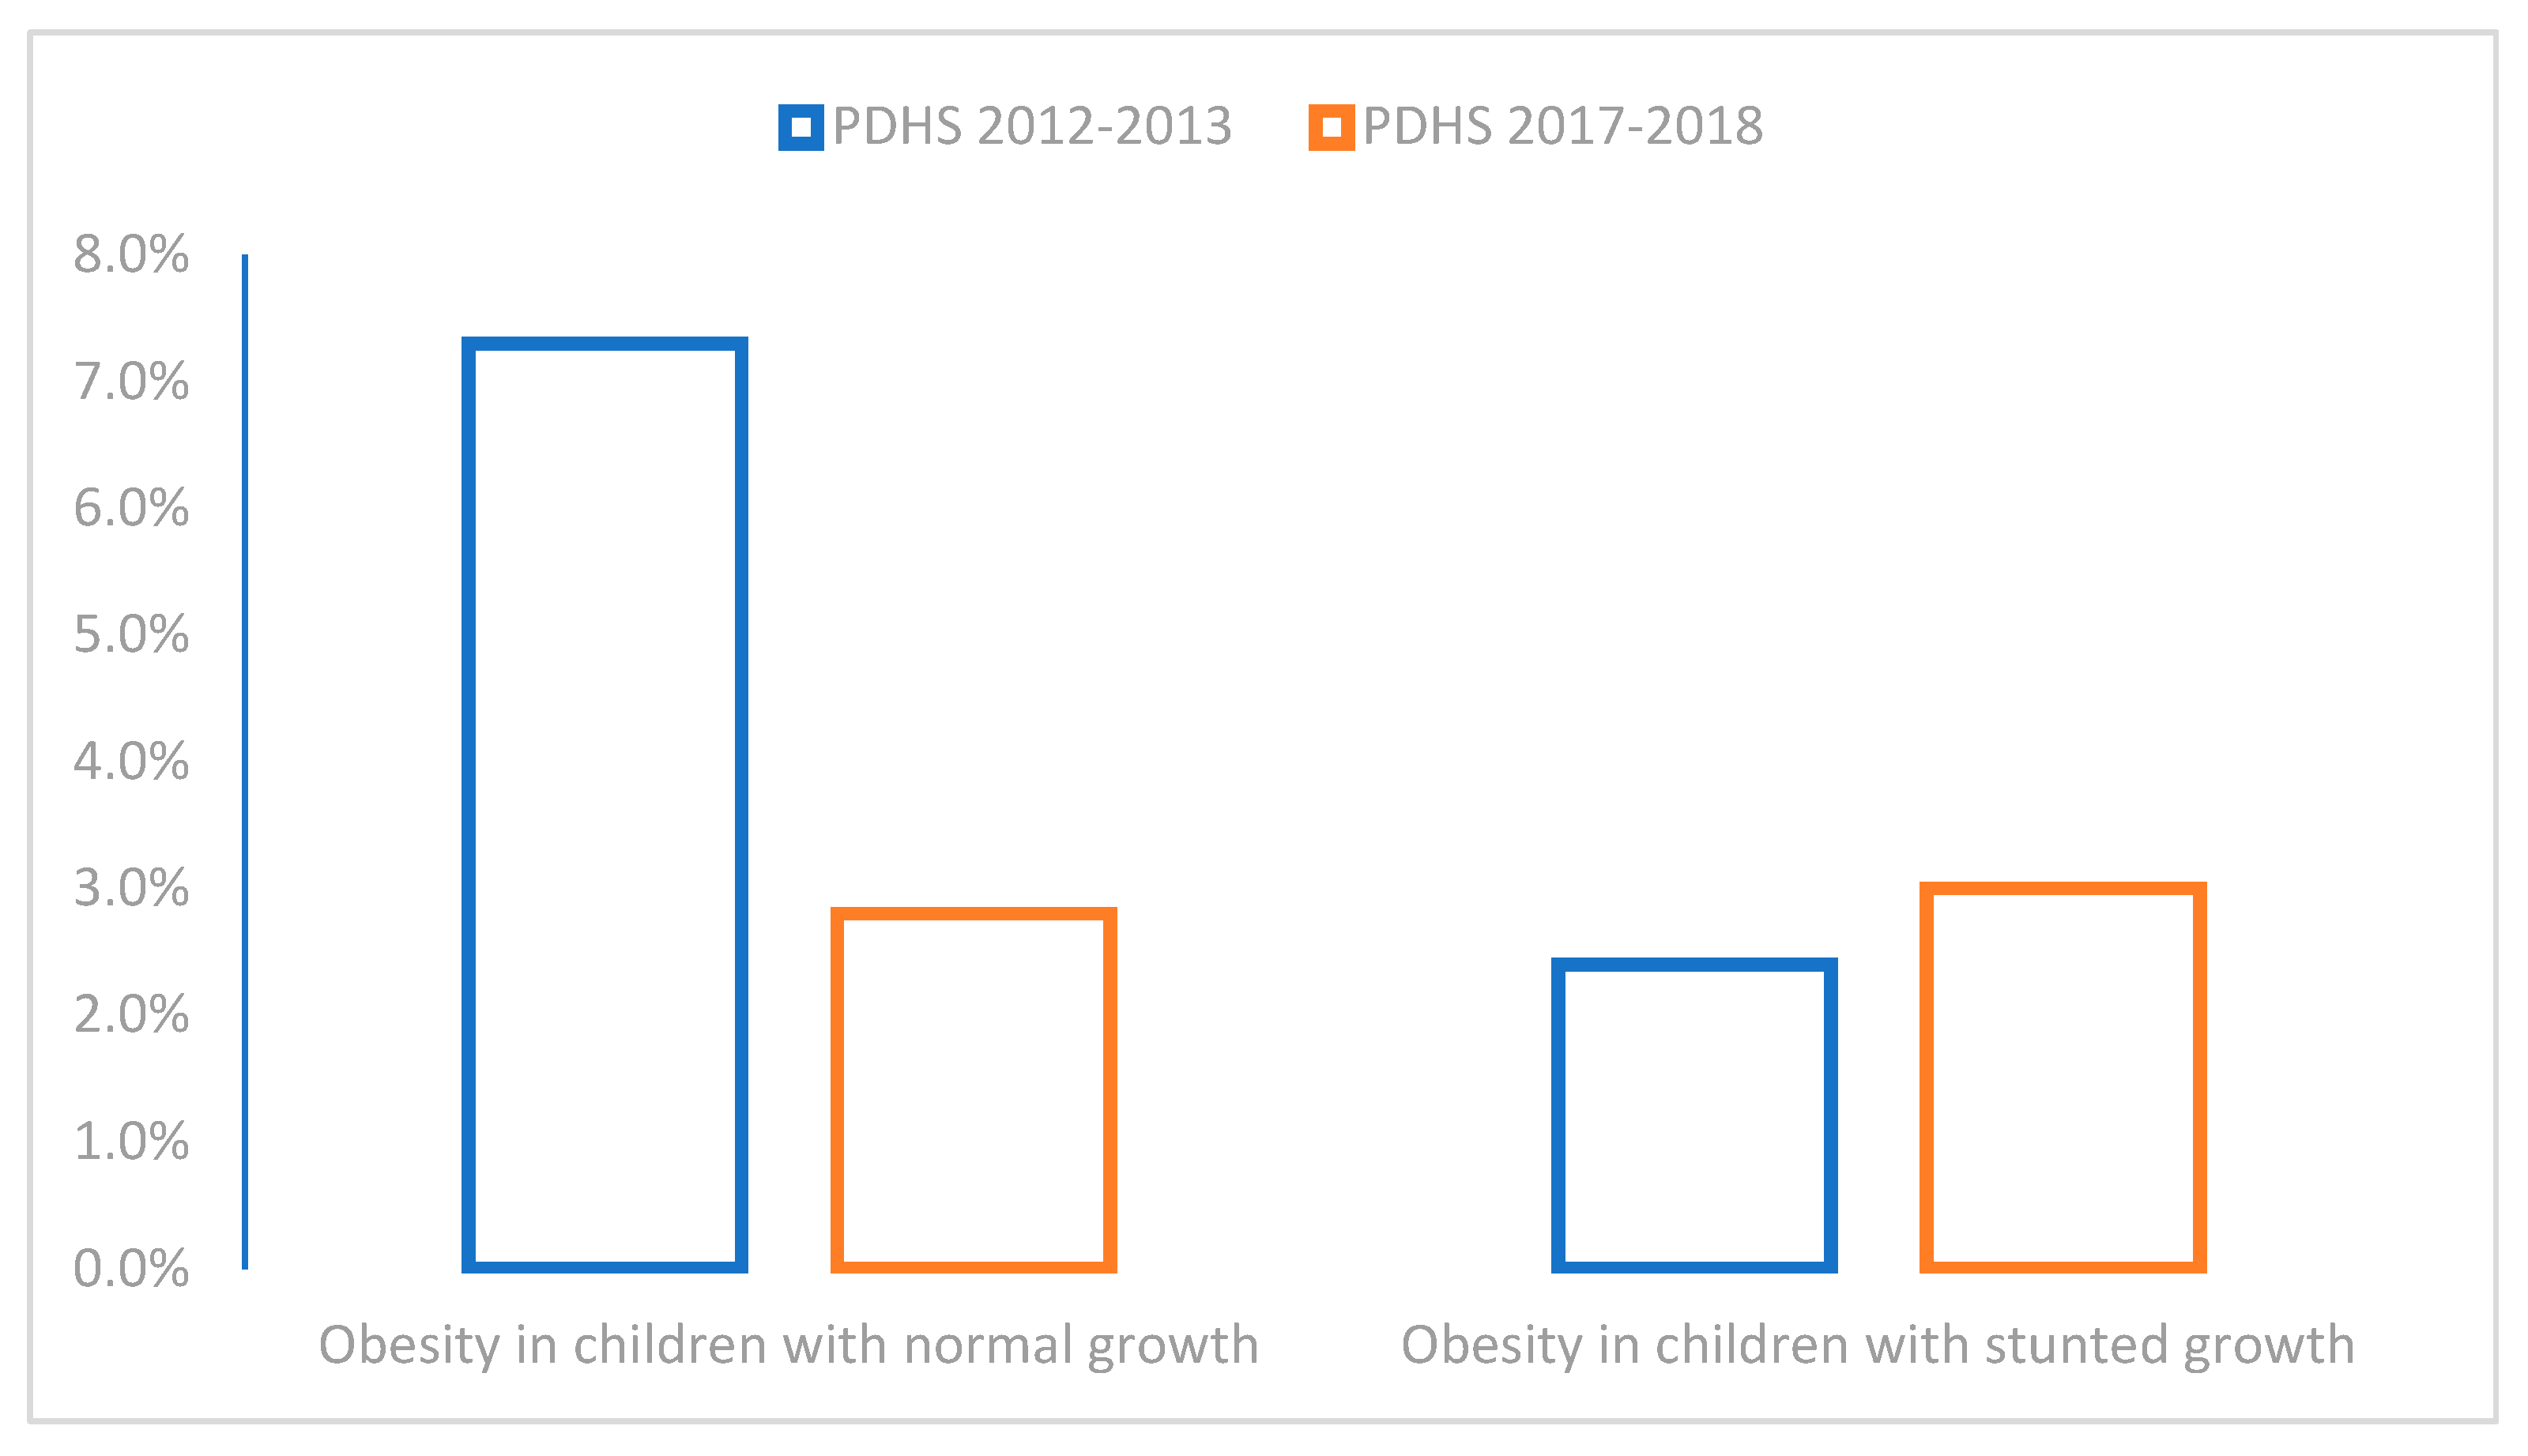
3.2. Prevalence and Trends of Paediatric Obesity

Figure 1 shows the prevalence and trends of obesity among children with normal and stunted heights aged between 6 and 23 months across the two survey periods. The prevalence of obesity among children with normal heights was 7.3% (95% CI: 5.4% to 10.2%) in 2012–2013, which decreased to 2.4% (95% CI: 1.5% to 3.7%) in the following survey of 2017–2018. However, the prevalence of obesity among children with stunted heights was 2.8% (95% CI: 1.6% to 4.7%) in 2012–2013, which increased to 3% (95% CI: 2.1% to 4.4%) in 2017–2018 (Figure 1).

3.3. Paediatric Dietary and Feeding Practices Across Two Survey Periods

The dietary and feeding practices of mothers with children aged between 6 and 23.9 months were almost similar between the two survey periods; i.e., a statistical difference across the two survey periods for each food group consumed was not seen.
Dairy products (including breastmilk) and cereals and grains were chiefly consumed by children aged between 6 and 23 months. More than two-thirds of children consumed breastmilk and cereals and grains in the last 24 h, followed by dairy products. The consumption of food from flesh foods and from vitamin A-containing fruits and vegetables was less than 20%. However, the consumption of eggs among young children was slightly higher than that of flesh foods and vitamin A-containing fruits and vegetables, i.e., eggs were consumed by less than one-third but over a quarter of children aged between six and 23.9 months (Table 2).

3.4. Meal Frequency Across Two Demographic Surveys of Pakistan

The percentages of minimum meal frequencies across the two survey periods were almost similar, with a slight decrement in 2017–2018 compared to the former survey of 2012–2013. In the 2012–2013 survey, the MMF was 68% (95% CI: 63.7% to 72.1%), which decreased to 66% (95% CI: 62.6% to 69.3%) in the 2017–2018 survey (Figure 2).

3.5. Relationships of Paediatric Obesity with Various Food Groups Among Children with Normal and Stunted Growth Trajectories

The relationships of paediatric obesity with various food groups and other covariates among children with normal and stunted growth trajectories are presented in Table 3.
The odds of paediatric obesity among children with normal growth increased over twofold in those children whose mothers reported caesarean section delivery. However, the multivariate analysis showed that the continuation of breastmilk after six months of age was associated with a reduction in the odds of paediatric obesity among children with normal growth by 0.37 (0.16 to 85) compared with those who did not adhere to breastfeeding after adjusting the odds with other covariates. Similarly, adherence to the minimum meal frequency was also associated with a significant decrease in the odds of paediatric obesity compared with those children who did not adhere to the meal frequency recommendations (Table 3).
However, the bivariate analysis showed that vitamin A-containing fruits and vegetables, an increase in the child age (in months), the presence of cough, the presence of fever, an improvement in maternal education, and an improvement in the wealth index were associated with a decrease in the prevalence of paediatric obesity among children with stunted growth. Surprisingly, the continuation of breastmilk after six months of age was associated with an increase in the odds of paediatric obesity by 3.71 (1.08 to 12.62) times among children with stunted growth compared with children with healthy weights and normal growth trajectories.

4. Discussion

The present study aimed to analyse the relationships of different types of food groups with obesity among children of Pakistan with normal and stunted growth trajectories. In general, this study did not identify obesogenic food groups but rather presents the dietary patterns of different types of food groups among young children. In Pakistan, more than half of children consume food chiefly from cereals and grains, followed by other food groups. This finding is consistent with our previous study, which assessed the relationship of food groups with coexisting forms of malnutrition [20]. Importantly, this study underscored the intricate relationship between breastfeeding and obesity in children with normal and stunted growth trajectories in Pakistan.
The prevalence of obesity among children with normal growth trajectories decreased significantly from 7.3% in 2012–2013 to 2.4% in 2017–2018, while the obesity rates among children with stunted growth remained stable at around 3% across both surveys. Obesity among young children might be attributable to several factors, which include inappropriate feeding practices, maternal obesity, the presence of gestational diabetes, and a lack of bonding between the mother and child [25,26]. However, the current findings of this study cannot justify the relationships of the various maternal factors with paediatric obesity. For a better understanding of the relationship of paediatric obesity among children with normal and stunted growth trajectories, a longitudinal study with or without intervention could provide more strong evidence.
This study reports a complex and bidirectional relationship of breastmilk continuation with paediatric obesity. In children with normal growth trajectories, the continuation of breastmilk beyond six months of age significantly lowers the likelihood of obesity by 69%. Several studies have highlighted that the continuation of breastmilk reduced the risk of obesity and chronic diseases later in life, improved brain development, and played a crucial role in preventing the triple burden of infectious diseases, mortality, and hunger [27,28,29]. Similarly, the use of breastmilk in young children offers immunity against different types of infection [30,31]. Conversely, among children with stunted growth, prolonged breastfeeding raised the risk of obesity fourfold. A systematic review by Baidal, et al. 2016 also reported the inconsistent relationship of breastmilk use with paediatric obesity [25]. Nevertheless, the risk of obesity among children with normal and stunted growth trajectories can be overcome by emphasising the importance of adequate CFs in addition to breastfeeding [32].
Cereals and dairy products were the two main food groups chiefly consumed by the children included in this study. More than two-thirds of children aged 6 to 23 months relied on cereals and dairy products, and this was consistent with the findings of our previous study [20]. The high consumption of these staples, as observed in our study, is unsuitable, as these nutrient-deficient foods need to be balanced by nutrient-dense options like fruits, vegetables, and proteins [33,34,35]. This practice of feeding young children with cereals and dairy products also prevails in other regions of South Asia, such as India, Nepal, and Bangladesh [35,36]. Moreover, this practice of relying on cereals and dairy products for supplementing infants and young children also extends beyond the geographical boundaries of South Asia [37]. One critical aspect of addressing childhood obesity is the importance of animal-based proteins in improving nutritional status. Research indicates that animal proteins are rich in essential amino acids and micronutrients, which are vital for children’s growth and development [20,21,22]. However, economic challenges, particularly rising inflation, often lead families to opt for cheaper, processed foods that lack these essential nutrients, exacerbating the risk of obesity and malnutrition [26,38]. Moreover, the consumption of fruits and vegetables plays a crucial role in preventing micronutrient deficiencies. A diet rich in fruits and vegetables provides essential vitamins and minerals that are often lacking in energy-dense, low-nutrient foods. Unfortunately, the heavy reliance on energy-dense, low-nutrient foods is alarming, as it contributes to obesity among children with normal and stunted growth trajectories [38]. This reliance on energy-dense and low-caloric food is a consequence of limited access to fresh produce, economic constraints, and inflation [20,21,22]. To combat the intricate problem of paediatric obesity in Pakistan and other parts of the world, it is imperative to address these issues through specialised nutritional initiatives, such as enhancing maternal knowledge and practices and building healthy eating habits.
The food security of households and the socioeconomic status of families are also influencing the health and nourishment status of young children [33,39]. A substantial percentage of the Pakistani population faces trouble obtaining nutritious food because they live below the national poverty line [40]. These families may rely on less expensive, high-energy diets, which can result in the dual burden of malnutrition, where children are stunted and obese. Furthermore, Pakistan’s rising inflation rates have put a further burden on household budgets, making it harder for families to buy nutritious food. The cost of basic food is impacted by inflation, which may cause families to choose processed, less-nutrient-dense foods to make ends meet. This situation is especially worrisome for low-income families because they may prioritise calorie intake ahead of nutritional quality, unintentionally adding to the rising incidence of stunting and childhood obesity. Similarly, many studies exist in the literature that address the effects of rising food costs, particularly staple foods, on poverty in Pakistan and other low-income countries [41,42]. This access can reduce the dangers of malnutrition, emphasising how important one’s socioeconomic position is in influencing their eating habits.

4.1. Generalisability of Findings

In this study, datasets from the last two waves of PDHSs were used. The PDHS includes nationally representative data; therefore, the findings of this study represent the trends and practices of the dietary patterns among young children in Pakistan. However, these findings cannot be generalised to other countries due to differences in sociocultural, economic, environmental, religious, and dietary factors. In this regard, drawing cross-country comparisons, even within the same geographical region, can be challenging. Furthermore, the dietary data in this study captured the dietary behaviour of the last 24 h, and the dietary behaviour of an individual or a household does not remain constant. Therefore, caution is advised when generalising the findings of this study.

4.2. Strengths and Limitations

The strength of this study is the utilization of national datasets from the repository of the Demographic and Health Survey (DHS), which provides consistent, large, and nation-wide study coverage. The utilization of the most recent datasets of the last two waves of PDHSs with a large and diverse sample of 30,240 allowed for more reliable findings. This study’s probability and multistage cluster sampling methods further support the sample’s representativeness. Trained and experienced data collectors used a systematic questionnaire to collect data, guaranteeing the quality and reliability of the information acquired. Furthermore, the data was analysed using bivariate and multivariate logistic regression, which further strengthened the findings of this study. The comparison of the dietary habits across children with normal and stunted growth trajectories makes this study noteworthy since it offers important new information on the connection between obesogenic food and growth. However, this study has certain shortcomings, specifically the study design. The cross-sectional nature of this study limits the ability to establish cause-and-effect relationships between obesity and dietary patterns. The data was self-reported using the 24 h recall method and might have resulted in recall bias, in which the caregivers might have forgotten or misreported their children’s dietary intake, leading to inaccuracies. There might be the chance of reporting bias and social desirability bias alongside the recall biasness. Furthermore, the information only covers a single day of dietary intake, which is not representative of typical consumption trends. Even with these drawbacks, this study offers valuable insights and advances the knowledge of how nutrition affects children’s development in Pakistan.

4.3. Study Recommendations

To reduce the risk of paediatric obesity in Pakistan, it would be prudent to improve maternal health, food affordability, and access to dietary diversity. The provision of better nutrition and healthcare to women of reproductive age, including adolescent girls, is pivotal for improving maternal and neonatal health outcomes. Mass educational awareness regarding the Infant and Young Children Feeding guidelines can help all community members make informed choices about breastfeeding and supplemental feeding. The nutritional adversities in young children can also be averted by providing affordable, accessible, and locally available food options, such as vitamin A-rich fruits and vegetables, so that mothers can feed a variety of foods to their children. Moreover, promoting home-based livestock and gardening practices can provide sustainable sources of milk, eggs, and vegetables as an alternative to pricey market purchases. Hence, there is a need to reform policies to combat inflation and stabilise food prices for improving food affordability, food accessibility, and nutrition outcomes.

4.4. Future Research Directions

Future research should explore the long-term relationships between obesity, dietary habits, and cultural conventions that influence food preferences. Worldwide, including in Pakistan, cultural conventions play an integral role in shaping food preferences. These preferences are influenced by historical, ethnic, and religious factors, with each region having its unique culinary practices.
In addition, qualitative research is required to gain a better understanding of the lived experiences of paediatric obesity with different types of feeding practices. Nutritional studies in controlled settings can assist with establishing the efficacies of various therapies. Similarly, collecting data utilizing food frequency questionnaires, plate sizes, and portion sizes can provide useful insights into dietary trends and their relationships with paediatric obesity.

4.5. Implications for Public Health

There is an urgent need for customised dietary interventions that consider the different requirements of children with normal growth and those with stunted growth. To guarantee that children have a well-rounded diet, parent education programs should focus on improving dietary practices and food choices, including the significance of balanced complementary feeding practices. Campaigns could also raise awareness of the dangers of relying too much on breastmilk and the importance of introducing a range of foods while weaning. Many countries have implemented IYCF campaigns, such as the “first foods” initiative by UNICEF. Governments must develop policies that enhance the consumption of healthy foods, like providing financial aid for healthier choices and controlling food marketing for children. It is possible to foster a healthier future for our children by combining education, advocacy, and policymaking.

5. Conclusions

This study examined the dietary patterns of various types of food groups among obese children with normal and stunted growth trajectories using the last two waves of PDHSs. The prevalence of obesity among children with normal heights declined over the course of the two survey periods, whereas it was constant among children who were stunted. The research showed that the children’s primary food groups were cereals and grains and dairy products, including breastmilk. Between paediatric obesity and breastfeeding, a complex and intricate relationship exists. The complicated relationship of paediatric obesity with various types of food groups can be simplified by conducting longitudinal interventional and non-interventional studies with large cohorts. Furthermore, maternal education regarding the different types of food groups, food choices, and dietary habits can also aid in alleviating the burden of paediatric obesity and undernutrition. Additionally, targeted nutrition programs and culturally adapted caregiver education are essential to fostering healthy growth and reducing the obesity risk in early childhood.

Author Contributions

A.K. worked on project conception, data screening, data cleaning, data analysis, project conceptualization, and overall supervision of the study, I.A.U. contributed to project conception, data screening, data cleaning, data analysis, and drafted the initial methodology, M.K. contributed to writing the introduction, A.S.K. assisted M.K. in the introduction writing, N.u.A.S. refined and finalized the methodology section, M.J. assisted A.K. in writing the results section, while Y.R. wrote the discussion and conclusion section of this project. All authors have read and agreed to the published version of the manuscript.

Funding

This research received no external funding.

Institutional Review Board Statement

Not applicable.

Informed Consent Statement

In this study, the research team received data from DHS repository which was de-identified, i.e., it does not contain information in which a participant can either be identified or traced by any means. Due to this reason, this study does not involve a statement for informed consent.

Data Availability Statement

The data from this study can be retrieved from the DHS program (www.dhsprogram.com).

Acknowledgments

We would like to acknowledge the data archivist of the Demographic and Health Surveys (DHS) Program, who provided access to the datasets of all the Demographic and Health Surveys (DHS) implemented in Pakistan for analysis.

Conflicts of Interest

The authors declare no conflict of interest.

References

  1. Victora, C.G.; Adair, L.; Fall, C.; Hallal, P.C.; Martorell, R.; Richter, L.; Sachdev, H.S.; Maternal and Child Undernutrition Study Group. Maternal and child undernutrition: Consequences for adult health and human capital. Lancet 2008, 371, 340–357. [Google Scholar] [CrossRef] [PubMed]
  2. Saavedra, J.M. Early nutrition, the development of obesity, and its long-term consequences. In Early Nutrition and Long-Term Health: Mechanisms, Consequences, and Opportunities, 2nd ed.; Woodhead Publishing: Cambridge, Cambs, UK, 2022; pp. 437–491. [Google Scholar]
  3. Haroun, D.; ElSaleh, O.; Wood, L. Dietary and Activity Habits in Adolescents Living in the United Arab Emirates: A Cross-Sectional Study. Arab. J. Nutr. Exerc. 2017, 1, 85–100. [Google Scholar] [CrossRef]
  4. Butler, É.M.; Fangupo, L.J.; Cutfield, W.S.; Taylor, R.W. Systematic review of randomised controlled trials to improve dietary intake for the prevention of obesity in infants aged 0–24 months. Obes. Rev. 2021, 22, e13110. [Google Scholar] [CrossRef] [PubMed]
  5. Hardwick, J.; Sidnell, A. Infant nutrition—Diet between 6 and 24 months, implications for paediatric growth, overweight and obesity. Nutr. Bull. 2014, 39, 354–363. [Google Scholar] [CrossRef]
  6. Rapuano, K.M.; Tejavibulya, L.; Dinc, E.N.; Li, A.; Davis, H.; Korn, R.; Leibel, R.L.; Walsh, B.T.; Ranzenhofer, L.; Rosenbaum, M.; et al. Heightened sensitivity to high-calorie foods in children at risk for obesity: Insights from behavior, neuroimaging, and genetics. Brain Imaging Behav. 2023, 17, 461–470. [Google Scholar] [CrossRef] [PubMed]
  7. Dewey, K.G.; Begum, K. Long-term consequences of stunting in early life. Matern. Child Nutr. 2011, 7, 5–18. [Google Scholar] [CrossRef] [PubMed]
  8. Black, R.E.; Victora, C.G.; Walker, S.P.; Bhutta, Z.A.; Christian, P.; de Onis, M.; Ezzati, M.; Grantham-McGregor, S.; Katz, J.; Martorell, R.; et al. Maternal and child undernutrition and overweight in low-income and middle-income countries. Lancet 2013, 382, 427–451. [Google Scholar] [CrossRef] [PubMed]
  9. WHO. Indicators for Assessing Infant and Young Child Feeding Practices; World Health Organization: Geneva, Switzerland, 2021. [Google Scholar]
  10. Pries, A.M.; Rehman, A.M.; Filteau, S.; Sharma, N.; Upadhyay, A.; Ferguson, E.L. Unhealthy snack food and beverage consumption is associated with lower dietary adequacy and length for-age z-scores among 12–23-month-old children in Kathmandu Valley, Nepal. J. Nutr. 2019, 149, 1843–1851. [Google Scholar] [CrossRef] [PubMed]
  11. Obesity and Overweight [Internet]. Available online: https://www.who.int/news-room/fact-sheets/detail/obesity-and-overweight? (accessed on 29 January 2025).
  12. Hu, J.; Aris, I.M.; Lin, P.-I.D.; Rifas-Shiman, S.L.; Perng, W.; Baidal, J.A.W.; Wen, D.; Oken, E. Longitudinal associations of modifiable risk factors in the first 1000 days with weight status and metabolic risk in early adolescence. Am. J. Clin. Nutr. 2021, 113, 113–122. [Google Scholar] [CrossRef] [PubMed]
  13. Luque, V.; Mucarzel, F.; Hertogs, A.; Seed, P.T.; Flynn, A.C.; Poston, L.; Dalrymple, K.V. Associations between maternal diet, family eating habits and preschool children’s dietary patterns: Insights from the UPBEAT trial. Nutr. J. 2024, 23, 115. [Google Scholar] [CrossRef] [PubMed]
  14. Monteiro, C.A.; Cannon, G.; Levy, R.B.; Moubarac, J.-C.; Louzada, M.L.C.; Rauber, F.; Khandpur, N.; Cediel, G.; Neri, D.; Martinez-Steele, E.; et al. Ultra-processed foods: What they are and how to identify them. Public Health Nutr. 2019, 22, 936–941. [Google Scholar] [CrossRef] [PubMed]
  15. Wells, J.C.; Sawaya, A.L.; Wibaek, R.; Mwangome, M.; Poullas, M.S.; Yajnik, C.S.; Demaio, A. The double burden of malnutrition: Aetiological pathways and consequences for health. Lancet 2020, 395, 75–88. [Google Scholar] [CrossRef] [PubMed]
  16. Swinburn, B.A.; Kraak, V.I.; Allender, S.; Atkins, V.J.; Baker, P.I.; Bogard, J.R.; Brinsden, H.; Calvillo, A.; De Schutter, O.; Devarajan, R.; et al. The global syndemic of obesity, undernutrition, and climate change: The Lancet Commission report. Lancet 2019, 393, 791–846. [Google Scholar] [CrossRef] [PubMed]
  17. Ziyab, A.H.; Karmaus, W.; Kurukulaaratchy, R.J.; Zhang, H.; Arshad, S.H. Developmental trajectories of Body Mass Index from infancy to 18 years of age: Prenatal determinants and health consequences. J. Epidemiol. Community Health 2014, 68, 934–941. [Google Scholar] [CrossRef] [PubMed]
  18. UNICEF. Pakistan Nutrition Profile; United Nations Children’s Fund: New York City, NY, USA.
  19. Khan, D.S.A.; Das, J.K.; Zareen, S.; Lassi, Z.S.; Salman, A.; Raashid, M.; Dero, A.A.; Khanzada, A.; Bhutta, Z.A. Nutritional Status and Dietary Intake of School-Age Children and Early Adolescents: Systematic Review in a Developing Country and Lessons for the Global Perspective. Front. Nutr. 2022, 8, 739447. [Google Scholar] [CrossRef] [PubMed] [PubMed Central]
  20. Khaliq, A.; Nambiar, S.; Miller, Y.; Wraith, D. Adherence to complementary feeding indicators and their associations with coexisting forms of malnutrition in children aged between 6 to 23.9 months of age. J. Public Health 2025, 33, 683–698. [Google Scholar] [CrossRef]
  21. Khaliq, A.; Wraith, D.; Miller, Y.; Nambiar, S. Association of Infant Feeding Indicators and Infant Feeding Practices with Coexisting Forms of Malnutrition in Children under Six Months of Age. Nutrients. 2022, 14, 4242. [Google Scholar] [CrossRef] [PubMed]
  22. Ali, M.; Arif, M.; Shah, A.A. Complementary feeding practices and associated factors among children aged 6-23 months in Pakistan. PLoS ONE. 2021, 16, e0247602. [Google Scholar] [CrossRef] [PubMed] [PubMed Central]
  23. Pakistan Demographic and Health Survey. Pakistan Demographic and Health Survey 2017–2018. Available online: https://dhsprogram.com/pubs/pdf/FR354/FR354.pdf (accessed on 19 February 2025).
  24. Pakistan Demographic and Health Survey. Pakistan Demographic and Health Survey 2012–2013. Available online: https://dhsprogram.com/pubs/pdf/FR290/FR290.pdf (accessed on 21 February 2025).
  25. Baidal, J.A.; Locks, L.M.; Cheng, E.R.; Blake-Lamb, T.L.; Perkins, M.E.; Taveras, E.M. Risk factors for childhood obesity in the first 1,000 days: A systematic review. Am. J. Prev. Med. 2016, 50, 761–779. [Google Scholar] [CrossRef] [PubMed]
  26. Shaban Mohamed, M.A.; AbouKhatwa, M.M.; Saifullah, A.A.; Hareez Syahmi, M.; Mosaad, M.; Elrggal, M.E.; Dehele, I.S.; Elnaem, M.H. Risk factors, clinical consequences, prevention, and treatment of childhood obesity. Children 2022, 9, 1975. [Google Scholar] [CrossRef] [PubMed]
  27. Victora, C.G.; Bahl, R.; Barros, A.J.D.; Franca, G.V.A.; Horton, S.; Krasevec, J.; Murch, S.; Sankar, M.J.; Walker, N.; Rollins, N.C.; et al. Breastfeeding in the 21st century: Epidemiology, mechanisms, and lifelong effect. Lancet 2016, 387, 475–490. [Google Scholar] [CrossRef] [PubMed]
  28. Pérez-Escamilla, R.; Tomori, C.; Hernández-Cordero, S.; Baker, P.; Barros, A.J.D.; Bégin, F.; Chapman, D.J.; Grummer-Strawn, L.M.; McCoy, D.; Menon, P.; et al. Breastfeeding: Crucially important, but increasingly challenged in a market-driven world. Lancet 2023, 401, 472–485. [Google Scholar] [CrossRef] [PubMed]
  29. Lamberti, L.M.; Fischer Walker, C.L.; Noiman, A.; Victora, C.; Black, R.E. Breastfeeding and the risk for diarrhea morbidity and mortality. BMC Public Health 2011, 11 (Suppl. 3), S15. [Google Scholar] [CrossRef] [PubMed] [PubMed Central]
  30. Khan, M.N.; Islam, M.M. Effect of exclusive breastfeeding on selected adverse health and nutritional outcomes: A nationally representative study. BMC Public Health 2017, 17, 1–7. [Google Scholar] [CrossRef] [PubMed] [PubMed Central]
  31. Hadi, H.; Fatimatasari, F.; Irwanti, W.; Kusuma, C.; Alfiana, R.D.; Asshiddiqi, M.I.N.; Nugroho, S.; Lewis, E.C.; Gittelsohn, J. Exclusive Breastfeeding Protects Young Children from Stunting in a Low-Income Population: A Study from Eastern Indonesia. Nutrients 2021, 13, 4264. [Google Scholar] [CrossRef] [PubMed] [PubMed Central]
  32. Hanif, H.M. Trends in breastfeeding and complementary feeding practices in Pakistan, 1990–2007. Int. Breastfeed. J. 2011, 6, 15. [Google Scholar] [CrossRef] [PubMed] [PubMed Central]
  33. Khan, S.; Zaheer, S.; Safdar, N.F. Determinants of stunting, underweight and wasting among children < 5 years of age: Evidence from 2012–2013 Pakistan demographic and health survey. BMC Public Health 2019, 19, 358. [Google Scholar] [CrossRef]
  34. Akombi, B.J.; Agho, K.E.; Merom, D.; Hall, J.J.; Renzaho, A.M. Multilevel Analysis of Factors Associated with Wasting and Underweight among Children Under-Five Years in Nigeria. Nutrients. 2017, 9, 44. [Google Scholar] [CrossRef] [PubMed] [PubMed Central]
  35. Das, S.; Gulshan, J. Different forms of malnutrition among under five children in Bangladesh: A cross sectional study on prevalence and determinants. BMC Nutr. 2017, 3, 1–12. [Google Scholar] [CrossRef]
  36. Kulkarni, G.; Dobe, M.; Ravi, M.D.; Verma, R.; Dutt, S.; Dutta, S.; Sehgal, S.; Complementary Feeding Consortium. Overcoming the Challenges of Complementary Feeding and the Potential Role of Fortified Infant Cereals: A Position Paper from India and Nepal. J. Pediatr. Perinatol. Child Health 2023, 7, 142–158. [Google Scholar]
  37. Nicklas, T.A.; O’Neil, C.E.; Fulgoni, V.L., 3rd. Nutrient intake, introduction of baby cereals and other complementary foods in the diets of infants and toddlers from birth to 23 months of age. AIMS Public Health 2020, 7, 123–147. [Google Scholar] [CrossRef] [PubMed] [PubMed Central]
  38. Gardner, R.; Feely, A.; Layte, R.; Williams, J.; McGavock, J. Adverse childhood experiences are associated with an increased risk of obesity in early adolescence: A population-based prospective cohort study. Pediatr. Res. 2019, 86, 522–528. [Google Scholar] [CrossRef] [PubMed]
  39. Chowdhury, M.R.; Rahman, M.S.; Khan, M.M.; Mondal, M.N.; Rahman, M.M.; Billah, B. Risk Factors for Child Malnutrition in Bangladesh: A Multilevel Analysis of a Nationwide Population-Based Survey. J. Pediatr. 2016, 172, 194–201.e1. [Google Scholar] [CrossRef] [PubMed]
  40. Asian Development Bank. Poverty Data: Pakistan. 2015. Available online: https://www.adb.org/countries/pakistan/poverty (accessed on 14 May 2025).
  41. Ivanic, M.; Martin, W. Implications of higher global food prices for poverty in low-income countries. Agric. Econ. 2008, 39, 405–416. [Google Scholar] [CrossRef]
  42. Shabnam, N.; Aurangzeb, N.; Riaz, S. Rising food prices and poverty in Pakistan. PLoS ONE. 2023, 18, e0292071. [Google Scholar] [CrossRef] [PubMed] [PubMed Central]
Figure 1. Prevalence and trends of obesity among infants and young children with stunted and normal heights.
Obesities 05 00055 g001
Figure 2. Minimum meal frequency among infants and young children of Pakistan across two survey periods.
Obesities 05 00055 g002
Table 1. Characteristics of the study sample, including demographic, health, and socioeconomic variables across two time periods (2012–2013 and 2017–2018).
VariablesCategoriesTotal (n = 1230)2012–2013 (n = 467)2017–2018 (n = 763)p-Value
Child factors
Child’s age6 to11.9 months36.9%41.8%33.9%0.012 *
12 to 17.9 months40.2%33.9%43.2%
18 to 23.9 months22.8%22.7%22.9%
SexMale49.8%48.6%50.6%0.500
Female50.2%51.4%49.4%
BirthweightNormal weight17.4%16.6%17.8%0.431
Low birthweight8%8.6%7.6%
Don’t know20.5%16.3%23.1%
Not weighted at birth54.1%58.5%51.4%
Birth sizeSmall or very small17%15.9%17.7%0.413
Average or large83%84.1%82.3%
DiarrhoeaNo70.8%71.0%70.6%0.885
Yes29.2%29.0%29.4%
FeverNo55%54%55.7%0.552
Yes45%46%44.3%
CoughNo57.5%61.9%54.8%0.014 *
Yes42.5%38.1%45.2%
Maternal factors
Maternal ageBelow 20 years4.4%3.4%5%0.417
20–34 years82.1%82.6%81.6%
35 years or more13.5%14%13.4%
Maternal educationNo education40.4%40.3%40.5%0.53
Primary15.6%18%14.2%
Secondary25.4%26.6%24.8%
Higher18.5%15.2%20.6%
Working motherNo89.4%88.2%90.2%0.281
Yes10.6%11.8%9.8%
Maternal body mass indexNormal weight48.5%56.6%43.6%<0.001 *
Obese14.7%10.4%17.3%
Overweight27.1%22.3%30%
Underweight9.7%10.6%9.1%
Caesarean sectionNo78.5%83.3%75.5%0.002 *
Yes21.5%16.7%24.5%
Household factors
Wealth indexPoorest13.9%13.1%14.4%0.006 *
Poorer20.1%16.7%22.1%
Middle21.1%19.5%22.1%
Richer20.8%25.7%17.8%
Richest24.1%25.1%23.5%
Family sizeSmall (1–4)32%33.2%30.7%0.335
Medium (5–10)58.1%52%59.7%
Large (10+)10%14.8%9.6%
Community factors
RegionICT7.6%7.9%7.3%<0.001 *
Punjab28.9%35.3%24.9%
Sindh16.3%17.1%15.9%
KPK28.6%33.2%25.8%
Baluchistan6.3%6.4%6.3%
FATA4.9%-7.9%
AJK7.4%-11.9%
Type of place of residenceUrban47.3%47.3%47.2%0.962
Rural52.8%52.7%52.8%
Periodic factors
Year201238%---
201762%--
* Significant association between two variables, with p-value ≤ 0.05.
Table 2. Dietary practices among infants and young children of Pakistan across two survey periods.
Food GroupSurvey Yearsp-Value
2012–2013 (n = 467)2017–2018 (n = 763)
Breastmilk74.1% (70.1% to 78.1%)71% (67.7% to 74.2%)0.245
Dairy products (animal milk, powder milk, yogurt, cheese, butter, etc.)54.4% (49.8% to 58.9%)54.3% (50.7% to 57.8%)0.708
Cereals and grains71% (66.8% to 75.1%)72.1% (68.9% to 75.2%)0.965
Lentils and nuts 9.2% (6.5% to 11.8%)9.2% (7.1% to 11.5%)0.984
Flesh foods (meats, chicken, organ meat, fish, and poultry)21.4% (17.6% to 25.1%)17.8% (15.1% to 20.5%)0.123
Eggs27% (22.9% to 31.1%)29.5% (26.2% to 32.7%)0.343
Vitamin A-rich fruits and vegetables18.8% (15.2% to 22.3%)17.8% (15.1% to 20.5%)0.654
Other fruits and vegetables38.8% (34.3% to 43.2%)32.8% (29.4% to 36.1%)0.033
Table 3. Examining the relationships of different types of food groups with obesity among infants and young children of Pakistan with stunted and normal heights.
VariablesCategoriesOverweight/ObeseNutritional Paradox
Unadjusted OddsAdjusted OddsUnadjusted OddsAdjusted Odds
Dietary factors
BreastmilkNo
Yes
Ref.
0.55 (0.27 to 1.11)
Ref.
0.37 (0.16 to 0.85) *
Ref.
2.08 (0.96 to 4.48)
Ref.
3.71 (1.08 to 12.62) *
Dairy productsNo
Yes
Ref.
1.05 (0.53 to 2.09)
Ref.
0.73 (0.42 to 1.29)
Cereals and grainsNo
Yes
Ref.
1.51 (0.63 to 3.51)
Ref.
0.72 (0.39 to 1.29)
Lentils and nutsNo
Yes
Ref.
0.28 (0.03 to 2.10)
Ref.
0.38 (0.09 to 1.60)
Flesh foodsNo
Yes
Ref.
1.28 (0.57 to 2.87)
Ref.
0.66 (0.29 to 1.49)
EggsNo
Yes
Ref.
0.88 (0.41 to 1.92)
Ref.
0.75 (0.39 to 1.46)
Vitamin A-rich fruits and vegetablesNo
Yes
Ref.
0.74 (0.28 to 1.93)
Ref.
0.26 (0.08 to 0.87) *
Other fruits and vegetablesNo
Yes
Ref.
0.98 (0.40 to 2.41)
Ref.
1.12 (0.55 to 2.28)
Minimum meal frequency (MMF)No
Yes
Ref.
0.51 (0.23 to 1.14)
Ref
0.44 (0.19 to 0.99) *
Ref.
0.82 (0.41 to 1.60)
Ref.
1.06 (0.47 to 2.39)
Child factors
Child month6 to 11.9 months
12 to 17.9 months
18 to 23.9 months
Ref.
0.88 (0.39 to 1.99)
1.31 (0.56 to 3.08)
Ref.
0.52 (0.27 to 0.99) *
0.46 (0.21 to 1.04)
SexMale
Female
Ref.
0.99 (0.44 to 1.75)
Ref.
1.11 (0.63 to 1.96)
BirthweightNormal
LBW
Ref.
1.64 (0.50 to 5.31)
Ref.
2.29 (0.72 to 7.32)
Birth sizeNormal size
Small size
Ref.
1.28 (0.55 to 2.98)
Ref.
1.20 (0.59 to 2.45)
DiarrhoeaNo
Yes
Ref.
0.60 (0.26 to 1.40)
Ref.
0.57 (0.28 to 1.15)
FeverNo
Yes
Ref.
1.49 (0.75 to 2.97)
Ref.
0.25 (0.12 to 0.52) *
CoughNo
Yes
Ref.
1.48 (0.74 to 2.93)
Ref.
0.36 (0.18 to 0.71) *
Maternal factors
Maternal ageBelow 20 years
20–34 years
35 years or more
Ref.
0.67 (0.15 to 2.93)
0.95 (0.18 to 4.88)
Ref.
0.71 (0.21 to 2.37)
0.74 (0.18 to 2.98)
Maternal educationNo education
Primary
Secondary
Higher
Ref.
0.75 (0.24 to 2.35)
0.92 (0.37 to 2.26)
1.46 (0.61 to 3.47)
Ref.
0.36 (0.13 to 0.93) *
0.26 (0.11 to 0.64) *
0.37 (0.15 to 0.91) *
Working mothersNo
Yes
Ref.
0.25 (0.03 to 1.85)
Ref.
1.10 (0.46 to 2.64)
Maternal body mass indexNormal weight
Obese
Overweight
Underweight
Ref.
1.99 (0.81 to 4.90)
1.52 (0.67 to 3.45)
0.73 (0.16 to 3.29)
Ref.
0.31 (0.09 to 1.04)
0.93 (0.50 to 1.73)
0.15 (0.02 to 1.13)
Caesarean sectionNo
Yes
Ref.
2.26 (1.11 to 4.58) *
Ref.
2.21 (1.01 to 5.05) *
Ref.
0.48 (0.21 to 1.15)
Household factors
Wealth indexPoorest
Poorer
Middle
Richer
Richest
Ref.
0.89 (0.27 to 2.85)
0.59 (0.16 to 2.07)
0.72 (0.21 to 2.41)
1.18 (0.40 to 3.46)
Ref.
0.30 (0.13 to 0.68) *
0.18 (0.07 to 0.47) *
0.19 (0.07 to 0.48) *
0.31 (0.14 to 0.67) *
Family sizeSmall (1–4)
Medium (5–10)
Large (10+)
Ref.
1.63 (0.37 to 7.09)
1.93 (0.42 to 8.75)
Ref.
1.18 (0.41 to 3.43)
1.44 (0.47 to 4.39)
Community factors
Type of place of residenceUrban
Rural
Ref.
1.15 (0.57 to 2.28)
Ref.
1.29 (0.73 to 2.29)
* Significant association between two variables, with p-value ≤ 0.05.
Disclaimer/Publisher’s Note: The statements, opinions and data contained in all publications are solely those of the individual author(s) and contributor(s) and not of MDPI and/or the editor(s). MDPI and/or the editor(s) disclaim responsibility for any injury to people or property resulting from any ideas, methods, instructions or products referred to in the content.

