Article

The Possible Impact of COVID-19 on Glycated Hemoglobin and Systolic Blood Pressure in Type 2 Diabetes and Obesity

by
Tatiana Palotta Minari
1,*,
Carolina Freitas Manzano
1,
Louise Buonalumi Tácito Yugar
2,
Luis Gustavo Sedenho-Prado
2,
Tatiane de Azevedo Rubio
3,
Lúcia Helena Bonalumi Tácito
4,
Antônio Carlos Pires
4,
José Fernando Vilela-Martin
1,
Luciana Neves Cosenso-Martin
4,
Nelson Dinamarco Ludovico
5,
André Fattori
3,
Juan Carlos Yugar-Toledo
1,
Heitor Moreno
3 and
Luciana Pellegrini Pisani
6
1
Department of Hypertension, State Faculty of Medicine of São José do Rio Preto (FAMERP), São José do Rio Preto 15090-000, SP, Brazil
2
School of Medical Sciences, State University of Campinas (UNICAMP), Campinas 13083-887, SP, Brazil
3
Cardiovascular Pharmacology & Hypertension Laboratory, School of Medical Sciences, State University of Campinas (UNICAMP), Campinas 13083-887, SP, Brazil
4
Department of Endocrinology, State Faculty of Medicine of São José do Rio Preto (FAMERP), São José do Rio Preto 15090-000, SP, Brazil
5
Department of Health, Medical College, State University of Santa Cruz (UESC), Salobrinho, Ilhéus 45662-900, BA, Brazil
6
Department of Bioscience, Federal University of São Paulo (UNIFESP), Santos 11015-020, SP, Brazil
*
Author to whom correspondence should be addressed.
Obesities 2024, 4(4), 412-426; https://doi.org/10.3390/obesities4040033
Submission received: 22 September 2024 / Revised: 19 October 2024 / Accepted: 22 October 2024 / Published: 25 October 2024
(This article belongs to the Special Issue Obesity and Its Comorbidities: Prevention and Therapy)

Abstract

:
Background: There are still discrepancies in the literature as to whether COVID-19 infection could impact biochemical, anthropometric, and cardiovascular markers. The purpose of this study was firstly to observe the effects of COVID-19 infection over 12 months on Type 2 diabetes (T2D) and obesity. Secondarily, we analyzed the individual influence of COVID-19 infection on changes in biochemical, anthropometric, and cardiovascular markers. Methods: This study is part of a secondary analysis of a recently published article. The research involved 84 participants with T2D, divided into two groups: the control group (40 participants) received only medical care, while the intervention group (44 participants) received both medical care and nutritional assessment. Consultations were held quarterly over 12 months, with a follow-up after 3 months. Data Analysis: For influence analysis, non-normal variables were compared using the Mann–Whitney test, and normal variables were compared using unpaired t-tests. For all cases, α = 0.05 and p < 0.05 were considered significant. Results: The analysis revealed a high percentage of patients in both groups who had a COVID-19 infection (70% control and 72.7% intervention) over 12 months. Regarding the influence analysis, participants in the intervention group who were infected with COVID-19 showed smaller reductions in glycated hemoglobin (HbA1c) (p = 0.0120) and systolic blood pressure (SBP) (p = 0.0460). For the other biochemical, anthropometric, and cardiovascular markers, in both groups, no significant differences were found (p > 0.05). Conclusion: COVID-19 possibly influenced SBP and HbA1c levels over 12 months in people with T2D and obesity. However, caution should be exercised in generalizing these results due to the limitations of this study. Additionally, influence analysis does not establish a causal relationship, and more clinical trials in different populations are needed to fully analyze this topic.

Graphical Abstract

1. Introduction

Diabetes mellitus is characterized by chronic hyperglycemia due to inadequate insulin production or function by pancreatic β cells [1]. It is diagnosed with fasting blood glucose levels of 126 mg/dL or higher and glycated hemoglobin (HbA1c) values of 6.5% or more [2]. Excess weight, particularly abdominal obesity, leads to inflammation and insulin resistance (IR), thereby increasing the risk of Type 2 diabetes (T2D) [2,3,4,5]. Weight reduction is crucial for managing blood sugar levels in patients with T2D and overweight [2,3,4,5], as achieving a negative energy balance provides numerous anti-inflammatory effects [6,7,8,9,10,11,12,13]. However, the main challenge in diabetes and obesity management within public health is reconciling cost-effective strategies for socioeconomically vulnerable patients, promoting weight management, glycemic control, and biochemical markers [8,9]. Nutritionists create practical meal plans and educate patients on nutritional composition, fostering autonomy and informed decisions. Lifestyle modifications include straightforward strategies that do not require substantial public spending or complex logistics [8,9,10,11,12].
On the other hand, there is more evidence over time showing the impact of the COVID-19 pandemic on the worsening of glycemic control, blood pressure, and cardiovascular markers. Several hypotheses have been proposed for this, and it is widely known that patients with diabetes, hypertension, obesity, and heart disease have a higher probability of being infected, as well as a lower chance of controlling and treating the disease [3]. The post-infection sequelae of COVID-19 are other major challenges, especially for patients receiving public care with high social vulnerability. The decrease in nutritional food quality and sedentary lifestyles caused by the lockdown are also other issues frequently listed in the literature [8].
Therefore, it is crucial to investigate these topics during significant events in human history, such as the COVID-19 pandemic. The pandemic has not only affected the health of individuals but has also significantly influenced various aspects of society, including public health policies, economic stability, and social behaviors [8]. Understanding the impact of such events on conditions like diabetes, hypertension, obesity, and heart disease can provide valuable insights for healthcare professionals and policymakers. This can help in the development of effective strategies for disease management during similar crises in the future [2,3].
Moreover, studying the long-term effects of the pandemic, including post-infection sequelae and changes in lifestyle changes due to lockdowns, can further contribute to our understanding of the pandemic’s overall impact on human health. These investigations are particularly important for vulnerable populations that have been disproportionately affected by the pandemic [14,15,16]. Research in these areas can guide interventions to reduce health disparities and improve health outcomes in these groups. In conclusion, the COVID-19 pandemic has underscored the importance of comprehensive and timely research to address global health crises and their aftermath. It is a reminder that we must remain vigilant and prepare for future challenges [8].
Consequently, the motivation behind this research was to explore these points further, as they still lack robust data in the existing scientific foundation. Consequently, the objectives of this study were first to observe COVID-19 infections in both study groups over 12 months. Second, we analyzed the individual influence of COVID-19 infection on weight, body mass index (BMI), waist circumference (WC), total cholesterol (TC), HDL cholesterol (HDL-C), LDL cholesterol (LDL-C), triglycerides (TG), HbA1c, fasting blood glucose (FBG), diastolic blood pressure (DBP), and systolic blood pressure (SBP) in both study groups during the 1st to 12th visits on T2D and obesity.

2. Materials and Methods

2.1. Study Population/Participants

Participants diagnosed with T2D and obesity were recruited from the Hypertension and Endocrinology Outpatient Clinics, both affiliated with the “Hospital de Base” in São José do Rio Preto, SP, Brazil. The sample size was determined using the principle of “convenience sampling”, which involves selecting participants who are readily available and willing to participate in the research within a specific location and timeframe. This approach is often used in hospital-based studies, owing to its practical benefits. It can be simpler and faster to set up, bypassing the need for a complex selection process, and is particularly advantageous for preliminary or exploratory studies that aim to gather initial insights. Furthermore, this sampling method is more cost-effective and resource-efficient, especially when faced with time or budget constraints. Throughout the study, the samples were continuously analyzed, evaluated, and monitored to mitigate potential selection bias.
Initially, 93 individuals were monitored at both clinics at the start of the study. After applying the selection criteria, the sample size was reduced to 89 participants. The participants were then divided into two groups: (a) Control Group (n = 44): Participants received only conventional medical evaluation. (b) Intervention Group (n = 45): Participants received the same medical care along with a nutritional assessment.
The division of patients between the groups was based on the flow of consultations. On average, 9 patients were seen on Wednesdays, with the first patient directed to the control group, the second to the intervention group, the third to the control group, the fourth to the intervention group, and so on. This process aimed to mitigate bias and any influence in the selection of patients for each group, given that this was a non-randomized and non-blinded clinical study, and no specific randomization software was used.
During the course of the project, due to unforeseen events (deaths and dropouts), the number of individuals in the control group decreased to 40, while that in the intervention group remained at 44. Consequently, the final sample size was 84 participants, with 40 in the control group and 44 in the intervention group. More details regarding the sample flowchart can be found in the first published research study [17].

2.2. Inclusion Criteria

-
Adults aged between 18 and 80 years, with the aim of expanding the sample size and recruiting as many participants as possible.
-
Both male and female participants, with the goal of increasing the sample size and enrolling as many patients as feasible.
-
Diagnosis of T2D, confirmed by fasting plasma glucose levels of ≥126 mg/dL and HbA1c levels of ≥6.5%. The diagnosis of T2D was confirmed before the start of the study. It was previously performed by a doctor during consultation based on changes in blood glucose and glycated hemoglobin tests. All participants underwent the necessary diagnostic tests before enrollment in the study.
-
Willingness to participate in quarterly meetings over a 36-month period.
-
BMI ≥ 30 kg/m2.
-
Sedentary lifestyle.

2.3. Exclusion Criteria

-
Individuals who were unable to complete the requested assessments.
-
Participants who could not maintain regular attendance for data collection.
-
Those without a confirmed diagnosis of T2D and obesity.
-
Individuals undergoing insulin therapy.
-
Participants taking sodium-glucose cotransporter-2 (SGLT-2) inhibitors and/or glucagon-like peptide-1 (GLP-1) analogues. These medications were excluded to prevent confounding variables that could have skewed the study results. Their significant impact on glycemic control and other metabolic parameters could interfere with the measured outcomes.
-
Individuals with chronic kidney disease.
-
Eutrophic or malnourished participants.
-
Individuals engaging in more than 150 min of exercise per week.

2.4. Study Design and General Information

This descriptive, observational, and experimental study was a secondary evaluation of a recently published longitudinal research project. The initial publication was a prospective longitudinal study that included experimental work without randomization or blinding. The first interaction with the participants took place in the outpatient consultation room, where comprehensive details about the research project (including dates, duration, procedures, and other variables) were shared. After understanding and agreeing to participate, all participants signed the Informed Consent Form (ICF).
Nutritional consultations were held quarterly over a span of three years (2020 to 2023). Typically, outpatient appointments were scheduled weekly. However, due to the COVID-19 pandemic, they were adjusted to biweekly sessions on Wednesdays from 8 am to 12 pm, extending from 2020 to 2023. This resulted in 12 months of data collection, followed by a 3-month post-intervention follow-up period (totaling 15 months). On each Wednesday, up to nine patients were observed, depending on appointment availability and outpatient flow. Each session lasted approximately 1 h per participant. Data collection began immediately after the first COVID-19 lockdown on 16 August 2020. Throughout the pandemic, strict adherence to social distancing, mask wearing, and personal hygiene protocols was maintained to safeguard the health of both patients and researchers.
During the first year of care (2020 and 2021), nutritional consultations were comprehensive and intensive with the aim of refining dietary plans, disseminating knowledge, and making necessary adjustments. Each quarterly visit included the collection of anthropometric measurements, biochemical parameters, cardiovascular evaluations, participants’ food diaries, and research protocols. Additional characteristics of the study population, such as race, socioeconomic status, physical activity level, dietary quality, and COVID-19 infection status, were also recorded.
In 2022, consultations shifted to an educational and supportive approach, monitoring patient progress and reinforcing previously discussed principles. Finally, in 2023, the researcher refrained from providing further guidance to the participants during the follow-up period to minimize the potential influence on the results. Data were collected on 15 November 2023.
Given the limitation of biweekly appointments, it was necessary to conduct a 3-year intervention to complete a data analysis spreadsheet within a 15-month period (comprising 12 months of intervention and 3 months of follow-up). More details can also be found in a previously published study [17].

2.5. Evaluation of Physical Exercises and Medications

Physical activity was assessed using a conventional qualitative survey to distinguish between active and sedentary individuals. Patients who engaged in five or more training sessions per week, totaling 250 min/week, were categorized as “active (>5 sessions)/moderate (=5 sessions).” Those who participated in up to three training sessions per week, with a total duration of 150 min/week, were classified as “light.” Individuals who did not meet these recommendations (<3 sessions or none) were deemed “sedentary.” Only sedentary individuals were included in this study.
Medications were controlled throughout the study in both groups to minimize potential interference with the intervention. This was achieved by maintaining consistent medication regimens for all participants, ensuring that no changes were made to their prescribed treatments that could affect study outcomes. Regular monitoring and documentation were performed to confirm adherence. Medication use among the participants in both groups included oral hypoglycemic agents, such as metformin and/or gliclazide. Additionally, various other medications were used, including antihypertensives (hydrochlorothiazide, furosemide, losartan, captopril, enalapril, atenolol, amlodipine, ramipril, and others), statins (simvastatin, rosuvastatin, and atorvastatin), sodium levothyroxine, supplements (vitamin D, calcium, iron, and vitamin B12), and antidepressants (amitriptyline and sertraline). Most prescriptions were provided during consultations at the Hypertension or Endocrinology Outpatient Clinic and were available free of charge at the Brazilian Public Health System (SUS) pharmacy. There were no changes in medication prescriptions throughout the intervention period.

2.6. Nutritional Interventions and Protocols

Quarterly meetings and nutritional interventions were based on extensive nutritional evaluations, incorporating anthropometric, biochemical, clinical, and dietary analyses. These were complemented by quantitative and qualitative nutritional strategies. These initiatives culminated in the creation of a personalized food plan, inspired by the mediterranean diet and dietary approaches to stop hypertension (DASH), adapted for the Brazilian population [17].
The nutritional anamnesis protocol evaluates clinical and dietary parameters, aiding in the comprehensive assessment of participants and potentially alerting them to diet-related risk signs and diseases. The anthropometric, biochemical, and clinical evaluation protocol analyzed anthropometric, biochemical, clinical, and other general parameters to assist in the thorough evaluation of participants. The dietary evaluation protocol (habitual food recall) assesses patients’ usual food intake, allowing for a detailed evaluation of both quantitative and qualitative aspects, and subsequent calculations, estimates, and identification of possible deficiencies and excesses. The sociodemographic research protocol provides general data such as age, sex, socioeconomic level, race, and other details. Social classes were categorized as follows: class A (earning more than 20 minimum wages), class B (10 to 20 minimum wages), class C (4 to 10 minimum wages), class D (2 to 4 minimum wages), and class E (up to 2 minimum wages) [17].

2.7. COVID-19 Pandemic

The occurrence of COVID-19 infection was assessed throughout the 12-month intervention period, using a simple “yes” or “no” metric. Individuals who responded with “yes” had contracted COVID-19 at least once during the study, while those who responded with “no” had not been infected with COVID-19 during the study period. These data were gathered during nutritional evaluations using a clinical nutrition analysis protocol [18]. Disease diagnosis was carried out using the reverse transcription polymerase chain reaction (RT-PCR) test for all participants.

2.8. Ethical Aspects

This research project was submitted to the Ethics Committee for Human Research at the State Faculty of Medicine of São José do Rio Preto (FAMERP), São Paulo, Brazil, and received approval on 18 July 2020 (CAAE: 33554520.0.0000.5415). The study was also registered on Clinical Trials (NCT06235762).
All the participants voluntarily agreed to participate by signing the ICF, which was prepared in accordance with the principles of the Declaration of Helsinki. They individually responded to the scheduled study instruments with the assistance of a researcher. Confidentiality and anonymity were ensured to protect the identity of the interviewees.

2.9. Research Construction, Management, and Databases—REDCap FAMERP/FUNFARME

The study data were collected, managed, and stored using REDCap 14.0.9 electronic data capture tools hosted at REDCap—FUNFARME/FAMERP, the State Faculty of Medicine of São José do Rio Preto, São Paulo, Brazil. Access to this platform was available from 16 August 2020 to 16 May 2024 [19,20].

2.10. Statistical Analysis

For the variable “COVID-19 infection”, the absolute counts of study participants in each category were transformed into percentages relative to the total number of individuals in the study.
The individual influence analyses of COVID-19 infection on the quantitative variables studied were evaluated using quantitative variables that showed a significant difference within each group (control or intervention) throughout the study.
The variations in these variables between the first visit and the twelfth month (delta) were calculated and compared among the participants who had contracted or did not contract COVID-19 over the 12 months, within each experimental group.
Delta was subjected to the Shapiro–Wilk test for normality verification. Those considered non-parametric were compared using a two-tailed Mann–Whitney test, while those considered parametric were compared using a two-tailed unpaired t-test.
Data that were not normally distributed are displayed as median ± interquartile range (IQR), while normally distributed data are shown as the mean ± standard deviation (SD). Both types of data were accompanied by the dispersion of all replicates. α = 0.05 and p < 0.05 were used. GraphPad Prism 9.0® software [21] was used for all statistical analyses.

3. Results

3.1. Demographics, Anthropometric, Biochemical, and Cardiovascular Data

Table 1 presents the demographic data and general health markers of the participants in the control and intervention groups at baseline.
Table 2 presents the difference in anthropometric and biochemical markers between baseline and 12 months for the control and intervention groups.

3.2. COVID-19 Infection

Table 3 illustrates the COVID-19 infection data of research participants from the control and intervention groups, obtained over 12 months.
A large portion of participants in both the intervention and control groups contracted COVID-19 at least once during the intervention period.

3.3. Individual Influence Analysis Between Qualitative Variable (COVID-19 Infection) vs. Quantitative Variables (FBG, HbA1c, Weight, and BMI) in the Control Group

For the analysis within the control group, only variables that demonstrated statistically significant differences and were closely associated with glycemic control and cardiovascular risk were considered. This includes FBG, HbA1c, weight, and BMI (p < 0.05).
Regarding the individual influence of COVID-19 infection on FBG and HbA1c levels, no significant differences were observed (p > 0.05). All individuals in the control group responded relatively similarly (Figure 1).
In the individual influence analysis of COVID-19 infection on weight and BMI, no significant differences were observed in the control group (p > 0.05). All individuals in the control group responded relatively similarly (Figure 2).

3.4. Individual Influence Analysis Between Qualitative Variable (COVID-19 Infection) vs. Quantitative Variables (FBG, HbA1c, LDL-C, HDL-C, TG, Weight, BMI, WC, SBP, and DBP) in the Intervention Group

For the analysis within the intervention group, only variables that demonstrated statistically significant differences (p < 0.05) and were closely associated with glycemic control and cardiovascular risk were considered. This included FBG, HbA1c, LDL-C, HDL-C, TG, weight, BMI, WC, SBD, and DBP (p < 0.05).
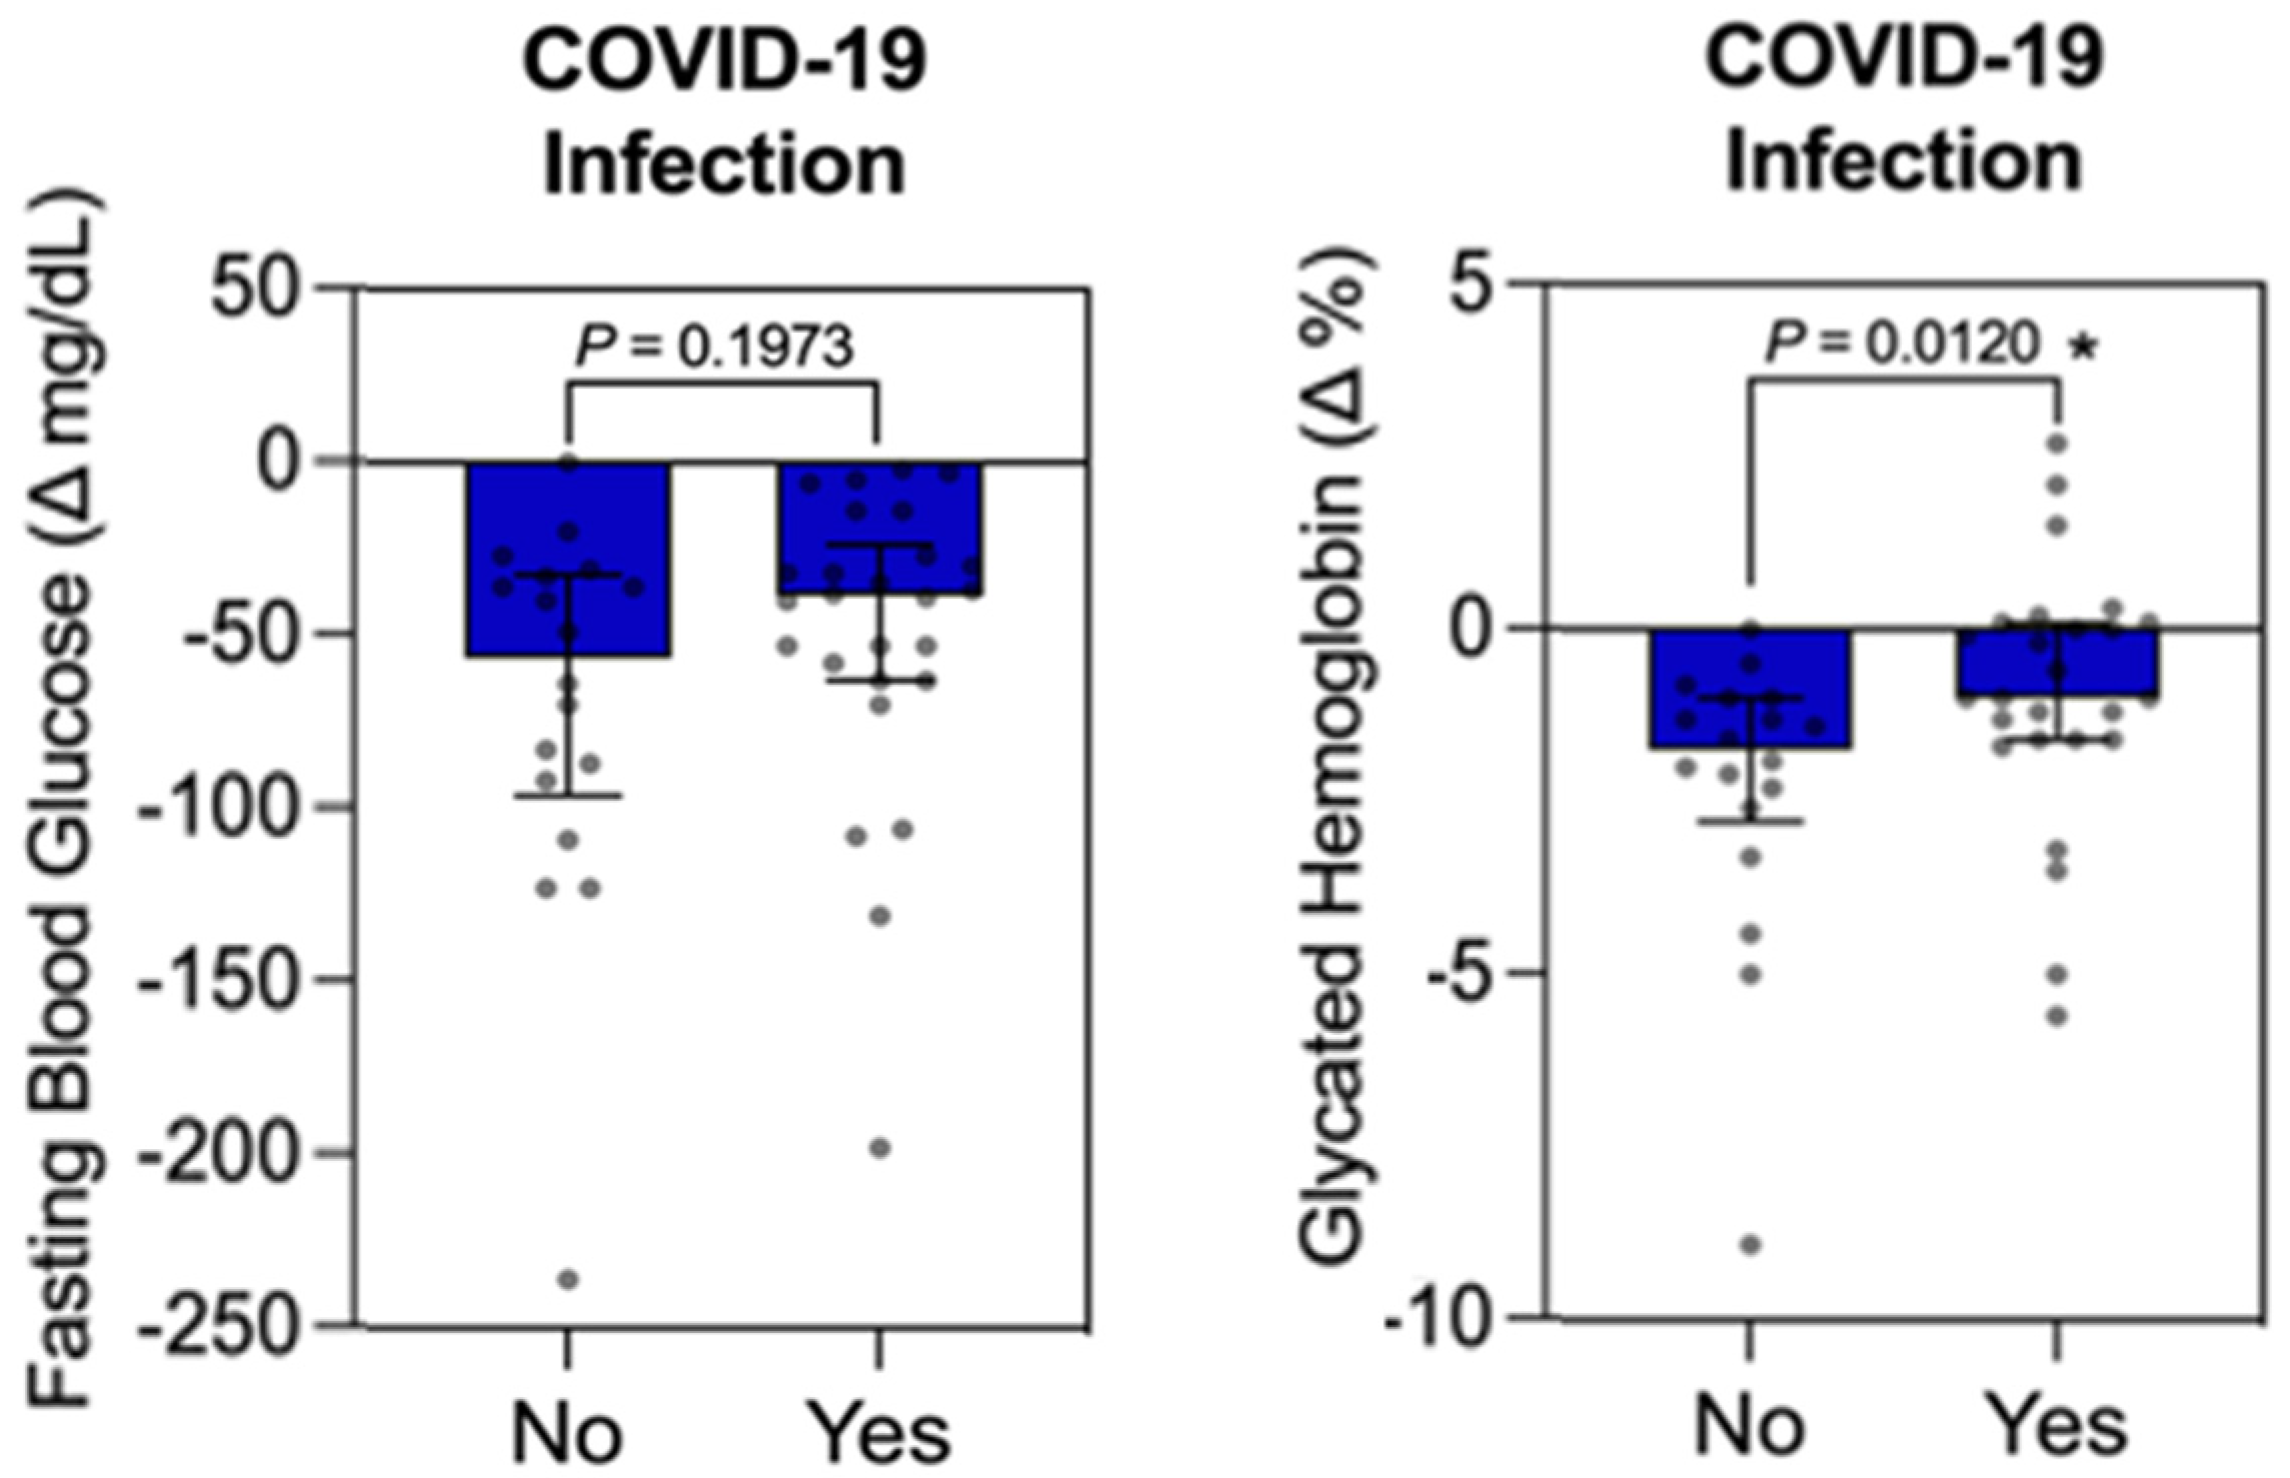
Regarding the individual influence analysis of COVID-19 infection on FBG, no significant differences were observed (p > 0.05). All participants in the intervention group responded relatively similarly (Figure 3). For the individual influence analysis of COVID-19 infection on HbA1c levels, a significant difference was observed (p = 0.0120). Participants in the intervention group who were infected with COVID-19 during the study period showed a smaller reduction in HbA1c levels, as illustrated in Figure 3.
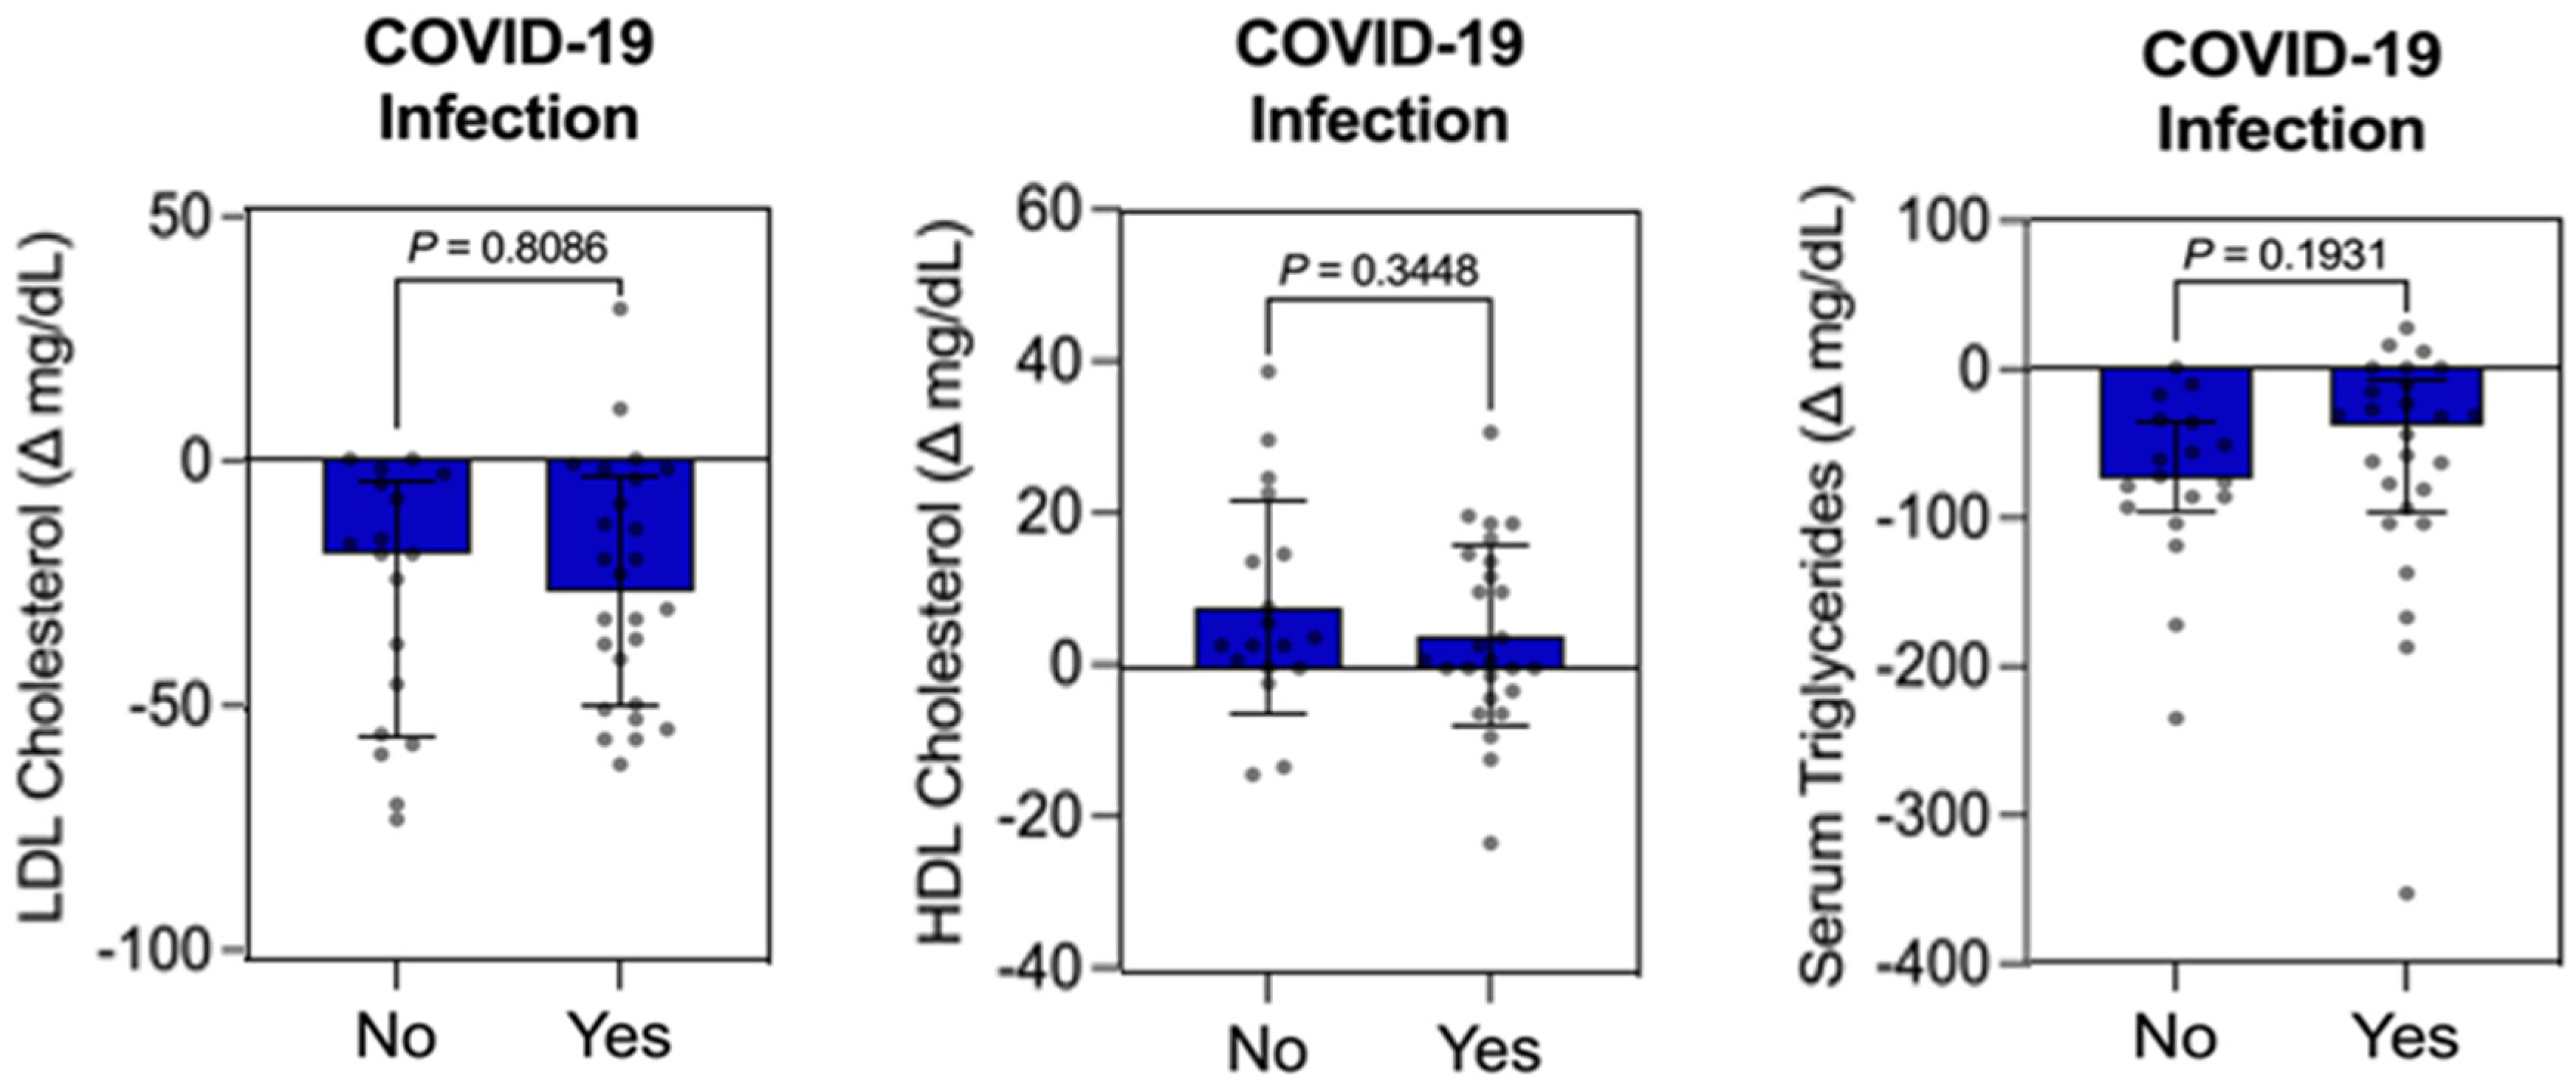
For the individual influence analysis of COVID-19 infection on LDL-C, HDL-C, and TG levels, no significant differences were observed (p > 0.05), and all participants in the intervention group responded relatively similarly (Figure 4).
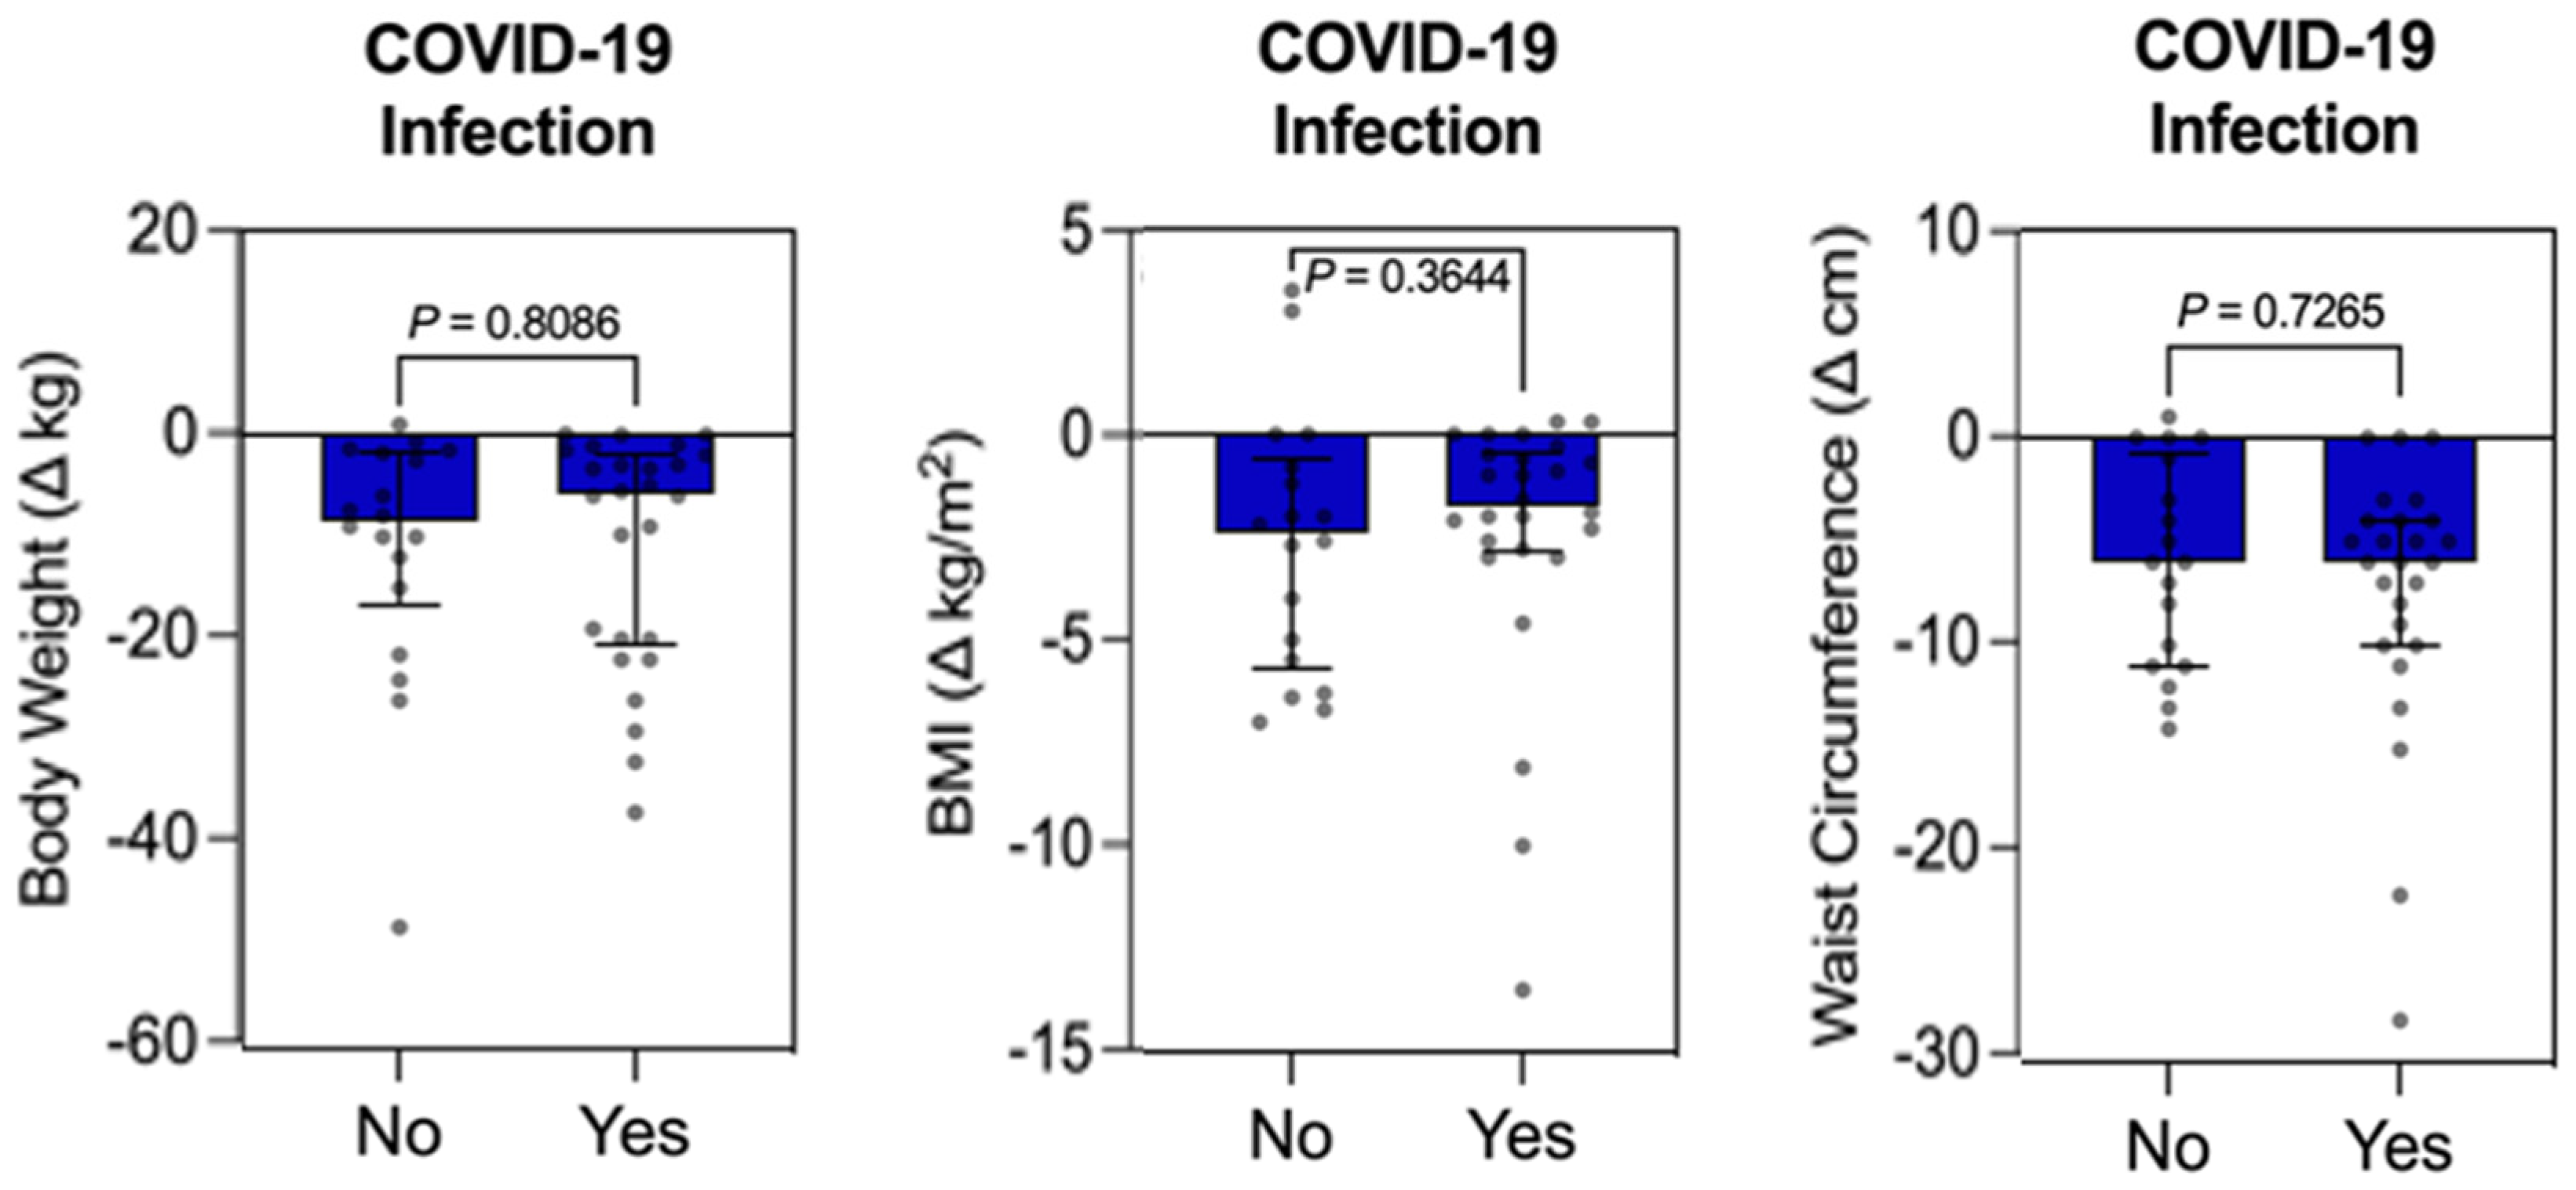
In the individual influence analysis of COVID-19 infection on weight, BMI, and WC, no significant differences were observed (p > 0.05), and all participants in the intervention group responded relatively similarly (Figure 5).
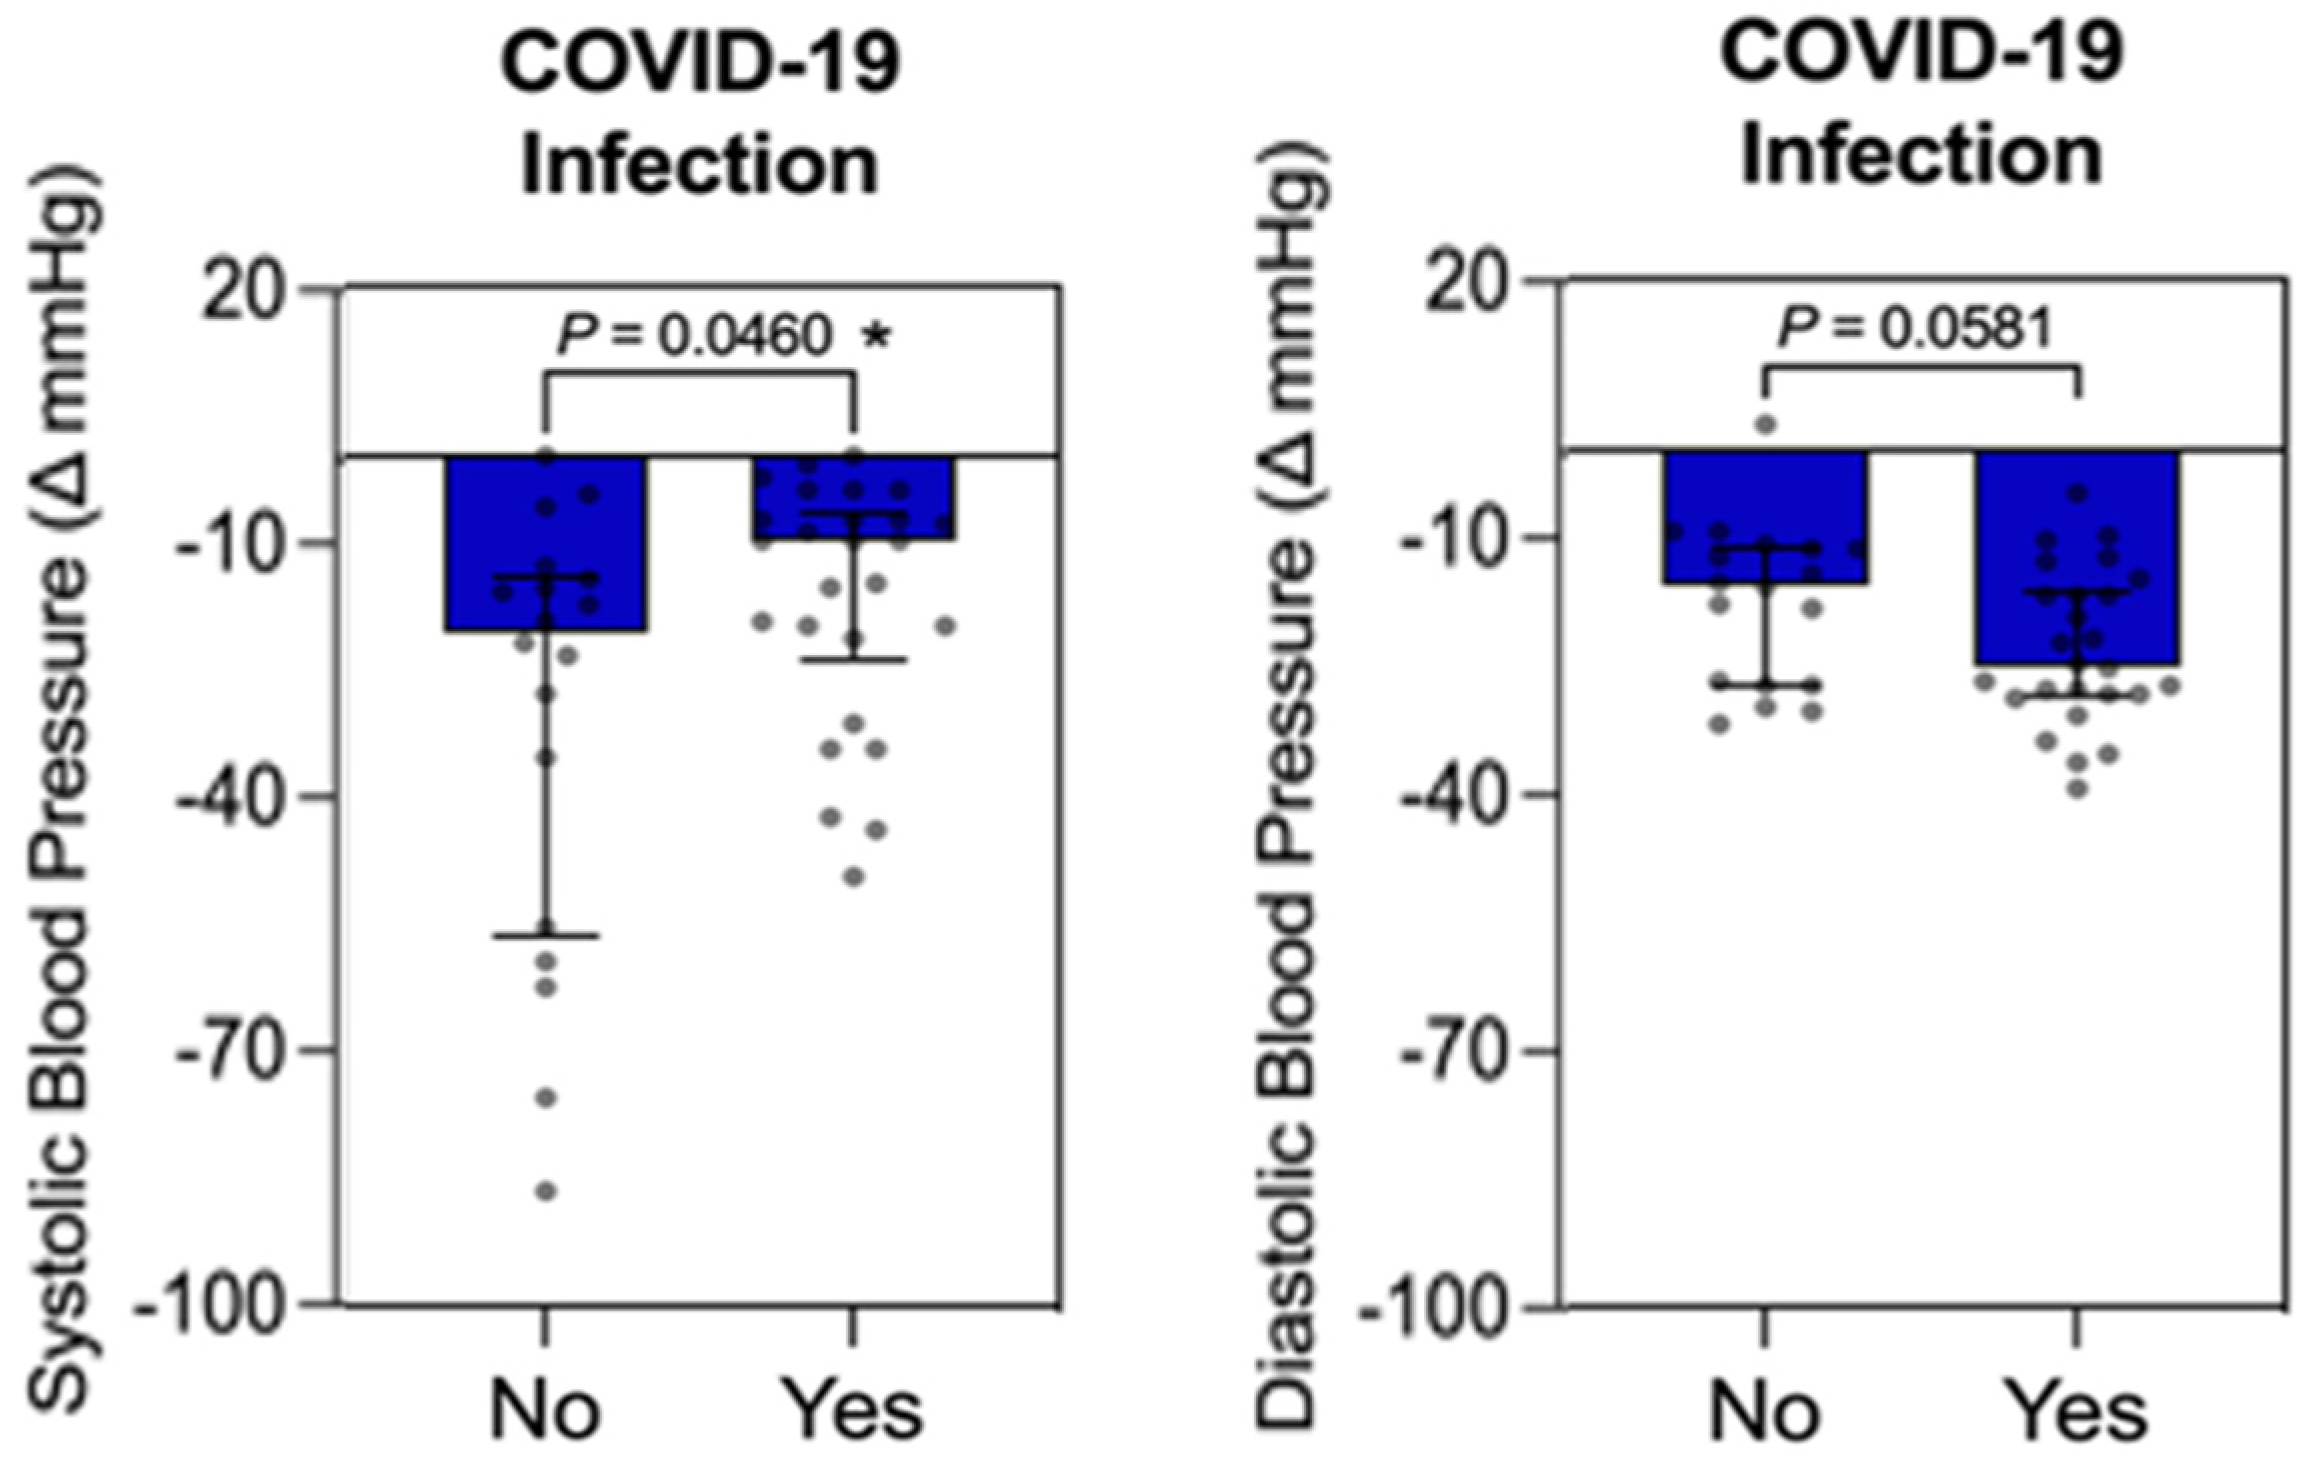
In the individual influence analysis of COVID-19 infection on SBP, a significant difference was observed (p = 0.0460). Participants in the intervention group who were infected with COVID-19 during the study period showed a smaller reduction in SBP, as illustrated in Figure 6. For the influence analysis of COVID-19 infection on DBP, no significant differences were observed (p > 0.05), and all participants in the intervention group responded relatively similarly (Figure 6).

3.5. Qualitative Results

(a)
Physical Exercise and Medications
In terms of physical activity, participants expressed discomfort with exercising. Some individuals indicated a dislike for the “atmosphere” of gyms or running tracks, feeling self-conscious about the attention directed at their bodies. Others cited reasons such as low mobility, joint pain, and lack of “discipline, engagement, or motivation” to exercise. All participants were sedentary at the start and remained sedentary until the end of the intervention, which was the case for both the control and intervention groups. Individuals reported engaging in movement only through daily routine activities (such as cleaning, shopping, and walking the dog). During the COVID-19 pandemic, most patients remained in confinement and later resumed their daily routines. Regarding pharmaceutical treatments, there was no change in the medication treatment of either group throughout the intervention.
(b)
COVID-19 Infection
A large proportion of the participants from both groups were infected with COVID-19 during the intervention period. Unfortunately, among the patients who died (three in the control group and one in the intervention group), two deaths were attributed to COVID-19 infection, one each from the intervention and control groups, and these patients were appropriately excluded from the analyses. It was also found that all patients completed the full vaccination cycle with four doses, with CoronaVac® (São Paulo, SP, Brazil), Oxford/AstraZeneca® (Södertälje/Sweden and Cambridge/England), and Pfizer® (Washington, DC, USA) being the most prevalent types. However, they were still infected with COVID-19. Most patients presented with mild symptoms, while others had more severe symptoms.

4. Discussion

Regarding the analysis of influence in the intervention group, a mild interference from COVID-19 was found in HbA1c and SBP. Individuals who contracted the disease exhibited lower reductions in both of the variables. These data are extremely interesting, as they demonstrate the effectiveness of the intervention in patients who were not infected with COVID-19. This finding aligns with the existing literature, as patients with non-communicable chronic diseases (such as T2D and obesity) are more susceptible to COVID-19 [22,23,24,25,26]. They experience poorer disease control and treatment, along with a higher likelihood of both macrovascular and microvascular sequelae. These factors further contribute to disease progression and management after infection [27].
Post-COVID-19 pandemic, another global public health challenge emerges: Post-Acute Sequelae of SARS-CoV-2 Infection (PASC). PASC can manifest in various ways and affect all organs in the body. Recent studies suggest the involvement of the autonomic nervous system, which plays numerous roles in maintaining homeostasis and coordinating responses to various stressors, including blood pressure regulation [22,23,24,25,26,27,28]. Studies indicate that individuals who recover from COVID-19 are more likely to experience alterations in glucose levels, blood pressure, and lipid profiles. SARS-CoV-2 triggers a “cytokine storm”, an excessive activation of immune system cells (macrophages), leading to severe inflammation and a disruption of lipid production [22,23,24,25,26]. This process promotes insulin resistance, overstimulation of beta cells, and dyslipidemia [27]. Potential mechanisms underlying the development of hypertension include dysregulation of the renin–angiotensin–aldosterone system. The hypothesis for the lack of glucometabolic control is associated with damage to certain cells in the pancreas, such as angiotensin-converting enzyme 2, which plays a vital role in glucose homeostasis and insulin secretion, thereby regulating the physiology of beta cells [27,28].
COVID-19 infection triggers a robust immune and stress response, which can increase insulin resistance and the risk of hyperglycemia, particularly during the acute phase of the infection and in individuals predisposed to diabetes. The inflammatory response can lead to a cytokine storm, characterized by elevated levels of various cytokines such as interleukin-1β, interleukin-6, interferon-γ–induced protein 10, tumor necrosis factor, interferon-γ, macrophage inflammatory protein 1α and 1β, and vascular endothelial growth factor. This cytokine storm can result in multiorgan dysfunction, including the death of pancreatic β-cells. Even after recovery from the acute phase of COVID-19, the cytokine profile may remain abnormal and has been linked to dysglycemia, thereby increasing the risk of new-onset diabetes associated with COVID-19 [28].
Stress hyperglycemia is a well-recognized phenomenon in hospitalized patients, typically referring to temporary hyperglycemia during severe illness. It arises from an in-crease in counterregulatory hormones and cytokines, which are activated in COVID-19. Although stress hyperglycemia may be seen as an appropriate physiological response to severe illness, it raises the risk of new-onset diabetes and obesity. Therefore, stress hyperglycemia may not only cause temporary hyperglycemia in the acute setting but also lead to persistent hyperglycemia, especially in individuals at risk for diabetes, establishing a mechanistic link between COVID-19 and new-onset diabetes [26,27,28,29,30].
This research demonstrated that COVID-19 possibly significantly impacted SBP and HbA1c levels over a 12-month period in individuals with T2D and obesity. Interestingly, there was no evidence that a strict weight-loss program promoting an energy-reduced Mediterranean diet (MedDiet) significantly decreased COVID-19 risk in older adults with overweight/obesity and metabolic syndrome, as compared to an ad libitum MedDiet [31]. This suggests that encouraging adherence to the MedDiet, with or without lifestyle modification tips for weight loss, might similarly reduce COVID-19 risk in older adults with high cardiovascular risks [31]. The COVID-19 pandemic provided a unique opportunity to study a significant life event and its effects on diet, physical activity, and body weight [32]. However, research on new-onset diabetes and obesity as a post-acute consequence of SARS-CoV-2 infection remains challenging to generalize across all socio-demographic groups, particularly in a public health context [33,34].

Limitations

The COVID-19 pandemic reduced consultation flow during the second lockdown, nullified physical activity and patient engagement, and caused a shortage of fresh and minimally processed foods in São José do Rio Preto, SP, Brazil, especially in the first year (March 2020 to 2021). There was no random allocation or blinding of participants and researchers, and there was little interaction with control group patients who did not undergo nutritional assessment. The sample size was relatively small, with dropouts and deaths reducing its size. This could lead to inadequate generalizations and imprecise conclusions since the results reflect only the characteristics of the available participants. For future studies, proper execution of sample size calculations will offer significant advantages in making the results more robust. Furthermore, the majority of the intervention group was women, and the baseline DBP was slightly higher in this group compared to the control. Despite similarities in many parameters, the groups were not completely matched, making this an experimental study rather than a clinical trial. Data analysis was not separated by gender to maintain sample size and statistical power. This type of limitation can occur and is widely verified in the literature [35,36,37,38] and should be interpreted with caution, but does not invalidate the results [38]. The authors assessed the timing of the COVID-19 infection during the intervention period. Asking patients if they have had COVID-19 may introduce some information bias. In addition, the study did not account for the duration of the disease, its severity, or the treatment received by the participants. These variables were not specifically analyzed, which could be considered a limitation of the study. The investigation in this study refers to the analysis of the individualized influence of COVID-19 on the quantitatively analyzed variables, rather than considering them collectively. Despite these counterpoints, the study provides valuable insights into the impact of COVID-19 infection on glycemic control and blood pressure in T2D and obesity. These areas still lack robust evidence, and more studies are needed to further investigate and elucidate the themes.

5. Conclusions

A large portion of the participants in both the control and intervention groups were infected with COVID-19, and this infection may have influenced the SBP and HbA1c levels in the nutritional intervention group. In fact, COVID-19 brought various consequences before, during, and after infection for patients with T2D and obesity, even in those undergoing lifestyle modifications. However, caution should be exercised in generalizing these results due to the small sample size, which may introduce bias. Furthermore, the influence analysis does not establish a causal relationship, and more clinical trials in different populations are needed to thoroughly analyze this topic.

6. Take-Home Message

  • COVID-19 may significantly interfere with glycemic and blood pressure control in patients with T2D and obesity. This highlights the importance of managing these health parameters during and after the pandemic, particularly in a public health context. However, the results should be generalized with caution due to study limitations that might introduce bias.
  • Nutritional strategies are crucial for enhancing quality of life by managing blood glucose, reducing weight, and lowering cardiovascular risk in patients with T2D and obesity. Despite these interventions, medication use, and constant monitoring, the effects of COVID-19 on SBP and HbA1c were not fully mitigated. Encouraging adherence to the MedDiet, alongside lifestyle modifications for weight loss, could reduce the COVID-19 risk in older adults with high cardiovascular risks.

Author Contributions

All of the authors (T.P.M.; C.F.M.; L.B.T.Y.; L.G.S.-P.; T.d.A.R.; L.H.B.T.; A.C.P.; J.F.V.-M.; L.N.C.-M.; N.D.L.; A.F.; J.C.Y.-T.; H.M.; L.P.P.) of this study contributed significantly to the conception, design, collection, data analysis, drafting, and editing of the work, and participated sufficiently in the writing of this article to establish ownership of the intellectual content. All authors have read and agreed to the published version of the manuscript.

Funding

This study did not receive any specific financial support. We acknowledge funding by Conselho Nacional de Desenvolvimento Cientifico e Tecnológico (CNPq) for productivity fellowships to L.P.P. (Grant Number #001); Coordenação de Aperfeiçoamento de Pessoal de Nível Superior (CAPES) (Grant Number 001); and Fundação de Amparo à Pesquisa do Estado de São Paulo—FAPESP.

Institutional Review Board Statement

This research was carried out in strict adherence to the principles of the Declaration of Helsinki. It received approval from the Institutional Ethics Committee of the State Faculty of Medicine in São José do Rio Preto (FAMERP), specifically the Human Research Ethics Committee (CAAE: 33554520.0.0000.5415). The initial approval was granted on 18 July 2020. This study was also registered in Clinical Trials (Registry number: NCT06235762).

Informed Consent Statement

Informed consent was secured from all participants in this study. The patients provided their written informed consent for the publication of this paper. Measures were taken to ensure confidentiality and anonymity concerning the content, thereby safeguarding the identities of the interviewees.

Data Availability Statement

The data for this study were gathered and managed using the REDCap 14.0.9 electronic data capture tools, which are hosted at RED-Cap—FUNFARME/FAMERP (from the State Faculty of Medicine) [19,20]. The data showcased in this study can be made available upon request directed to the corresponding author. However, due to privacy considerations, the data are not available for public access.

Acknowledgments

We are grateful to the State Faculty of Medicine of São José do Rio Preto (FAMERP), State University of Campinas (UNICAMP), State University of Santa Cruz (UESC), and Federal University of São Paulo (UNIFESP) for making this work possible.

Conflicts of Interest

The authors declare no conflicts of interest.

References

  1. International Diabetes Federation. IDF Diabetes Atlas, 10th ed.; International Diabetes Federation: Brussels, Belgium, 2021; Available online: http://www.diabetesatlas.org (accessed on 20 May 2024).
  2. ElSayed, N.A.; Aleppo, G.; Aroda, V.R.; Bannuru, R.R.; Brown, F.M.; Bruemmer, D.; Collins, B.S.; Hilliard, M.E.; Isaacs, D.; Johnson, E.L.; et al. 8. Obesity and Weight Management for the Prevention and Treatment of Type 2 Diabetes: Standards of Care in Diabetes-2023. Diabetes Care 2023, 46, S128–S139. [Google Scholar] [CrossRef] [PubMed]
  3. Marx, N.; Federici, M.; Schütt, K.; Müller-Wieland, D.; Ajjan, R.A.; Antunes, M.J.; Christodorescu, R.M.; Crawford, C.; Di Angelantonio, E.; Eliasson, B.; et al. 2023 ESC Guidelines for the management of cardiovascular disease in patients with diabetes. Eur. Heart J. 2023, 44, 4043–4140, Erratum in Eur. Heart J. 2023, 44, 5060; Erratum in Eur. Heart J. 2024, 45, 518. [Google Scholar] [CrossRef]
  4. World Health Organization (WHO). Fact Sheet: Obesity and Overweight; World Health Organization: Geneva, Switzerland, 2021; Available online: https://www.who.int/news-room/fact-sheets/detail/obesity-and-overweight (accessed on 20 May 2024).
  5. World Health Organization (WHO). Proposed Policy Priorities for Preventing Obesity and Diabetes in the Eastern Mediterranean Region; Technical Report Series; World Health Organization: Geneva, Switzerland, 2017. [Google Scholar]
  6. NCD Risk Factor Collaboration (NCD-RisC). Worldwide trends in underweight and obesity from 1990 to 2022: A pooled analysis of 3663 population-representative studies with 222 million children, adolescents, and adults. Lancet 2024, 403, 1027–1050. [Google Scholar] [CrossRef] [PubMed]
  7. Khalid, M.; Alkaabi, J.; Khan, M.A.B.; Adem, A. Insulin Signal Transduction Perturbations in Insulin Resistance. Int. J. Mol. Sci. 2021, 22, 8590. [Google Scholar] [CrossRef]
  8. Minari, T.P.; Tácito, L.H.B.; Yugar, L.B.T.; Ferreira-Melo, S.E.; Manzano, C.F.; Pires, A.C.; Moreno, H.; Vilela-Martin, J.F.; Cosenso-Martin, L.N.; Yugar-Toledo, J.C. Nutritional Strategies for the Management of Type 2 Diabetes Mellitus: A Narrative Review. Nutrients 2023, 15, 5096. [Google Scholar] [CrossRef]
  9. ElSayed, N.A.; Aleppo, G.; Aroda, V.R.; Bannuru, R.R.; Brown, F.M.; Bruemmer, D.; Collins, B.S.; Das, S.R.; Hilliard, M.E.; Isaacs, D.; et al. 10. Cardiovascular Disease and Risk Management: Standards of Care in Diabetes-2023. Diabetes Care 2023, 46, S158–S190. [Google Scholar] [CrossRef]
  10. Kökten, T.; Hansmannel, F.; Ndiaye, N.C.; Heba, A.C.; Quilliot, D.; Dreumont, N.; Arnone, D.; Peyrin-Biroulet, L. Calorie Restriction as a New Treatment of Inflammatory Diseases. Adv. Nutr. 2021, 12, 1558–1570. [Google Scholar] [CrossRef]
  11. Zeevi, D.; Korem, T.; Zmora, N.; Israeli, D.; Rothschild, D.; Weinberger, A.; Ben-Yacov, O.; Lador, D.; Avnit-Sagi, T.; Lotan-Pompan, M.; et al. Personalized Nutrition by Prediction of Glycemic Responses. Cell 2015, 163, 1079–1094. [Google Scholar] [CrossRef]
  12. Minari, T.P.; Araújo-Filho, G.M.d.; Tácito, L.H.B.; Yugar, L.B.T.; Rubio, T.d.A.; Pires, A.C.; Vilela-Martin, J.F.; Cosenso-Martin, L.N.; Fattori, A.; Yugar-Toledo, J.C.; et al. Effects of Mindful Eating in Patients with Obesity and Binge Eating Disorder. Nutrients 2024, 16, 884. [Google Scholar] [CrossRef]
  13. Khunti, K.; Valabhji, J.; Misra, S. Diabetes and the COVID-19 pandemic. Diabetologia 2023, 66, 255–266. [Google Scholar] [CrossRef]
  14. Farman, M.; Akgül, A.; Sultan, M.; Riaz, S.; Asif, H.; Agarwal, P.; Hassani, M.K. Numerical study and dynamics analysis of diabetes mellitus with co-infection of COVID-19 virus by using fractal fractional operator. Sci. Rep. 2024, 14, 16489. [Google Scholar] [CrossRef]
  15. Naidu, A.S.; Wang, C.K.; Rao, P.; Mancini, F.; Clemens, R.A.; Wirakartakusumah, A.; Chiu, H.F.; Yen, C.H.; Porretta, S.; Mathai, I.; et al. Precision nutrition to reset virus-induced human metabolic reprogramming and dysregulation (HMRD) in long-COVID. NPJ Sci. Food 2024, 8, 19. [Google Scholar] [CrossRef] [PubMed]
  16. Sherif, Z.A.; Gomez, C.R.; Connors, T.J.; Henrich, T.J.; Reeves, W.B.; RECOVER Mechanistic Pathway Task Force. Pathogenic mechanisms of post-acute sequelae of SARS-CoV-2 infection (PASC). eLife 2023, 12, e86002. [Google Scholar] [CrossRef] [PubMed]
  17. Minari, T.P.; Manzano, C.F.; Tácito, L.H.B.; Yugar, L.B.T.; Sedenho-Prado, L.G.; Rubio, T.d.A.; Pires, A.C.; Vilela-Martin, J.F.; Cosenso-Martin, L.N.; Moreno, H.; et al. The Impact of a Nutritional Intervention on Glycemic Control and Cardiovascular Risk Markers in Type 2 Diabetes. Nutrients 2024, 16, 1378. [Google Scholar] [CrossRef] [PubMed]
  18. Lima, L.S.; Araujo, M.A.; Ornelas, G.C.; Logrado, M.H. Validação de Instrumento de Triagem Nutricional [Validation of a nutritional screening tool]. Acta Med. Port. 2012, 25, 10–14. [Google Scholar]
  19. Harris, P.A.; Taylor, R.; Thielke, R.; Payne, J.; Gonzalez, N.; Conde, J.G. Research electronic data capture (REDCap)—A metada-ta-driven methodology and workflow process for providing translational research informatics support. J. Biomed. Inform. 2009, 42, 377–381. [Google Scholar] [CrossRef]
  20. Harris, P.A.; Taylor, R.; Minor, B.L.; Elliott, V.; Fernandez, M.; O’Neal, L.; McLeod, L.; Delacqua, G.; Delacqua, F.; Kirby, J.; et al. The REDCap consortium: Building an international community of software platform partners. J. Biomed. Inform. 2019, 95, 103208. [Google Scholar] [CrossRef]
  21. Graphpad Prism for Windows, Version 9.0. GraphPad Software: La Jolla, CA, USA, 2015. Available online: www.graphpad.com (accessed on 16 January 2024).
  22. Calcaterra, V.; Zanelli, S.; Foppiani, A.; Verduci, E.; Benatti, B.; Bollina, R.; Bombaci, F.; Brucato, A.; Cammarata, S.; Calabrò, E.; et al. Long COVID in Children, Adults, and Vulnerable Populations: A Comprehensive Overview for an Integrated Approach. Diseases 2024, 12, 95. [Google Scholar] [CrossRef]
  23. Proal, A.D.; VanElzakker, M.B. Long COVID or Post-acute Sequelae of COVID-19 (PASC): An Overview of Biological Factors That May Contribute to Persistent Symp-toms. Front. Microbiol. 2021, 12, 698169. [Google Scholar] [CrossRef]
  24. LaVergne, S.M.; Stromberg, S.; Baxter, B.A.; Webb, T.L.; Dutt, T.S.; Berry, K.; Tipton, M.; Haberman, J.; Massey, B.R.; McFann, K.; et al. A longitudinal SARS-CoV-2 biorepository for COVID-19 survivors with and without post-acute sequelae. BMC Infect. Dis. 2021, 21, 677. [Google Scholar] [CrossRef]
  25. Sneller, M.C.; Liang, C.J.; Marques, A.R.; Chung, J.Y.; Shanbhag, S.M.; Fontana, J.R.; Raza, H.; Okeke, O.; Dewar, R.L.; Higgins, B.P.; et al. A Longitudinal Study of COVID-19 Sequelae and Immunity: Baseline Findings. Ann. Intern. Med. 2022, 175, 969–979. [Google Scholar] [CrossRef] [PubMed]
  26. Thaweethai, T.; Jolley, S.E.; Karlson, E.W.; Levitan, E.B.; Levy, B.; McComsey, G.A.; McCorkell, L.; Nadkarni, G.N.; Parthasarathy, S.; Singh, U.; et al. Development of a Definition of Postacute Sequelae of SARS-CoV-2 Infection. JAMA 2023, 329, 1934–1946, Erratum in JAMA 2024, 331, 1505. [Google Scholar] [CrossRef] [PubMed]
  27. Goldstein, D.S. Post-COVID dysautonomias: What we know and (mainly) what we don’t know. Nat. Rev. Neurol. 2024, 20, 99–113. [Google Scholar] [CrossRef] [PubMed]
  28. Wrona, M.; Skrypnik, D. New-Onset Diabetes Mellitus, Hypertension, Dyslipidaemia as Sequelae of COVID-19 Infection-Systematic Review. Int. J. Environ. Res. Public Health 2022, 19, 13280. [Google Scholar] [CrossRef]
  29. Lima-Martínez, M.M.; Carrera Boada, C.; Madera-Silva, M.D.; Marín, W.; Contreras, M. COVID-19 and diabetes: A bidirectional relationship. Clin. Investig. Arterioscler. 2021, 33, 151–157. [Google Scholar] [CrossRef]
  30. Kim, S.H.; Arora, I.; Hsia, D.S.; Knowler, W.C.; LeBlanc, E.; Mylonakis, E.; Pratley, R.; Pittas, A.G. New-Onset Diabetes After COVID-19. J. Clin. Endocrinol. Metab. 2023, 108, e1164–e1174. [Google Scholar] [CrossRef]
  31. Shyam, S.; García-Gavilán, J.F.; Paz-Graniel, I.; Gaforio, J.J.; Martínez-González, M.Á.; Corella, D.; Martínez, J.A.; Alonso-Gómez, Á.M.; Wärnberg, J.; Vioque, J.; et al. Intensive Weight-Loss Lifestyle Intervention Using Mediterranean Diet and COVID-19 Risk in Older Adults: Secondary Analysis of PREDIMED-Plus Trial. J. Nutr. Health Aging 2023, 27, 1162–1167. [Google Scholar] [CrossRef]
  32. Chui, T.K.; Cedillo, Y.E.; El Zein, A.; Pavela, G.; Caldwell, A.E.; Peters, J.C.; Friedman, J.E.; DebRoy, S.; Oslund, J.L.; Das, S.K.; et al. Evaluation of socioecological factors on health behaviors and weight change during major life event: A cross-sectional study using data collected during the COVID-19 pandemic. Obes. Sci. Pract. 2024, 10, e785. [Google Scholar] [CrossRef]
  33. Varghese, J.S.; Ali, M.K.; Guo, Y.; Donahoo, W.T.; Chakkalakal, R.J. Risk of New-Onset Diabetes Before and During the COVID-19 Pandemic: A Real-World Cohort Study. J Gen Intern Med. 2024. [Google Scholar] [CrossRef]
  34. Minari, T.P.; Manzano, C.F.; Yugar, L.B.T.; Sedenho-Prado, L.G.; de Azevedo Rubio, T.; Tácito, L.H.B.; Pires, A.C.; Vilela-Martin, J.F.; Cosenso-Martin, L.N.; Ludovico, N.D.; et al. Demystifying Obesity: Understanding, Prevention, Treatment, and Stigmas. Nutr. Rev. 2024, nuae144. [Google Scholar] [CrossRef]
  35. Gruneck, L.; Marriott, L.K.; Gentekaki, E.; Kespechara, K.; Sharpton, T.J.; Denny, J.; Shannon, J.; Popluechai, S. A Non-Randomized Trial Investigating the Impact of Brown Rice Consumption on Gut Microbiota, Attention, and Short-Term Working Memory in Thai School-Aged Children. Nutrients 2022, 14, 5176. [Google Scholar] [CrossRef] [PubMed]
  36. Campbell, E.K.; Taillie, L.; Blanchard, L.M.; Wixom, N.; Harrington, D.K.; Peterson, D.R.; Wittlin, S.D.; Campbell, T.M. Post hoc analysis of food costs associated with Dietary Approaches to Stop Hypertension diet, whole food, plant-based diet, and typical baseline diet of individuals with insulin-treated type 2 diabetes mellitus in a nonrandomized crossover trial with meals provided. Am. J. Clin. Nutr. 2024, 119, 769–778. [Google Scholar] [CrossRef] [PubMed]
  37. Jooste, B.R.; Kolivas, D.; Brukner, P.; Moschonis, G. Effectiveness of Technology-Enabled, Low Carbohydrate Dietary Interventions, in the Prevention or Treatment of Type 2 Diabetes Mellitus in Adults: A Systematic Literature Review of Randomised Controlled and Non-Randomised Trials. Nutrients 2023, 15, 4362. [Google Scholar] [CrossRef] [PubMed]
  38. Levintow, S.N.; Nielson, C.M.; Hernandez, R.K.; Breskin, A.; Pritchard, D.; Lash, T.L.; Rothman, K.J.; Gilbertson, D.; Muntner, P.; Critchlow, C.; et al. Pragmatic considerations for negative control outcome studies to guide non-randomized comparative analyses: A narrative review. Pharmacoepidemiol. Drug Saf. 2023, 32, 599–606. [Google Scholar] [CrossRef]
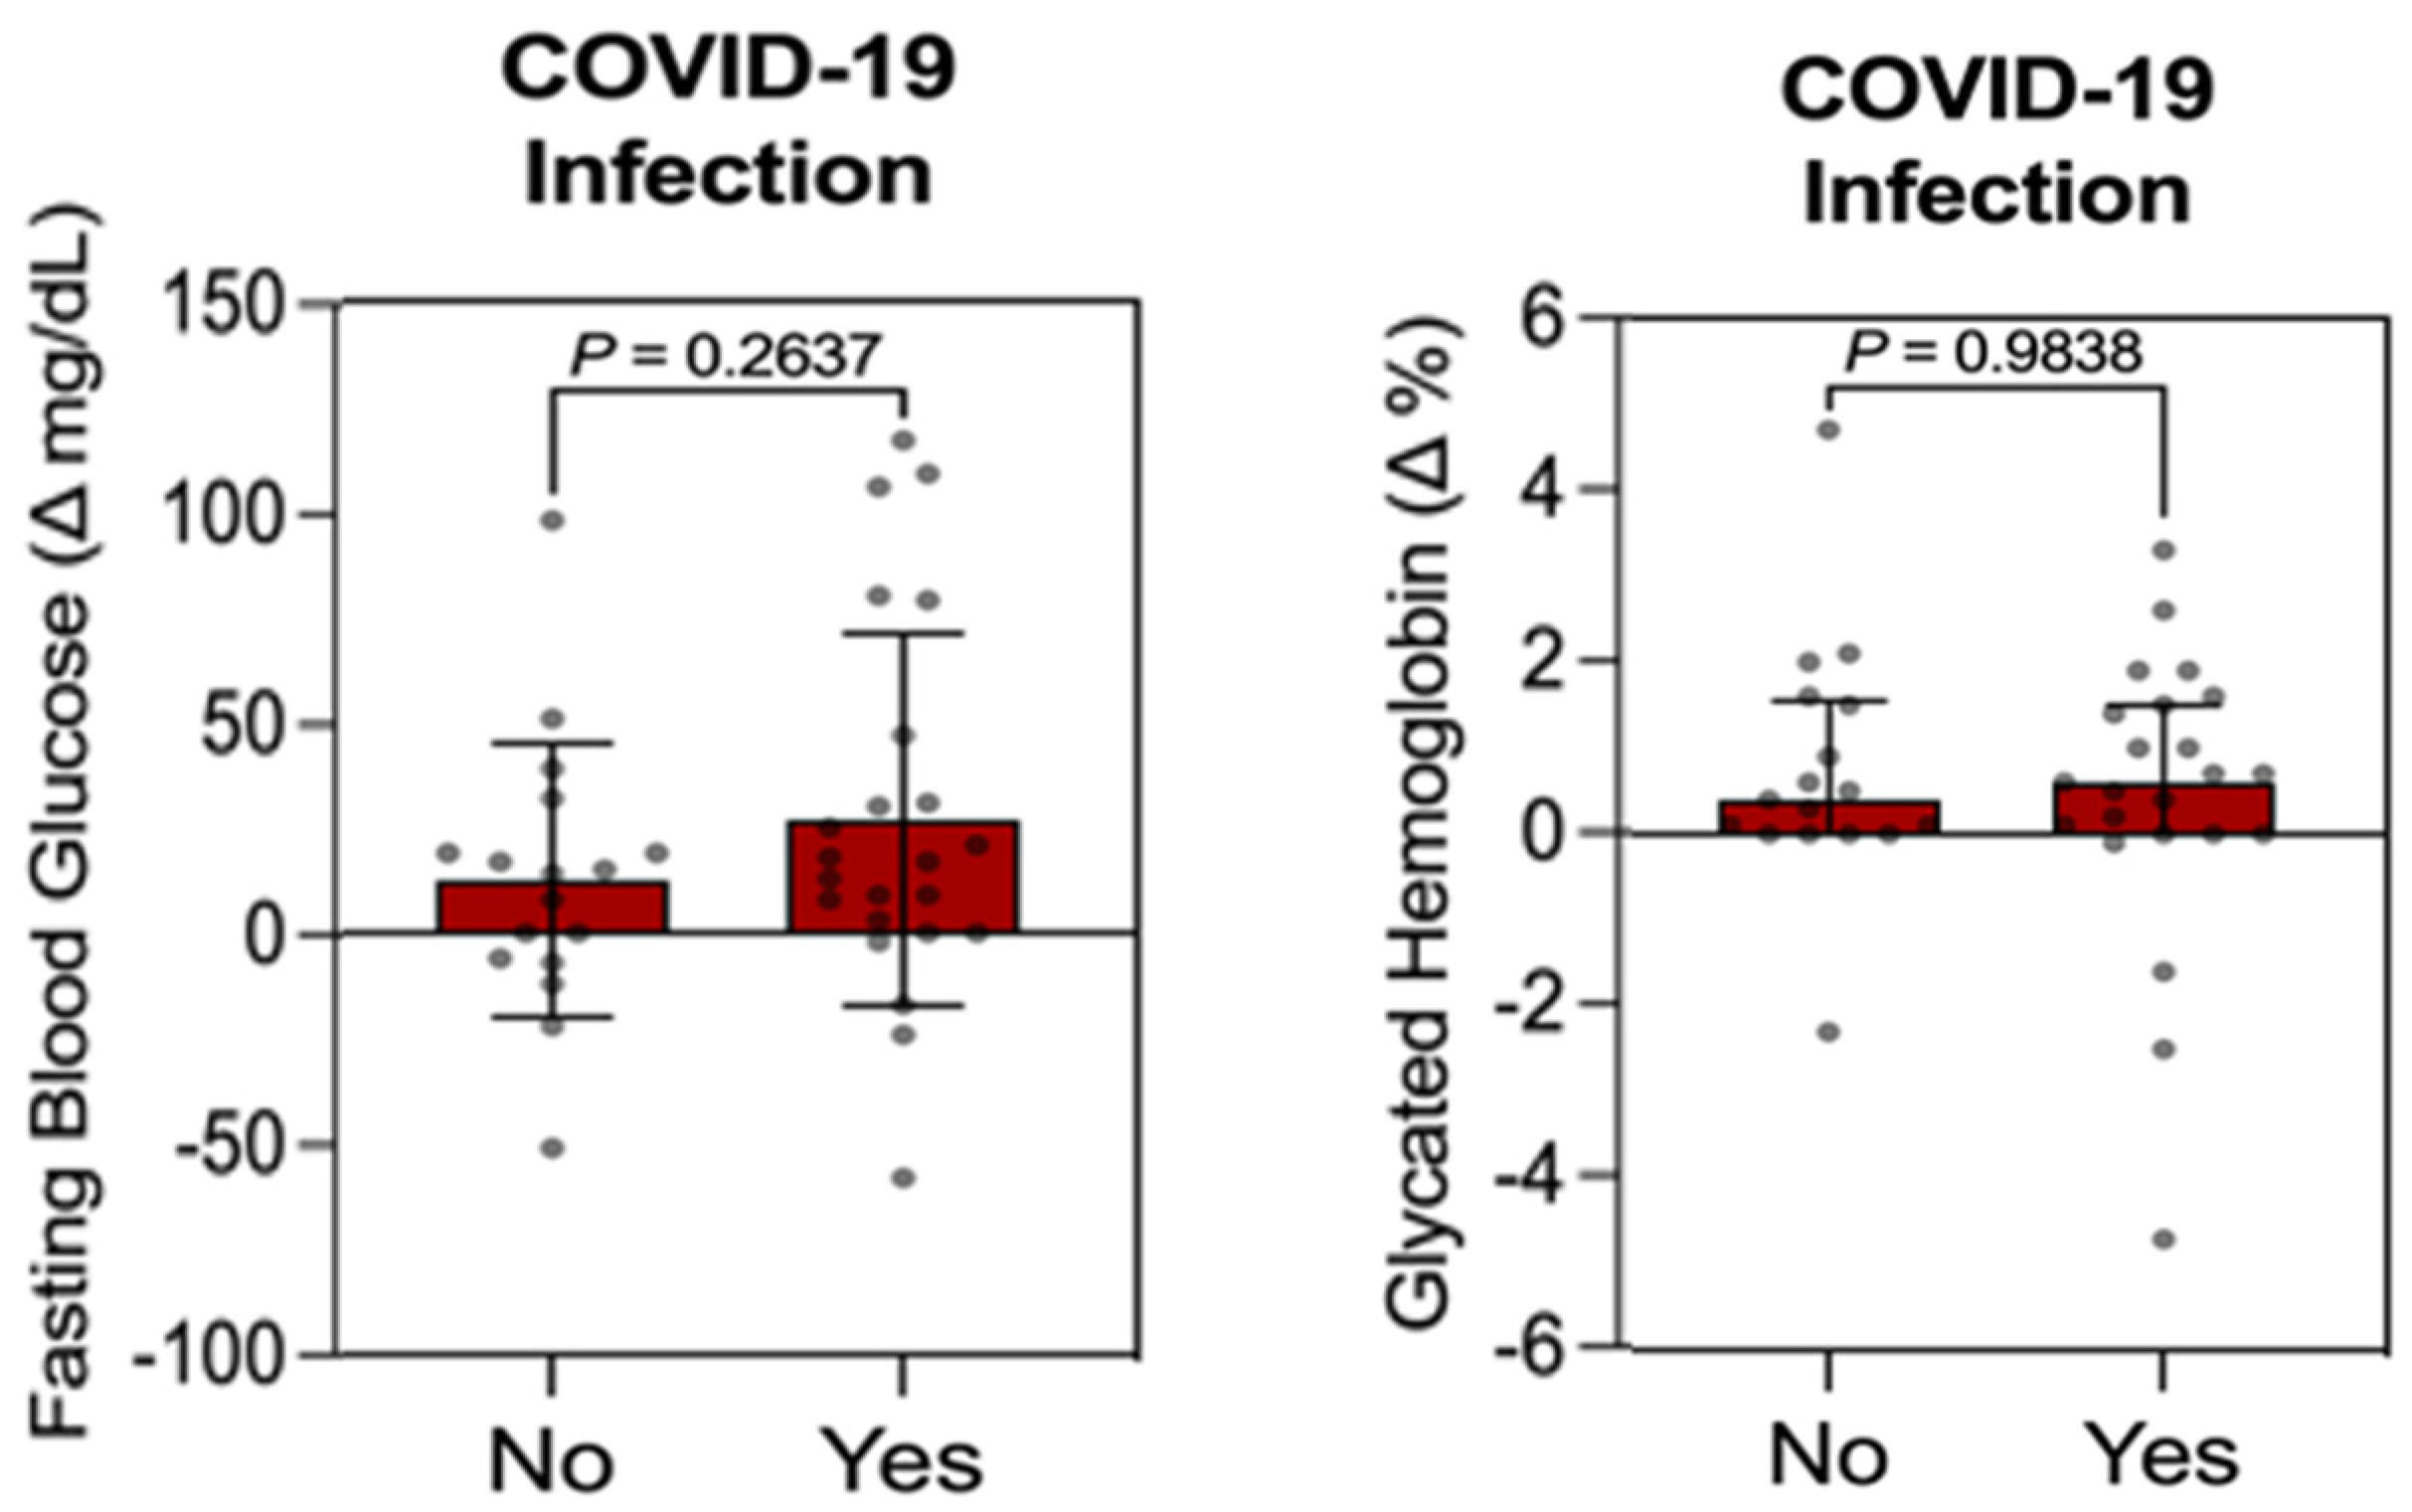
Figure 1. Variation in FBG and HbA1c levels in participants in the control group who did or did not contract COVID-19 during the 12 months considered. Data are presented as the mean ± standard deviation (FBG) and median ± interquartile range (HbA1c), along with the dispersion of all replicates. There was no significant difference between the observed variations in individuals who did or did not contract COVID-19 (Mann–Whitney test for non-normal data; unpaired t-test for normal data; p < 0.05).
Obesities 04 00033 g001
Figure 2. Variation in body weight and BMI in participants in the control group who did or did not contract COVID-19 during the 12 months considered. Data are presented as the median ± interquartile range along with the dispersion of all replicates. There was no significant difference between the observed variations in individuals who did or did not contract COVID-19 (Mann–Whitney test; p < 0.05).
Obesities 04 00033 g002
Figure 3. Variation in FBG and HbA1c in participants in the control group who did or did not contract COVID-19 during the 12 months considered. Data are presented as the median ± interquartile range along with the dispersion of all replicates. There was no significant difference between the observed variations in individuals who did or did not contract COVID-19 for FBG. An asterisk indicates a significant difference between the marked variations in HbA1c levels (Mann–Whitney test; p < 0.05).
Obesities 04 00033 g003
Figure 4. Variation in LDL-C, HDL-C, and TG in participants in the control group who did or did not contract COVID-19 during the 12 months considered. Data are presented as the median ± interquartile range (LDL-C and TG) and mean ± standard deviation (HDL-C), along with the dispersion of all replicates. There is no significant difference between the observed variations in individuals who did or did not contract COVID-19 (Mann–Whitney test for non-normal data; unpaired t-test for normal data; p < 0.05).
Obesities 04 00033 g004
Figure 5. Variation in body weight, BMI, and WC in participants in the control group who did or did not contract COVID-19 during the 12 months considered. Data are presented as the median ± interquartile range along with the dispersion of all replicates. There is no significant difference between the observed variations in individuals who did or did not contract COVID-19 (Mann–Whitney test; p < 0.05).
Obesities 04 00033 g005
Figure 6. Variation in SBP and DBP in participants in the control group who did or did not contract COVID-19 during the 12 months considered. Data are presented as the median ± interquartile range (SBP) and mean ± standard deviation (DBP), along with the dispersion of all replicates. There was no significant difference between the observed variations in DBP in individuals who did or did not contract COVID-19. An asterisk indicates a significant difference between the marked variations in SBP (Mann–Whitney test; unpaired t-test for normal data; p < 0.05).
Obesities 04 00033 g006
Table 1. Summary of demographic data and health indicators from baseline of the study for the control and intervention groups.
ParameterControl GroupIntervention Groupp-Value
GenderMale: 50%, Female: 50%Male: 27.3%, Female: 72.7%n/a
Age (years)62.2 ± 8.064.2 ± 8.6>0.05
RaceWhite: 25%, Brown: 35%, Black: 40%White: 25%, Brown: 35%, Black: 40%n/a
Socioeconomic StatusClass C: 65%, Class D: 35%Class C: 63.6%, Class D: 36.4%n/a
Exercise HabitsNone: 100%None: 100%n/a
FBG (mg/dL)159.0 (196.5–132.0)148.0 (195.3–130.0)>0.05
HbA1c (%)8.7 (9.3–7.3)7.5 (10.0–6.8)>0.05
TC (mg/dL)171.5 (199.8–142.0)159.0 (211.5–129.0)>0.05
LDL-C (mg/dL)102.4 ± 15.1102.3 ± 19.7>0.05
HDL-C (mg/dL)43.0 (49.5–35.5)46.0 (53.0–40.0)>0.05
TG (mg/dL)165.5 (201.5–154.0)168.0 (195.0–151.8)>0.05
Body Weight (kg)87.7 (98.0–71.5)87.0 (92.9–79.9)>0.05
BMI (kg/m2)30.0 (35.5–30.0)31.5 (35.7–30.0)>0.05
WC (cm)106.8 ± 12.0106.7 ± 7.5>0.05
SBP (mmHg)145.3 ± 11.0146.8 ± 17.1>0.05
DBP (mmHg)88.5 (98.0–87.0)95.7 (99.0–91.6)0.0464 *
Fasting blood glucose (FBG); Glycated hemoglobin (HbA1c); Total cholesterol (TC); LDL cholesterol (LDL-C); HDL cholesterol (HDL-C); Serum triglycerides (TG); Body mass index (BMI); Waist circumference (WC); Systolic blood pressure (SBP); Diastolic blood pressure (DBP); n/a = not applicable. * p < 0.05.
Table 2. Difference between anthropometric and laboratory parameters from baseline to 12 months for the intervention and control groups.
ParameterIntervention Group (p-Value)Control Group (p-Value)
Weight<0.0001 *<0.0001 *
BMI (kg/m2)<0.0001 *<0.0001 *
WC (cm)<0.0001 *>0.05
FBG (mg/dL)<0.0001 *0.0028 *
HbA1c (%)<0.0001 *<0.0001 *
TC (mg/dL)>0.05>0.05
LDL-C (mg/dL)<0.0001 *>0.05
HDL-C (mg/dL)0.0105 *>0.05
TG (mg/dL)<0.0001 *>0.05
SBP (mmHg)<0.0001 *>0.05
DBP (mmHg)<0.0001 *>0.05
Body mass index (BMI); Waist circumference (WC); Fasting blood glucose (FBG); Glycated hemoglobin (HbA1c); Total cholesterol (TC); LDL cholesterol (LDL-C); HDL cholesterol (HDL-C); Serum triglycerides (TG); Systolic blood pressure (SBP); Diastolic blood pressure (DBP); n/a = not applicable. * p < 0.05.
Table 3. COVID-19 infection data of research participants from the control and intervention groups, obtained over 12 months.
ControlIntervention
COVID-19 infection
Over 12 months
No
12 (30.0%)
Yes
28 (70.0%)
No
12 (27.3%)
Yes
32 (72.7%)
Disclaimer/Publisher’s Note: The statements, opinions and data contained in all publications are solely those of the individual author(s) and contributor(s) and not of MDPI and/or the editor(s). MDPI and/or the editor(s) disclaim responsibility for any injury to people or property resulting from any ideas, methods, instructions or products referred to in the content.