Abstract
(1) Background: The double burden of malnutrition (DBM) is an emerging public health concern among children and adolescents in developing countries. This study investigated the prevalence and factors associated with being underweight and overweight among adolescents. (2) Methods: This cross-sectional study was conducted among 423 adolescents across 10 high schools in Harare. A questionnaire was used to collect data and weight for height-z-scores were used to compute body mass index. Pearson’s Chi-Square and multinomial logistic regression were used to test for associations and explore factors associated with being underweight or overweight at (p < 0.05). (3) Results: The median and IQR range for the participants was 16 (14–19) years. There were more girls 53.2%, than boys 46.8% (p = 0.002), and more 14–16-year-olds 54.1%, than 17–19-year-olds (p = 0.070). More boys 10% than girls 9.1% were underweight, whereas more girls 21.8% than boys 9.3% were overweight and obese (p = 0.002). By age, more 14–16-year -olds were underweight 12.7% than 17–19-year-olds 5.9%, whereas more 17–19-year-olds 16.2% were overweight than 14–16-year-olds (p = 0.070). Significant factors associated with being underweight were inadequate balanced nutrition knowledge [OR = 1.49 (0.139–0.997), p = 0.049], being in the 14–16 years age group [OR = 2.56 (1.137–5.779), p = 0.023], having formally employed [OR = 2.34 (1.008–5.428), p = 0.048] and unemployed [OR = 5.17 (1.263–21.116), p = 0.022] household heads. Significant factors associated with overweight were being a girl [OR = 0.32 (0.168–2.561), p < 0.001, and having formally employed household heads [OR = 2.00 (1.044–1.206), p = 0.037]. The employment status of the household head (being formally employed) was the only factor which associated with both underweight and overweight statuses. (4) Conclusions: Although underweight and overweight statuses co-exist, among adolescents, those who are overweight appear to be more than those who are underweight. Significant factors associated with being underweight were inadequate nutrition knowledge, being 14–16 years old, and having formally employed or unemployed parents. While being a girl and having formally employed parents were significant determinants of the overweight status. This paper calls for more awareness of DBM and context-specific interventions targeting obesity in a country where undernutrition has been traditionally prioritized at policy and program levels.
Keywords:
adolescents; overweight; underweight; dietary habits; malnutrition; nutrition policies; Zimbabwe 1. Introduction
The double burden of malnutrition (DBM) is a significant public health concern among children and adolescents in developing countries [1,2]. This is the coexistence of undernutrition (underweight, wasting, and stunting) alongside overnutrition (overweight or obesity) within a population [2]. The prevalence of DBM has been reported in many developing countries and has been linked to nutrition and economic transitions [2,3,4]. DBM is an increasing nutritional problem in all population groups [5,6]. In a South African study, the prevalence of underweight, overweight and obesity was 2%, 27% and 42%, respectively [6]. A similar study conducted among Egyptian primary school children showed that the prevalence of thinness, overweight and obesity was 4.5%, 11% and 8.2%, respectively [7].
Nutrition transition is a shift in eating habits from traditional wholesome foods to ultra-processed foods [8]. Nutrition transition has been detected in many Sub-Saharan countries including Zimbabwe and there is evidence of socio-economic, dietary and physical activity shifts in these countries. This is supported by urbanization, the shift from labour-intensive work to automated working styles, sedentarism and lifestyle changes that come with economic development [9]. Collectively, this leads to obesity and other diseases associated with affluence like cardiometabolic syndrome, hypercholesterolemia, etc. However, in Zimbabwe, a lot of health programs and interventions are still biased towards underweight and related health problems [10]. Adolescents’ nutrition is an upcoming area of study in Zimbabwe [11]. To date, no national evidence of a double-malnutrition burden has been reported. A study conducted in Sub-Saharan African countries including Zimbabwe showed a downward trend in the prevalence of underweight [9], whereas several studies have shown an increase in the prevalence of overweight children and adolescents in Zimbabwe [2,3]. Despite the differences in prevalence, the coexistence of undernutrition and overnutrition is a paradox that shows the need to investigate factors that are associated with underweight and overweight separately, and it is of paramount importance to find the factors which that overlap. This knowledge is useful in informing policy changes that enable nutrition intervention programs to shift towards addressing overweight and obesity as a health problem. Therefore, this study estimated the prevalence and factors associated with being underweight or overweight among in-school adolescents in Harare, Zimbabwe. In addition, an attempt was made to identify cross-cutting factors that overlapped between underweight and overweight. We hope that this study will assist future researchers and make important contributions towards nutrition policies and interventions inclusive of overweight- and obesity-related issues.
2. Materials and Methods
2.1. Study Setting and Participants
The study was carried out among in-school adolescents in Harare, the capital of Zimbabwe. The participants were adolescents aged 14 to 19 years selected from 10 High Schools registered with the Ministry of Primary and Secondary Education.
2.2. Sample Size and Sampling Technique
The sample size was calculated using the formula described by Charan and Biswas [12]. A sample size of 437 adolescents was found to be sufficient, with a 25% attrition adjustment. A stratified random sampling technique was used to select ten high schools from the registry of The Ministry of Primary and Secondary Education. The schools were further divided into strata based on their locations and socio-economic zones, class level (Form 2 to Form 6) based on the Zimbabwean education system, and age groups (14–16 years and 17–19 years). Recruited participants received an in-depth orientation about the study’s objectives weight, and height measurements for BMI calculations, and how long it would take to fill in the self-administered questionnaire. The participants were informed that no incentive would be offered for participation and participants without signed parental consent forms could not participate. After recruitment, the investigator coordinated with staff members to collect the signed consent forms, and the participants were given the date and time for the administration of the questionnaire within their classrooms. After the collection of signed consent forms, 423 in-school adolescents were successfully enrolled in this study. On the questionnaire administration day, research assistants were always present to support the participants.
2.3. Research Instruments and Data Collection Methods
2.3.1. Structured Questionnaire
Previously validated self-administered questionnaires were adapted and used to collect demographic data, food habits, nutrition knowledge and physical activity information. The combined questionnaire had four sections. Socio-demographic (10 questions), nutrition knowledge (20 questions), food habits (23 questions) and physical activity (7 questions). The questionnaire was adapted and scored as explained in the next sections. The full questionnaire is presented as Supplementary Material for reference.
2.3.2. Nutrition Knowledge Score (NKS)
The NKS questions were developed based on a questionnaire described by Oz et al. [13]. The instrument was a practical and easy-to-administer tool with acceptable reliability among high school students. This section had three subscales: adequate and balanced nutrition, essential nutrients and malnutrition-related diseases, and the questions consisted of complete sentences of correct or incorrect statements. The Cronbach’s alpha coefficient was 0.85 overall. An example of the nutrition knowledge question was, “We should drink at least 8–10 glasses of water every day” with (true, false and not sure) answer options. Nutrition knowledge score (NKS) was categorized as inadequate (NKS < 50%) or adequate (NKS ≥ 50%). An example of a nutrition knowledge question was “According to the nutrition expert, the amount of salt a person consumes in a day should not exceed 6 g”.
2.3.3. Food Habits Score (FHS)
The Food Habits Score (FHS) questionnaire was adapted from Johnson et al. [14] and it had an internal reliability of Cronbach’s α = 0.82. The FHS was calculated as follows:
FHS = No. of healthy responses × (23 No. of items completed)
Inadequate FHS was defined as (FHS < 50%) and adequate was (FHS ≥ 50%). An example of a food habits question was, “When I have a snack between meals, I often choose fruit.”
2.3.4. Physical Activity (PA)
This questionnaire was adapted from Silva et al. [15]. It had an internal reliability Cronbach’s alpha of 0.71. The PAS responses were structured in different ways according to each question, each score ranging from 1 to 4, with the maximum score assigned to the healthiest habit. The total score of the PA section was 28; this was categorized as inadequate (PA < 50%) or adequate (PA ≥ 50%). An example of a physical activity question was “Do you practice any form of physical activity?”
2.3.5. Anthropometry
Standing height was measured to the nearest 0.1 cm using the stadiometer (Leceister® Height Measure, Seca, UK). Weight was measured using an electronic bathroom weighing scale (Sunbeam, South Africa). The nutritional status of the participants was determined using WHO standard protocols for children aged 5–19 years [16]. Body Mass Index (BMI), kg/(m2) was converted to z-scores using WHO AnthroPlus. BMI-for-age z-scores were categorized into underweight (<−2 SD), normal (≥−2 to ≤+1SD), overweight (≥1 to +2SD) and obese (>+2SD).
2.4. Statistical Analysis
The data were analyzed using IBM SPSS Statistics for Windows v26 (IBM Corp., Armonk, NY, USA). Shapiro–Wilk tests and Q-Q plots tests were carried out to assess the normality of the data. Where appropriate, continuous data were converted into categorical variables. Dichotomization of food habits, nutrition knowledge and physical activities was conducted after calculating total scores as instructed by Johnson et al. [14], Oz et al. [13] and Silva et al. [15], respectively. Median splits were used to define adequate and inadequate categories as suggested by Decoster et al. [16,17]. The data met the conditions for which dichotomization is justifiable as highlighted by Iacobucci and Decoster et al. [18,19]. The association between the categorical variables was evaluated using Pearson’s Chi-square test, and Fisher’s exact test was used where the cell counts were less than five. Confidence level with p < 0.05 was considered statistically significant. Multinomial logistic regression was used to examine the relationship between underweight, overweight and associated factors. The level of significance was p < 0.05. A multinomial logistic regression model was employed because the dependent variable had three outcomes. The multinomial logistic regression analysis showed clearly the factors associated with either being underweight or overweight using normal weight as the reference category. The results for the multinomial logistic regression analyses were presented along with their respective 95% confidence intervals (CIs), signifying precision.
3. Results
3.1. Sociodemographic Characteristics
The socio-demographic characteristics of the participants (n = 423) are summarized in Table 1. The median and IQR range age for the participants was 16 (14–19) years. There were more girls 53.2%, than boys 46.8% (p = 0.002), and more 14–16-year-olds 54.1%, than 17–19-year-olds (p = 0.070). Most of the adolescents came from average-sized families (≤5 members) (84.9%, p = 0.302), and lived in high-density locations (59.8%, p = 0.302) with both parents (66.7%, p = 0.621), whose household head had tertiary education (57.7%, p = 0.198) and was formally employed (53.9%, p = 0.010).

Table 1.
Sociodemographic characteristics of participants by BMI status.
3.2. Nutritional Status of the Adolescents by Sex and Age
Nutritional status of the adolescents by sex and age is summarized in Figure 1. More boys (10%) than girls (9.1%) were underweight, whereas more girls (21.8%) than boys (9.3%) were overweight (p = 0.002). Comparison by age showed that, more 14–16-year-olds were underweight (12.7%) than 17–19-year-olds (5.9%), whereas more 17–19-year-olds (16.2%) were overweight than 14–16-year-olds (p = 0.070). Overall, the prevalence of overweight status was higher than underweight status among adolescents.
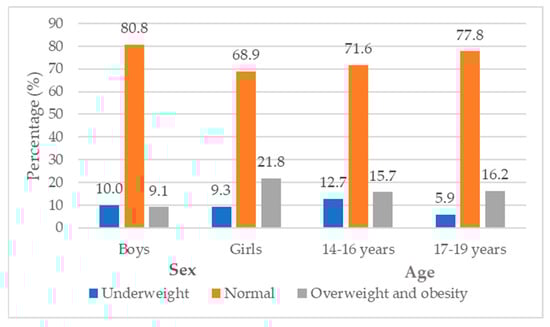
Figure 1.
The nutritional status of adolescents categorized by sex and age group.
3.3. BMI, Physical Activity, Food Habits and Nutrition Knowledge
The associations between BMI, physical activity, food habits, and nutrition knowledge are summarized in Table 2. Factors significantly associated with BMI were nutrition knowledge (p = 0.038) particularly essential nutrients knowledge (p = 0.032) and food habits particularly skipping meals (p = 0.030) and fats consumption (p = 0.024).
Table 2.
BMI, physical activity, food habits and nutrition knowledge.
3.4. Factors Associated with Nutritional Status Indicators among Adolescents
Comparisons of the factors associated with underweight and overweight statuses nutritional status among adolescents are presented in Table 3, where normal weight is the reference category. Significant factors associated with underweight were inadequate balanced nutrition knowledge [OR = 1.49 (0.14–1.00), p = 0.049], 14–16 age group [OR = 2.56 (1.14–5.78), p = 0.023], the employment status of household head particularly being formally employed [OR = 2.34 (1.01–5.43), p = 0.048] and/or unemployed [OR = 5.17 (1.26–21.12), p = 0.022. Significant factors associated with overweight and obesity were sex, particularly being a girl [OR = 0.32 (0.17–2.56), p < 0.001, and employment status [OR = 2.00 (1.04–1.21), p = 0.037. The employment status of the household head, particularly being formally employed, was the only factor associated with both underweight and overweight status of the adolescents.
Table 3.
A comparison of the factors associated with underweight and overweight statuses among adolescents.
4. Discussion
4.1. The Co-Existence of the Undernutrition and Overnutrition “Double Burden”
This study sought to estimate the prevalence and factors associated with underweight and overweight statuses among in-school adolescents in Harare, Zimbabwe. The results showed that overall, the rate of overweight status was higher than underweight status within this age group. Interestingly, overweight status appeared to be higher among girls than boys and mid mid-adolescents (14–16 years) than late adolescents (17–19 years). Previous research has either focused on obesity or underweight separately and to date this is the only research study that compares the rate of co-existence and factors associated with this co-existence. There is a lot of research and intervention programs and policies for underweight and stunting in Zimbabwe, which are specially designed for the children (0–6 years old) [20], expectant mothers [21] and micro-nutrient deficiencies among the general population [22], whereas overweight and obesity studies, intervention programs and policies are limited or non-existent.
The Government of Zimbabwe has launched the School Health policy [23], which addresses a myriad of adolescents health problems and briefly mentions nutrition issues. The policy also briefly mentions the need to “screen for common communicable and non-communicable diseases, mental health, malnutrition and developmental challenges by all staff” [23]. Three important limitations can be seen in this policy. (1) Adolescents’ diet and nutrition matters are overshadowed by other seemingly high-priority and urgent health matters like hygiene and sexual health issues. (2) Overweight and obesity-related health problems are omitted with a brief mention of non-communicable diseases. (3) The school staff oversee this screening, and this work may be beyond their qualifications and scope of work. There is evidence of a nutrition transition in Zimbabwe [4], which is leading to a surge in the rate of obesity [14,15,16,24]. It is also characterized by a decrease in deficiency diseases like protein energy malnutrition and marasmus [21,22] and an increase in non-communicable diseases like hypertension and diabetes, even among the adolescents’ populations [5,25,26]. Our study calls for researchers, stakeholders and the government and government partners to start acting in response to overweight and obesity as a health problem co-existing with underweight, particularly in urban areas. Both forms of malnutrition should at least be given the same attention and tackled strategically such that neither one of these problems is overlooked. Rather than calling for more studies, it is now time to design and implement robust nutrition education programs and policies for overweight/obesity prevention and management.
4.2. Factors Associated with the Underweight Status
Underweight was significantly associated with inadequate nutrition knowledge, particularly the knowledge of adequate and balanced nutrition, age group (14–16 years old) and employment status of the household head (being formally employed and or unemployed). Although the finding that being underweight is associated with low nutrition knowledge has been reported in other countries [5,27], this result particularly indicates that the lack of knowledge of adequate and balanced nutrition is unique within our study population. This leads to unhealthy dietary patterns where the adolescents eat snacks more often than staple foods such that their nutritional needs are not met. Additionally, regarding the affected 14–16 years age group, at this age, adolescents are less concerned with their own nutritional needs and the type and amount of food consumed. Nutrition knowledge means knowing about the concepts and processes related to nutrition [28]. It is potentially influenced by several factors, one of which is providing nutrition education. Also, it needs to be instilled early to ensure a person meets the body’s energy needs based on personal eating behavior during adolescence or adulthood [29]. Nutrition education in schools is still an upcoming area in Zimbabwe. Elaborate and practical nutrition education sessions through dieticians and nutritionists may have the potential to improve this situation [25,30,31].
A vital relationship exists between nutritional status, human capital and economic standing. The finding that being employed and/or unemployed as a household head is significantly associated with being underweight is interesting and can be explained from an economic standpoint and by a situation called “the working poor” [32]. This is a common situation in Zimbabwe and many developing countries where many people “work” to survive and support their families. However, the incomes of both the employed and unemployed groups fall below a given poverty line due to low-income jobs and low familial household income [33]. Poverty leads to financial constraints that in turn lead to the consumption of cheap, high-energy staple foods, primarily carbohydrates and fats rather than nutritionally dense food. Furthermore, it plays a significant role in regulating access and preference for foods. Studies showcase that when people living in poverty get a chance to spend relatively more on food, they often prefer to buy better-tasting food, rather than good-quality and nutritious food [34,35].
4.3. Factors Associated with the Overweight Status
Being overweight was significantly associated with inadequate physical activity, being a girl and the employment status of the household head (formal employment). Lack of physical activity has been previously associated with overweight and obese within this study population [36]. Physical activity naturally reduces as children transition to adolescents’ adolescence [15,37,38]. This is due to many factors including the shift of academic goals and serious study patterns among high school students compared to primary school students, puberty and body consciousness especially among girls with the exception to of those adolescents who are actively athletic [27,28,39,40]. There is promising observational and interventional evidence on adolescent physical activity behaviors as shown by the Zimbabwean physical activity report card that summarizes the most recent evidence of physical activity participation among school children and adolescents [41]. However, major challenges with implementation remain for those out of school, and older adolescents and young adults going through major life transitions [41,42].
The finding that being overweight was significantly associated with being a girl has been consistent through previous and recent studies among adolescents in various parts of Zimbabwe especially in urban areas [19,32,39,43,44]. Collectively, these papers agree that socio-cultural beliefs play a role in this obesity bias towards girls and women. For instance, the beliefs that chubby women with big hips are beautiful and that marital happiness is shown by weight gain are popular in Zimbabwe and other African countries [33,34,45]. Although nutrition education is the most obvious tool to help change this situation, challenging negative socio-cultural beliefs by highlighting the negative health impact (hypertension, diabetes and a reduced quality of life caused by excessive weight gain) associated with these beliefs may prove beneficial.
Our findings show an association between formally employed households and overweight status. This finding is understandable considering in Zimbabwe, those who have better lifestyles earn more and eat more are either employed and run side businesses or self-employed (entrepreneurs) [27,28]. In addition to the nutrition transition in Zimbabwe, overweight status may arise from socio-economic and cultural beliefs that associate traditional healthy foods with poverty [34,46]. Although the working poor concept is happening in many developing countries like Zimbabwe, those who are employed have better chances of living better lifestyles influenced by these beliefs because in most cases they can afford side businesses and supplement their income [47,48]. These beliefs also allude that traditional food is time time-consuming and inconvenient to prepare [49], and less stylish or unattractive than “Western foods “which are associated with wealth and affluence” [50]. Furthermore the “earn more, eat more” belief is also widespread as it supports the ideology that rich people should have big tummies as a representation of their wealth [51]. In our previous study, we concluded that privileged people do not buy healthy foods despite affording healthy diets, whereas underprivileged people can not afford healthy food [36]. Unfortunately, when passed on to adolescents, these beliefs lead to poor eating habits. In this regard, nutrition education programs should not be generic. For instance, schools in low-income and high-income settings may not benefit from the same generic nutrition education programs because they may have different nutritional problems.
4.4. Cross Cross-Cutting Determinants of Underweight and Obesity
Employment status (formally employed) was the only factor associated with both underweight and overweight. This overlap shows the power of family income as a social determinant of health. In the Zimbabwean context, this is a novel finding in relation to in relation to nutrition status. The fact that being formally employed is associated with both under and overweight nutrition could be explained in relation to the stability of a country’s economy [52]. Under normal circumstances, being formally employed should ensure financial stability and nutritional security among families. However, in struggling economies like Zimbabwe, food insecurity and under-nutrition remain even among the working class. On the other hand, the working-class group may enjoy the health and nutritional benefits spawning from economic growth, especially among the economically advantaged sectors of the population. Inequalities of wealth, outcomes and opportunities may be other contributing factors. Inequality of outcomes arises from a combination of differences in opportunities and individual’s efforts and talent [53]. For instance, parental income, resulting from their own effort, determines the opportunity for their children to eat better, have better living conditions and obtain an education [52]. These inequalities result in wealth gaps where the wealthy become wealthier, and the poor become poorer, affecting nutrition outcomes. In our previous studies, we found that in Zimbabwe, wealthy people do not buy healthy foods despite their ability to afford it. On the other hand, under-privileged people can not afford a variety of healthy foods [36].
Some levels of inequalities are necessary in developing countries as they provide opportunities for innovation and entrepreneurship [54]. However deep-rooted inequality of outcomes can significantly undermine individuals’ educational and occupational choices leading to unemployment. As a result, individuals have a mandate to divert their efforts towards obtaining favored treatment, resulting in resource misallocation and misuse, corruption and nepotism [55,56,57]. Collectively these characteristics are prevalent in Zimbabwe and have severe social and economic consequences contributing to the double burden of malnutrition where the citizens of a country are either starving in one area while the other area is overfed [34,46]. Overall, we established that inequalities in wealth, opportunities and outcomes are amongst the top drivers of the observed double burden of malnutrition.
4.5. Strengths and Limitations of the Study
This study has provided possible explanations as to why underweight and overweight statuses may co-exist within a given population. Furthermore, we highlighted the need to acknowledge obesity as a health problem in Zimbabwe. Several limitations should be considered when interpreting these results. Firstly, the variables in this study were developed post hoc from existing surveys. In the questionnaire, synonyms of nouns that are specific to Zimbabwean context were used. For example, the word cookie was replaced with biscuit. Furthermore, some variables were dichotomized for ease of presentation. We acknowledge the potential for recall bias in the estimation of food habits and any other recall-based questions. This survey was conducted in Harare. Future research should be conducted using study populations from multiple regions, to obtain even more accurate results than those of the present study. Overall, the current study adds to the limited literature on overweight/obesity prevalence and the double burden of malnutrition among adolescents in low-income African countries such as Zimbabwe.
4.6. Implications of the Findings on Policy and for Practice
We acknowledge the current efforts to address adolescent nutrition through the Government’s initiative to launch the Zimbabwe School Health Policy (ZSHP) [23]. However, within this policy, nutrition problems and course of action are a fraction of the whole policy. As it is, adolescents’ nutrition is overshadowed by other outwardly serious health issues. Therefore, we recommend stand-alone nutrition policies in which overweight and obesity problems are acknowledged and clear courses of action are mapped out to raise awareness, give preventative measures and provide interventions for affected communities. Furthermore, Zimbabwe may benefit from food and nutrition policies that identify and provide solutions for food-related issues like nutrition transition caused by food import dependency. When implementing nutrition policies, Zimbabwe may benefit from learning from other countries like Japan. Japan has been continuously advancing national nutrition policies according to the present nutrition challenges. For example, between 1965 and the 1990s, Japan was already tackling non-communicable diseases that came with nutrition transition and economic growth, and since the 2000s they have been dealing with more complex nutrition challenges associated with declining birth rates and aging societies [58]. It is worth noting Japan’s efforts to implement nutrition policies soon after World War 2, a time of severe economic challenges and well before it achieved its increase in GDP. This shows that it is possible to launch stand-alone nutrition policies amid economic challenges. Furthermore, policy-led interventions should consider multilevel factors at the individual, community and societal levels [59]. Some examples of Japanese nutrition policies are: The Food and Nutrition Policy (2005 version), which encourages citizens to think carefully about their food and nutrition and to adopt healthy dietary habits despite changes in the economy and the food environment [60]; Healthy Japan 21 (second term, 2013 version), which was introduced to support the prevention of lifestyle diseases and, based on this policy, community-based nutrition actions linked the food chain from farm to fork [61]; The Nutrition policy to Leave No One Behind (2023 version), which stipulates a placement of registered dietitians/dietitians and designates a wide range of facilities to place them, such as hospitals, schools and elderly care facilities [58]. Nutrition problems evolve with time and for a healthier nation, no problem or person should be left behind.
5. Conclusions
The results show that overweight status appears to be more pronounced over than underweight status amongst adolescents. Despite an increasing in volume of research focused on adolescents, important knowledge gaps remain and efforts to improve adolescent nutrition knowledge, physical activity through research and nutrition intervention implementation may not yield much without government involvement at the economic policies policy level. Furthermore, our study calls for more awareness of overweight and obesity as a public health issue and there is a need for long-term cohort studies to follow- up and bring innovative strategies to give attention to both underweight and overweight and obesity as public issues co-existing among urban adolescents.
Supplementary Materials
The following supporting information can be downloaded at: https://www.mdpi.com/article/10.3390/obesities4010002/s1, Questionnaire.
Author Contributions
Conceptualization, A.P. and N.H. (Naomi Hayami); methodology, A.P.; validation, A.P. and N.H. (Naomi Hayami); formal analysis, A.P. and T.M.C.; investigation, A.P.; resources, A.P. and N.H. (Naomi Hayami); data curation, A.P.; writing—original draft preparation, A.P.; writing—review and editing. N.H. (Naomi Hayami), T.M.M. and N.H. (Nobuko Hongu), visualization, A.P. and T.M.C.; supervision, T.M.M. and N.H. (Nobuko Hongu); project administration, A.P. and N.H. (Naomi Hayami); All authors have read and agreed to the published version of the manuscript.
Funding
This research received no external funding.
Institutional Review Board Statement
The study was conducted in accordance with the Declaration of Helsinki and approved by the Institutional Review Board (or Ethics Committee) of the Graduate School of Human Life and Ecology, Osaka Metropolitan University (OMU/21-52) and the Medical Research Council of Zimbabwe (MRCZ/A/2857). Approval was sought at the Ministry of Primary and Secondary Education (MoPSE) and the schools through a consultative engagement process.
Informed Consent Statement
Informed consent was obtained from all participants involved in the study.
Data Availability Statement
The datasets generated and/or analyzed during the current study are available from the corresponding author upon reasonable request.
Acknowledgments
We thank the adolescents who participated in this study and their parents and/or guardians for giving consent. We also acknowledge and thank the authorities, the participating schools, and the Ministry of Primary and Secondary Education (MoPSE) for approving the study. Lastly, we thank the research team which assisted with field data collection and analysis.
Conflicts of Interest
The authors declare no conflicts of interest.
References
- Kulkarni, P.; Ashok, N.C.; Kumar, D.S.; Siddalingappa, H.; Madhu, B. World Health Organization—Body Mass Index for Age Criteria as a Tool for Prediction of Childhood and Adolescent Morbidity: A Novel Approach in Southern. Int. J. Prev. Med. 2014, 5, 695–702. [Google Scholar] [PubMed]
- Popkin, B.M.; Corvalan, C.; Grummer-Strawn, L.M. Dynamics of the Double Burden of Malnutrition and the Changing Nutrition Reality. Lancet 2020, 395, 65–74. [Google Scholar] [CrossRef] [PubMed]
- Popkin, B.M.; Adair, L.S.; Ng, S.W. NOW AND THEN: The Global Nutrition Transition: The Pandemic of Obesity in Developing Countries. Nutrients 2012, 70, 3–21. [Google Scholar] [CrossRef]
- Popkin, B.M.; Slining, M.M. New dynamics in global obesity facing low- and middle-income countries. Obes. Rev. 2013, 14 (Suppl. S2), 11–20. [Google Scholar] [CrossRef]
- Mchau, G.; Killel, E.; Azizi, K.; Henry, S.; Ainan, S.; Jumbe, T.; Bundara, N.; Kystikila, W.; Mwingira, F.; Machafuko, P.; et al. Co-occurrence of Overweight, Stunting, and Anemia among Adolescents (10–19 Years) in Tanzania Mainland: A School-Based Cross-Sectional Study. Curr. Dev. Nutr. 2023, 8, 102016. [Google Scholar] [CrossRef]
- Modjadji, P. Socio-demographic Determinants of Overweight and Obesity Among Mothers of Primary School Children Living in a Rural Health and Demographic Surveillance System Site, South Africa. Open Public Health J. 2020, 13, 518–528. [Google Scholar] [CrossRef]
- Maged, M.; Abd El-Fatah, N.K.; Abu-Elenin, M.M. Prevalence of Stunting, Overweight and Obesity among Egyptian Primary School Children in Behera Governorate. Food Public Health 2019, 9, 84–93. [Google Scholar]
- Popkin, B.M. The Nutrition Transition and Global Food System Dynamics: The Accelerating Speed of Change and Global Challenges We Face for Creating a Healthier Global Diet. In Global Food Research Program; WHO: Geneva, Switzerland, 2017; pp. 1–53. [Google Scholar]
- Nyanhanda, T.; Mwanri, L.; Mude, W. Double Burden of Malnutrition: A Population Level Comparative Cross-Sectional Study across Three Sub-Saharan African Countries—Malawi, Namibia and Zimbabwe. Int. J. Environ. Res. Public Health 2023, 20, 5860. [Google Scholar] [CrossRef]
- Pencil, A.; Matsungo, T.M.; Hongu, N.; Hayami, N. Prevalence of Obesity and the Factors Associated with Low Obesity Awareness among Urban Adolescents in Harare, Zimbabwe. Nutrients 2023, 15, 2302. [Google Scholar] [CrossRef] [PubMed]
- Muderedzwa, T.M.; Matsungo, T.M. Nutritional status, physical activity and associated nutrition knowledge of primary school learners. Nutr. Health 2020, 26, 115–125. [Google Scholar] [CrossRef] [PubMed]
- Charan, J.; Biswas, T. How to calculate sample size for different study designs in medical research? Indian J. Psychol. Med. 2013, 35, 121–126. [Google Scholar] [CrossRef] [PubMed]
- Oz, F.; Aydin, R.; Onsuz, M.F.; Metintas, S.; Emiral, G.O. Development of a reliable and valid adolescence nutritional knowledge questionnaire. Progr Nutr. 2016, 18, 125–134. [Google Scholar]
- Johnson, F.; Wardle, J.; Griffith, J. The adolescent food habits checklist: Reliability and validity of a measure of healthy eating behaviour in adolescents. Eur. J. Clin. Nutr. 2002, 56, 644–649. [Google Scholar] [CrossRef] [PubMed]
- Silva, D.R.; Werneck, A.; Collings, P.J.; Fernandes, R.; Barbosa, D.S.; Ronque, E.R.V.; Sardinha, L.B.; Cyrino, E.S. Physical activity maintenance and metabolic risk in adolescents. J. Public Health 2018, 40, 493–500. [Google Scholar] [CrossRef] [PubMed]
- World Health Organization. BMI-for-age (5–19 years). In Growth Reference Data for 5–19 Years; WHO: Geneva, Switzerland, 2016. [Google Scholar]
- Decoster, J.; Gallucci, M.; Iselin, A.R. Best Practices for Using Median Splits, Artificial Categorization, and their Continuous Alternatives. J. Exp. Psychopathol. 2011, 2, 197–209. [Google Scholar] [CrossRef]
- Iacobucci, D.; Posavac, S.S.; Kardes, F.R. ScienceDirect the median split: Robust, refined, and revived. J. Consum. Psychol. 2015, 25, 690–704. [Google Scholar] [CrossRef]
- Decoster, J.; Iselin, A.R.; Gallucci, M. A Conceptual and Empirical Examination of Justifications for Dichotomization A Conceptual and Empirical Examination of Justifications for Dichotomization. Psychol. Methods 2009, 14, 349–366. [Google Scholar] [CrossRef]
- Scaling up Nutrition in Zimbabwe, The Food and Nutrition Council, Harare, Zimbabwe. 2019. Available online: https://fnc.org.zw/wp-content/uploads/2019/01/Scaling-Up-Nutrition-In-Zimbabwe (accessed on 18 December 2023).
- Chiromba, A.K.; Ncube, T.N.; Teta, I.N.; Nyadzayo, T.K. Addressing Micronutrient Deficiencies in Zimbabwe: Achievements, Challenges and Future Actions. J. Health Sci. 2020, 8, 116–125. [Google Scholar] [CrossRef]
- MoHCC. Zimbabwe National Nutrition Strategy 2014–2018. Natl. Nutr. Strateg.; 2014. Available online: https://www.advancingnutrition.org/resources/adolescent-resource-bank/zimbabwe-national-nutrition-strategy-2014-2018 (accessed on 2 January 2024).
- Ministry of Primary and Secondary Education. Zimbabwe School Health Policy; Ministry of Primary and Secondary Education: Harare, Zimbabwe, 2018; pp. 1–38.
- Matsungo, T.M.; Chopera, P.; Tsikayi, P.; Benhura, C.; Mushonga, N.G.T. Nutritional Status and Lifestyle characteristics of adults aged 15–49 years living in Harare, Zimbabwe. Cent. Afr. J. Med. 2019, 65, 10–14. [Google Scholar]
- UNICEF Zimbabwe, Nutrition Cluster Status, Zimbabwe. Consolidated Emergency Report. 2021. Available online: https://open.unicef.org/sites/transparency/files/2022-04/Zimbabwe (accessed on 22 February 2024).
- Leocádio, P.C.L.; Lopes, S.C.; Dias, R.P. The Transition from Undernutrition to Overnutrition under Adverse Environments and Poverty: The Risk for Chronic Diseases. Front. Nutr. 2021, 8, 676044. [Google Scholar] [CrossRef]
- Conti, M.V.; Itani, L.; Beretta, A.; Yaghi, K.; Filosa, A.; Monti, C.; Cena, H. An overview of the nutritional status of childbearing age women, children and adolescents living in a rural area of Madagascar: Preliminary results of the Tany Vao project. Public Health Nutr. 2024, 27, 1–31. [Google Scholar] [CrossRef] [PubMed]
- NACS. Nutrition Assessment, Counseling, and Support (NACS): A User’s Guide—Module 2: Nutrition Assessment and Classification, Version 2. In Nutrition Assessment, Counseling, and Support (NACS); USAID: Washington, DC, USA, 2016; Volume 2, pp. 1–12. Available online: https://www.fantaproject.org/sites/default/files/resources/NACS-Users-Guide-Module2-May2016.pdf (accessed on 29 February 2014).
- Veronika, A.P.; Puspitawati, T.; Fitriani, A. Associations between nutrition knowledge, protein-energy intake and nutritional status of adolescents. J. Public Health Res. 2021, 10, 385–389. [Google Scholar] [CrossRef] [PubMed]
- United Nations. Global Nutrition Report. 2018. Available online: https://globalnutritionreport.org/reports/2022-global-nutrition-report (accessed on 9 January 2024).
- Sanders, D. The Origins of Malnutrition in Zimbabwe by. 1982. Available online: https://journals.co.za/doi/pdf/10.10520/EJC-e4047eec1 (accessed on 12 January 2024).
- Gammarano, R.; Production, D.; Unit, A. The Working Poor or How a Job Is No Guarantee of Decent Living Conditions. National Institutes of Humanities Research, 2019. Available online: https://teba.opeka.gr/wp-content/uploads/2020/12/FORESIGHT-AND-RISK-ASSESSMENT-Eng-22-9-2020-FINAL.pdf (accessed on 13 January 2024).
- Majid, N. The working poor in developing countries. Int. Labour Rev. 2001, 140, 271–291. [Google Scholar] [CrossRef]
- Reese-Masterson, A.; Murakwani, P. Assessment of adolescent girl nutrition, dietary practices and roles in Zimbabwe. Field Exch. Emerg. Nutr. Netw. ENN 2016, 52, 113–115. Available online: http://www.ennonline.net/fex/52/adolescentgirlnutrition (accessed on 8 February 2024).
- Aikman, S.N.; Min, K.E.; Graham, D. Food attitudes, eating behavior, and the information underlying food attitudes. Appetite 2006, 47, 111–114. [Google Scholar] [CrossRef] [PubMed]
- Pencil, A.; Matsungo, T.M.; Hayami, N. Determinants of overweight and obesity among adolescents in Zimbabwe: A scoping review. Nor. Afr. J. Food Nutr. Res. 2021, 5, 112–121. [Google Scholar] [CrossRef]
- Slaght, J.L.; Wicklow, B.A.; Dart, A.B.; Sellers, E.A.C.; Gabbs, M.; Carino, M.; McGavock, J.M. Physical activity and cardiometabolic health in adolescents with type 2 diabetes: A cross-sectional study. BMJ Open Diabetes Res. Care 2021, 9, e002134. [Google Scholar] [CrossRef] [PubMed]
- Van Sluijs, E.M.F.; Ekelund, P.U.; Crochemore-silva, I. Europe PMC Funders Group Physical activity behaviours in adolescence: Current evidence and opportunities for intervention. Lancet 2022, 398, 429–442. [Google Scholar] [CrossRef]
- Vaitkeviciute, R.; Ball, L.E.; Harris, N. The relationship between food literacy and dietary intake in adolescents: A systematic review. Public Health Nutr. 2015, 18, 649–658. [Google Scholar] [CrossRef]
- Klingberg, S.; Draper, C.E.; Micklesfield, L.K.; Benjamin-Neelon, S.E.; van Sluijs, E.M.F. Childhood obesity prevention in africa: A systematic review of intervention effectiveness and implementation. Int. J. Environ. Res. Public Health 2019, 16, 1212. [Google Scholar] [CrossRef]
- Active Healthy Kids Zimbabwe. The Zimbabwe Report Card on the Physical Activity for Children and Youth. 2022, pp. 1–32. Available online: https://www.activehealthykids.org/wp-content/uploads/2022/11/Zimbabwe-report-card-long-form-2022 (accessed on 22 January 2024).
- Mapfumo, P.T.; Muderedzwa, T.M.; Matsungo, T.M. Prevalence and determinants of overweight and obesity among in-school adolescents in Harare, Zimbabwe. J. Food Nutr. Res. 2022, 6, 29–38. [Google Scholar] [CrossRef]
- Oh, C.; Carducci, B.; Vaivada, T.; Bhutta, Z.A. Digital Interventions for Universal Health Promotion in Children and Adolescents: A Systematic Review. Pediatrics 2022, 149, e2021053852H. [Google Scholar] [CrossRef]
- Matsungo, T.M.; Chopera, P. Effect of the COVID-19-induced lockdown on nutrition, health and lifestyle patterns among adults in Zimbabwe. BMJ Nutr. Prev. Health 2020, 3, 205–212. [Google Scholar] [CrossRef] [PubMed]
- Mangemba, N.T.; San Sebastian, M. Societal risk factors for overweight and obesity in women in Zimbabwe: A cross-sectional study. BMC Public Health 2020, 20, 103. [Google Scholar] [CrossRef] [PubMed]
- Renzaho, A.M.N. Fat, rich and beautiful: Changing socio-cultural paradigms associated with obesity risk, nutritional status and refugee children from sub-Saharan Africa. Health Place 2004, 10, 105–113. [Google Scholar] [CrossRef] [PubMed]
- Ndiweni, E. The rise of informal entrepreneurs in Zimbabwe: Evidence of economic growth or failure of economic policies? Afr. J. Account. Audit. Financ. 2013, 2, 260–276. [Google Scholar] [CrossRef]
- Munyoro, G.; Chikombingo, M.; Nyandoro, Z. The Motives of Zimbabwean Entrepreneurs: A Case Study of Harare. ADRRI J. (Multidiscip.) 2016, 25, 1–13. [Google Scholar]
- Chopera, P.; Zimunya, P.R.; Mugariri, F.M.; Matsungo, T.M. Facilitators and barriers to the consumption of traditional foods among adults in Zimbabwe. J. Ethn. Foods 2022, 9, 5. [Google Scholar] [CrossRef]
- Brouwer, S.F. Kumusha and masalads: (Inter) generational foodways and urban food security in Zimbabwe. Agric. Hum. Values 2022, 40, 761–775. [Google Scholar] [CrossRef]
- Ferris, W.F.; Crowther, N.J. Once fat was fat and that was that: Our changing perspectives on adipose tissue. Cardiovasc. J. Afr. 2011, 22, 147–154. [Google Scholar] [CrossRef][Green Version]
- Hong, R.; Banta, J.E.; Betancourt, J.A. International Journal for Equity in Relationship between household wealth inequality and chronic childhood under-nutrition in Bangladesh. Int. J. Equity Healthy 2006, 10, 15. [Google Scholar] [CrossRef]
- Patrick, N.; Solleder, O. Working Paper Wealth Distribution, Income Inequality and Financial Inclusion: A Panel Data Analysis. United Nations Conference on Trade and Development, 2023. Available online: https://unctad.org/publication/wealth-distribution-income-inequality-and-financial-inclusion-panel-data-analysis (accessed on 28 January 2024).
- Dabla-norris, E.; Kochhar, K. Causes and Consequences of Income Inequality: A Global Perspective. 2015, pp. 1–39. Available online: https://www.imf.org/external/pubs/ft/sdn/2015/sdn1513.pdf (accessed on 29 January 2024).
- Zucman, G. Global Wealth Inequality. Ann. Rev. Econ. 2019, 11, 109–138. Available online: https://gabriel-zucman.eu/files/Zucman2019.pdf (accessed on 29 January 2024). [CrossRef]
- Brief, P. Land Inequality, Gender Land Disparity and Poverty in Rural. J. Int. Women’s Stud. 2021, pp. 1–5. Available online: https://www.academia.edu/89447820/Gender_Poverty_and_Inequality_in_the_Aftermath_of_Zimbabwe_s_Land_Reform_A_Transformative_Social_Policy_Perspective (accessed on 3 February 2024).
- United Nations Development Program. Inequality Intensity and Poverty Drive Conflicts in Sub-Saharan Africa. 2011, pp. 220–242. Available online: https://www.undp.org/sites/g/files/zskgke326/files/migration/africa/undp-rba_Income-Inequality-in-SSA_Chapter-10.pdf (accessed on 12 February 2024).
- Government of Japan; Ministry of Health, Labor and Welfare. Nutrition Policies to Leave No One Behind. 2023. Available online: https://www.mhlw.go.jp/nutrition_policy/en/ (accessed on 20 February 2024).
- Getacher, L.; Ademe, B.W.; Belachew, T. Understanding the national evidence on the double burden of malnutrition in Ethiopia for the implications of research gap identifications: A scoping review. BMJ Open 2023, 13, e075600. [Google Scholar] [CrossRef]
- Government of Japan. MEXT, Basic Act on Shokuiku (Food and Nutrition Education). 2005. Available online: https://www.maff.go.jp/e/data/publish/attach/pdf/index-203.pdf (accessed on 20 February 2024).
- Midori, I.; Kaoru, K.; Saiko, S. Food and Nutritional Improvement Action of Communities in Japan: Lessons for the World. 2015, pp. 57–59. Available online: https://www.jstage.jst.go.jp/article/jnsv/61/Supplement/61_S55/_pdf (accessed on 22 February 2024).
Disclaimer/Publisher’s Note: The statements, opinions and data contained in all publications are solely those of the individual author(s) and contributor(s) and not of MDPI and/or the editor(s). MDPI and/or the editor(s) disclaim responsibility for any injury to people or property resulting from any ideas, methods, instructions or products referred to in the content. |
© 2024 by the authors. Licensee MDPI, Basel, Switzerland. This article is an open access article distributed under the terms and conditions of the Creative Commons Attribution (CC BY) license (https://creativecommons.org/licenses/by/4.0/).