1. Introduction
The identification of leptin in 1994 [
1], a protein hormone with a molecular weight of about 16 kDa, produced and secreted in significant quantities by white adipose tissue [
2], represented a remarkable breakthrough in the field of obesity research, allowing the characterization of the role of this hormone as a regulator of body weight and body metabolism [
2]. Leptin is produced mainly in adipose tissue, and circulating leptin levels reflect body adiposity. However, it is also produced in other sites such as the stomach, skeletal muscles, pituitary gland, mammary gland [
2], and placenta [
3].
Leptin plays a crucial role in regulating the body’s energy homeostasis. In addition to functioning as a satiety signal in the central nervous system, it exerts various peripheral effects, such as stimulating angiogenesis and hematopoiesis and regulating bone formation [
4]. In addition to suppressing appetite, leptin can stimulate oxidative stress, inflammation, blood clotting, increased arterial stiffness, angiogenesis, and atheroma plaque formation [
5]. Its role in human physiology has been studied in various areas of medical research [
2,
4,
5,
6].
Leptin circulates in the blood unbound or bound to proteins. It is transported across the blood–brain barrier through a unidirectional system, reaching the cerebrospinal fluid [
7]. Different isoforms of the leptin receptor are generated from alternative splicing of the human ob-R messenger RNA (mRNA), which encodes the leptin receptor [
8]. The
ob gene, related to leptin, is expressed in the placenta, which is one of the main sources of fetal leptin during gestation [
3]. Leptin is important in regulating gestational metabolism and body weight and has been associated with conditions such as obesity and malnutrition during pregnancy [
3]. Studies indicate that these regulatory processes play a fundamental role in early pregnancy and later stages of embryonic and fetal development, influencing long-term effects that may persist into adulthood [
9,
10].
Placental trophoblastic cells express a significant amount of leptin, which has an autocrine trophic effect in this tissue, with the majority being secreted into the bloodstream, making the storage in adipose cells less important [
7,
10]. Although the underlying mechanisms regulating maternal and fetal weight during pregnancy are not fully elucidated, leptin may play an important role as a regulatory factor. Nonetheless, obesity is related to leptin resistance [
11], indicating a potential influence of this hormone on weight regulation during pregnancy. This study aimed to investigate leptin levels in maternal and umbilical cord blood of the parturient and their relationship with fetal weight and conditions at birth.
2. Materials and Methods
The study was conducted in accordance with the Declaration of Helsinki and approved by the Ethics in Research Committee of the Federal University of Minas Gerais, Brazil (COEP/UFMG) number # ETIC 0650.0.203.000-10), by the Board of Education, Research and Extension of the Hospital das Clínicas of UFMG (Brazil), by the Functional Unit Gynecology, Obstetrics, and Neonatology of HC/UFMG and by the Ethics Committee of Risoleta Tolentino Neves Hospital. Written informed consent was obtained from all subjects/patients. Twenty-seven parturients were recruited. It is a convenience sample. The inclusion criteria were no smoking women between 18 and 40 years old, full-term no high-risk singleton pregnancy, and without the use of anti-inflammatory medications. Two parturients were excluded from the study due to the inability to obtain circulating leptin concentrations, resulting in a final group of 25 participants. Immediately after the delivery, we collected samples of peripheral and cord (vein and arteries separately) blood and placenta. Blood samples were collected in sterile vials, without anticoagulant, and stored on ice. After centrifugation, the serum was stored in a −80 °C freezer for future utilization.
Based on maternal leptinemia, the participants were divided into “low and high leptinemia”. corresponding to patients with leptin levels below and above the median (20 ng/mL). Information regarding prenatal care (height, pregestational weight, weight at the end of gestation, blood pressure evolution during pregnancy, complications, and medication use) was collected from the patient’s medical records. After delivery, data related to the newborn were recorded: sex, weight, length, and Apgar score (at 1 and 5 min). An Apgar score above 8 indicates good conditions for the newborn, while scores below that level indicate some degree of fetal compromise. We also obtained newborn body weight and length data up to the fifth month of life from the pediatric records of those who underwent neonatal follow-up in the hospitals involved in this study.
Leptin concentrations in the mother’s peripheral blood, umbilical vein and artery blood, and placenta were measured in the serum by ELISA using commercial kits (R&D Systems, Minneapolis, MN, USA). The leptin retained in the fetus was calculated by the difference between leptinemia in umbilical veins and arteries. The placenta samples were washed with PBS, weighed, and homogenized with cytokine extraction solution (BSA 0.05%; Aprotinin 0.02 μL/mL; benzethonium chloride 0.05 mg/mL, NaCl 0.023 mg/mL; EDTA 0.37 mg/mL; PMSF 0.02 mg/mL, Tween 20 0.5 μL/mL in PBS1x) and centrifuged. Leptin was then measured in the supernatant and normalized by protein concentration, measured by the Lowry method [
12].
Leptin expression in the placenta was measured by RT-PCR in plates of 384 wells. In each well, 2.5 μL of cDNA and 7.5 μL of the mixture containing 5 μL of Syber Green (Applied Biosystems, Foster City, CA, USA), respective primers were placed. The amplification was performed with the following cycles: 10 min at 95 °C (denaturation), followed by 45 cycles of 15 s at 95 °C, and one minute at 60 °C (annealing and extension). The primers used were Leptin: 5′-TTCTTGTGGCTTTGGCCCTA-3′ e: 5′-TGTCATTGATCCTGGTGACAA-3′; Leptin receptor: 5′-GCTATTTTGGGAAGATGTTCCG-3′ e 5′-TGCTTGATAAAAAGATGCTCAAA-3′; beta-actin: 5′-ATCCCCCAAAGTTCACAATG-3′ e 5′-GTGGCTTTTAGGATGGCAAG-3′.
Fragments of placental tissue were also fixed and prepared for immunofluorescence. After nonspecific antigen blockade (1% BSA in PBS for 30 min), slides were covered with the primary antibody (Ob A-20, Santa Cruz, CA, USA) diluted 1:100 with 0.1% BSA solution and 0.05% saponin, and incubated for 60 min at room temperature. After 3 washes with the blocking solution, the slides were covered with Alexa fluor 546 secondary antibody (diluted 1:200) and incubated in the dark for 60 min at room temperature. After washing, slides were covered with DAPI-containing mounting medium, recovered with laminules, and taken to the fluorescence microscope (Leika, Wetzlar, Germany).
It was a convenience sample study since it was interrupted due to SARSCoV-2 restrictions. The Kolmogorov–Smirnov test was used to verify the normal distribution of the data. In cases where normality was met, the Grubbs test was used to identify outliers. In the case of non-parametric distribution, the Box-Plot test was used. The Student’s t-test and Mann–Whitney test were employed to evaluate group differences. Fisher or Chi-square tests were used for categoric variables. The correlation coefficient was calculated using Pearson or Spearman correlation measures. The correlation was considered weak when values were between 0.00 and 0.39, moderate between 0.40 and 0.69, and strong above 0.70. A significance level of 5% was defined for all analyses. GraphPad Prism version 5.0 for Windows (GraphPad Software, San Diego, CA, USA) was used for statistical analysis. The results are presented as mean and standard error or as median with minimum and maximum values for parametric and non-parametric data, respectively.
3. Results
The patient’s average age was 28.7 years, with a body mass index (BMI) of 22.47 kg/m
2 (
Table 1). Additionally, deliveries occurred on average in the 39th week of gestation, with pregnant women having an average weight gain of 12.8 kg. Among the pregnant women, five of them (20%) did not fit into the eutrophic classification based on BMI. Of them, three (12) had a BMI below 18.5 kg/m
2, indicating low weight, while two (8%) represented a BMI above 25 kg/m
2, indicating overweight. The cesarean deliveries represented 48% of the total procedures performed, with natural deliveries (36%) and deliveries requiring forceps (16%) also occurring. Regarding newborn status, it was found that two newborns (8%) had an Apgar score below eight at the 1 min and 5 min evaluations.
Regarding weight gain during pregnancy, 16% of pregnant women (n = 4) had a level below what is considered normal, 12% (n = 3) had a weight gain above this level, and the remaining 72% (n = 18) fell within the normal range. Regarding the weight of newborns, it was found that 8% of cases were below the normal level, while 88% were within the normal range. Only 4% of newborns weighed above the normal range. As for the length of newborns, it was observed that only 4% of cases were below the normal level, while the vast majority (96%) were within the normal range.
The median of maternal blood leptin (20.5 ng/mL) was similar to those found in non-pregnant obese women [
13,
14] and higher than eutrophic ones [
15]. The amount of leptin reaching the fetus through the umbilical vein was approximately one-third of the circulating leptin concentration. In our study, the media leptin level in the umbilical arteries (4.7 ng/mL) was lower than those found in the umbilical vein (6.6 ng/mL) (
Table 1). This retention by the fetus suggests that leptin may play an important significant role during intrauterine life.
When correlation analyses were performed, we found no association between maternal and placental leptin levels. However, maternal leptinemia was positively correlated with maternal pre-gestational and final body weight (
Table 2).
Placental leptin concentration was associated with its expression in the placenta and pre-pregnancy weight. As expected, leptin in the umbilical vein and arteries were positively associated. Leptin levels in the umbilical vein were negatively correlated with the Apgar score. However, no association was found regarding the umbilical artery, suggesting that leptin reaching the fetus by the umbilical vein may affect the overall condition of the newborn.
Although there are no reference values for leptin levels in the placenta, our results did not show a correlation between placental and blood leptin levels.
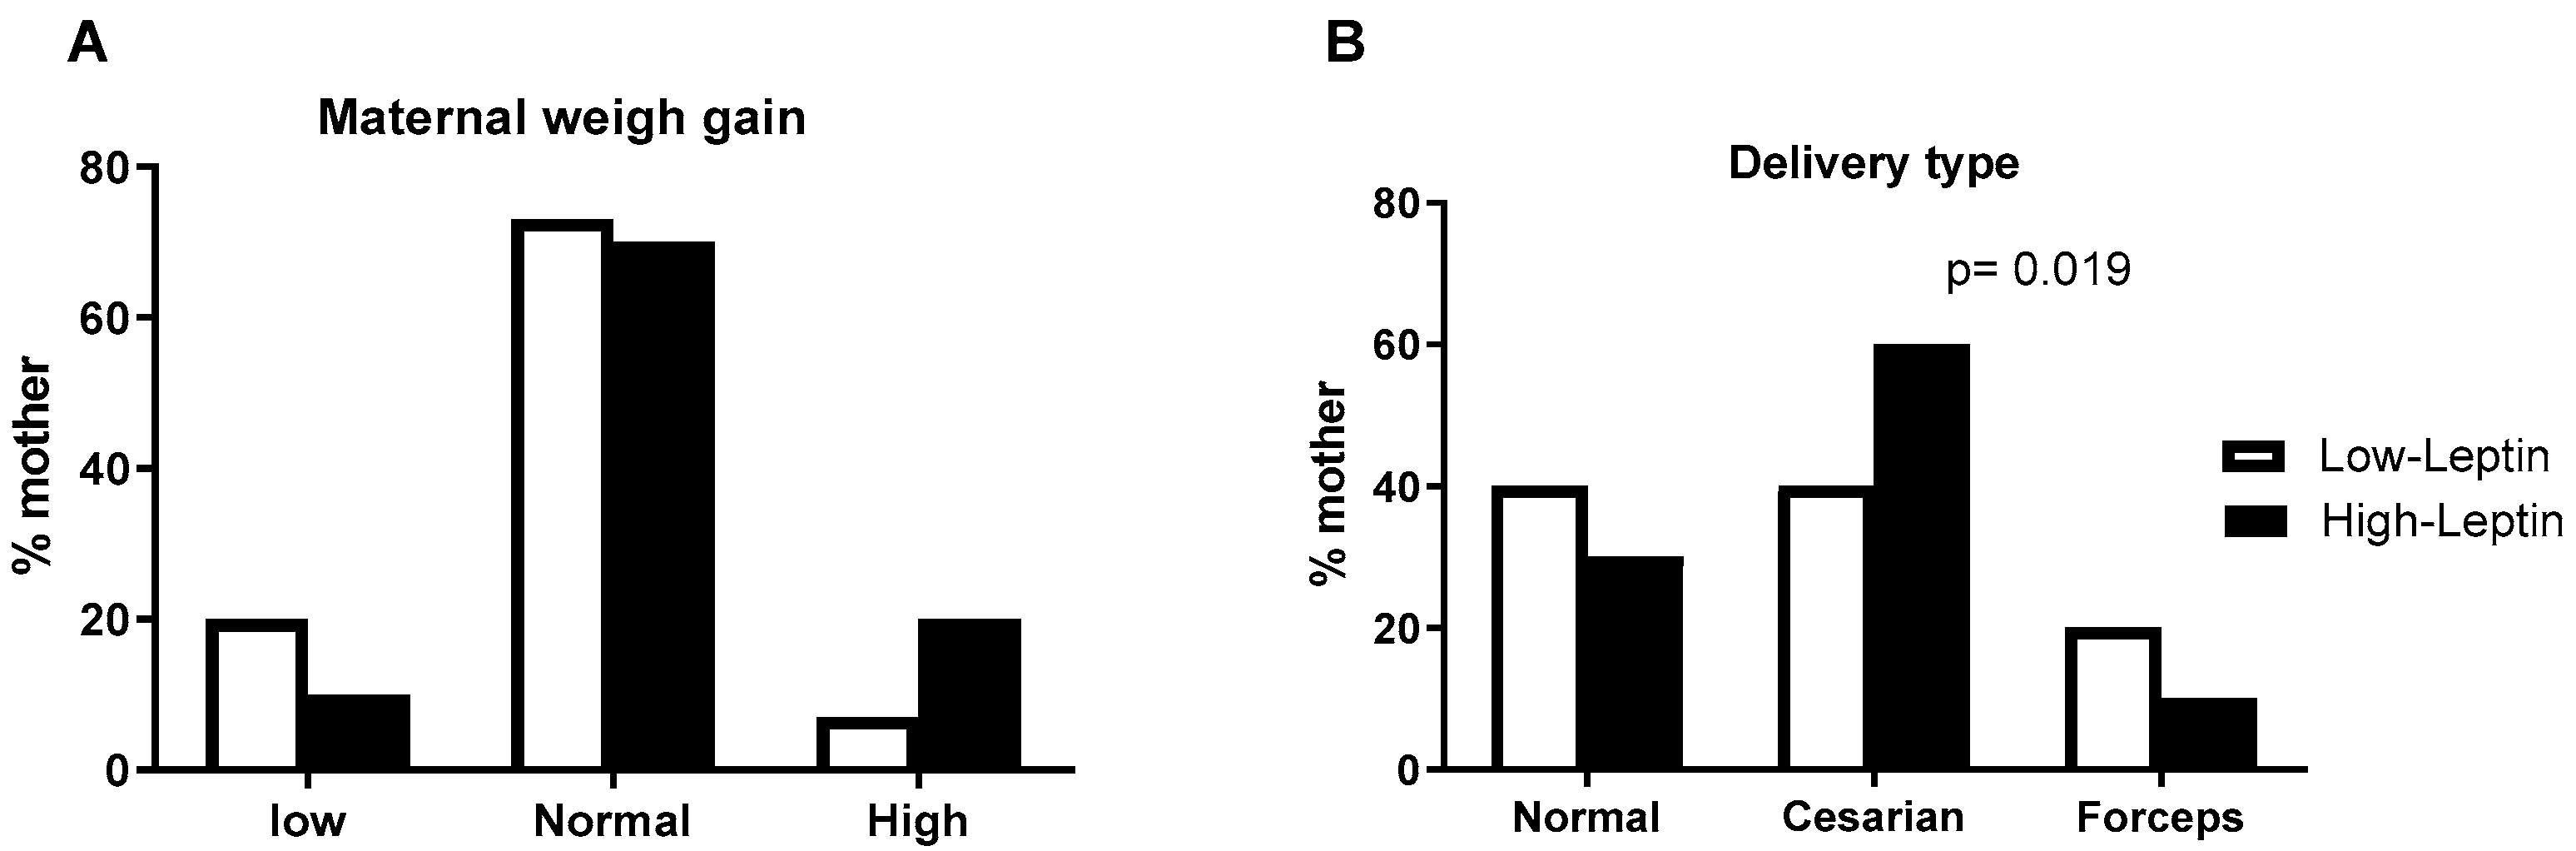
Low and High Leptin groups: When parturients were divided into the high (Leptin > 20 ng/mL) and low (leptin > 20 ng/mL) leptin groups, it was observed that those in the high-leptin group were older and presented higher pre-gestational BMI and weight at the end of pregnancy compared with low leptinemia group (
Table 3). No significant differences were observed between groups regarding gestational age and blood pressure. According to the classification of maternal weight gain, in the low leptinemia group, three (20%) women had below-expected weight gain, and one (7%) had above-expected weight gain. In the high leptinemia group, one patient (10%) had below-expected weight gain, and two (20%) had above-expected weight gain. There is no difference between groups (
Figure 1A). The delivery type, however, shows statistical differences. In the high-leptin group, the proportion of natural (vaginal) delivery is lower than in the low-leptin group (
Figure 1B).
Regarding newborns, leptin level did not influence their gender; the proportion of female or male newborns was similar between groups. A lower Apgar score was observed in newborns of parturients in the high leptinemia group compared to low-leptin one (
Table 3).
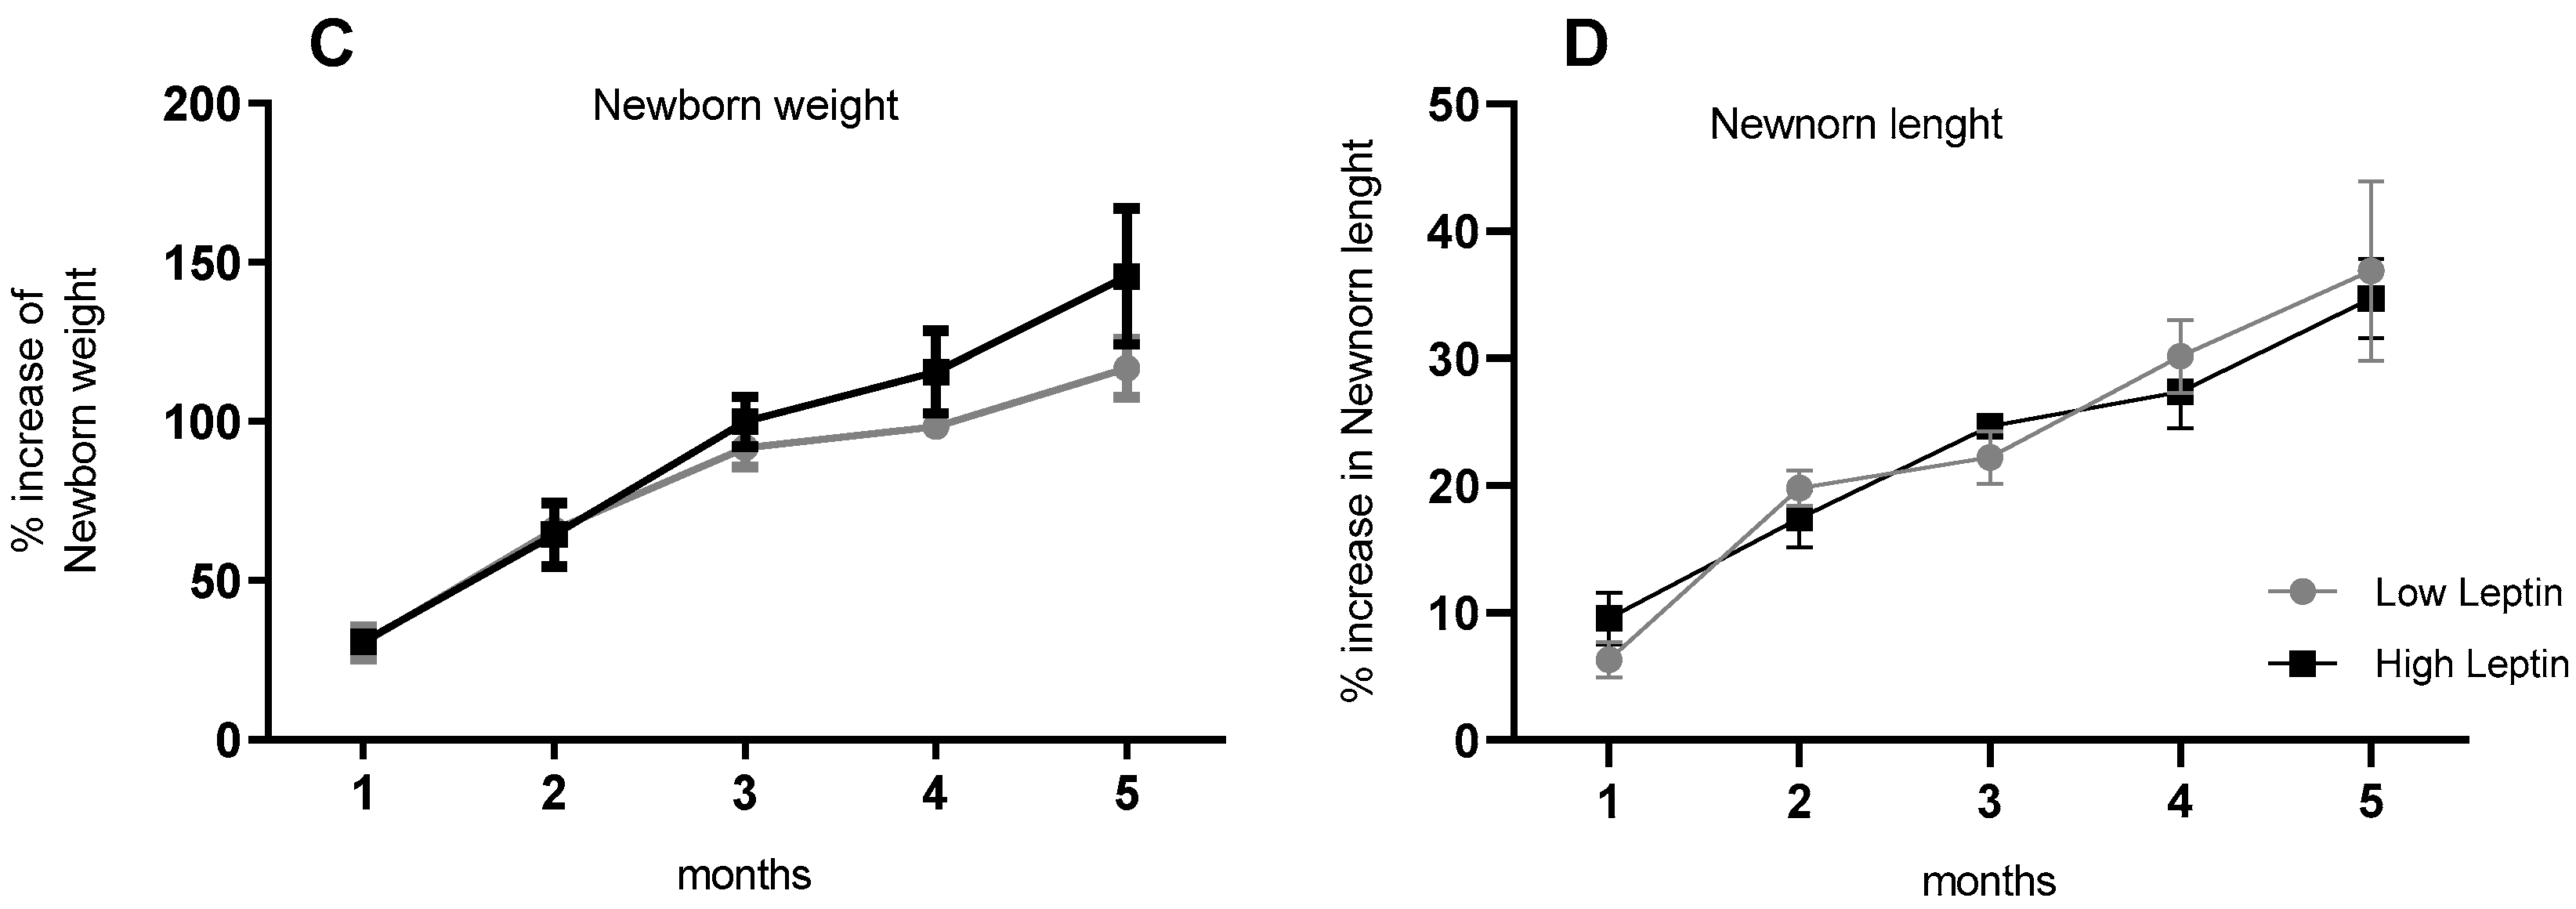
However, despite the differences in the Apgar, there was no difference in weight or length until the age of 5 months (
Figure 1C,D).
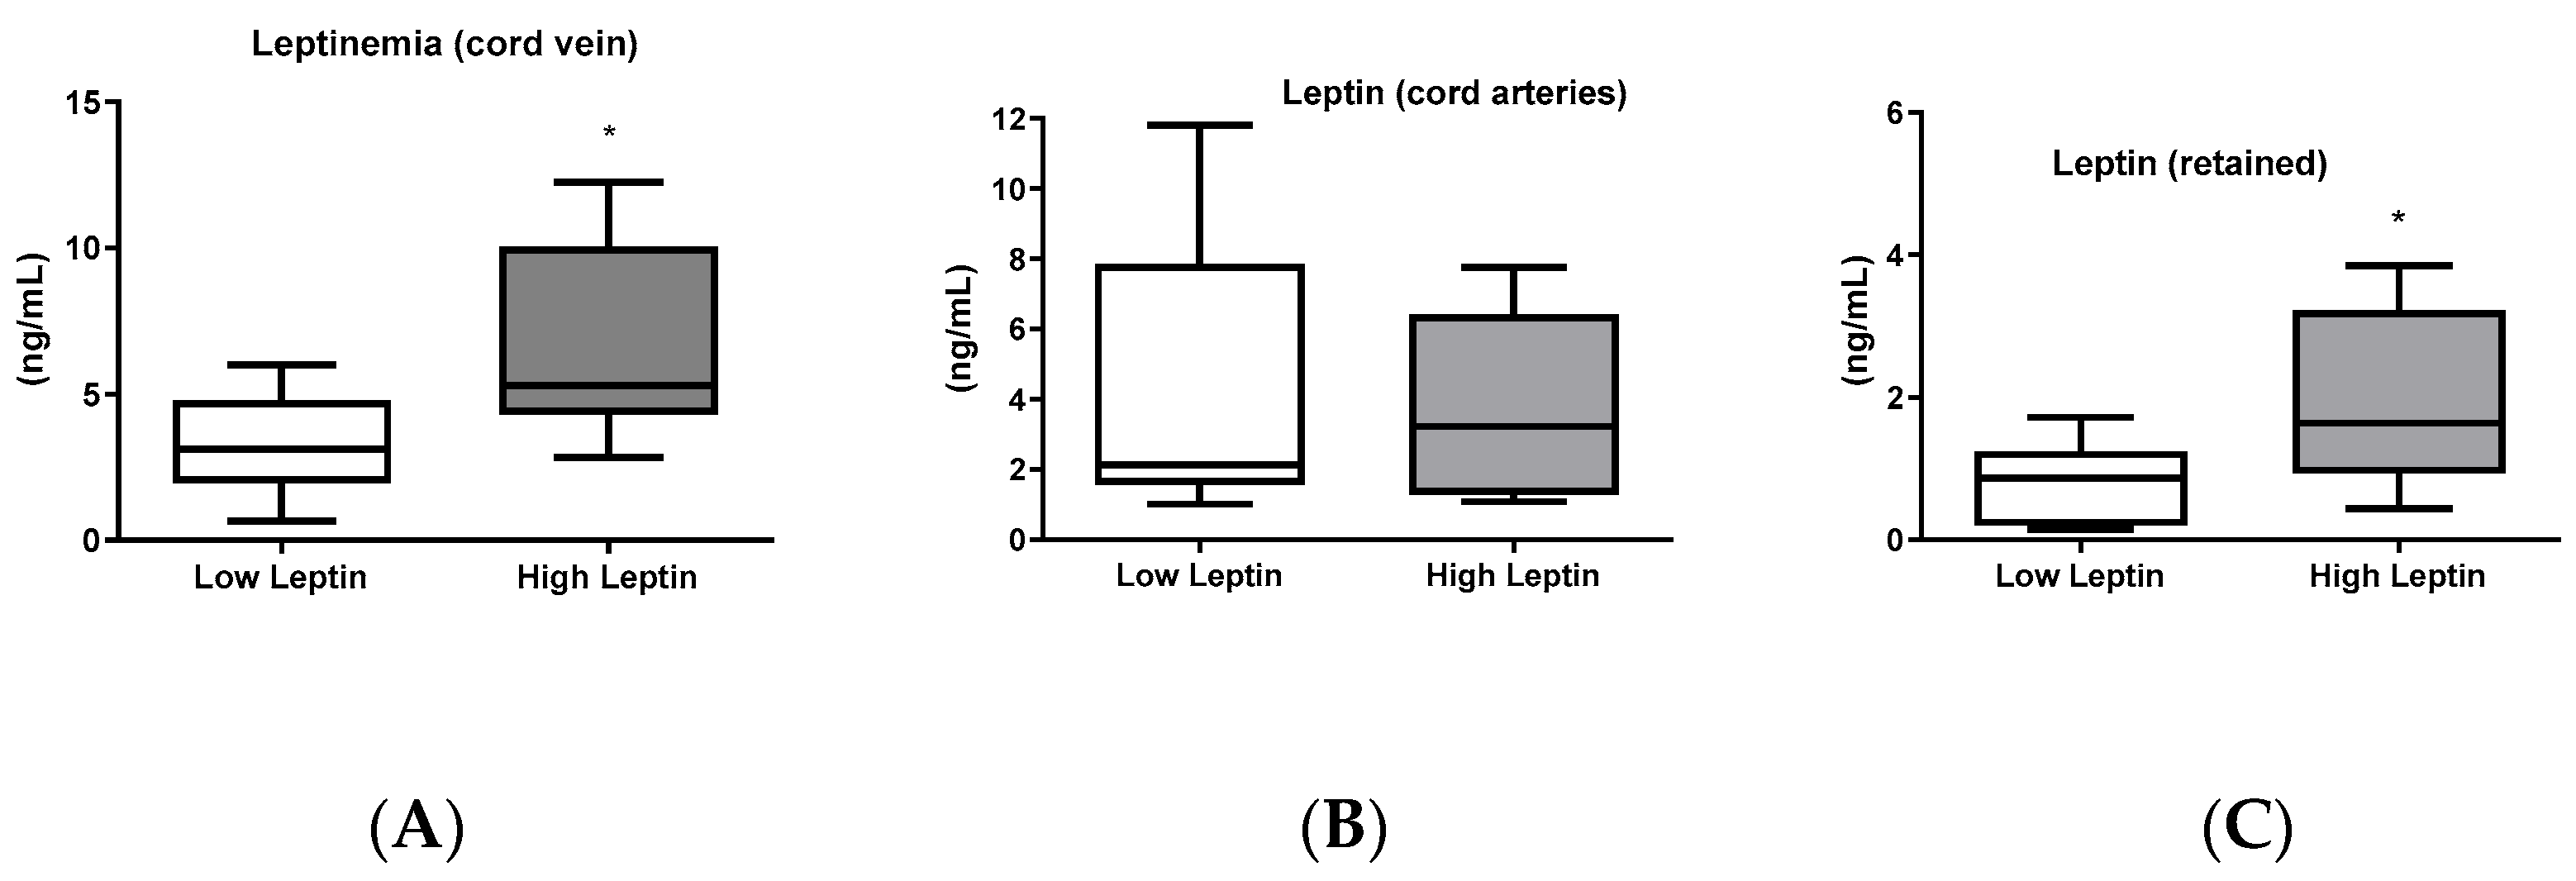
Regarding leptin concentration in umbilical cord blood, it was higher in the umbilical vein of the high-leptin group while no difference was found between groups when cord artery blood was analyzed (
Figure 2B). Consequently, the leptin retained in the fetus (calculated by the difference between leptin concentrations in the veins and arteries) was higher in the high-leptin group (
Figure 2C).
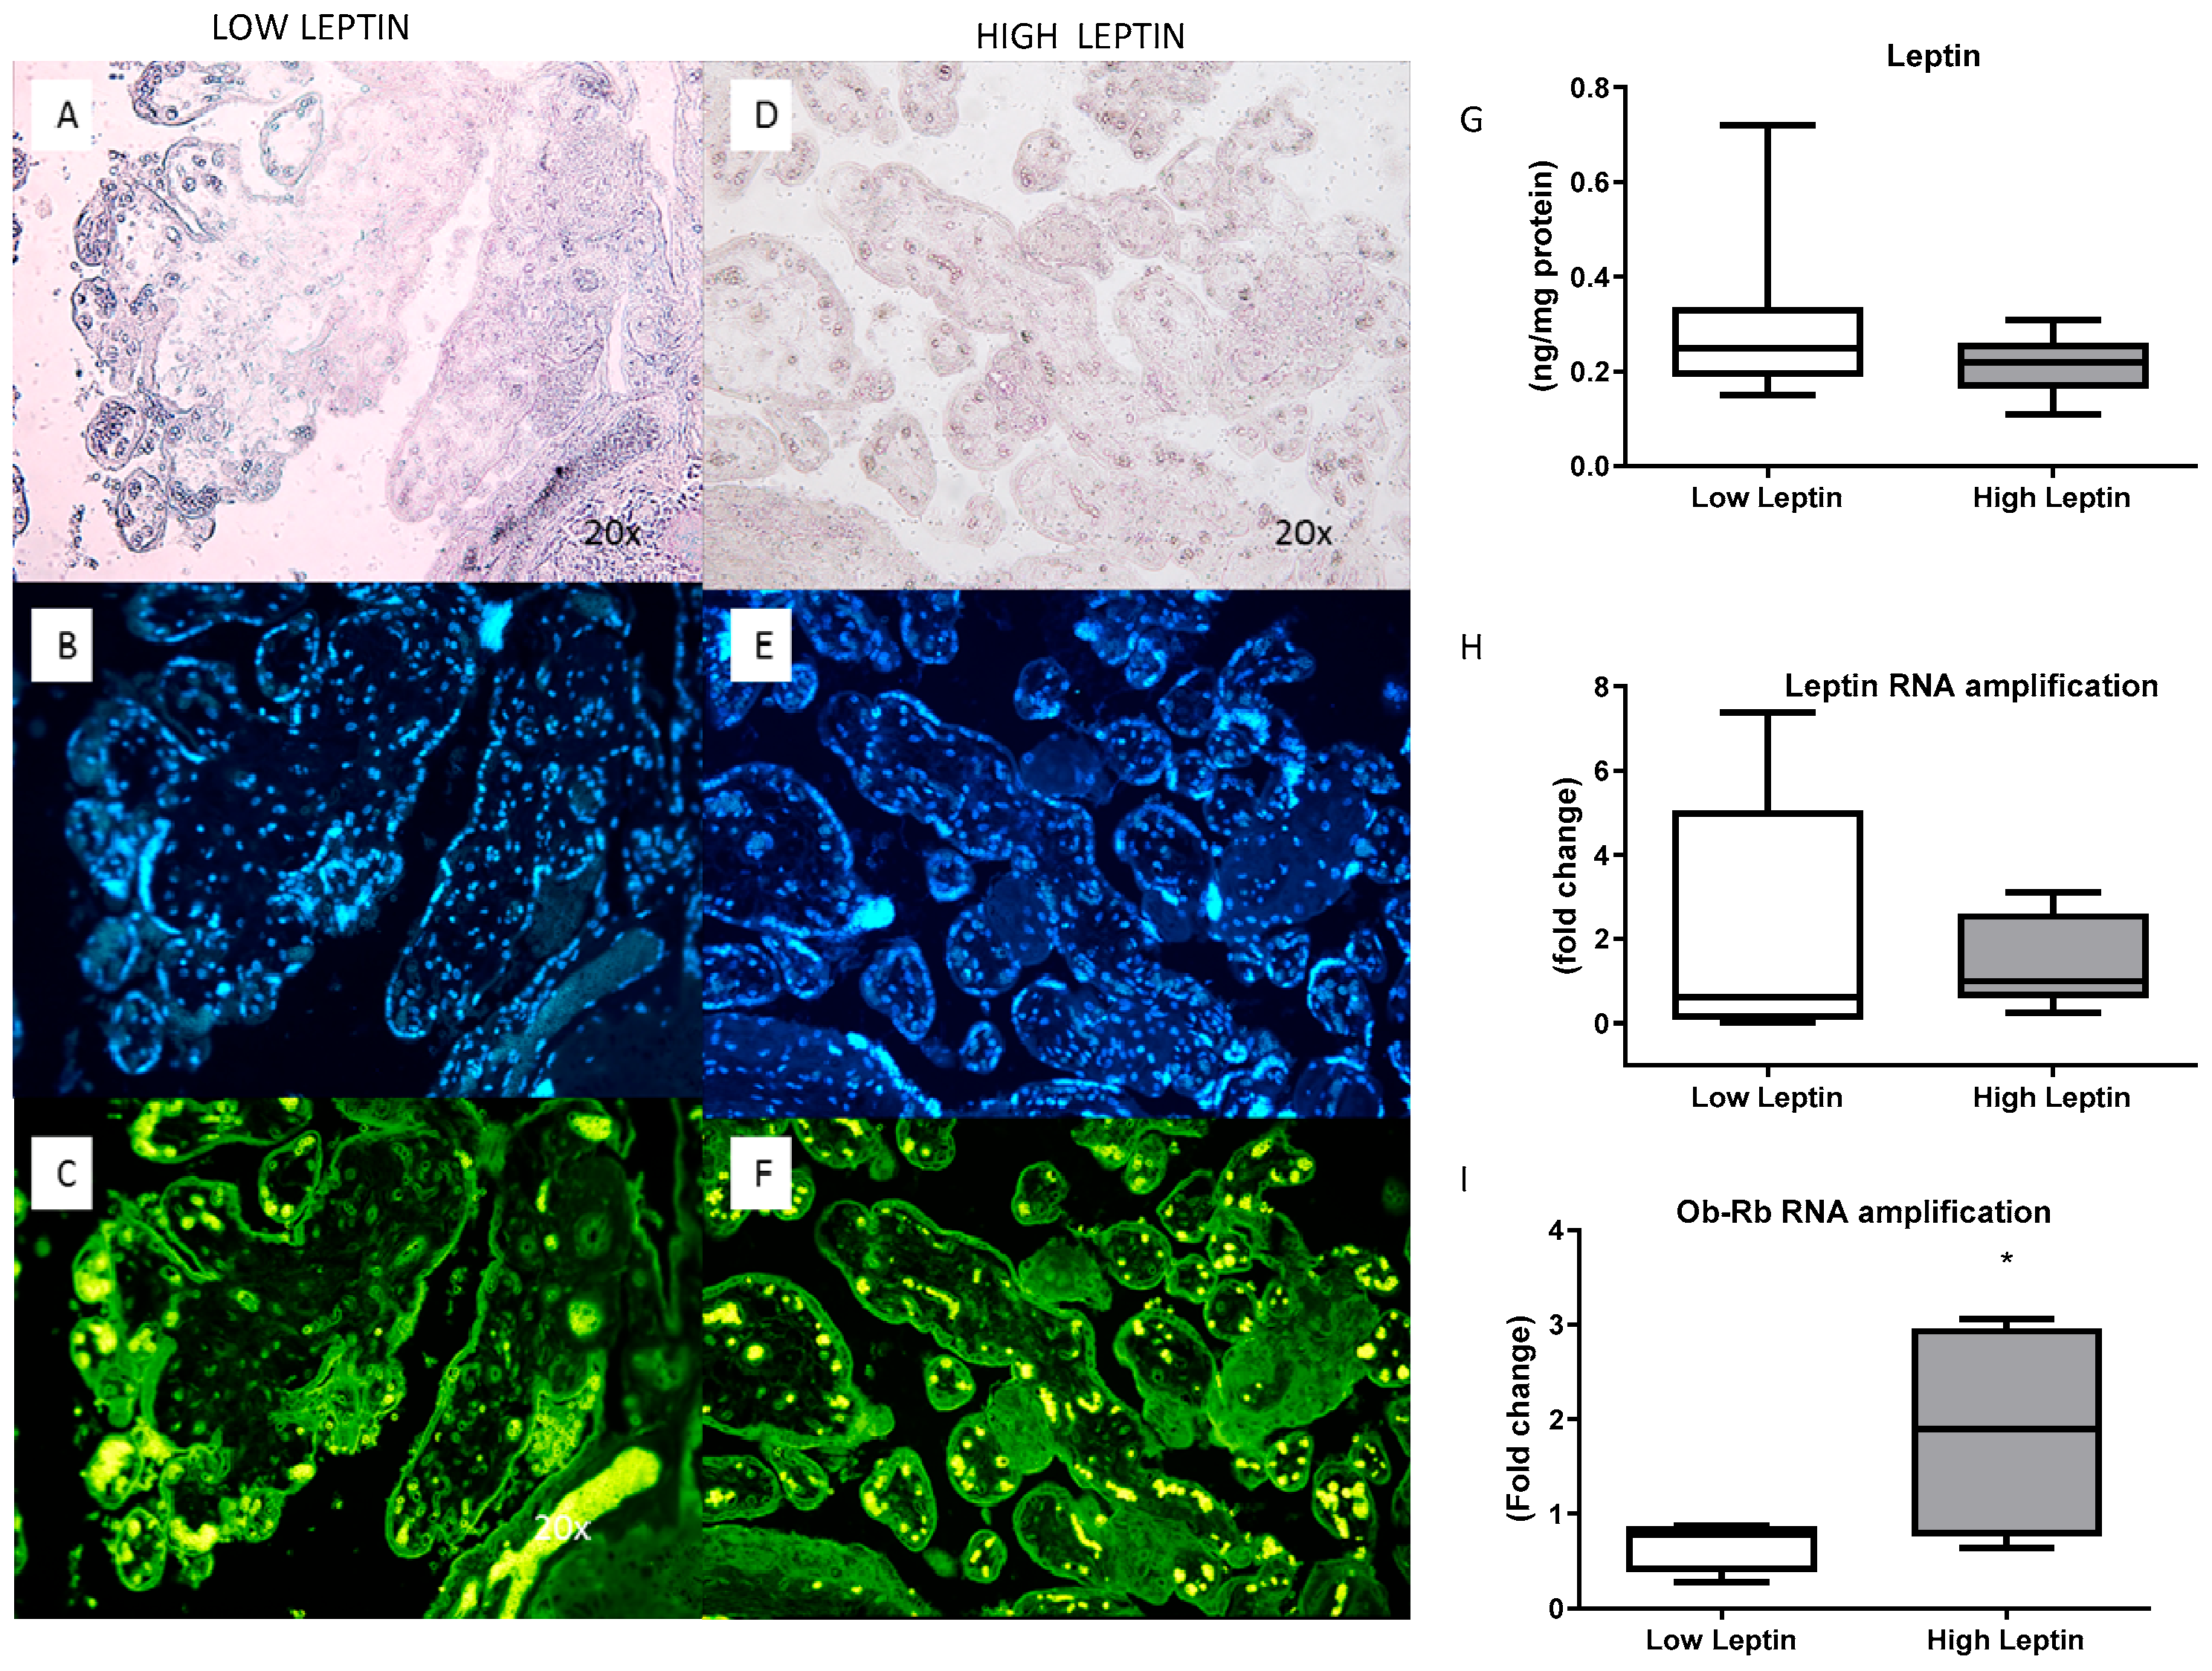
The expression and concentration of leptin and its receptor (ObRb) in the placenta were also evaluated. No significant differences were found in concentration and expression between the groups. The concentration and expression of leptin were similar between groups. However, the Ob-Rb expression was higher in the high-leptin group (
Figure 3).
Correlation analyses were performed considering leptin levels in cord blood, placenta, and maternal blood of parturients. In the high-leptin group, the pre-gestational body weight was positively correlated with leptin in the umbilical arteries and maternal leptinemia.
The results of correlation analysis showed that in the low-leptin group, placental leptin was associated with pre-gestational weight, BMI, and leptin expression. Maternal blood leptin did not show any association with the other analyzed sites. Nonetheless, in the high-leptin group, besides placental concentration, pre-gestational weight and BMI were also associated with leptin concentration in the maternal blood and umbilical arteries. Moreover, in this group, newborn body weight was positively associated, and Apgar was negatively associated with leptin concentration in the cord artery (
Table 4). This section may be divided by subheadings. It should provide a concise and precise description of the experimental results, their interpretation, and the experimental conclusions that can be drawn.
4. Discussion
Despite the diverse functions already described for leptin, its role during normal pregnancy is still being clarified. Most studies on leptin in pregnancy have focused on pre-eclampsia, gestational diabetes, or placental dysfunction. However, studies considering parturients without any gestational disorder, analyzing and correlating leptin concentrations in several tissues and its receptor in the placenta with some mother–newborn characteristics are scarce in the literature. Our study also analyzed pregnant women with high or low blood leptin levels separately, highlighting different repercussions on the newborn.
Leptin concentrations in our study were 20.5 ng/mL at delivery time, which were higher than those seen in non-pregnant eutrophic humans (about 16.5 ng/mL) [
13,
15]. Previous studies showed that plasma leptin increases 2–3 times in pregnant women compared to non-pregnant women. Leptin concentration can be up to 200% higher in the second and third trimesters than in the first trimester of pregnancy [
13,
16].
As expected, leptin concentrations in the umbilical vein are significantly higher compared with those in the umbilical artery, which indicates leptin retention by the fetus. These results are consistent with previous studies evaluating leptin in healthy pregnant women and those with gestational diabetes women. In both circumstances, leptin levels are lower in blood of umbilical arteries than in umbilical veins [
17,
18]. This retention by the fetus highlights the significant role that leptin plays during intrauterine life [
19].
The influence of leptin on body weight is well known. Here, we found a positive association between maternal leptinemia with pre-gestational BMI and maternal weight at the end of pregnancy. These findings are consistent with those previously published, analyzing a population similar to that recruited in the present study [
20,
21]. The authors found a consistent association between maternal blood leptin and pre-gestational and final BMI in women with uncomplicated pregnancy [
22]. Other studies also confirmed that weight and adiposity gain are important factors for increasing circulating leptin levels in women presenting gestational diabetes and pre-eclampsia [
19,
23,
24].
Although there are no reference values for leptin levels in the placenta, our results did not show a correlation between placental and blood leptin levels. This finding is consistent with previous data that did not find a correlation between leptin concentrations in maternal plasma and cord blood at birth [
24]. However, some studies showed that almost all placental leptin is released into the maternal bloodstream (about 90%) [
25,
26]. Nonetheless, considering all parturients, leptin synthesis in the placenta is correlated with its concentration in this tissue, confirming the local production of leptin, which is relevant to placenta function itself [
27,
28]
In our study, most of Apgar’s scores were in the normal range. Nonetheless, leptin levels in the umbilical vein blood negatively correlated with the Apgar score. Leptin levels have been associated with abnormalities in placenta function or delivery. Previous studies have shown that increases in leptin concentration interfered with the placenta’s adaptive capacity in the face of dietary restriction [
10,
20]. Collaborating with our results, Arslan et al. found that mothers of newborns with an Apgar score < 8 at 1 min had higher levels of leptinemia than newborns with an Apgar score > 8 [
29]. The reasons for this association are still unclear and may be due to conditions of intrauterine hypoxia that could lead to an overproduction of leptin by the placenta and worsen fetal conditions, which would be reflected in the Apgar scores [
30,
31].
Our data agree with other studies [
22,
32], but not all [
33], showing a correlation between maternal leptin levels and the weight or length of the newborn leptin. On the other hand, we found a strong association in the high-leptin group between newborn weight and vein cord leptin. Our findings are, once again, consistent with a previous study showing a positive correlation between leptin levels in umbilical blood and newborns’ weight [
34,
35], suggesting the role of leptin role in regulating fetal weight and growth.
In the high-leptin group, pregestational body weight was strongly associated with maternal leptin and leptin in the umbilical artery and placenta. This suggests an association between maternal weight and leptin in the maternal–fetal circulation. Thus, maternal weight (or adiposity) can directly or indirectly influence placental formation [
36] and leptin production in that organ. Moreover, a negative correlation was found between maternal leptin and placental expression of the leptin receptor. This suggests that, under conditions of high leptinemia, the placenta could regulate leptin entry by reducing its receptors in a mechanism of possible negative regulation or leptin resistance. Some studies have shown that leptin produced in the placenta is primarily released into the maternal circulation, and only a small fraction can reach the fetus under physiological conditions [
35,
36]. In this way, reducing leptin receptors could control leptin uptake in the placenta and increase maternal leptinemia, justifying this association.
Our results also evidenced an association between newborn weight and leptin in umbilical vein and arteries, Nonetheless, no association was found between newborn weight and maternal leptin. It suggests higher leptin traffic through newborn circulation that could influence fetal growth by a mechanism not explored in the present study. These findings are consistent with previous studies [
37,
38], showing a correlation between birth weight and leptin concentration in the umbilical vein but not maternal blood. Oktem et al. [
37] suggest that this lack of correlation indicates that these compartments may be non-communicating units or have different mechanisms of regulation or degradation of leptin and that maternal blood leptin may not have a direct effect on fetal growth but instead have a different role during pregnancy. Nonetheless, these differences in body weight disappeared a few months after birth, when environmental factors may override the intrauterine influence caused by the mother’s leptin metabolic status.
The limitations of this study are the limited number of pregnant women monitored, which reduced the sample power. There were also difficulties in monitoring in hospitals during the COVID-19 pandemic, which forced the interruption of the study and monitoring of newborns.
However, our study is relevant because, although several studies addressed the influence of leptin on pregnancy and the profile of the newborn, few of them have addressed all the parameters observed in this study, considering the different sites of leptin production and analyzing separately women with high and low leptin concentrations in maternal peripheral blood.
5. Conclusions
Taken together, our results suggest that elevated maternal leptin levels are associated with increased fetal leptin retention, which influences newborn weight and Apgar scores. Our results contribute to understanding the complex relationship between leptin and pregnancy outcomes. More research is needed to explore the underlying mechanisms of leptin and its potential clinical implications on maternal and fetal health.
Author Contributions
Conceptualization, M.-C.N.S.-C. and e.J.I.A.-L.; methodology, R.N.R., S.S.P. and L.G.T.; investigation, M.-C.N.S.-C. and R.N.R.; resources, e.J.I.A.-L.; writing—original draft preparation, D.G.M.F. and M.-C.N.S.-C.; writing—review and editing, e.J.I.A.-L.; supervision, e.J.I.A.-L. All authors have read and agreed to the published version of the manuscript.
Funding
This research was funded by CNPq (#310571/2020-0).
Institutional Review Board Statement
The study was conducted in accordance with the Declaration of Helsinki, and approved by the Ethics in Research Committee of the Federal University of Minas Gerais, Brazil (COEP/UFMG) number # ETIC 0650.0.203.000-10), by the Board of Education, Research and Extension of the Clinics Hospital of UFMG (Brazil), by the Functional Unit Gynecology, Obstetrics and Neonatology of HC/UFMG and by the Ethics Committee of Risoleta Tolentino Neves Hospital.
Informed Consent Statement
Written informed consent was obtained from all subjects/patients.
Data Availability Statement
The raw data supporting the conclusions of this article will be made available by the authors on request.
Conflicts of Interest
The authors declare no conflicts of interest.
References
- Zhang, Y.; Proenca, R.; Maffei, M.; Barone, M.; Leopold, L.; Friedman, J.M. Positional cloning of the mouse obese gene and its human homologue. Nature 1994, 372, 425–432. [Google Scholar] [CrossRef]
- Vilariño-García, T.; Polonio-González, M.; Pérez-Pérez, A.; Ribalta, J.; Arrieta, F.; Aguilar, M.; Obaya, J.; Gimeno-Orna, J.; Iglesias, P.; Navarro, J.; et al. Role of Leptin in Obesity, Cardiovascular Disease, and Type 2 Diabetes. Int. J. Mol. Sci. 2024, 25, 2338. [Google Scholar] [CrossRef] [PubMed]
- Adibi, J.J.; Zhao, Y.; Koistinen, H.; Mitchell, R.T.; Barrett, E.S.; Miller, R.; O’Connor, T.G.; Xun, X.; Liang, H.W.; Birru, R.; et al. Molecular pathways in placental-fetal development and disruption. Mol. Cell. Endocrinol. 2024, 581, 112075. [Google Scholar] [CrossRef] [PubMed]
- Kim, M.H.; Kim, H. Role of Leptin in the Digestive System. Front. Pharmacol. 2021, 12, 660040. [Google Scholar] [CrossRef] [PubMed]
- Gertler, A. Development of leptin antagonists and their potential use in experimental biology and medicine. Trends Endocrinol. Metab. 2006, 17, 372–378. [Google Scholar] [CrossRef] [PubMed]
- Katsiki, N.; Mikhailidis, D.P.; Banach, M. Leptin, cardiovascular diseases and type 2 diabetes mellitus. Acta Pharmacol. Sin. 2018, 39, 1176–1188. [Google Scholar] [CrossRef] [PubMed]
- Münzberg, H.; Morrison, C.D. Structure, production and signaling of leptin. Metabolism 2015, 64, 13–23. [Google Scholar] [CrossRef]
- Fan, X.; Yuan, W.; Huang, W.; Lin, Z. Recent progress in leptin signaling from a structural perspective and its implications for diseases. Biochimie 2023, 212, 60–75. [Google Scholar] [CrossRef]
- Zuccarello, D.; Sorrentino, U.; Brasson, V.; Marin, L.; Piccolo, C.; Capalbo, A.; Andrisani, A.; Cassina, M. Epigenetics of pregnancy: Looking beyond the DNA code. J. Assist. Reprod. Genet. 2022, 39, 801–816. [Google Scholar] [CrossRef]
- Pérez-Pérez, A.; Vilariño-García, T.; Guadix, P.; Dueñas, J.L.; Sánchez-Margalet, V. Leptin and nutrition in gestational diabetes. Nutrients 2020, 12, 1970. [Google Scholar] [CrossRef]
- Peng, J.; Yin, L.; Wang, X. Central and peripheral leptin resistance in obesity and improvements of exercise. Horm. Behav. 2021, 133, 105006. [Google Scholar] [CrossRef] [PubMed]
- Lowry, O.H.; Rosebrough, N.J.; Farr, A.L.; Randall, R.J. Protein measurement with the folin phenol reagent. J. Biol. Chem. 1951, 193, 265–275. [Google Scholar] [CrossRef]
- Peltokorpi, A.; Irina, L.; Liisa, V.; Risto, K. Preconceptual leptin levels in gestational diabetes and hypertensive pregnancy. Hypertens. Pregnancy 2022, 41, 70–77. [Google Scholar] [CrossRef] [PubMed]
- Ludy, M.J.; Moore, G.E.; Mattes, R.D. The Effects of Capsaicin and Capsiate on Energy Balance: Critical Review and Meta-analyses of Studies in Humans. Chem. Senses 2012, 37, 103–121. [Google Scholar] [CrossRef]
- Cheng, J.; Luo, Y.; Li, Y.; Zhang, F.; Zhang, X.; Zhou, X.; Ji, L. Sex- and body mass index-specific reference intervals for serum leptin: A population based study in China. Nutr. Metab. 2022, 19, 54. [Google Scholar] [CrossRef] [PubMed]
- Pahlavani, H.A.; Laher, I.; Weiss, K.; Knechtle, B.; Zouhal, H. Physical exercise for a healthy pregnancy: The role of placentokines and exerkines. J. Physiol. Sci. 2023, 73, 30. [Google Scholar] [CrossRef] [PubMed]
- Vitoratos, N.; Chrystodoulacos, G.; Salamalekis, E.; Kassanos, D.; Kouskouni, E.; Creatsas, G. Fetoplacental leptin levels and their relation to birth weight and insulin in gestational diabetic pregnant women. J. Obstet. Gynaecol. 2002, 22, 29–33. [Google Scholar] [CrossRef]
- Roca-Rodríguez, M.d.M.; Ramos-García, P.; López-Tinoco, C.; Aguilar-Diosdado, M. Significance of Umbilical Cord Leptin Profile during Pregnancy in Gestational Diabetes Mellitus-A Systematic Review and Meta-Analysis. J. Clin. Med. 2023, 12, 4756. [Google Scholar] [CrossRef]
- Guadix, P.; Corrales, I.; Vilariño-García, T.; Rodríguez-Chacón, C.; Sánchez-Jiménez, F.; Jiménez-Cortegana, C.; Dueñas, J.L.; Sánchez-Margalet, V.; Pérez-Pérez, A. Expression of nutrient transporters in placentas affected by gestational diabetes: Role of leptin. Front. Endocrinol. 2023, 14, 1172831. [Google Scholar] [CrossRef]
- Forhead, A.J.; Fowden, A.L. The hungry fetus? Role of leptin as a nutritional signal before birth. J. Physiol. 2009, 587, 1145–1152. [Google Scholar] [CrossRef]
- Maple-Brown, L.; Ye, C.; Hanley, A.J.; Connelly, P.W.; Sermer, M.; Zinman, B.; Retnakaran, R. Maternal pregravid weight is the primary determinant of serum leptin and its metabolic associations in pregnancy, irrespective of gestational glucose tolerance status. J. Clin. Endocrinol. Metab. 2012, 97, 4148–4155. [Google Scholar] [CrossRef] [PubMed]
- Obeidat, R.A.; Abdo, N.; Sakee, B.; Alghazo, S.; Jbarah, O.F.; Hazaimeh, E.A.; Albeitawi, S. Maternal and fetal serum leptin levels and their association with maternal and fetal variables and labor: A cross-sectional study. Ann. Med. Surg. 2021, 72, 103050. [Google Scholar] [CrossRef]
- Luo, Z.; Nuyt, A.; Delvin, E.; Fraser, W.D.; Julien, P.; Audibert, F.; Girard, I.; Shatenstein, B.; Deal, C.; Grenier, E.; et al. Maternal and fetal leptin, adiponectin levels and associations with fetal insulin sensitivity. Obesity 2013, 21, 210–216. [Google Scholar] [CrossRef] [PubMed]
- Zeng, S.; Liu, Y.; Fan, P.; Yang, L.; Liu, X. Role of leptin in the pathophysiology of preeclampsia. Placenta 2023, 142, 128–134. [Google Scholar] [CrossRef] [PubMed]
- Uzelac, P.S.; Li, X.; Lin, J.; Neese, L.D.; Lin, L.; Nakajima, S.T.; Bohler, H.; Lei, Z. Dysregulation of leptin and testosterone production and their receptor expression in the human placenta with gestational diabetes mellitus. Placenta 2010, 31, 581–588. [Google Scholar] [CrossRef]
- Linnemann, K.; Malek, A.; Sager, R.; Blum, W.F.; Schneider, H.; Fusch, C. Leptin production and release in the dually in vitro perfused human placenta. J. Clin. Endocrinol. Metab. 2000, 85, 4298–4301. [Google Scholar] [CrossRef] [PubMed][Green Version]
- Kochhar, P.; Manikandan, C.; Ravikumar, G.; Dwarkanath, P.; Sheela, C.N.; George, S.; Thomas, A.; Crasta, J.; Thomas, T.; Kurpad, A.V.; et al. Placental expression of leptin: Fetal sex-independent relation with human placental growth. Eur. J. Clin. Nutr. 2020, 74, 1603–1612. [Google Scholar] [CrossRef] [PubMed]
- Pérez-Pérez, A.; Toro, A.; Vilariño-García, T.; Maymó, J.; Guadix, P.; Dueñas, J.L.; Fernández-Sánchez, M.; Varone, C.; Sánchez-Margalet, V. Leptin action in normal and pathological pregnancies. J. Cell. Mol. Med. 2018, 22, 716–727. [Google Scholar] [CrossRef]
- Arslan, M.; Yazici, G.; Erdem, A.; Erdem, M.; Ozturk Arslan, E.; Himmetoglu, O. Endothelin 1 and leptin in the pathophysiology of intrauterine growth restriction. Int. J. Gynecol. Obstet. 2004, 84, 120–126. [Google Scholar] [CrossRef]
- Mise, H.; Sagawa, N.; Matsumoto, T.; Yura, S.; Nanno, H.; Itoh, H.; Mori, T.; Masuzaki, H.; Hosoda, K.; Ogawa, Y.; et al. Augmented placental production of leptin in preeclampsia: Possible involvement of placental hypoxia. J. Clin. Endocrinol. Metab. 1998, 83, 3225–3229. [Google Scholar] [CrossRef]
- Hagag, A.A.; El Frargy, M.S.; Abd El-Latif, A.E. Study of Cord Blood Erythropoietin, Leptin and Adiponectin Levels in Neonates with Hypoxic Ischemic Encephalopathy. Endocr. Metab. Immune Disord. Drug Targets 2020, 20, 213–220. [Google Scholar] [CrossRef] [PubMed]
- Stefaniak, M.; Dmoch-Gajzlerska, E.; Mazurkiewicz, B.; Gajzlerska-Majewska, W. Maternal serum and cord blood leptin concentrations at delivery. PLoS ONE 2019, 14, e0224863. [Google Scholar] [CrossRef]
- Fernandes, M.D.; Daher, S.; de Sousa, L.M.; Baratto, I.; Lobo, T.F.; Júnior, E.A.; Guazzelli, C.A.F. Blood level of adipokines and nutritional status variables in adolescent pregnancy. Obstet. Gynecol. Sci. 2020, 63, 683–689. [Google Scholar] [CrossRef] [PubMed]
- Han, L.; Li, B.; Xu, X.; Liu, S.; Li, Z.; Li, M.; Wang, D. Umbilical Cord Blood Adiponectin, Leptin, Insulin, and Ghrelin in Premature Infants and Their Association with Birth Outcomes. Front. Endocrinol. 2021, 12, 738964. [Google Scholar] [CrossRef] [PubMed]
- Fyfe, R.; Burton, A.; McLennan, A.; McCudden, L.; Gordon, A.; Hyett, J. Factors affecting cord blood leptin levels in a consecutive birth cohort. J. Matern. Fetal. Neonatal Med. 2022, 35, 884–889. [Google Scholar] [CrossRef] [PubMed]
- de Souza Lima, B.; Sanches, A.P.V.; Ferreira, M.S.; de Oliveira, J.L.; Cleal, J.K.; Ignacio-Souza, L. Maternal-placental axis and its impact on fetal outcomes, metabolism, and development. Biochim. Biophys. Acta. Mol. Basis Dis. 2024, 1870, 166855. [Google Scholar] [CrossRef] [PubMed]
- Öktem, Ö.; Dedeoǧlu, N.; Oymak, Y.; Sezen, D.; Köksal, L.; Pekin, T.; Gökaslan, H.; Kavak, Z.N. Maternal serum, amniotic fluid and cord leptin levels at term: Their correlations with fetal weight. J. Perinat. Med. 2004, 32, 266–271. [Google Scholar] [CrossRef]
- Papadopoulou, F.G.; Mamopoulos, A.M.; Triantos, A.; Constantinidis, T.C.; Papadimas, J.; Assimakopoulos, E.A.; Koliakos, G.; Mamopoulos, M. Leptin levels in maternal and cord serum: Relationship with fetal development and placental weight. J. Matern. Fetal. Med. 2000, 9, 298–302. [Google Scholar] [CrossRef]
Figure 1.
(A) Maternal Weight gain, (B) Delivery type, (C) Newborn weight, and (D) length in the first months of life. n = 15 and 10 for the Low and High-leptin groups, respectively. Results are expressed as mean (bars = standard error (vertical lines). ((A,B) Chi-square and (C,D) Student t-tests).
Figure 1.
(A) Maternal Weight gain, (B) Delivery type, (C) Newborn weight, and (D) length in the first months of life. n = 15 and 10 for the Low and High-leptin groups, respectively. Results are expressed as mean (bars = standard error (vertical lines). ((A,B) Chi-square and (C,D) Student t-tests).
Figure 2.
Leptinemia in umbilical cord blood: (A): Leptinemia in the umbilical vein (n = 15 for low leptinemia and n = 10 for high leptinemia), p = 0.016. (B): Leptinemia in the umbilical artery (n = 14 for low leptinemia and n = 6 for high leptinemia), p = 0.77. (C): Leptin retained by the fetus (venous leptinemia—arterial leptinemia) (n = 10 for low leptinemia and n = 5 for high leptinemia), p = 0.026. Box and whiskers (median min to max). t-test or Mann–Whitney test. * Statistically different (p < 0.05).
Figure 3.
Placental leptin. Immunofluorescence for leptin in the placenta: (A,C): low leptinemia group and (D,F) high leptinemia group. (A,D): light microscope imaging; (B,E): cell nucleus stained with DAPI.: (C,F): Leptin stained with Ob A-20 antibody, Santa Cruz, and Alexa fluor 546. (G): Leptin concentration in the placenta, measured by ELISA, in ng of leptin per mg of proteins (n = 12 for low leptinemia and n = 8 for high leptinemia), p = 0.25. (H): Leptin RNA expression in the placenta, measured by real-time PCR, in relative amplification (n = 12 for low leptinemia and n = 6 for high leptinemia), p = 0.27. (I): Leptin receptor mRNA (Ob-Rb) expression in the placenta, measured by real-time PCR, in relative amplification (n = 6 for low leptinemia and n = 4 for high leptinemia), * p = 0.05. Results are expressed as Box and whiskers (median min to max): t-test or Mann–Whitney test.
Table 1.
General characteristics of pregnant women and newborns.
Table 1.
General characteristics of pregnant women and newborns.
| Data | Mean | Se | Minmum | Maximum |
|---|
| Parturient data |
| BMI (kg/m2) | 22.47 | 0.62 | 16.7 | 29.5 |
| Age (years) | 28.7 | 1.3 | 18.0 | 44.0 |
| Gestational age (weeks) | 39.3 | 0.23 | 37.0 | 41.0 |
| Height (m) | 1.60 | 0.01 | 1.49 | 1.69 |
| Pre-pregnancy weight (kg) | 57.35 | 1.66 | 42.00 | 76.50 |
| Final weight (kg) | 70.18 | 1.70 | 51.00 | 91.30 |
| Weight gain (kg) | 12.83 | 0.59 | 7.20 | 21.50 |
| Weight gain without NB (kg) | 9.90 | 0.68 | 4.87 | 18.34 |
| % Gain (relative starting weight) | 22.89 | 1.30 | 13.33 | 39.45 |
| Maternal blood leptin (ng/mL) | 20.5 | 2.93 | 2.13 | 63.5 |
| Leptin umbilical vein (ng/mL) | 6.6 | 0.99 | 0.64 | 21.9 |
| Umbilical artery leptin (ng/mL) | 4.7 | 0.96 | 1.02 | 16.3 |
| Newborn data |
| Weight (kg) | 3.15 | 0.08 | 2.34 | 4.34 |
| Length (cm) | 45.9 | 0.44 | 34.0 | 51.5 |
| Apgar score (mean of 1 and 5 min) | 8.85 | 0.30 | 3.00 | 10.00 |
Table 2.
Statistically significant results of coefficient correlations (p < 0.05), according to leptin concentration on blood, cord vessels, and placenta.
Table 2.
Statistically significant results of coefficient correlations (p < 0.05), according to leptin concentration on blood, cord vessels, and placenta.
| Parameter | Leptin in
Maternal Blood | Leptin in
Cord Vein | Leptin in
Cord Artery | Leptin in
Placenta |
|---|
| Total Population | | | | |
| Pre-pregnancy weight | 0.469 | - | - | 0.325 |
| Final weight | 0.539 | - | - | - |
| Leptin vein | - | - | 0.726 | - |
| Artery leptin | - | 0.726 | - | - |
| Leptin expression | - | - | - | 0.905 |
| Apgar | - | −0.383 | - | - |
| Placental Leptin | - | - | - | - |
Table 3.
Characterization of parturients and newborns according to the leptinemia level.
Table 3.
Characterization of parturients and newborns according to the leptinemia level.
| Characteristics | Low Leptinemia | High Leptinemia | p-Value |
|---|
| Parturient data | | | |
| Number of pregnant women | 15 | 10 | |
| Leptinemia (ng/mL) | 10.97 ± 1.53 | 34.72 ± 3.79 | <0.001 |
| Age (years) | 24.67 ± 1.14 | 33.3 ± 2.09 | <0.001 |
| Pre-pregnancy weight (kg) | 54.42 ± 2.03 | 63.5 ± 3.0 | 0.015 |
| Pre-pregnancy BMI (kg/m2) | 20.88 ± 0.73 | 25.47 ± 1.0 | 0.001 |
| Weight at the end of pregnancy (kg) | 67.25 ± 2.06 | 76.88 ± 2.99 | 0.025 |
| Weight gain (kg) | 12.83 ± 0.89 | 13.35 ± 0.62 | 0.67 |
| Gestational age (weeks) | 39.1 ± 0.3 | 39.9 ± 0.3 | 0.13 |
| Systolic blood pressure (mmHg) | 116.8 ± 2.75 | 118.5 ± 4.94 | 0.75 |
| Diastolic blood pressure (mmHg) | 76.4 ± 2.48 | 77.0 ± 2.49 | 0.95 |
| Newborn data | | | |
| Gender (male/female) * | 7/8 | 3/7 | 0.41 |
| Weight (kg) # | 3.18 ± 1.13 | 3.08 ± 0.10 | 0.62 |
| Length (cm) # | 48.6 ± 0.6 | 48.8 ± 0.5 | 0.84 |
| Apgar | 9.4 ± 0.95 | 8.6 ± 0.41 | 0.038 |
Table 4.
Statistically significant correlation coefficients (p < 0.05) between leptin parameters in cord blood, placenta, and maternal blood of parturients with low and high leptinemia.
Table 4.
Statistically significant correlation coefficients (p < 0.05) between leptin parameters in cord blood, placenta, and maternal blood of parturients with low and high leptinemia.
| Parameter | Leptin in
Maternal Blood | Leptin in
Cord Vein | Leptin in
Cord Artery | Leptin in
Placenta |
|---|
| Low leptinemia | | | | |
| Pre-gestational weight | - | - | - | 0.581 |
| BMI | - | - | - | 0.523 |
| Leptin (vein) | - | | 0.572 | - |
| Leptin (artery) | - | 0.572 | | - |
| Leptin Expression | - | - | - | 0.963 |
| High Leptinemia | | | | |
| Pre-gestational weight | 0.612 & | - | 0.776 | 0.625 |
| BMI | 0.724 | - | 0.825 | 0.672 |
| Leptin (vein) | - | - | 0.759 | - |
| Leptin (artery) | - | 0.759 | - | - |
| ObRb Expression | −0.941 | - | - | - |
| Newborn weight | - | 0.637 | 0.788 | - |
| Apgar | - | −0.751 | - | - |
| Disclaimer/Publisher’s Note: The statements, opinions and data contained in all publications are solely those of the individual author(s) and contributor(s) and not of MDPI and/or the editor(s). MDPI and/or the editor(s) disclaim responsibility for any injury to people or property resulting from any ideas, methods, instructions or products referred to in the content. |
© 2024 by the authors. Licensee MDPI, Basel, Switzerland. This article is an open access article distributed under the terms and conditions of the Creative Commons Attribution (CC BY) license (https://creativecommons.org/licenses/by/4.0/).


 ,
, 


