

Metabolic Profile of Liver Transplant Recipients and Determinants of their Body Fat Distribution

 , , ,
, , ,  and
and
Abstract
:1. Introduction
2. Materials and Methods
2.1. Study Population
2.2. Data Collection
2.3. Metabolic Syndrome Diagnosis
- central obesity (WC ≥ 94 cm in males; ≥80 cm in females, BMI ≥ 30 kg/m2 in both sexes)
- triglycerides ≥ 150 mg/dL (1.7 mmol/L) or drug treatment for elevated triglycerides
- HDL cholesterol ≤ 40 mg/dL (1.0 mmol/L) in males; ≤50 mg/dL (1.3 mmol/L) in females, or specific treatment for this lipid abnormality
- systolic blood pressure ≥ 130 mmHg; diastolic blood pressure ≥ 85 mmHg, or hypotensive pharmacological treatment in a patient with a medical history of hypertension
- fasting glucose ≥ 100 mg/dL (5.5 mmol/L), or pharmacological management of previously diagnosed DM
2.4. Statistical Analysis
- 0.0 ≤ |r| ≤ 0.2—no correlation,
- 0.2 ≤ |r| ≤ 0.4—low correlation,
- 0.4 ≤ |r| ≤ 0.7—moderate correlation,
- 0.7 ≤ |r| ≤ 0.9—high correlation,
- 0.9 ≤ |r| ≤ 1.0—very high correlation.
3. Results
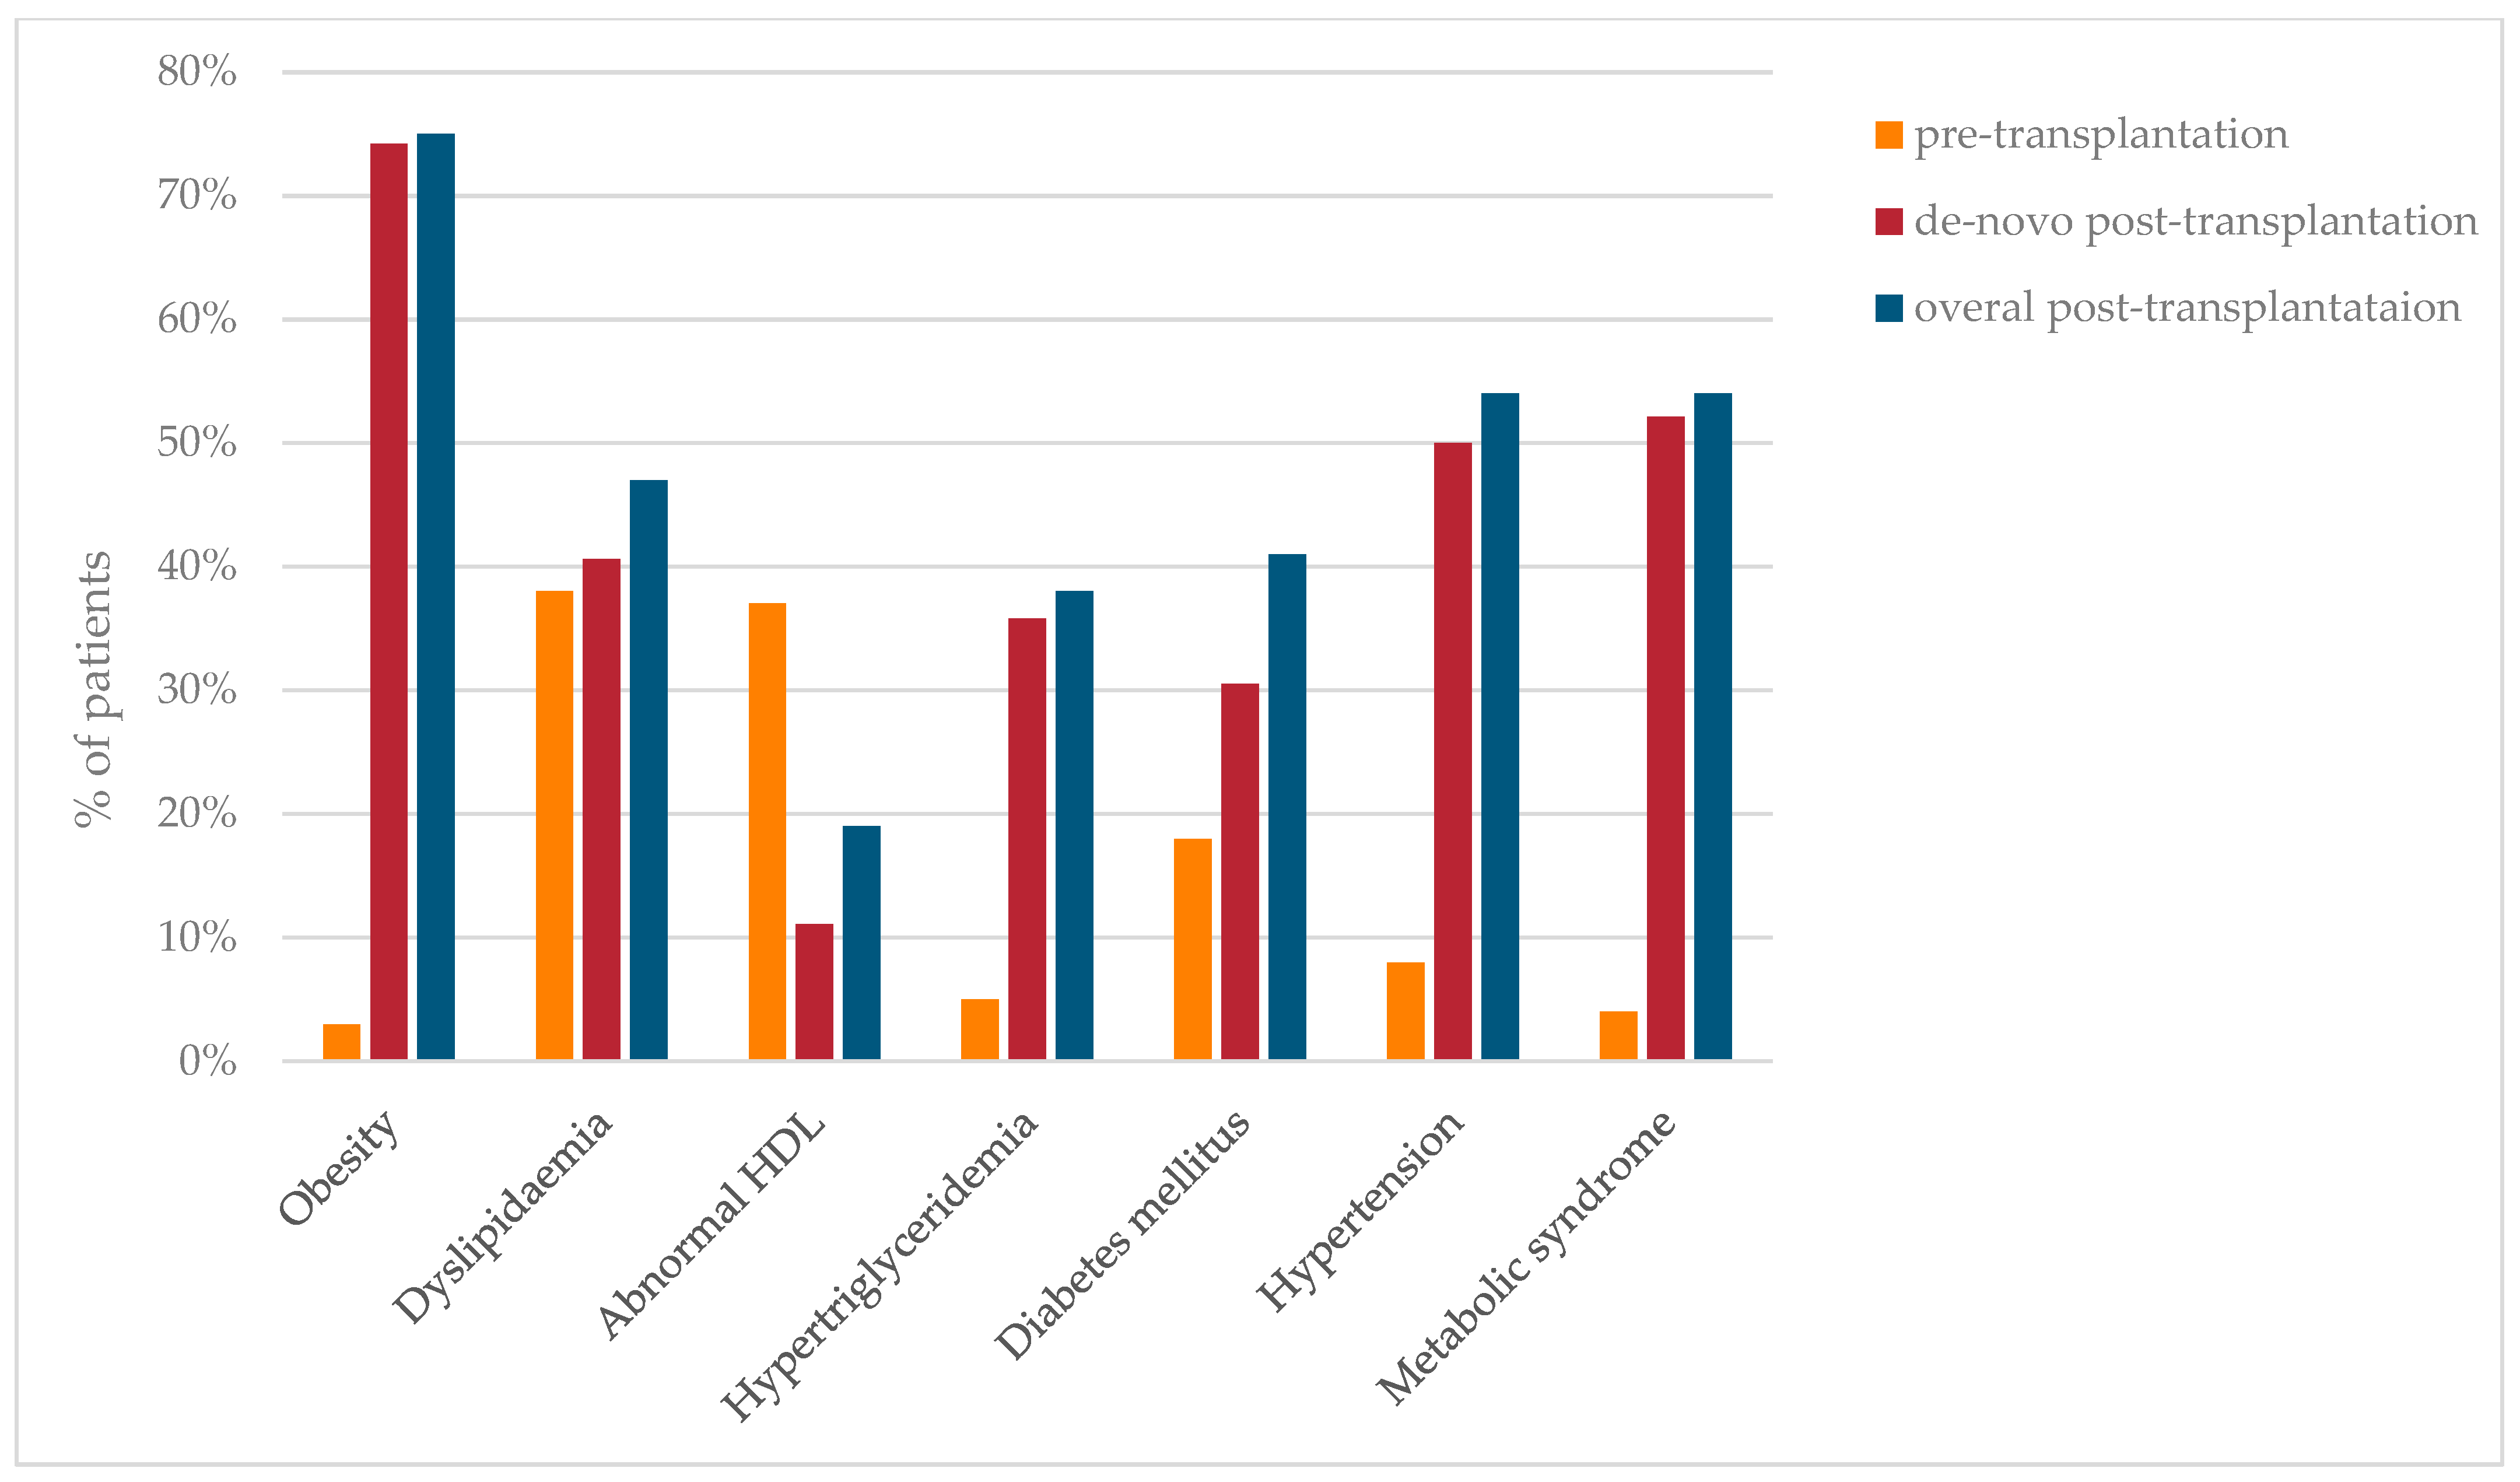
3.1. Prevalence of Metabolic Complications
3.2. Metabolic Syndrome—Risk Factors Supplemented with Comparative Analysis of Metabolic Profiles of Liver Recipients
3.3. Modelling
3.4. Metabolic Complications and Liver Donor Profiles
3.5. Abdominal Fat Distribution
4. Discussion
5. Conclusions
Author Contributions
Funding
Institutional Review Board Statement
Informed Consent Statement
Data Availability Statement
Conflicts of Interest
References
- Gami, A.S.; Witt, B.J.; Howard, D.E.; Erwin, P.J.; Gami, L.A.; Somers, V.K.; Montori, V.M. Metabolic Syndrome and Risk of Incident Cardiovascular Events and Death. J. Am. Coll. Cardiol. 2007, 49, 403–414. [Google Scholar] [CrossRef]
- Li, X.; Liang, Q.; Zhong, J.; Gan, L.; Zuo, L. The Effect of Metabolic Syndrome and Its Individual Components on Renal Function: A Meta-Analysis. J. Clin. Med. 2023, 12, 1614. [Google Scholar] [CrossRef]
- Mikolasevic, I.; Milic, S.; Orlic, L.; Stimac, D.; Franjic, N.; Targher, G. Factors associated with significant liver steatosis and fibrosis as assessed by transient elastography in patients with one or more components of the metabolic syndrome. J. Diabetes Complicat. 2016, 30, 1347–1353. [Google Scholar] [CrossRef]
- Esposito, K.; Chiodini, P.; Colao, A.; Lenzi, A.; Giugliano, D. Metabolic Syndrome and Risk of Cancer: A systemic review and meta-analysis. Diabetes Care 2012, 35, 2402–2411. [Google Scholar] [CrossRef]
- Noubiap, J.J.; Nansseu, J.R.; Lontchi-Yimagou, E.; Nkeck, J.R.; Nyaga, U.F.; Ngouo, A.T.; Tounouga, D.N.; Tianyi, F.L.; Foka, A.J.; Ndoadoumgue, A.L.; et al. Geographic distribution of metabolic syndrome and its components in the general adult population: A meta-analysis of global data from 28 million individuals. Diabetes Res. Clin. Pract. 2022, 188, 109924. [Google Scholar] [CrossRef]
- Wong, R.J.; Aguilar, M.; Cheung, R.; Perumpail, R.B.; Harrison, S.A.; Younossi, Z.M.; Ahmed, A. Nonalcoholic steatohepatitis is the second leading etiology of liver disease among adults awaiting liver transplantation in the United States. Gastroenterology 2015, 148, 547–555. [Google Scholar] [CrossRef]
- Watt, K.D.S.; Pedersen, R.A.; Kremers, W.K.; Heimbach, J.K.; Charlton, M.R. Evolution of Causes and Risk Factors for Mortality Post-Liver Transplant: Results of the NIDDK Long-Term Follow-Up Study. Am. J. Transpl. 2010, 10, 1420–1427. [Google Scholar] [CrossRef]
- Czarnecka, K.; Czarnecka, P.; Tronina, O.; Bączkowska, T.; Durlik, M. Multidirectional facets of obesity management in the metabolic syndrome population after liver transplantation. Immunity Inflamm. Dis. 2022, 10, 3–21. [Google Scholar] [CrossRef]
- Laish, I.; Braun, M.; Mor, E.; Sulkes, J.; Harif, Y.; Ben Ari, Z. Metabolic syndrome in liver transplant recipients: Prevalence, risk factors, and association with cardiovascular events. Liver Transpl. 2011, 17, 15–22. [Google Scholar] [CrossRef]
- Laryea, M.; Watt, K.D.; Molinari, M.; Walsh, M.J.; McAlister, V.C.; Marotta, P.J.; Nashan, B.; Peltekian, K.M. Metabolic syndrome in liver transplant recipients: Prevalence and association with major vascular events. Liver Transpl. 2007, 13, 1109–1114. [Google Scholar] [CrossRef]
- Fussner, L.A.; Heimbach, J.K.; Fan, C.; Dierkhising, R.; Coss, E.; Leise, M.D.; Watt, K.D. Cardiovascular disease after liver transplantation: When, What, and Who Is at Risk. Liver Transpl. 2015, 21, 889–896. [Google Scholar] [CrossRef]
- Pluta, W.; Dudzińska, W.; Lubkowska, A. Metabolic Obesity in People with Normal Body Weight (MONW)—Review of Diagnostic Criteria. Int. J. Environ. Res. Public Health 2022, 19, 624. [Google Scholar] [CrossRef]
- Walker, G.E.; Marzullo, P.; Ricotti, R.; Bona, G.; Prodam, F. The pathophysiology of abdominal adipose tissue depots in health and disease. Horm. Mol. Biol. Clin. Investig. 2014, 19, 57–74. [Google Scholar] [CrossRef]
- Shah, R.V.; Murthy, V.L.; Abbasi, S.A.; Blankstein, R.; Kwong, R.Y.; Goldfine, A.B.; Jerosch-Herold, M.; Lima, J.A.; Ding, J.; Allison, M.A. Visceral Adiposity and the Risk of Metabolic Syndrome Across Body Mass Index: The MESA study. JACC Cardiovasc. Imaging 2014, 7, 1221–1235. [Google Scholar] [CrossRef]
- Ibrahim, M.M. Subcutaneous and visceral adipose tissue: Structural and functional differences. Obes. Rev. 2010, 11, 11–18. [Google Scholar] [CrossRef]
- Bayes, H. Adiposopathy: Is “sick fat” a cardiovascular disease? J. Am. Coll. Cardiol. 2011, 57, 2461–2473. [Google Scholar] [CrossRef]
- Neeland, I.J.; Ayers, C.R.; Rohatgi, A.K.; Turer, A.T.; Berry, J.D.; Das, S.R.; Vega, G.L.; Khera, A.; McGuire, D.K.; Grundy, S.M.; et al. Associations of visceral and abdominal subcutaneous adipose tissue with markers of cardiac and metabolic risk in obese adults. Obesity 2013, 21, E439–E447. [Google Scholar] [CrossRef]
- Kwon, H.; Kim, D.; Kim, J.S. Body Fat Distribution and the Risk of Incident Metabolic Syndrome: A Longitudinal Cohort Study. Sci. Rep. 2017, 7, 10955. [Google Scholar] [CrossRef]
- Cnop, M.; Landchild, M.J.; Vidal, J.; Havel, P.J.; Knowles, N.G.; Carr, D.R.; Wang, F.; Hull, R.L.; Boyko, E.J.; Retzlaff, B.M.; et al. The Concurrent Accumulation of Intra-Abdominal and Subcutaneous Fat Explains the Association Between Insulin Resistance and Plasma Leptin Concentrations. Diabetes 2002, 51, 1005–1015. [Google Scholar] [CrossRef]
- Mongraw-Chaffin, M.L.; Allison, M.A.; Burke, G.L.; Criqui, M.H.; Matsushita, K.; Ouyang, P.; Shah, R.V.; Shay, C.M.; Anderson, C.A.M. CT-Derived Body Fat Distribution and Incident Cardiovascular Disease: The Multi-Ethnic Study of Atherosclerosis. J. Clin. Endocrinol. Metab. 2017, 102, 4173–4183. [Google Scholar] [CrossRef]
- Iwasaki, T.; Nakajima, A.; Yoneda, M.; Yamada, Y.; Mukasa, K.; Fujita, K.; Fujisawa, N.; Wada, K.; Terauchi, Y. Serum Ferritin Is Associated With Visceral Fat Area and Subcutaneous Fat Area. Diabetes Care 2005, 28, 2486–2491. [Google Scholar] [CrossRef]
- Abril-Ulloa, V.; Flores-Mateo, G.; Solà-Alberich, R.; Manuel-Y-Keenoy, B.; Arija, V. Ferritin levels and risk of metabolic syndrome: Meta-analysis of observational studies. BMC Public Health 2014, 14, 483. [Google Scholar] [CrossRef]
- Theik, N.W.Y.; Raji, O.E.; Shenwai, P.; Shah, R.; Kalluri, S.R.; Bhutta, T.H.; Hannoodee, H.; Al Khalili, M.; Khan, S. Relationship and Effects of Vitamin D on Metabolic Syndrome: A Systematic Review. Cureus 2021, 13, e17419. [Google Scholar] [CrossRef]
- Wang, L.; Zhang, T.; Liu, Y.; Tang, F.; Xue, F. Association of Serum Uric Acid with Metabolic Syndrome and Its Components: A Mendelian Randomization Analysis. BioMed Res. Int. 2020, 2020, 6238693. [Google Scholar] [CrossRef]
- Rospleszcz, S.; Dermyshi, D.; Müller-Peltzer, K.; Strauch, K.; Bamberg, F.; Peters, A. Association of serum uric acid with visceral, subcutaneous and hepatic fat quantified by magnetic resonance imaging. Sci. Rep. 2020, 10, 442. [Google Scholar] [CrossRef]
- United Network for Organ Sharing. Available online: http://unos.org/data/ (accessed on 27 December 2022).
- Global Observatory on Donation and Transplantatio. Available online: http://transplant-observatory.org (accessed on 27 December 2022).
- Orman, E.S.; Mayorga, M.E.; Wheeler, S.B.; Townsley, R.M.; Toro-Diaz, H.H.; Hayashi, P.H.; Barritt, A.S. Declining liver graft quality threatens the future of liver transplantation in the United States. Liver Transpl. 2015, 21, 1040–1050. [Google Scholar] [CrossRef]
- Peláez-Jaramillo, M.J.; Cárdenas-Mojica, A.A.; Gaete, P.V.; Mendivil, C.O. Post-Liver Transplantation Diabetes Mellitus: A Review of Relevance and Approach to Treatment. Diabetes Ther. 2018, 9, 521–543. [Google Scholar] [CrossRef]
- Toshima, T.; Yoshizumi, T.; Inokuchi, S.; Kosai-Fujimoto, Y.; Kurihara, T.; Yoshiya, S.; Mano, Y.; Takeishi, K.; Itoh, S.; Harada, N.; et al. Risk factors for the metabolic syndrome components of hypertension, diabetes mellitus, and dyslipidemia after living donor liver transplantation. HPB 2020, 22, 511–520. [Google Scholar] [CrossRef]
- Kuo, H.-T.; Sampaio, M.S.; Ye, X.; Reddy, P.; Martin, P.; Bunnapradist, S. Risk Factors for New-Onset Diabetes Mellitus in Adult Liver Transplant Recipients, an Analysis of the Organ Procurement and Transplant Network/United Network for Organ Sharing Database. Transplantation 2010, 89, 1134–1140. [Google Scholar] [CrossRef]
- Hartog, H.; May, C.J.; Corbett, C.; Phillips, A.; Tomlinson, J.W.; Mergental, H.; Isaac, J.; Bramhall, S.; Mirza, D.F.; Muiesan, P.; et al. Early occurrence of new-onset diabetes after transplantation is related to type of liver graft and warm ischaemic injury. Liver Int. 2015, 35, 1739–1747. [Google Scholar] [CrossRef]
- Ling, Q.; Xu, X.; Xie, H.; Wang, K.; Xiang, P.; Zhuang, R.; Shen, T.; Wu, J.; Wang, W.; Zheng, S. New-onset diabetes after liver transplantation: A national report from China Liver Transplant Registry. Liver Int. 2016, 36, 705–712. [Google Scholar] [CrossRef] [PubMed]
- Alberti, K.G.M.M.; Eckel, R.H.; Grundy, S.M.; Zimmet, P.Z.; Cleeman, J.I.; Donato, K.A.; Fruchart, J.C.; James, W.P.T.; Loria, C.M.; Smith, S.C., Jr. Harmonizing the metabolic syndrome: A joint interim statement of the international diabetes federation task force on epidemiology and prevention; National heart, lung, and blood institute; American heart association; World heart federation; International Atherosclerosis Society; and International Association for the Study of Obesity. Circulation 2009, 120, 1640–1645. [Google Scholar] [CrossRef] [PubMed]
- Bianchi, G.; Marchesini, G.; Marzocchi, R.; Pinna, A.D.; Zoli, M. Metabolic syndrome in liver transplantation: Relation to etiology and immunosuppression. Liver Transpl. 2008, 14, 1648–1654. [Google Scholar] [CrossRef] [PubMed]
- Bolesławska, I.; Błaszczyk-Bębenek, E.; Jagielski, P.; Jagielska, A.; Przysławski, J. Nutritional behaviors of women and men in Poland during confinement related to the SARS-CoV-2 epidemic. Sci. Rep. 2021, 11, 19984. [Google Scholar] [CrossRef]
- Thoefner, L.B.; Rostved, A.A.; Pommergaard, H.-C.; Rasmussen, A. Risk factors for metabolic syndrome after liver transplantation: A systematic review and meta-analysis. Transpl. Rev. 2018, 32, 69–77. [Google Scholar] [CrossRef]
- Suárez-Ortegón, M.F.; Ensaldo-Carrasco, E.; Shi, T.; McLachlan, S.; Fernández-Real, J.M.; Wild, S.H. Ferritin, metabolic syndrome and its components: A systematic review and meta-analysis. Atherosclerosis 2018, 275, 97–106. [Google Scholar] [CrossRef]
- Li, L.; Song, Q.; Yang, X. Lack of Associations between Elevated Serum Uric Acid and Components of Metabolic Syndrome Such as Hypertension, Dyslipidemia, and T2DM in Overweight and Obese Chinese Adults. J. Diabetes Res. 2019, 2019, 3175418. [Google Scholar] [CrossRef]
- Gonçalves, J.P.; Oliveira, A.; Severo, M.; Santos, A.C.; Lopes, C. Cross-sectional and longitudinal associations between serum uric acid and metabolic syndrome. Endocrine 2012, 41, 450–457. [Google Scholar] [CrossRef]
- Sui, X.; Church, T.S.; Meriwether, R.A.; Lobelo, F.; Blair, S.N. Uric acid and the development of metabolic syndrome in women and men. Metabolism 2008, 57, 845–852. [Google Scholar] [CrossRef]
- Terjimanian, M.N.; Harbaugh, C.M.; Hussain, A.; Olugbade, K.O.; Waits, S.A.; Wang, S.C.; Sonnenday, C.J.; Englesbe, M.J. Abdominal adiposity, body composition and survival after liver transplantation. Clin. Transpl. 2016, 30, 289–294. [Google Scholar] [CrossRef]
- Fox, C.S.; Massaro, J.M.; Hoffmann, U.; Pou, K.M.; Maurovich-Horvat, P.; Liu, C.-Y.; Vasan, R.S.; Murabito, J.M.; Meigs, J.B.; Cupples, L.A.; et al. Abdominal Visceral and Subcutaneous Adipose Tissue Compartments. Circulation 2007, 116, 39–48. [Google Scholar] [CrossRef] [PubMed]
- Liu, J.; Fox, C.S.; Hickson, D.A.; May, W.D.; Hairston, K.G.; Carr, J.J.; Taylor, H.A. Impact of Abdominal Visceral and Subcutaneous Adipose Tissue on Cardiometabolic Risk Factors: The Jackson Heart Study. J. Clin. Endocrinol. Metab. 2010, 95, 5419–5426. [Google Scholar] [CrossRef] [PubMed]
- Carr, D.B.; Utzschneider, K.M.; Hull, R.L.; Kodama, K.; Retzlaff, B.M.; Brunzell, J.D.; Shofer, J.B.; Fish, B.E.; Knopp, R.H.; Kahn, S.E. Intra-Abdominal Fat Is a Major Determinant of the National Cholesterol Education Program Adult Treatment Panel III Criteria for the Metabolic Syndrome. Diabetes 2004, 53, 2087–2094. [Google Scholar] [CrossRef] [PubMed]
- Kim, S.; Cho, B.; Lee, H.; Choi, K.; Hwang, S.S.; Kim, D.; Kim, K.; Kwon, H. Distribution of Abdominal Visceral and Subcutaneous Adipose Tissue and Metabolic Syndrome in a Korean Population. Diabetes Care 2011, 34, 504–506. [Google Scholar] [CrossRef] [PubMed]
- Sigit, F.S.; Tahapary, D.L.; Trompet, S.; Sartono, E.; van Dijk, K.W.; Rosendaal, F.R.; de Mutsert, R. The prevalence of metabolic syndrome and its association with body fat distribution in middle-aged individuals from Indonesia and the Netherlands: A cross-sectional analysis of two population-based studies. Diabetol. Metab. Syndr. 2020, 12, 2. [Google Scholar] [CrossRef]
- De Lorenzo, A.; Martinoli, R.; Vaia, F.; Di Renzo, L. Normal weight obese (NWO) women: An evaluation of a candidate new syndrome. Nutr. Metab. Cardiovasc. Dis. 2006, 16, 513–523. [Google Scholar] [CrossRef] [PubMed]
- Aung, K.; Lorenzo, C.; Hinojosa, M.A.; Haffner, S.M. Risk of Developing Diabetes and Cardiovascular Disease in Metabolically Unhealthy Normal-Weight and Metabolically Healthy Obese Individuals. J. Clin. Endocrinol. Metab. 2014, 99, 462–468. [Google Scholar] [CrossRef]
- Moini, M.; Schilsky, M.L.; Tichy, E. Review on immunosuppression in liver transplantation. World J. Hepatol. 2015, 7, 1355–1368. [Google Scholar] [CrossRef]
- Charlton, M.; Levitsky, J.; Aqel, B.; O’Grady, J.; Hemibach, J.; Rinella, M.; Fung, J.; Ghabril, M.; Thomason, R.; Burra, P.; et al. International Liver Transplantation Society Consensus Statement on Immunosuppression in Liver Transplant Recipients. Transplantation 2018, 102, 727–743. [Google Scholar] [CrossRef]
- Rezende Anastácio, L.; Garcia Ferreira, L.; Costa Liboredo, J.; de Sena Ribeiro, H.; Soares Lima, A.; Garcia Vilela, E.; Correia, M.I.T.D. Overweight, obesity and weight gain up to three years after liver transplantation. Nutr. Hosp. 2012, 27, 1351–1356. [Google Scholar] [CrossRef]
- Anastácio, L.R.; Diniz, K.G.; Ribeiro, H.S.; Ferreira, L.G.; Lima, A.S.; Correia, M.I.T.D.; Vilela, E.G. Prospective evaluation of metabolic syndrome and its components among long-term liver recipients. Liver Int. 2014, 34, 1094–1101. [Google Scholar] [CrossRef] [PubMed]
- Lattanzi, B.; D’Ambrosio, D.; Tavano, D.; Pitoni, D.; Mennini, G.; Ginanni Corradini, S.; Rossi, M.; Merli, M. Weight Gain and De Novo Metabolic Disorders after Liver Transplantation. Nutrients 2019, 11, 3015. [Google Scholar] [CrossRef] [PubMed]


| Variable | Overall (N = 100) |
|---|---|
| Male sex | 70% (n = 70) |
| Female sex | 30% (n = 30) |
| Age at examination (years) | |
| Mean (SD) | 54.21 (11.57) |
| Median (IQR) | 55.46 (45.62–62.77) |
| Range | 24.25–75.11 |
| Time from liver transplant (years) | |
| Mean (SD) | 7.07 (4.65) |
| Median (IQR) | 6.2 (3.81–9.84) |
| Range | 0.57–17.29 |
| Indication for liver transplantation (%) | |
| HCV | 43% (n = 43) |
| HBV | 12% (n = 12) |
| PSC, PBC, AIH | 21% (n = 21) |
| Other a | 24% (n = 24) |
| Previous HCC | 21% (n = 21) |
| Maintenance immunosuppression | |
| Monotherapy with TAC | 52% (n = 52) |
| Double therapy with TAC, MMF | 26% (n = 26) |
| Triple therapy with TAC, MMF, GSK | 17% (n = 17) |
| Double therapy with TAC, GSK | 4% (n = 4) |
| Double therapy with CSA, MMF | 1% (n = 1) |
| Use of steroids > 6 months | 21% (n = 21) |
| Immunosuppressive drugs | |
| TAC | 99% (n = 99) |
| MMF | 44% (n = 44) |
| GSK | 21% (n = 21) |
| CSA | 1% (n = 1) |
| Mean TAC serum concertation during last 6 months (ng/mL) | n = 99 |
| Mean (SD) | 5.93 (1.46) |
| Median (IQR) | 5.7 (4.82–6.94) |
| Range | 2.5–9.63 |
| Acute organ rejection episodes | 9% (n = 9) |
| Smoking | 11% (n = 11) |
| Alcohol consumption | 3% (n = 3) |
| Variable | Estimate | p-Value | OR | LCI | UCI |
|---|---|---|---|---|---|
| Male | 1.373 | 0.042 | 3.946 | 1.115 | 16.575 |
| Time from liver transplant (years) | −0.007 | 0.904 | 0.993 | 0.887 | 1.111 |
| Age at examination (years) | 0.117 | 0.001 | 1.124 | 1.055 | 1.218 |
| Maintenance immunosuppression | |||||
| Monotherapy with TAC | 1.361 | 0.268 | 3.900 | 0.426 | 85.703 |
| Triple therapy with TAC, MMF, GSK | −0.154 | 0.913 | 0.857 | 0.056 | 22.747 |
| Double therapy with TAC, MMF | 0.762 | 0.556 | 2.143 | 0.200 | 50.712 |
| Steroids use >6 months | −1.099 | 0.14 | 0.333 | 0.066 | 1.328 |
| Immunosuppressive drugs | |||||
| MMF | −0.916 | 0.129 | 0.400 | 0.117 | 1.278 |
| GSK | −1.099 | 0.14 | 0.333 | 0.066 | 1.328 |
| Etiology of liver disease | |||||
| HCV | 2.175 | 0.001 | 8.800 | 2.475 | 36.374 |
| HBV | −1.247 | 0.282 | 0.288 | 0.014 | 2.144 |
| PBC, PSC, AIH | −1.099 | 0.14 | 0.333 | 0.066 | 1.328 |
| Before the transplant | |||||
| BMI (kg/m2) | 0.110 | 0.291 | 1.116 | 0.914 | 1.385 |
| Fasting glucose (mg/dL) | 0.010 | 0.584 | 1.010 | 0.974 | 1.049 |
| HDL (mg/dL) | −0.043 | 0.06 | 0.958 | 0.911 | 0.997 |
| Triglycerides (mg/dL) | 0.011 | 0.344 | 1.011 | 0.989 | 1.035 |
| After the transplant | |||||
| BMI (kg/m2) | 0.201 | 0.024 | 1.222 | 1.044 | 1.485 |
| De novo obesity | 1.718 | 0.019 | 5.571 | 1.458 | 27.892 |
| De novo hypertension | 2.140 | 0.002 | 8.500 | 2.369 | 36.896 |
| De novo diabetes mellitus | 1.845 | 0.008 | 6.325 | 1.721 | 27.589 |
| Fasting glucose (mg/dL) | 0.051 | 0.009 | 1.053 | 1.019 | 1.103 |
| De novo dyslipidemia | 2.645 | <0.001 | 14.080 | 3.767 | 63.566 |
| HDL (mg/dL) | −0.020 | 0.227 | 0.980 | 0.947 | 1.011 |
| De novo abnormal HDL | 0.734 | 0.446 | 2.083 | 0.314 | 17.073 |
| Triglycerides (mg/dL) | 0.015 | 0.014 | 1.015 | 1.004 | 1.029 |
| De novo hypertriglyceridemia | 3.243 | <0.001 | 25.600 | 6.043 | 146.566 |
| Acute organ rejection | −1.247 | 0.282 | 0.288 | 0.014 | 2.144 |
| Uric acid (mg/dL) | 0.501 | 0.023 | 1.651 | 1.108 | 2.675 |
| Ferritin (ng/mL) | 0.028 | <0.001 | 1.029 | 1.015 | 1.047 |
| Vitamin D3 (U/L) | −0.055 | 0.039 | 0.947 | 0.894 | 0.992 |
| HBA1c (%) | 1.768 | 0.002 | 5.859 | 2.228 | 22.253 |
| HOMA-IR | 0.401 | 0.259 | 1.493 | 0.812 | 3.717 |
| Waist circumference (cm) | 0.071 | 0.009 | 1.074 | 1.022 | 1.140 |
| Hip circumference (cm) | 0.050 | 0.085 | 1.051 | 0.997 | 1.119 |
| WHR | 0.200 | 0.005 | 1.222 | 1.080 | 1.434 |
| VAT (cm2) | 0.012 | 0.021 | 1.012 | 1.003 | 1.024 |
| SAT (cm2) | 0.025 | 0.045 | 1.025 | 1.002 | 1.053 |
| FM (kg) | 0.055 | 0.122 | 1.056 | 0.992 | 1.142 |
| Variable | Estimate | OR | LCI | UCI | p-Value |
|---|---|---|---|---|---|
| Intercept | −16.775 | 0.000 | 0.000 | 0.000 | 0.005 |
| Ferritin (ng/mL) | 0.024 | 1.024 | 1.005 | 1.054 | 0.038 |
| HBA1c (%) | 2.193 | 8.962 | 2.188 | 84.545 | 0.013 |
| De novo hypertriglyceridemia | 3.331 | 27.957 | 2.626 | 752.121 | 0.014 |
| Variable | Overall (N = 100) |
|---|---|
| Male | 61% (n = 61) |
| Female | 39% (n = 39) |
| Donor age (years) | |
| Mean (SD) | 38.19 (12.87) |
| Median (IQR) | 37.7 (27–48.26) |
| Range | 14.15–65.44 |
| Donor weight (kg) | |
| Mean (SD) | 74.77 (11.74) |
| Median (IQR) | 75 (65–82.25) |
| Range | 45–105 |
| Donor BMI (kg/m2) | |
| Mean (SD) | 24.65 (3.1) |
| Median (IQR) | 23.88 (22.65–26.84) |
| Range | 18.73–34.68 |
| Donor WC (cm) | |
| Mean (SD) | 85.23 (9.75) |
| Median (IQR) | 83.5 (78–90) |
| Range | 66–112 |
| Donor Age (Years) | Donor Weight (kg) | Donor BMI (kg/m2) | Donor WC (cm) | |
|---|---|---|---|---|
| De novo obesity | 0.352 (<0.001) | 0.148 (0.149) | 0.244 (0.016) | 0.286 (0.005) |
| De novo hypertension | 0.064 (0.543) | 0.100 (0.345) | 0.169 (0.108) | 0.060 (0.568) |
| De novo diabetes mellitus | −0.068 (0.541) | 0.097 (0.386) | 0.115 (0.305) | 0.061 (0.586) |
| De novo dyslipidaemia | −0.034 (0.792) | −0.034 (0.789) | 0.045 (0.725) | −0.022 (0.863) |
| De novo abnormal HDL | −0.087 (0.498) | −0.004 (0.976) | −0.105 (0.415) | −0.141 (0.270) |
| De novo hypertriglyceridemia | 0.055 (0.598) | 0.016 (0.879) | 0.062 (0.549) | −0.002 (0.985) |
| De novo metabolic syndrome | 0.081 (0.431) | 0.124 (0.230) | 0.247 (0.015) | 0.215 (0.035) |
| Variable | De Novo Obesity | ||||
|---|---|---|---|---|---|
| Donor age (years) | n | 72 | 25 | test | p-value |
| Median (IQR) | 40.89 (30.82–50.81) | 27.04 (22.45–37.42) | Mann–Whitney U | <0.001 | |
| Donor body mass index (kg/m2) | n | 72 | 25 | test | p-value |
| Median (IQR) | 24.73 (22.85–27.21) | 23.45 (22.25–24.15) | Mann–Whitney U | 0.0246 | |
| Donor waist circumference (cm) | n | 72 | 25 | test | p-value |
| Median (IQR) | 85.5 (79.75–93.25) | 80 (77–84) | Mann–Whitney U | 0.01 | |
| Variable | De novo metabolic syndrome | ||||
| Donor body mass index (kg/m2) | n | 50 | 46 | test | p-value |
| Median (IQR) | 25.77 (22.85–27.7) | 23.5 (22.25–24.88) | Mann–Whitney U | 0.0236 | |
| Donor waist circumference (cm) | n | 50 | 46 | test | p-value |
| Median (IQR) | 87 (80–93) | 81.5 (78–85) | Mann–Whitney U | 0.0326 | |
| Variable | VAT (cm2) | SAT (cm2) |
|---|---|---|
| Age at examination (years) | 0.382 (<0.001) | 0.258 (0.010) |
| Before the transplant | ||
| BMI (kg/m2) | 0.447 (<0.001) | 0.221 (0.027) |
| Fasting glucose (mg/dL) | 0.095 (0.348) | −0.053 (0.599) |
| HDL (mg/dL) | −0.192 (0.056) | −0.056 (0.578) |
| Triglycerides (mg/dL) | −0.109 (0.282) | −0.045 (0.659) |
| After the transplant | ||
| BMI (kg/m2) | 0.856 (<0.001) | 0.612 (<0.001) |
| Fasting glucose (mg/dL) | 0.319 (0.001) | 0.192 (0.056) |
| HDL (mg/dL) | −0.167 (0.096) | −0.065 (0.520) |
| Triglycerides (mg/dL) | 0.273 (0.006) | 0.257 (0.010) |
| Uric acid (mg/dL) | 0.245 (0.014) | 0.109 (0.282) |
| Ferritin (ng/mL) | 0.586 (<0.001) | 0.465 (<0.001) |
| Insulin (mIU/mL) | 0.318 (0.001) | 0.245 (0.014) |
| HOMA-IR | 0.351 (<0.001) | 0.256 (0.010) |
| HBA1c (%) | 0.448 (<0.001) | 0.333 (<0.001) |
| Vitamin D3 (U/L) | −0.341 (<0.001) | −0.176 (0.080) |
| Waist circumference (cm) | 0.908 (<0.001) | 0.657 (<0.001) |
| Hip circumference (cm) | 0.840 (<0.001) | 0.549 (<0.001) |
| WHR | 0.561 (<0.001) | 0.488 (<0.001) |
| FM (kg) | 0.784 (<0.001) | 0.610 (<0.001) |
| Mean tacrolimus serum concentration during last 6 months | 0.070 (0.493) | 0.033 (0.749) |
| Time of follow-up (years) | −0.065 (0.519) | 0.033 (0.745) |
| Variable | VAT cm2 | SAT cm2 | |||
|---|---|---|---|---|---|
| Median (IQR) | p-Value | Median (IQR) | p-Value | ||
| Pre-Ltx DM | Yes (n = 18) | 153.5 (117.78–214) | 0.0283 | 74 (67–99.5) | 0.8365 |
| No (n = 82) | 122 (73.25–186.5) | 82 (61.5–99) | |||
| Pre-Ltx MS | Yes (n = 4) | 225.5 (189.5–264) | 0.0312 | 101 (83.5–121.25) | 0.2148 |
| No (n = 96) | 122.5 (79.5–187.25) | 80 (63.75–99) | |||
| HCV | Yes (n = 43) | 144 (119.5–214) | 0.0021 | 90 (73–102) | 0.0023 |
| No (n = 57) | 110 (72–169) | 74 (53–90) | |||
| De novo obesity | Yes (n = 72) | 144 (117–206.5) | <0.001 | 86.5 (72–101) | <0.001 |
| No (n = 25) | 67 (45–78) | 52 (44–75) | |||
| De novo hypertension | Yes (n = 46) | 136.5 (109.25–202.25) | 0.0202 | 90 (72–101) | 0.0367 |
| No (n = 46) | 108 (72.25–145.5) | 76.5 (55.75–90) | |||
| De novo dyslipidaemia | Yes (n = 26) | 142 (109.5–194.5) | 0.0482 | 84 (73.5–101) | 0.0601 |
| No (n = 38) | 111.5 (60.25–148.5) | 77.5 (60.25–94.75) | |||
| De novo hypertriglyceridemia | Yes (n = 34) | 172.5 (122.5–222.5) | <0.001 | 90 (76.5–101.75) | 0.0035 |
| No (n = 61) | 116 (67–146) | 74 (58–95) | |||
| De novo MS | Yes (n = 50) | 147 (119.25–211.25) | <0.001 | 90 (73–101) | <0.001 |
| No (n = 46) | 91.5 (53.25–136.75) | 72.48 (30.14) | |||
| Variable | Estimate | LCI | UCI | p-Value |
|---|---|---|---|---|
| Intercept | −312.125 | −354.691 | −269.559 | <0.001 |
| Waist circumference (cm) | 2.901 | 1.882 | 3.920 | <0.001 |
| Post-Ltx BMI (kg/m2) | 6.472 | 3.279 | 9.665 | <0.001 |
| HOMA-IR | 5.057 | −1.261 | 11.376 | 0.114 |
| HBV | −14.958 | −34.881 | 4.965 | 0.137 |
| Variable | Estimate | LCI | UCI | p-Value |
|---|---|---|---|---|
| Intercept | −51.596 | −91.221 | −11.970 | 0.012 |
| Waist circumference (cm) | 1.354 | 0.938 | 1.770 | <0.001 |
| Time from liver transplantation (years) | 0.898 | −0.186 | 1.982 | 0.102 |
Disclaimer/Publisher’s Note: The statements, opinions and data contained in all publications are solely those of the individual author(s) and contributor(s) and not of MDPI and/or the editor(s). MDPI and/or the editor(s) disclaim responsibility for any injury to people or property resulting from any ideas, methods, instructions or products referred to in the content. |
© 2023 by the authors. Licensee MDPI, Basel, Switzerland. This article is an open access article distributed under the terms and conditions of the Creative Commons Attribution (CC BY) license (https://creativecommons.org/licenses/by/4.0/).
Share and Cite
Czarnecka, K.; Czarnecka, P.; Tronina, O.; Bączkowska, T.; Jagielska, A.; Durlik, M. Metabolic Profile of Liver Transplant Recipients and Determinants of their Body Fat Distribution. Obesities 2023, 3, 225-242. https://doi.org/10.3390/obesities3030019
Czarnecka K, Czarnecka P, Tronina O, Bączkowska T, Jagielska A, Durlik M. Metabolic Profile of Liver Transplant Recipients and Determinants of their Body Fat Distribution. Obesities. 2023; 3(3):225-242. https://doi.org/10.3390/obesities3030019
Chicago/Turabian StyleCzarnecka, Kinga, Paulina Czarnecka, Olga Tronina, Teresa Bączkowska, Anna Jagielska, and Magdalena Durlik. 2023. "Metabolic Profile of Liver Transplant Recipients and Determinants of their Body Fat Distribution" Obesities 3, no. 3: 225-242. https://doi.org/10.3390/obesities3030019
APA StyleCzarnecka, K., Czarnecka, P., Tronina, O., Bączkowska, T., Jagielska, A., & Durlik, M. (2023). Metabolic Profile of Liver Transplant Recipients and Determinants of their Body Fat Distribution. Obesities, 3(3), 225-242. https://doi.org/10.3390/obesities3030019