Article

The Northern Tunisian Hydrogen Nerve: Unlocking 3 GW of Green Energy for Europe

1
Department of Mechanical Engineering, Ecole Polytechnique de Tunisie, La Marsa 2078, Tunisia
2
Department of Mechanical Engineering, University of Houston, Houston, TX 77204, USA
3
Department of Mechanical Engineering, Ecole Nationale d’Ingenieurs de Sfax, Sfax 3038, Tunisia
*
Author to whom correspondence should be addressed.
Hydrogen 2026, 7(3), 91; https://doi.org/10.3390/hydrogen7030091
Submission received: 12 May 2026 / Revised: 17 June 2026 / Accepted: 30 June 2026 / Published: 6 July 2026

Abstract

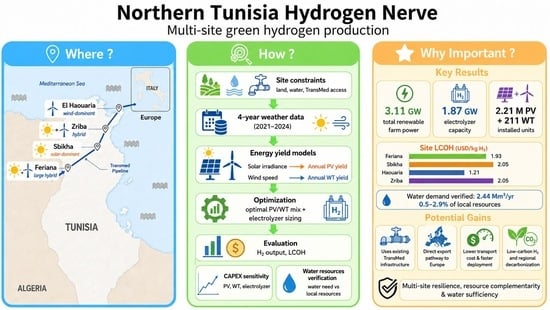
This paper evaluates the potential for green hydrogen production in Tunisia using nearly 3 GW of renewable electricity distributed across four strategically selected sites: Haouaria, Zriba, Sbikha, and Feriana. These locations were chosen for their proximity to the Trans-Mediterranean (TransMed) natural gas pipeline linking Algeria to Italy, as well as their strong but underexploited solar and wind energy resources. Each site was optimized according to land availability and renewable energy potential: Haouaria is wind-dominant, Zriba employs a hybrid solar-wind configuration, Sbikha focuses on solar, and Feriana integrates both solar and wind over a large area. The analysis reveals a total green hydrogen production capacity supported by approximately 3.1 GW of installed renewable power, with a base-case LCOH ranging from $1.21 to $2.05 per kilogram. El Haouaria emerges as the most cost-effective site due to its highly favorable wind conditions, while the sensitivity analysis shows that LCOH can reach up to approximately $3.8 per kilogram under higher CAPEX assumptions. The findings underscore the viability of a multi-site development strategy and highlight northern Tunisia’s comparative advantage for low-cost green hydrogen production, thanks to its superior resource mix, existing infrastructure, and better water availability relative to Tunisia’s southern regions.

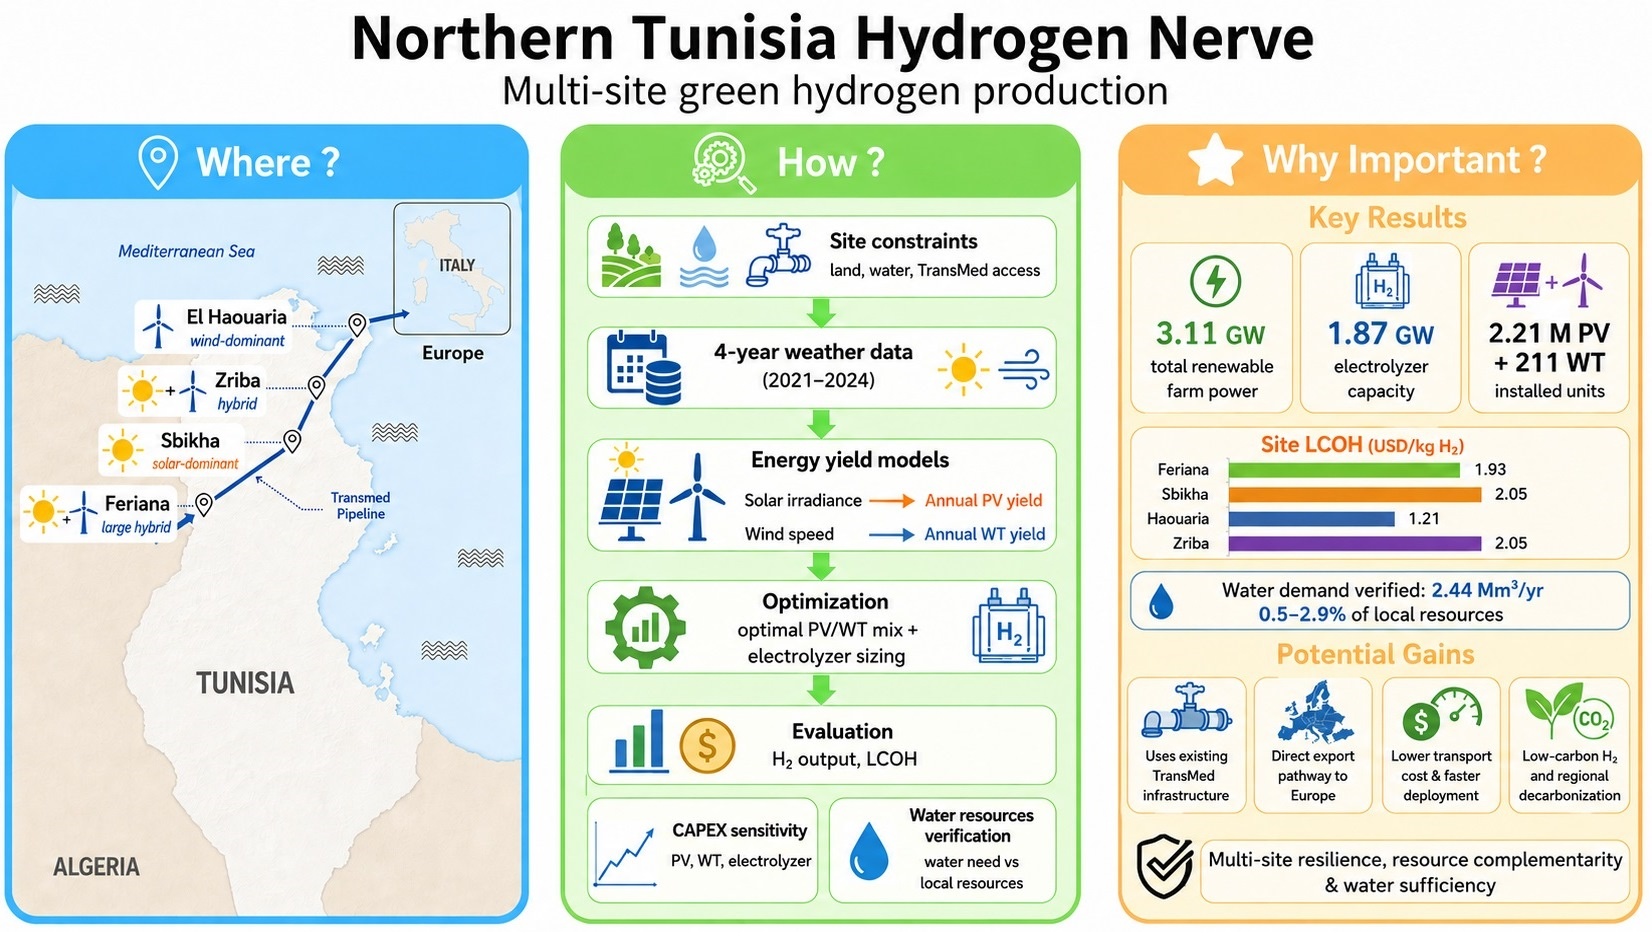
Graphical Abstract

1. Introduction

Green hydrogen has rapidly emerged as a cornerstone of global efforts to decarbonize energy systems, gaining strong momentum in recent years. According to the IEA’s Global Hydrogen Review 2024, plans for low-carbon hydrogen capacity, including green hydrogen, have tripled over the past three years, with over 440 GW in the project pipelines compared with less than 150 GW in 2021. Yet, by 2030, only a fraction (approximately 75%) of this pipeline is expected to materialize due to cost and infrastructure barriers [1]. Despite this implementation gap, green hydrogen remains central to decarbonization frameworks: a 2024 systematic review reports exponential growth in research and technology deployment since 2016, with green hydrogen identified as essential for achieving net-zero targets, particularly in hard-to-electrify sectors such as heavy industry and long-distance transport [2]. The Hydrogen Council projected in 2017 that hydrogen could meet up to 18% of global final energy demand by 2050, potentially avoiding 6 gigatonnes of CO2 emissions annually and generating a market worth 2.5 US trillion $ while supporting 30 million jobs [3].
In this regard, green hydrogen refers to hydrogen gas produced through the electrolysis of water using electricity sourced entirely from renewable energies such as solar, wind, or hydropower. Unlike grey hydrogen, which is derived from fossil fuels and emits significant CO2, or blue hydrogen, which captures some emissions, green hydrogen results in near-zero carbon emissions across its production chain [4,5]. Its production relies on water electrolysis, a process that electrically splits water molecules (H2O) into hydrogen and oxygen via two coupled electrochemical half-reactions. At the cathode, the hydrogen evolution reaction (HER) reduces protons to form H2, while at the anode, the oxygen evolution reaction (OER) oxidizes water to form O2. These reactions require a minimum thermodynamic voltage of 1.23 V, though practical systems typically operate between 1.6 V and 2.2 V to compensate for kinetic overpotentials and resistive losses [6].
Storage and distribution are important value-chain considerations beyond hydrogen production. Hydrogen can be stored in high-pressure tanks, cryogenic vessels, or underground formations, and poorly optimized storage can contribute up to 20% of total life-cycle emissions [2]. Although this study focuses on production and LCOH, downstream storage, transport, and end-use requirements remain relevant to the overall scalability of green hydrogen systems [3,7]. While hydrogen production via electrolysis has advanced considerably in terms of technical efficiency and cost reduction, significant challenges persist beyond the point of production. Chief among these is the absence of a dedicated infrastructure capable of supporting large-scale hydrogen storage, transport, and distribution. According to IEA, the vast majority of existing energy infrastructure: pipelines, ports, and storage facilities, was designed for fossil-based gases and liquids, and is not compatible with hydrogen’s specific physical properties, such as its low volumetric energy density and high diffusivity [7]. Retrofitting or replacing this infrastructure represents a major capital investment. In addition, compression, liquefaction, and reconversion steps introduce substantial energy penalties. Liquefying hydrogen, for instance, can consume up to 30–40% of its energy content [8], while chemical carriers like ammonia or Liquid Organic Hydrogen Carriers (LOHCs) require both synthesis and cracking units at origin and destination, increasing complexity and cost [2]. Safety regulations, permitting, and public acceptance also present non-trivial barriers, especially for urban storage and high-pressure transport [7]. As noted by the Hydrogen Council, creating a fully integrated hydrogen economy will require coordinated deployment across the entire value chain, from electrolyzers and renewables to pipelines, fueling stations, and industrial retrofits [3]. Without such systemic readiness, hydrogen risks remaining an isolated energy carrier, technically feasible but economically uncompetitive.
These challenges underscore a critical point: while hydrogen technologies are advancing rapidly, their successful deployment hinges on context-specific infrastructure, resource availability, and economic integration. In this regard, the Middle East and North Africa (MENA) region stands out as a compelling candidate for green hydrogen leadership. With some of the highest solar irradiance levels and promising wind corridors globally, MENA countries are uniquely positioned to produce low-cost green hydrogen at scale [9,10]. The region also benefits from vast unpopulated land, access to seawater for electrolysis, and geographic proximity to high-demand markets in Europe and Asia, making it well-suited for both domestic development and export-oriented projects. According to Gado et al., optimized hybrid PV-wind systems in selected MENA zones could yield an LCOH below 2 EUR/kg, which is highly competitive with current grey hydrogen benchmarks [10]. Within this broader regional landscape, Tunisia emerges as a particularly promising case. Spatial suitability assessments have shown that the country’s terrain is almost entirely favorable for green hydrogen development, and national strategy documents reflect a growing commitment to leveraging this advantage [11]. Tunisia has set ambitious long-term targets, including six million tonnes of green hydrogen for export by 2050 and the establishment of hydrogen valleys in the southern desert regions [12]. These developments, supported by bilateral cooperation with EU partners, position Tunisia not only as a contributor to the MENA green hydrogen momentum but also as a potential North African hub in the global hydrogen supply chain.
Building on this national momentum, the present research investigates the feasibility of a 3 GW green hydrogen production system in Tunisia through a multi-site framework that combines renewable resource assessment, land availability, technology sizing, and export-oriented infrastructure planning. Although previous studies have examined green hydrogen potential in the MENA region, their focus has mainly been on resource availability, production cost, or spatial suitability. For example, Gado et al. assessed the potential of hybrid PV-wind systems for low-cost hydrogen production across the MENA region, while Pinto et al. provided a GIS-based suitability mapping for green hydrogen production in Tunisia [10,11]. However, these studies do not explicitly address how the produced hydrogen can be connected to existing export infrastructure, which remains a critical issue for large-scale deployment.
This gap is particularly relevant in Tunisia, where national plans generally emphasize hydrogen production in the southern desert regions due to their high solar potential, while the transport of hydrogen toward European markets remains a major logistical challenge. In this context, the present study proposes an infrastructure-oriented approach by selecting four regions located along the TRANSMED natural gas pipeline corridor: Feriana, Sbikha, Zriba, and El Haouaria. These sites are not selected solely based on solar and wind potential, but also based on their geographic alignment with an existing cross-border pipeline that connects Algeria to Italy through Tunisia. By considering the possibility of hydrogen blending into this infrastructure, the study links production potential with a realistic export pathway.
The main novelty of this work is therefore the integration of site-specific techno-economic optimization with existing pipeline infrastructure for green hydrogen export from Tunisia. Each selected region is analyzed using local meteorological data, land availability, and renewable resource complementarity. A constraint programming optimization framework is then used to determine the allocation of photovoltaic panels, wind turbines, and electrolyzers under spatial constraints. For each site, the model estimates the hydrogen production potential, the most cost-effective solar-to-wind energy ratio, and the corresponding levelized cost of hydrogen. Unlike single-site studies or resource-only assessments, this framework evaluates a coordinated multi-node hydrogen production system based on both renewable energy potential and infrastructure accessibility. This makes the study distinct from previous work, as the combination of multi-site techno-economic optimization and TRANSMED pipeline integration has not been addressed before for green hydrogen production in Tunisia.

2. Materials and Methods

This section presents the materials, datasets, and computational procedures used to assess green hydrogen production across the four selected Tunisian sites. First, the study locations are described, along with the key site-specific inputs considered, including available land, access to water resources, and proximity to the TRANSMED pipeline. This is followed by the methodology, detailing the analytical workflow, which is used to estimate site-specific solar and wind energy yields from historical meteorological data and optimize the PV–wind configuration and electrolyzer sizing under land and cost constraints to compute the hydrogen output and the resulting LCOH.

2.1. Overview of the Four Hydrogen Production Stations

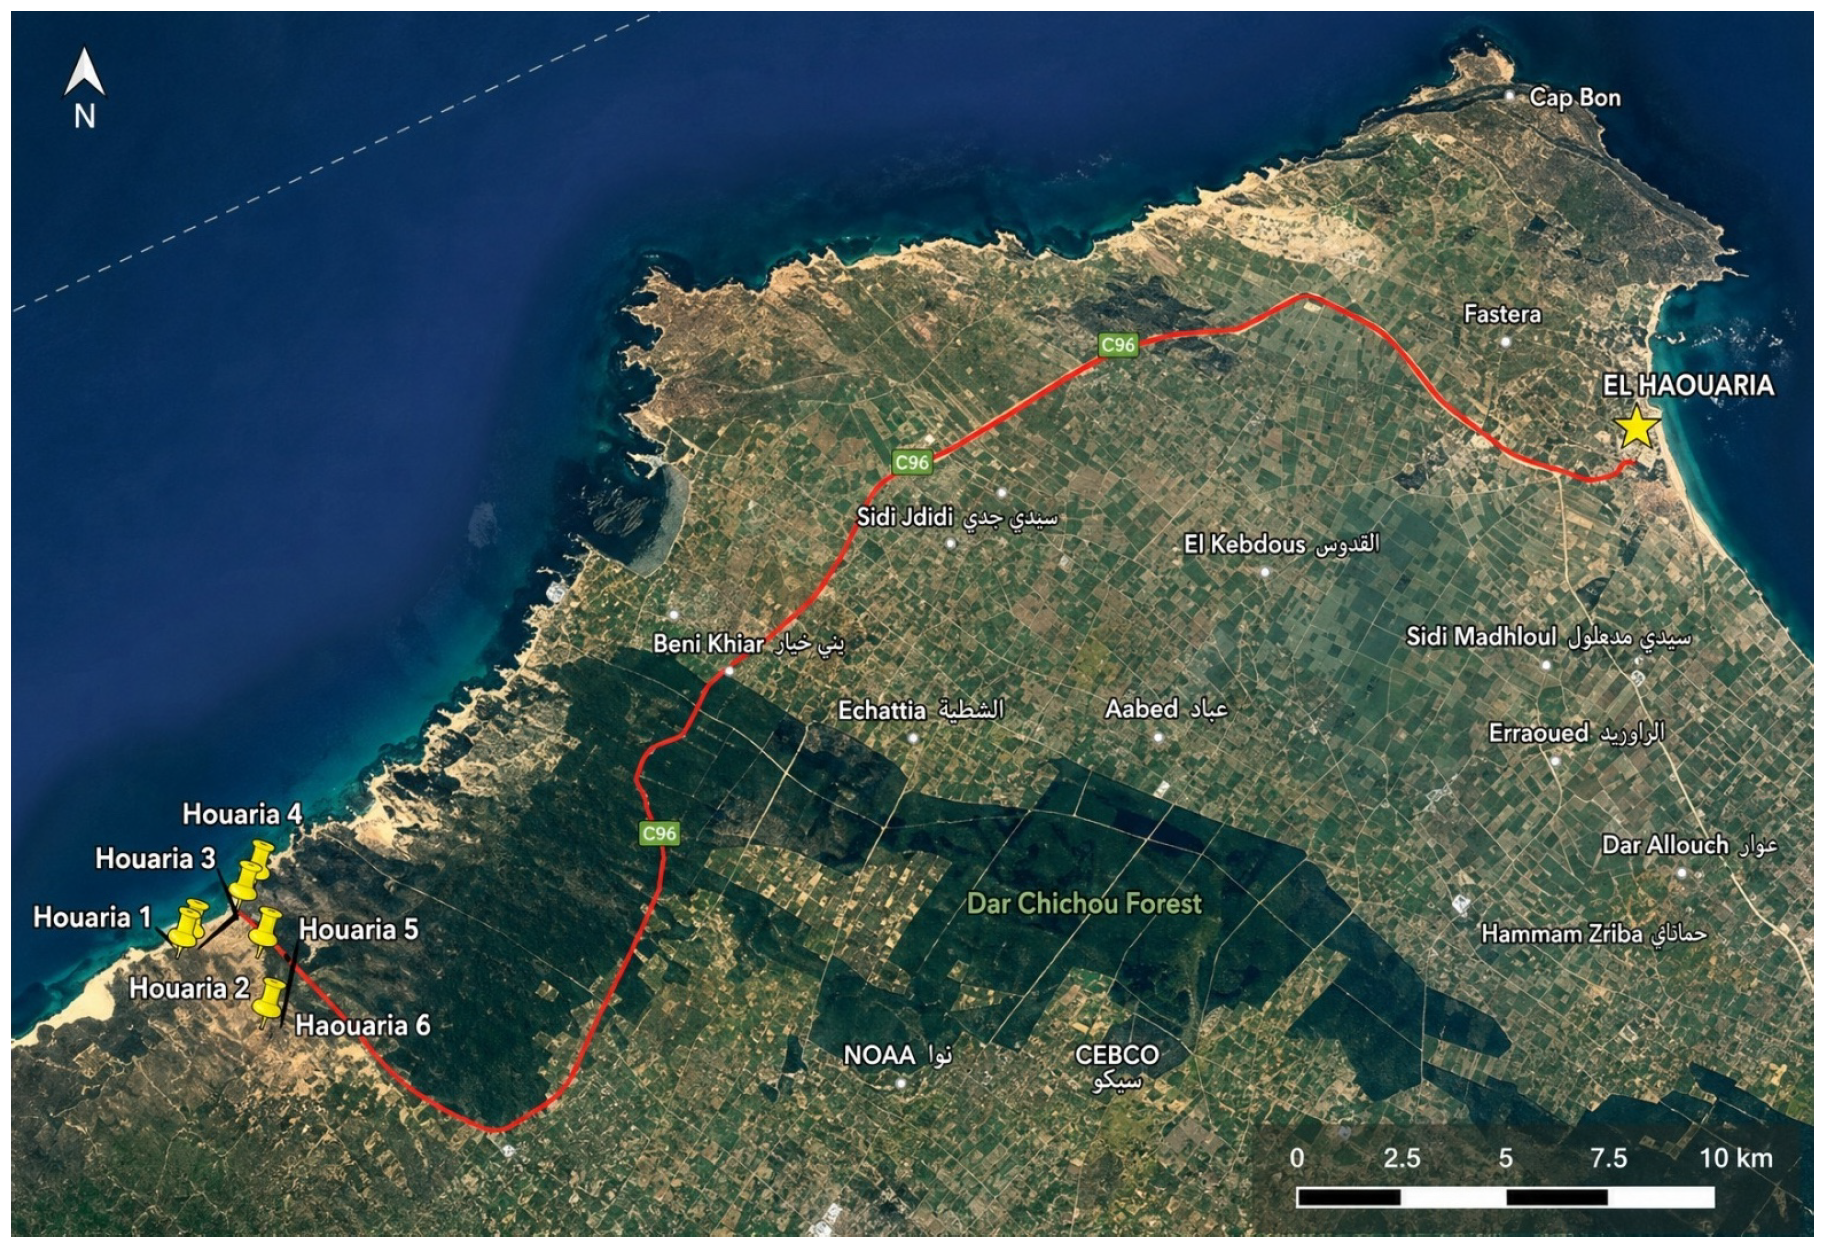
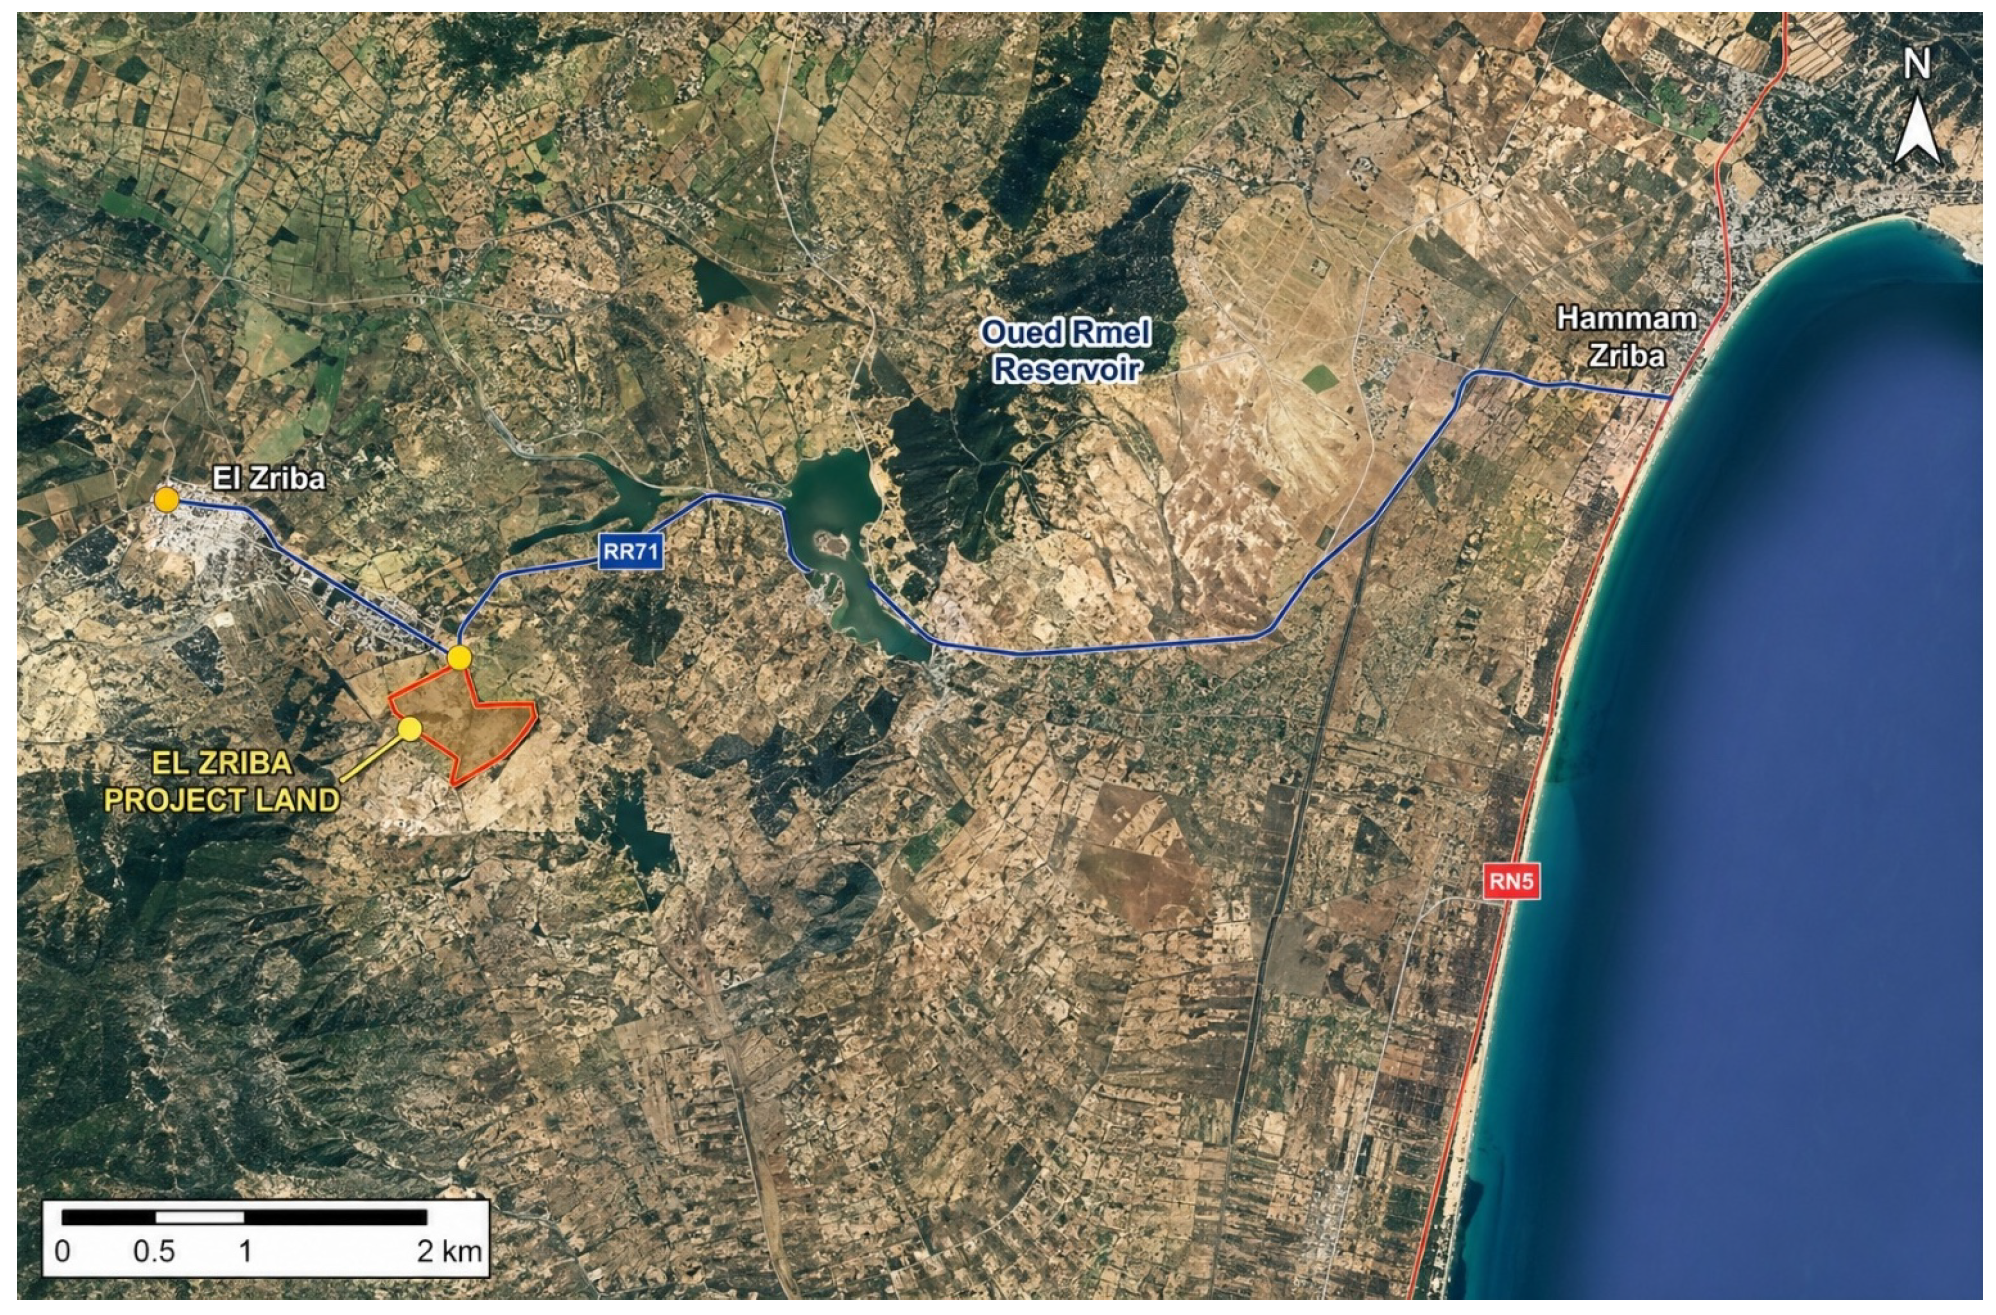
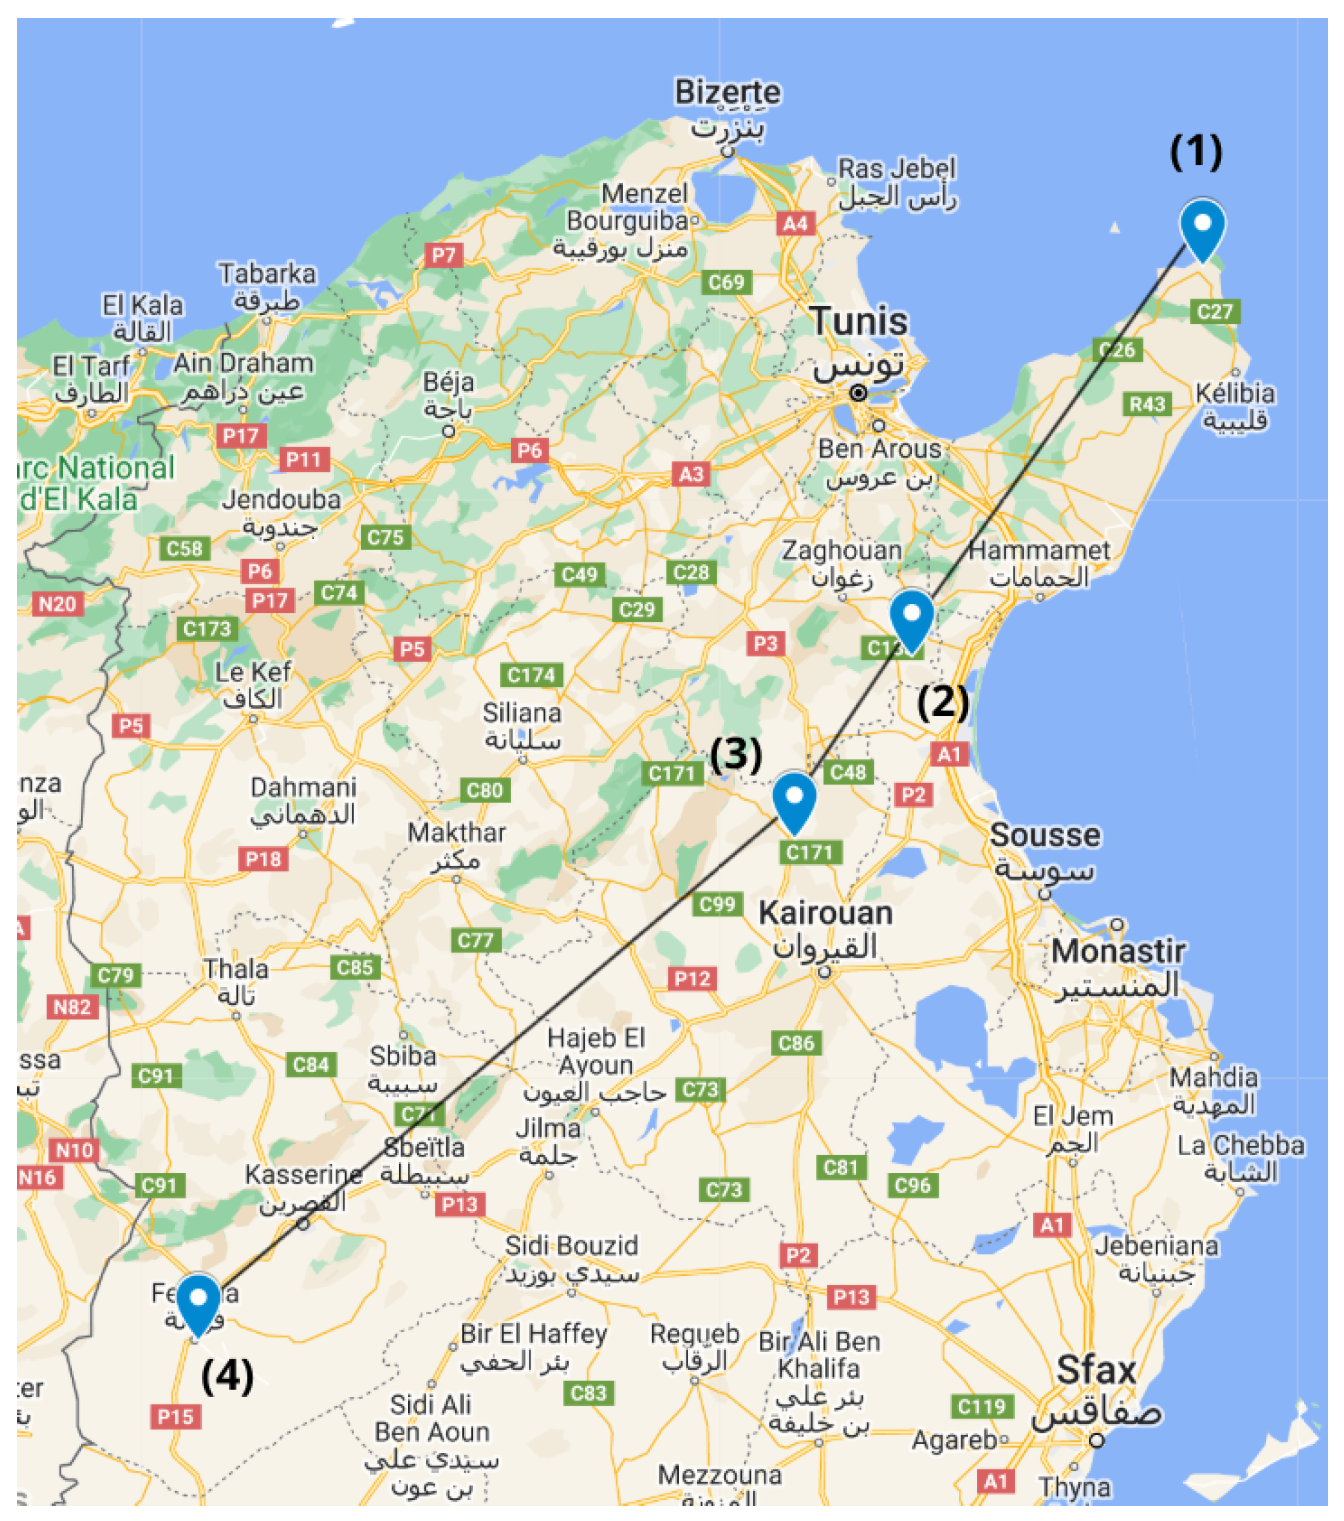
The proposed hydrogen farm locations are shown in Figure 1. Feriana is the largest site, offering approximately 3000 hectares of available space suitable for large-scale solar and wind installations, while Sbikha provides around 1000 hectares, enabling substantial hydrogen infrastructure deployment. Zriba, with 450 hectares, is suited for moderate-scale development requiring optimized land use, whereas El Haouaria, the smallest site with 200–300 hectares, offers strong wind energy potential that compensates for its limited footprint and may allow future expansion pending land availability studies. Each location contributes distinct advantages, creating a diversified multi-site configuration that enhances system resilience and operational reliability. All four sites have identified water sources sufficient to support electrolysis.

2.1.1. Station 1—El Haouaria (Cap Bon)

Located on Tunisia’s northeastern coast, El Haouaria’s site, shown in Figure 2, has access to three main water sources. The Lebna River Basin dam, nearby, offers 30 Mm3 of low–salinity water, deliverable via a PEHD pipeline with a transfer cost of approximately 3M$. Additionally, the Haouaria plain includes two aquifers, one shallow and one deep, providing respectively 33 Mm3 and 5.2 Mm3 annually, managed by local authorities. A wind-powered seawater desalination system is also under consideration, capable of producing up to 250,000 m3 per year, although environmental impacts must still be assessed.

2.1.2. Station 2—Zriba (Zaghouan)

Zriba site, shown in Figure 3, located in the governorate of Zaghouan, has two reliable water sources. The Oued Rmel retention lake, situated 10 km away, provides 20 Mm3, of which only 2% is needed annually. In addition, the Oued Rmel aquifer yields 8.3 Mm3 per year and is supported by a network of 636 motorized pumping wells.

2.1.3. Station 3—Sbikha

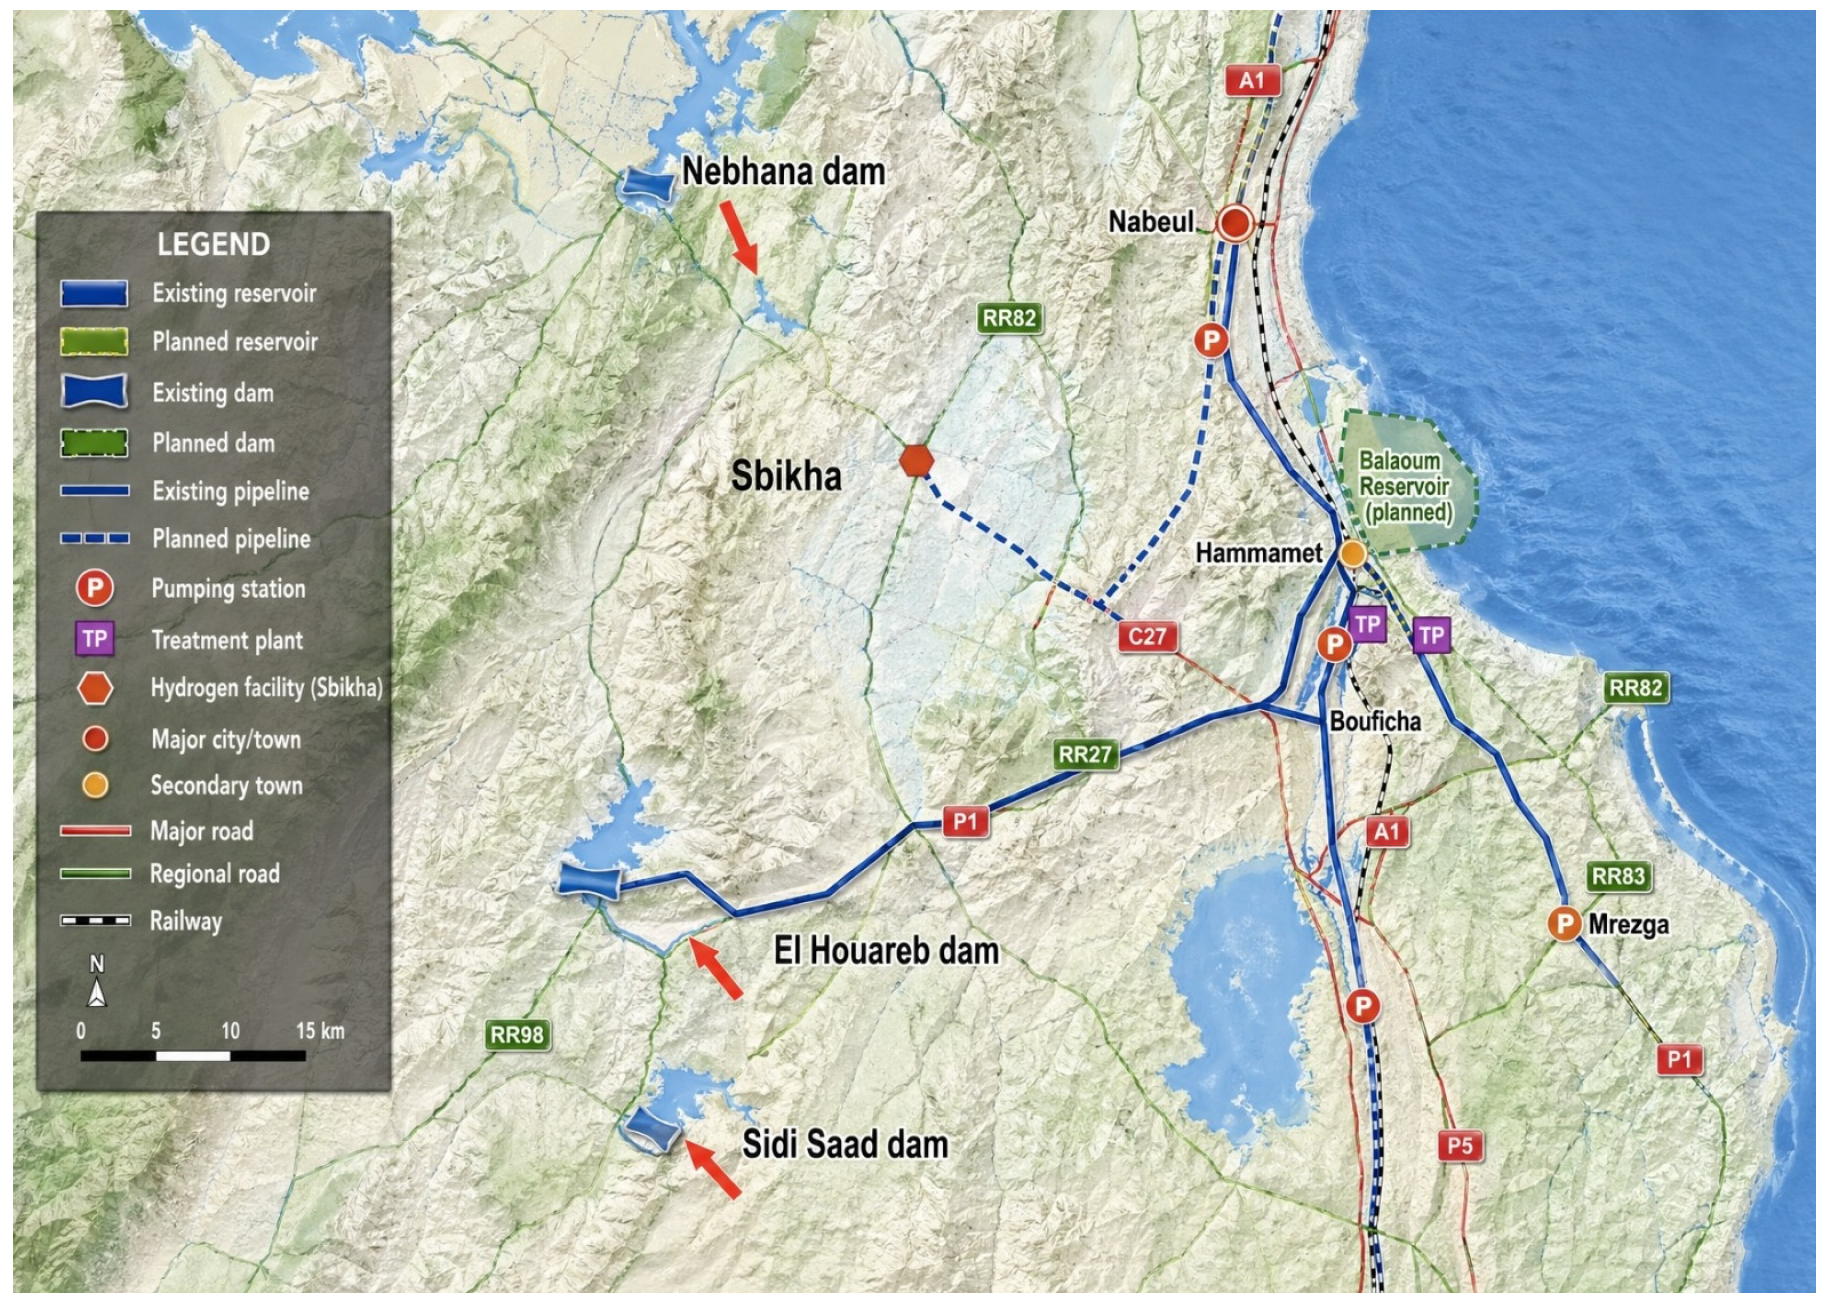
The Sbikha site, shown in Figure 4, benefits from three water supply options. The planned Balaoum Reservoir, located 45 km away, will provide 33 Mm3 and be accessible via a PEHD pipeline with a projected cost of 3 M$. The Nebhana Dam, 25 km away, has been recently rehabilitated and can deliver water through a pipeline connection. A third, more cost–effective option involves a water pipeline located 8 km from the site, with an estimated connection cost of around 0.5 M$.

2.1.4. Station 4—Feriana

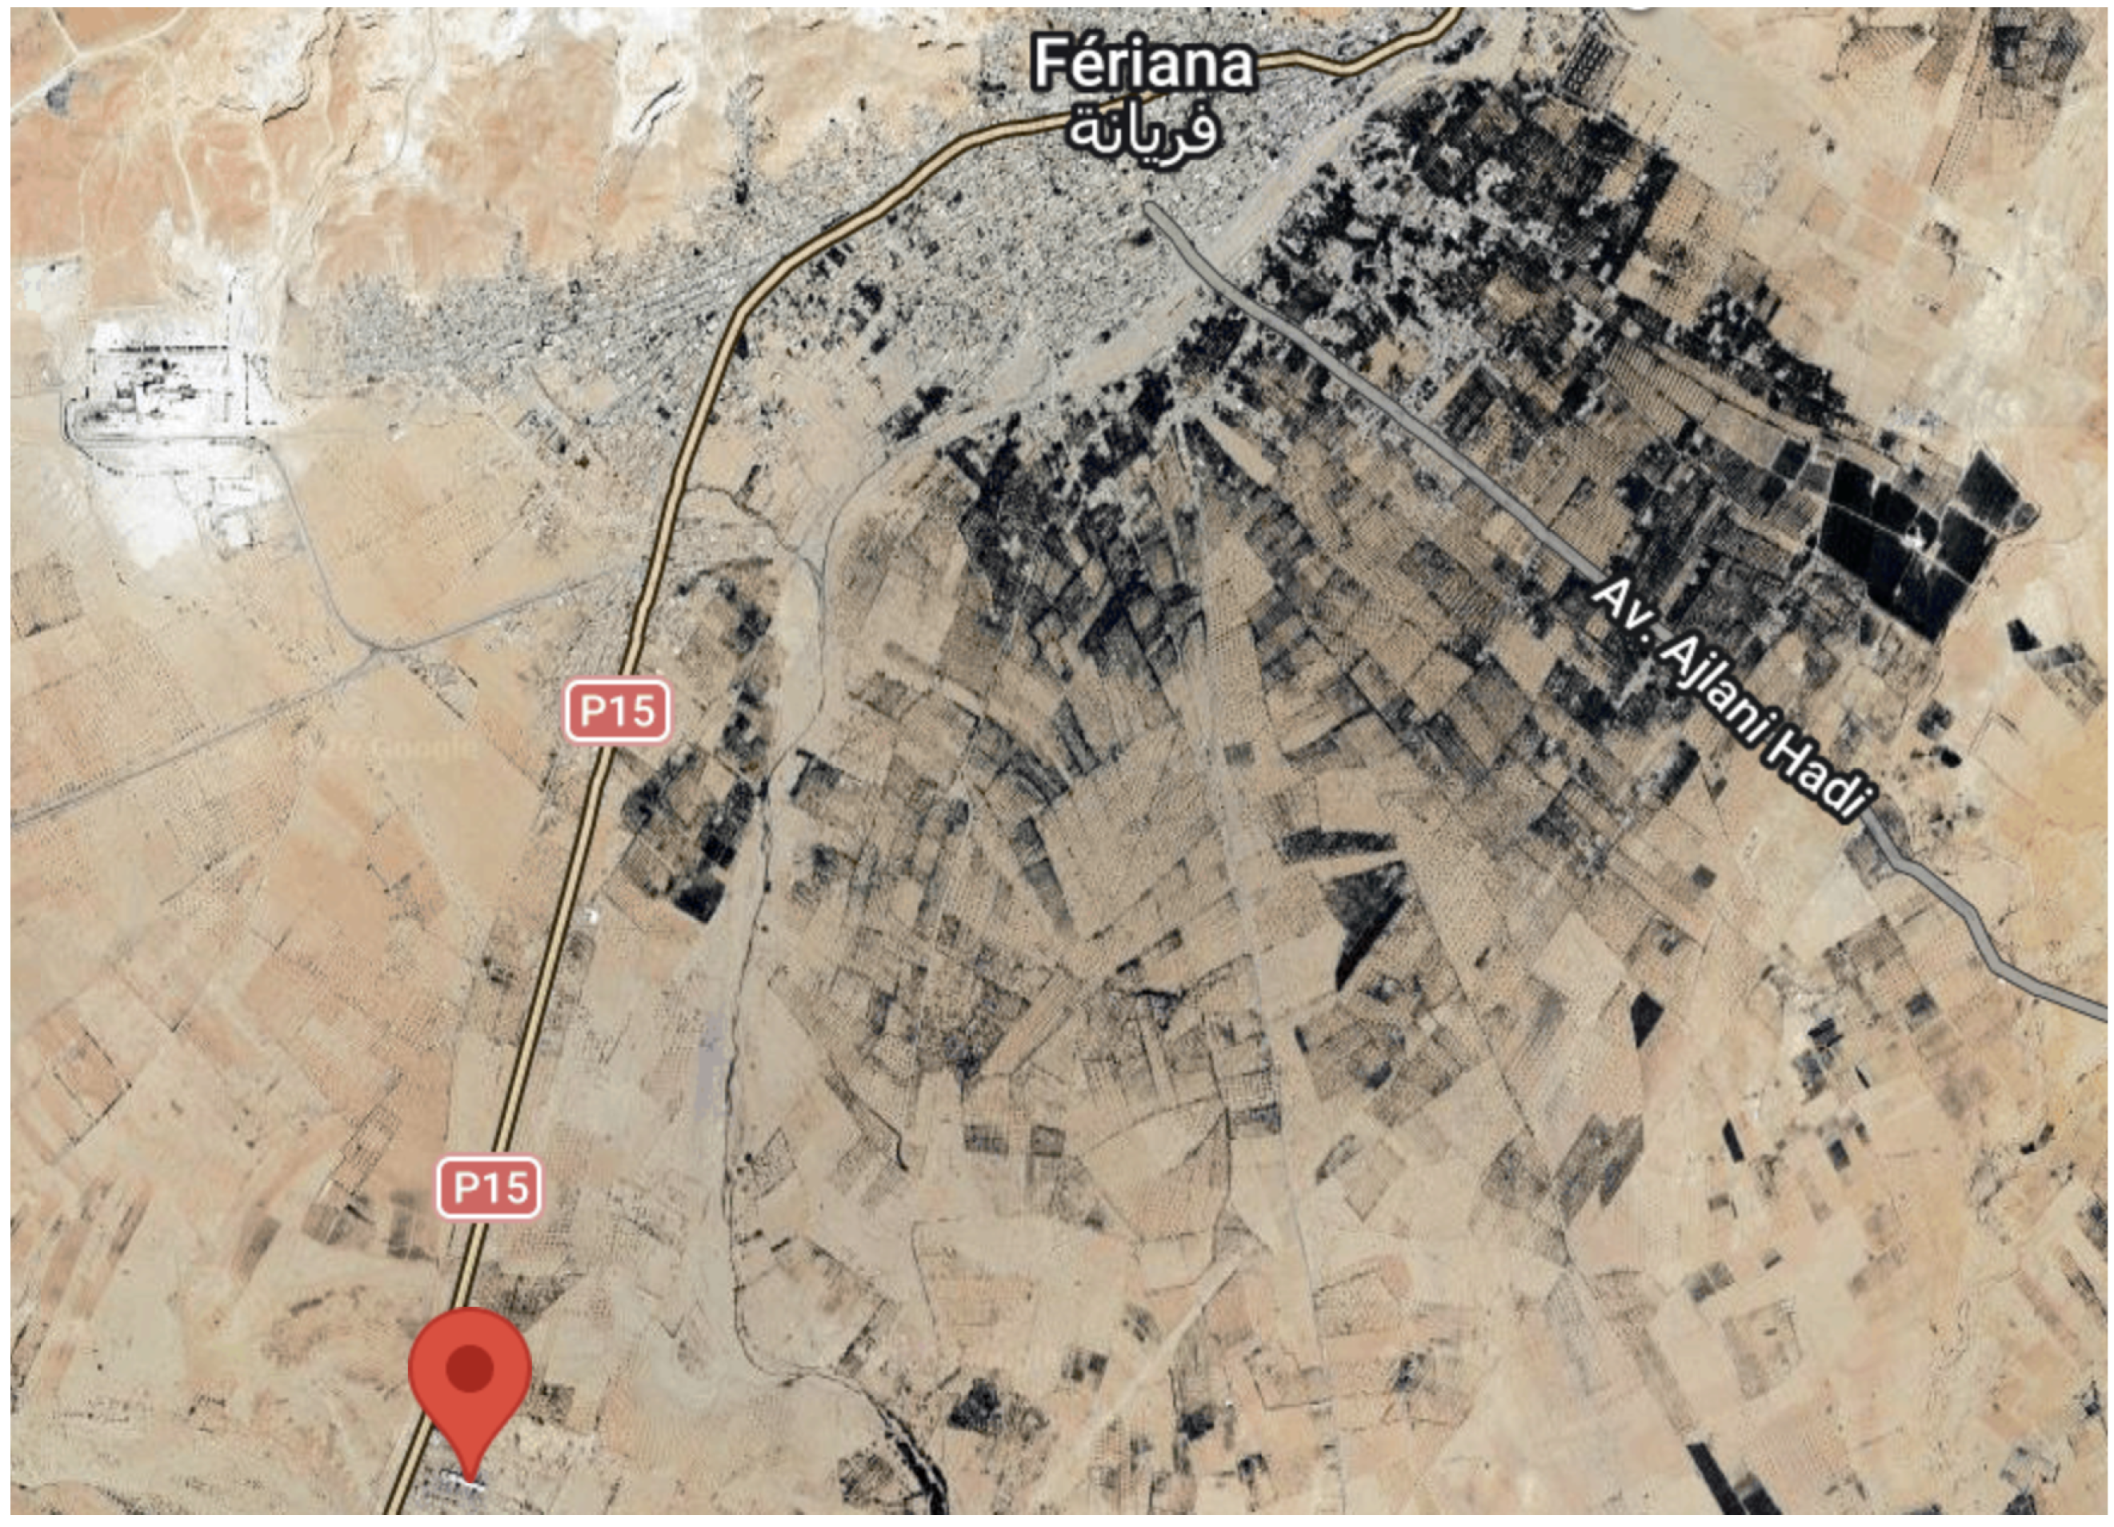
Although located in a relatively water-scarce region, Feriana has two viable water-supply options. A planned dam at Boulaaba will offer 48 Mm3 of capacity, of which less than 1% is required annually. Additionally, the Kasserine aquifer system allows for deep well drilling at approximately 300 m depth, with estimated drilling costs of 150,000$ per well.
The Feriana site is shown in Figure 5. The pinned location corresponds to the existing Feriana power station, used here as a geographic reference point, while the proposed hydrogen project area is expected to be developed in the surrounding available land.

2.2. Methodology

A tailored methodology is implemented in this paper to guide the selection, design, and optimization of renewable energy systems for large-scale hydrogen production. The adopted framework was developed by building on methodological approaches reported in the literature [13,14,15,16,17], including renewable-resource assessment, site-specific system sizing, techno-economic evaluation, and optimization-based LCOH estimation. This ensures that the analysis captures both technical and economic aspects.

2.2.1. Methodology Workflow for Hydrogen System Design and Evaluation

This methodology provides a comprehensive approach to the development of large-scale renewable hydrogen projects and is structured around three main steps:
1.
Data Collection and Energy Yield Analysis: Four years of historical weather data (2021, 2022, 2023, 2024) were collected to evaluate the renewable energy potential at each site. The data were obtained from the Open-Meteo API using hourly resolution to ensure a consistent basis for all locations. These included solar irradiance and wind speed measurements, which were analyzed to estimate the expected energy yield for the selected technologies. The solar irradiance data were cross-checked with the PVGIS database [18], showing deviations below 5%, while interannual variability remained within about ± 8 % of the four-year mean. Different modeling approaches were considered, including statistical analysis and site-specific simulations to predict energy output. This provides a recent multi-annual basis for comparison, while longer-term ground validation remains a limitation for future work [19].
2.
Optimization of Energy Configuration and Cost Modeling: A constraint-based optimization procedure was implemented to determine the optimal distribution of PV panels and wind turbines at each site. The algorithm aimed to minimize the LCOH by accounting for local energy yields, installation costs, land constraints, and spatial requirements. Once the optimal energy mix was identified, the total farm power was used to size the electrolyzer systems, set to 60% of the available capacity to ensure stable hydrogen production. The LCOH was then calculated by combining capital and operating expenditures over a 20-year horizon, incorporating actualization factors such as inflation and discount rates to assess long-term economic feasibility.
3.
Scenario and Sensitivity Analysis: To evaluate the robustness of the system under different economic conditions, a CAPEX sensitivity study is conducted. The analysis considers variations in key cost parameters, including PV system costs, wind turbine costs, and electrolyzer costs. This step is used to assess how capital-cost uncertainty affects the LCOH of the selected deployment configurations.
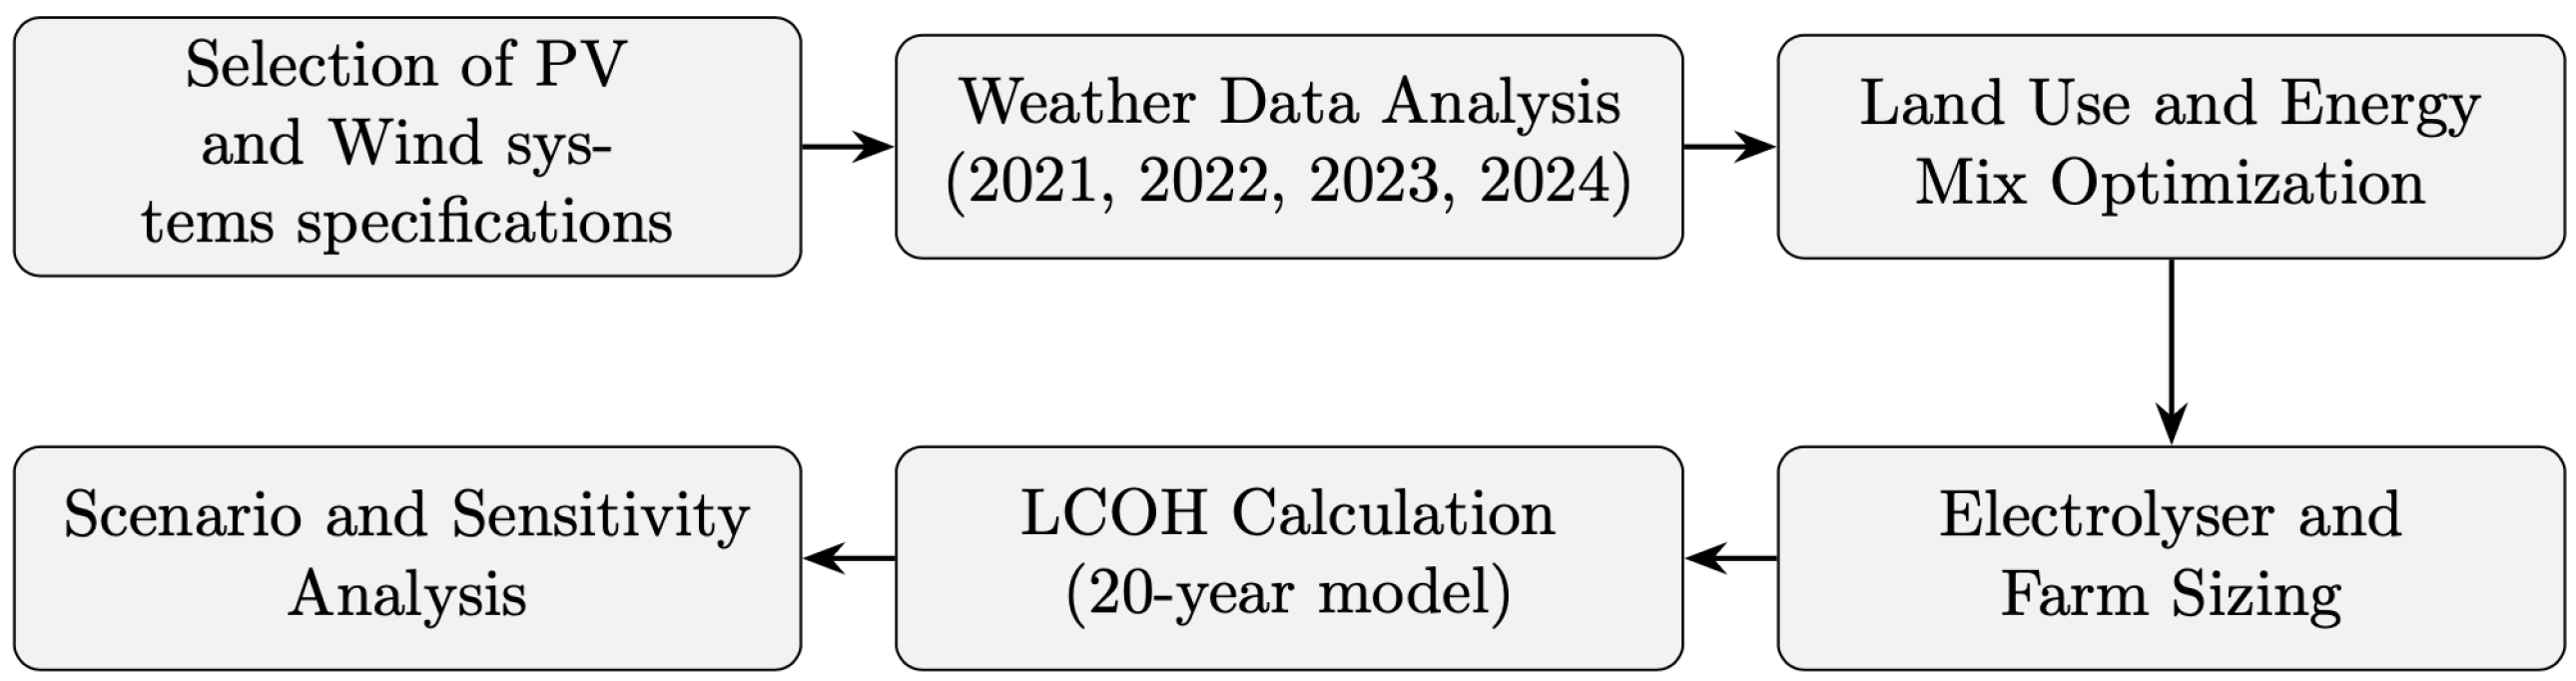
By integrating data analysis, optimization modeling, and cost assessment, the study, following the workflow in Figure 6, ensures that both technical and economic objectives are simultaneously satisfied, providing a solid basis for site-specific decision-making. The insights gained from this framework can guide similar projects in resource-abundant regions aiming to achieve scalable and sustainable hydrogen production.

2.2.2. Energy Yield Estimation Models

To accurately estimate the energy yield from both photovoltaic (PV) panels and wind turbines, dynamic models were developed using four years of historical environmental data (2021–2024). These models incorporate daily variations in solar irradiance, ambient temperature, and wind speed to reflect site-specific performance of renewable technologies in Tunisia’s climate.
  • PV Yield Estimation:
The power output of PV panels is sensitive to cell temperature, which varies with both ambient temperature and solar radiation. First, the cell temperature is estimated based on the Nominal Operating Cell Temperature (NOCT) model [20]:
T cell = T ambient + NOCT T ambient S R 800
where S R is the solar radiation in W/m2, and 800 W/m2 is the reference radiation used in NOCT conditions. This empirical model accounts for heat accumulation on the panel surface. The instantaneous power output of a single PV module is then calculated using the temperature-corrected power equation:
P PV = P Nom S R G T 1 + α ( T cell T ref )
where:
  • P Nom is the nominal power rating of the panel.
  • G T = 800 W / m 2 , the standard reference irradiance.
  • α is the temperature coefficient (typically −0.0035/°C).
  • T ref is the reference temperature (25 °C).
Equation (2) reflects how power output decreases with rising cell temperature due to thermal losses in the semiconductor.
  • Wind Turbine Yield Estimation:
To model wind turbine output, a smooth S-shaped power curve is used to emulate real-world turbine behavior. This sigmoid-based model provides continuous output values from cut-in to rated wind speeds and accounts for cut-off behavior explicitly:
P WT = 0 if v < v cut - in or v > v cut - out 1 2 ρ π R 2 v 3 C p else
where:
  • P WT is the electrical power output of the wind turbine (W).
  • v is the wind speed at hub height (m/s).
  • v cut - in is the cut-in wind speed at which the turbine starts generating power (m/s).
  • v cut - out is the cut-out wind speed at which the turbine shuts down to prevent damage (m/s).
  • ρ is the air density (kg/m3).
  • R is the rotor radius (m).
  • C p is the performance coefficient, representing aerodynamic efficiency.
A performance coefficient C p , whose range is 0.35–0.42, is applied, consistent with empirical findings from small-scale turbine assessments [21]. In this paper, the coefficients will be adjusted accordingly based on the Wind turbine choice.
  • Hybrid Unit Sizing:
To meet a target annual energy demand E i (MWh/year) at site i, the required numbers of photovoltaic panels N PV , i and wind turbines N WT , i are given by:
N PV , i = β i E i Y PV , i , N WT , i = ( 1 β i ) E i Y WT , i
where:
  • β i [ 0 , 1 ] denotes the fraction of energy supplied by PV at site i,
  • Y PV , i is the annual energy yield per PV panel (MWh/panel/year),
  • Y WT , i is the annual energy yield per wind turbine (MWh/turbine/year).
This formulation provides a flexible sizing method that reflects the energy resource mix at a given location and allows exploration of solar–wind trade-offs during optimization.

2.2.3. Detailed Computational Methodology

The computational framework used to optimize the layout and sizing of renewable energy systems for hydrogen production across the four selected sites is presented below. The methodology combines yield-based planning, land–constraint management, and techno-economic modeling to identify the most cost-efficient distribution of PV panels and wind turbines. The core goal is to minimize the LCOH while ensuring optimal utilization of the available land and energy resources.
  • Energy Distribution Evaluation:
Based on the estimation conducted on energy yields for PV and wind technologies at each site in this study, a distribution model has been created to allocate renewable units within the available land. The model uses:
  • Unit-specific energy yield data ( Y PV , i , Y WT , i ) based on the historical environmental data (2021–2024).
  • Land availability and unit footprint for each technology ( A PV , A WT ).
  • Site-specific optimization of the number of PV panels ( N PV , i ) and wind turbines ( N WT , i ) that can be installed.
This evaluation sets the stage for a constrained numerical optimization that determines the optimal sizing of each technology mix to meet hydrogen production targets at the lowest cost.
  • Performance Indicator, Load Factor:
In addition to the energy yield metrics previously introduced, the load factor is considered as a complementary performance indicator to evaluate the utilization rate of the installed renewable capacity. While the optimization framework is primarily driven by the minimization of the LCOH, the load factor provides additional insight into how effectively each configuration converts installed power into actual energy production over time.
L F = E actual P rated T
where:
  • E actual : actual annual energy production (MWh/year).
  • P rated : installed power capacity (MW).
  • T = 8760 : total number of hours in one year.
For each technology, the load factor per site can be expressed using the unit energy yields, defined earlier:
L F PV , i = Y PV , i P rated , PV 8760 L F WT , i = Y WT , i P rated , WT 8760
where P rated , PV and P rated , WT are the rated power of one PV panel and one wind turbine (MW).
At the system level, the load factor of the hybrid configuration is defined as:
L F hybrid , i = N PV , i Y PV , i + N WT , i Y WT , i N PV , i P rated , PV + N WT , i P rated , WT 8760
This formulation allows a consistent comparison of different PV–wind combinations independently of their installed capacity. The load factor is not directly used within the optimization objective, but is employed in the sensitivity analysis to assess the impact of resource variability and technology mix on system performance and energy utilization efficiency.
  • Optimization Procedure:
The optimization targets the configuration that minimizes the LCOH for each site while respecting land and cost constraints. For each location i, the optimization problem determines the number of photovoltaic panels and wind turbines to be installed. The model was formulated independently for each site using the local solar yield, wind yield, available area, component costs, and additional site-dependent costs. The procedure is described below.
The decision-variable vector for site i is defined as:
x i = N PV , i N WT , i
where N PV , i is the number of PV panels and N WT , i is the number of wind turbines installed at site i.
The objective function minimizes the LCOH at each site, defined as the ratio of the total cost C i to the hydrogen production over the system lifetime. This formulation follows approaches commonly adopted in recent hydrogen optimization studies [13,14,22].
LCOH i = C i H i
where H i is the total hydrogen output over a 20-year period given by:
H i = N PV , i Y PV , i + N WT , i Y WT , i × 20 × 1000 55
where Y PV , i and Y WT , i are the annual energy yields of one PV panel and one wind turbine at site i, respectively, expressed in MWh/year. The factor 20 represents the project lifetime in years, the factor 1000 converts MWh to kWh, and 55 kWh/kg is the assumed specific electricity consumption required to produce one kilogram of hydrogen.
Cost Model: The total system cost incorporates the capital and operational expenditures of all key components:
C i = C RE , i + C Ele , i + C Add , i C RE , i = N PV , i c PV , i 1 + f O & M , PV α actualization + N WT , i c WT , i 1 + f O & M , WT α actualization C Ele , i = P Ele , i c Ele , i 1 + f O & M , Ele α actualization C Add , i = f Add , i C RE , i + C Ele , i
where:
  • c PV , i , c WT , i , and c Ele , i : site-dependent unit installation costs of PV panels, wind turbines, and electrolyzers, respectively.
  • f O & M , PV , f O & M , WT , and f O & M , Ele : annual O&M cost fractions for PV, wind, and electrolyzer systems, respectively.
  • f Add , i : additional-cost fraction accounting for water supply, grid connection, land preparation, and other site-dependent auxiliary costs.
  • P Ele , i : electrolyzer power capacity, sized as 60% of the total renewable farm capacity.
The renewable farm power and electrolyzer capacity are computed as:
P farm , i = N PV , i P PV , i + N WT , i P WT , i 1000
P Ele , i = 0.6 P farm , i
where P PV , i and P WT , i are the rated powers of one PV panel and one wind turbine at site i, respectively, expressed in kW, while P farm , i and P Ele , i are expressed in MW.
Actualization Term: Only the recurring O&M costs are converted to present value using an actualization factor, while the initial capital costs are considered at year zero. The actualization factor accounts for inflation ( I R ) and discount rate (r):
α actualization = n = 1 20 1 + I R 1 + r n
where r = 15 % , I R = 6 % , and the summation period corresponds to the 20-year project lifetime.
The optimization problem solved for each site can therefore be written as:
min N PV , i , N WT , i LCOH i = C i H i
subject to the following bounds:
0 N PV , i N PV , i max
0 N WT , i N WT , i max
where the maximum admissible numbers of PV panels and wind turbines are obtained from the usable site area:
A usable , i = 0.9 A i
N PV , i max = A usable , i A PV , i , N WT , i max = A usable , i A WT , i
Land Use Constraint: The primary constraint of the optimization ensures that the required land area for either PV or wind does not exceed the available site land ( A i ). In the implemented model, only 90% of the total land is considered usable for renewable installations, while the remaining 10% is reserved for spacing, access roads, maintenance paths, and auxiliary infrastructure.
N PV , i N PV , i max , N WT , i N WT , i max
In addition, the optimization enforces full use of at least one renewable technology limit. This constraint is imposed as:
min N PV , i N PV , i max , N WT , i N WT , i max = 0
This means that the optimal solution must either use the maximum allowable number of PV panels or the maximum allowable number of wind turbines. This constraint was introduced to avoid underutilized land configurations and to force the optimizer to compare high-land-use renewable deployment scenarios.
The complete optimization formulation is summarized as follows:
min x i C i H i s . t . x i = N PV , i N WT , i 0 N PV , i N PV , i max 0 N WT , i N WT , i max min N PV , i N PV , i max , N WT , i N WT , i max = 0 H i > 0
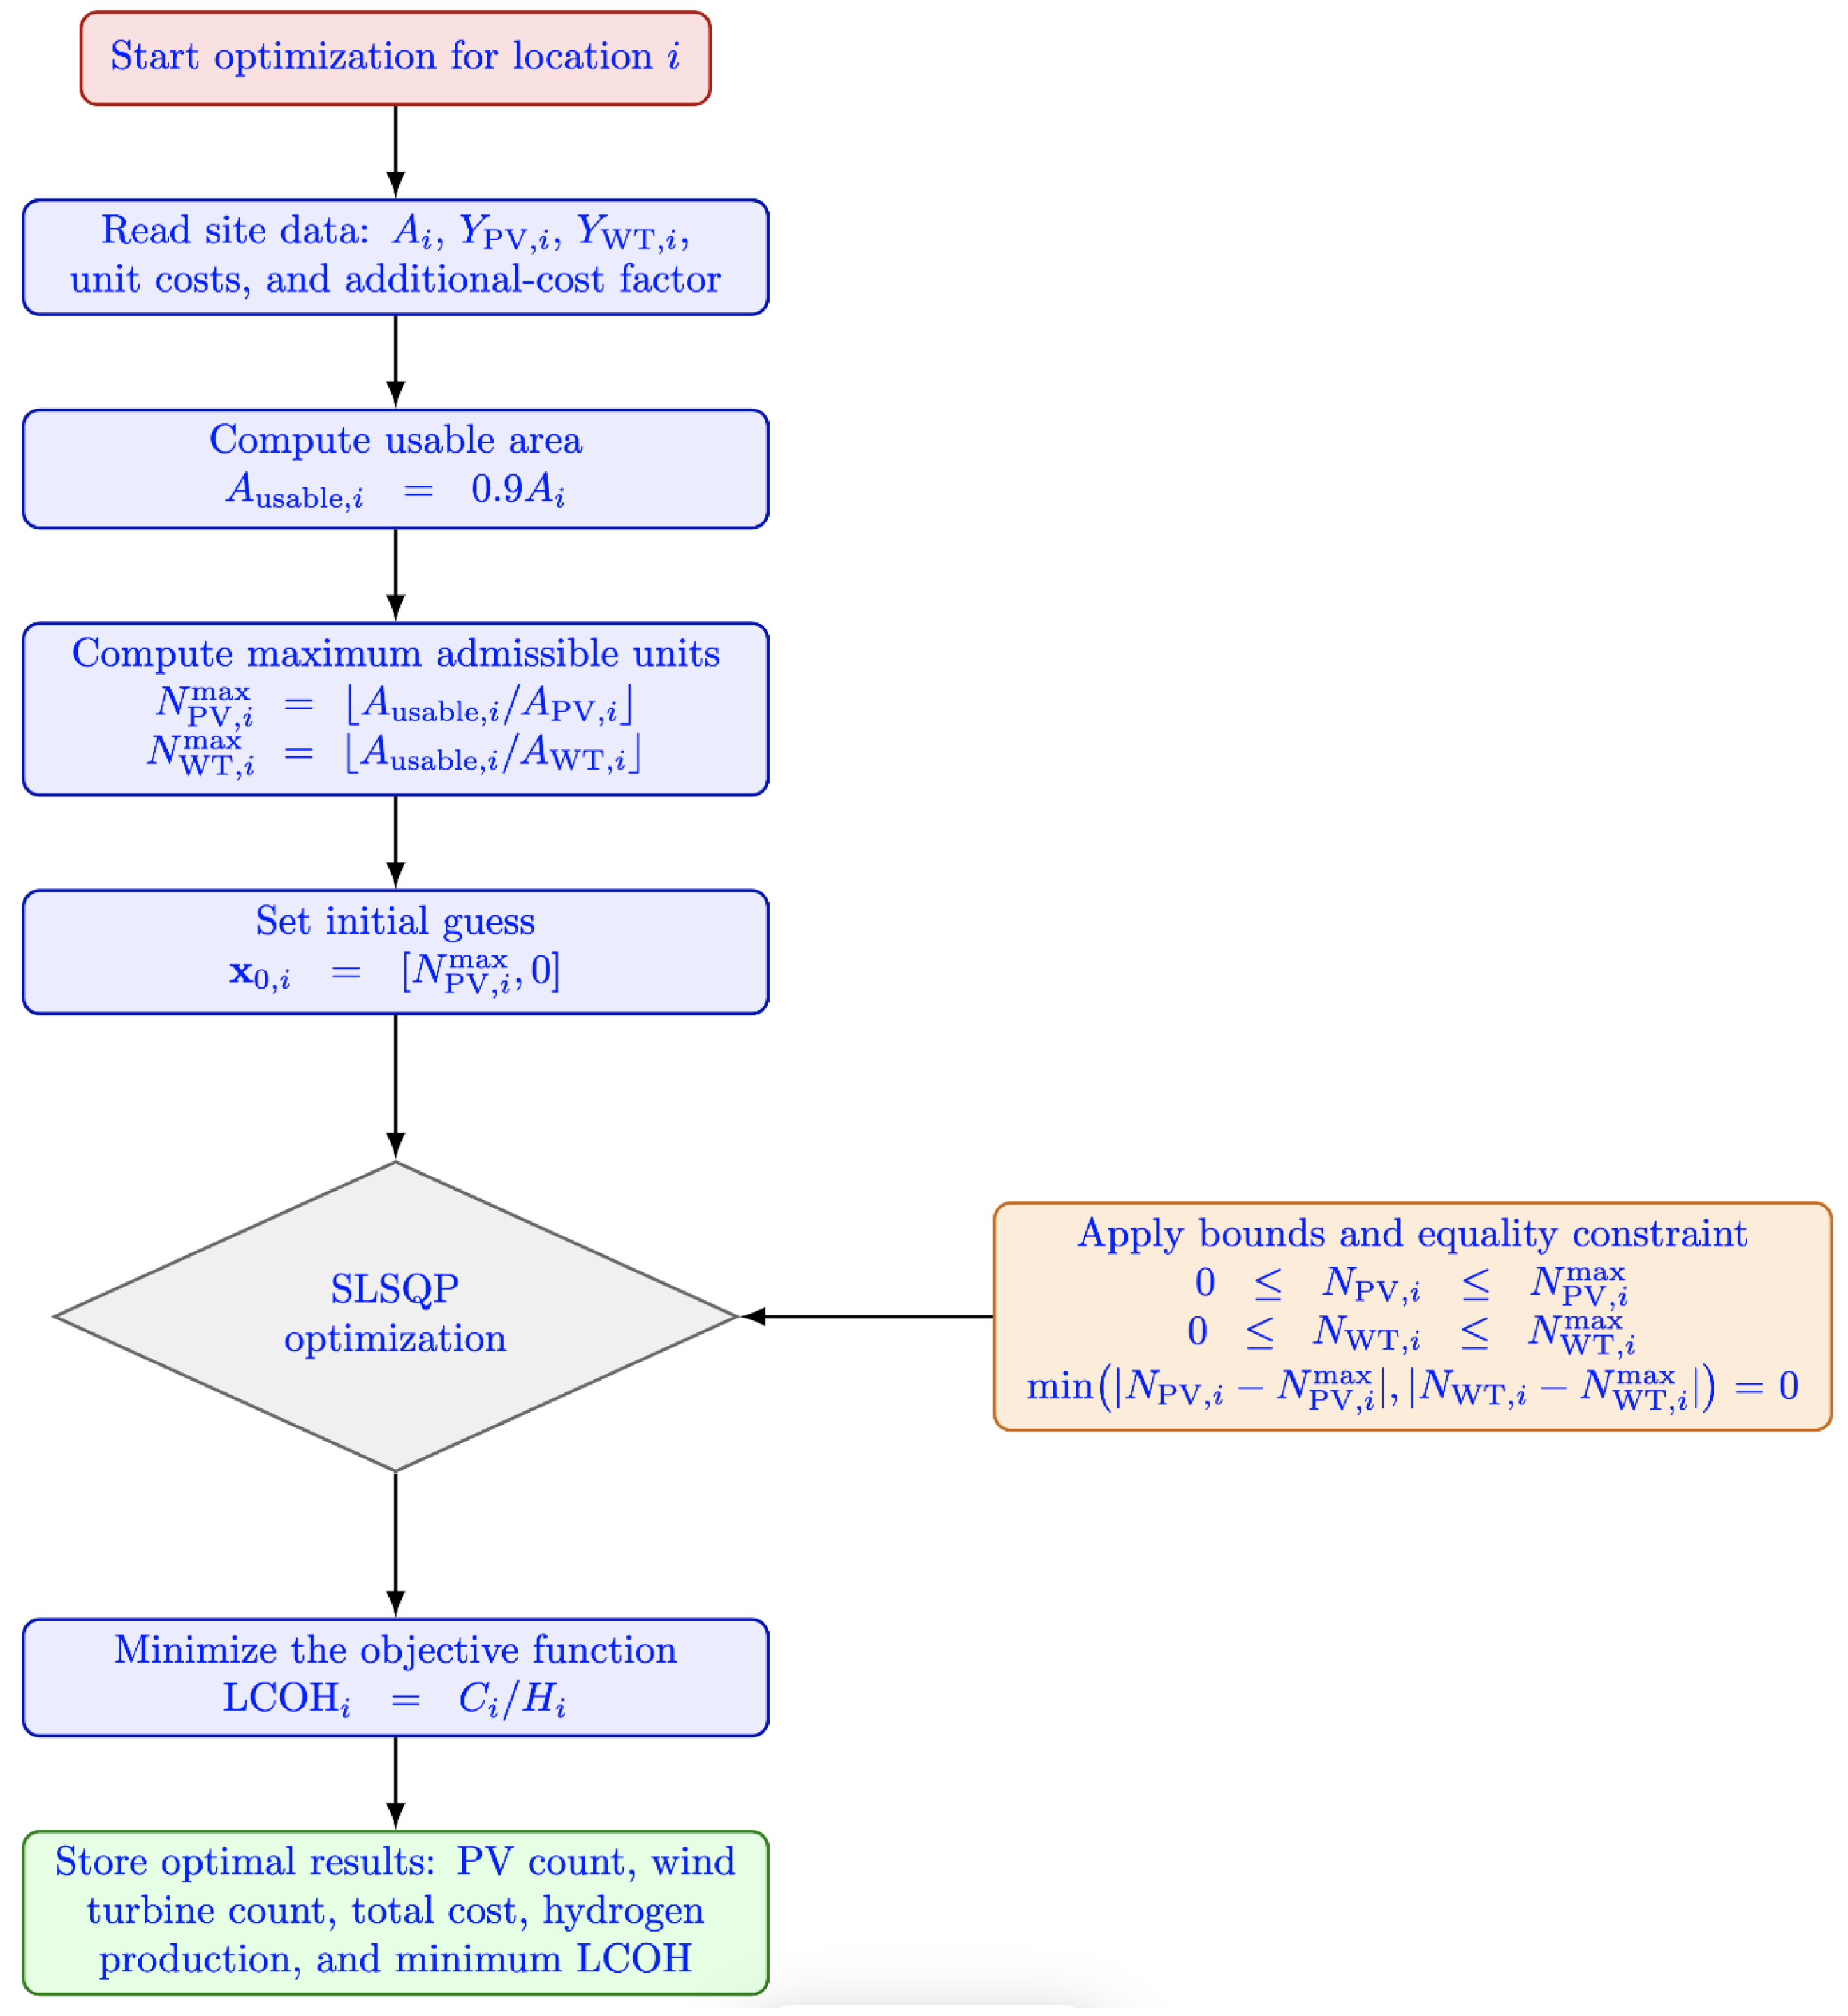
The full optimization model is implemented in Python V3.12.12 using scipy.optimize.minimize with the SLSQP method, ensuring smooth convergence under nonlinear constraints. The computational workflow followed in the implementation is summarized schematically in Figure 7. For each site, the optimization starts from an initial condition corresponding to maximum PV deployment and zero wind turbines, i.e., x 0 , i = [ N PV , i max , 0 ] . The site-specific solar yield, wind yield, PV cost, wind turbine cost, electrolyzer cost, O&M fractions, additional-cost fraction, and available land are passed to the objective function. The optimizer then minimizes the LCOH under the bounds and equality constraint defined above. If the hydrogen production is zero, the objective function returns an infinite LCOH value, which prevents infeasible zero-production configurations from being selected.

3. Results and Discussion

The technical and economic outcomes derived from the three-step methodology previously described are presented next. The analysis begins with the weather data extraction to compute the energy yields, followed by the optimization procedure to determine the most cost-effective configuration for each site by minimizing the LCOH under land and resource constraints. The following subsections provide a detailed breakdown of these results.

3.1. Energy Production System

To maximize production efficiency and reduce balance-of-system costs, this research adopts commercial-scale technologies represented by 720 W photovoltaic modules and 7.2 MW onshore wind turbines. The land footprint assumptions were set to 0.00065 ha per PV module, equivalent to approximately 6.5 m2 per panel including spacing and installation clearance, and 5 ha per wind turbine, accounting for the spacing required by large onshore turbines for wake-effect mitigation and operational access. The selected wind turbine size aligns with the upper limit of commercial onshore models, where utility-scale turbines in the 6–8 MW class are increasingly considered for large renewable energy projects. For photovoltaics, the 700+ W class has seen growing adoption due to its ability to reduce the number of panels required per installed megawatt, thereby improving land-use efficiency and reducing installation costs. As mentioned previously, the four production sites were strategically selected based on favorable renewable resources, water availability, and proximity to the TRANSMED pipeline and its associated compression infrastructure. This allows the produced hydrogen to benefit from the existing natural gas corridor, reducing the need for dedicated transportation routes, storage infrastructure, compression facilities, and right-of-way costs. Therefore, the cost assessment focuses mainly on renewable energy generation and hydrogen production, while the additional cost term accounts for auxiliary facilities, water supply, site integration, and hydrogen injection requirements. To avoid relying on isolated market prices, the capital costs of PV systems, wind turbines, and electrolyzers were defined based on recent scientific studies and technical reports, as summarized in Table 1.
As shown in Table 1, the selected CAPEX values were chosen within the average range of recent estimates to reflect the expected cost reduction of large-scale renewable hydrogen systems, while avoiding both overestimation based on outdated conservative assumptions and underestimation based on overly optimistic isolated targets. Accordingly, the adopted values are approximately 400$/kW for PV systems, 850$/kW for onshore wind turbines, and 800$/kW for electrolyzers. To further assess the impact of capital-cost uncertainty on the LCOH estimation, a sensitivity analysis is conducted by varying the CAPEX of PV systems, wind turbines, and electrolyzers between the selected values and the upper bounds reported in the literature. This analysis provides additional insight into the extent to which the LCOH may increase under higher-cost assumptions and supports the evaluation of conservative worst-case scenarios.

3.2. Energy Yield Analysis

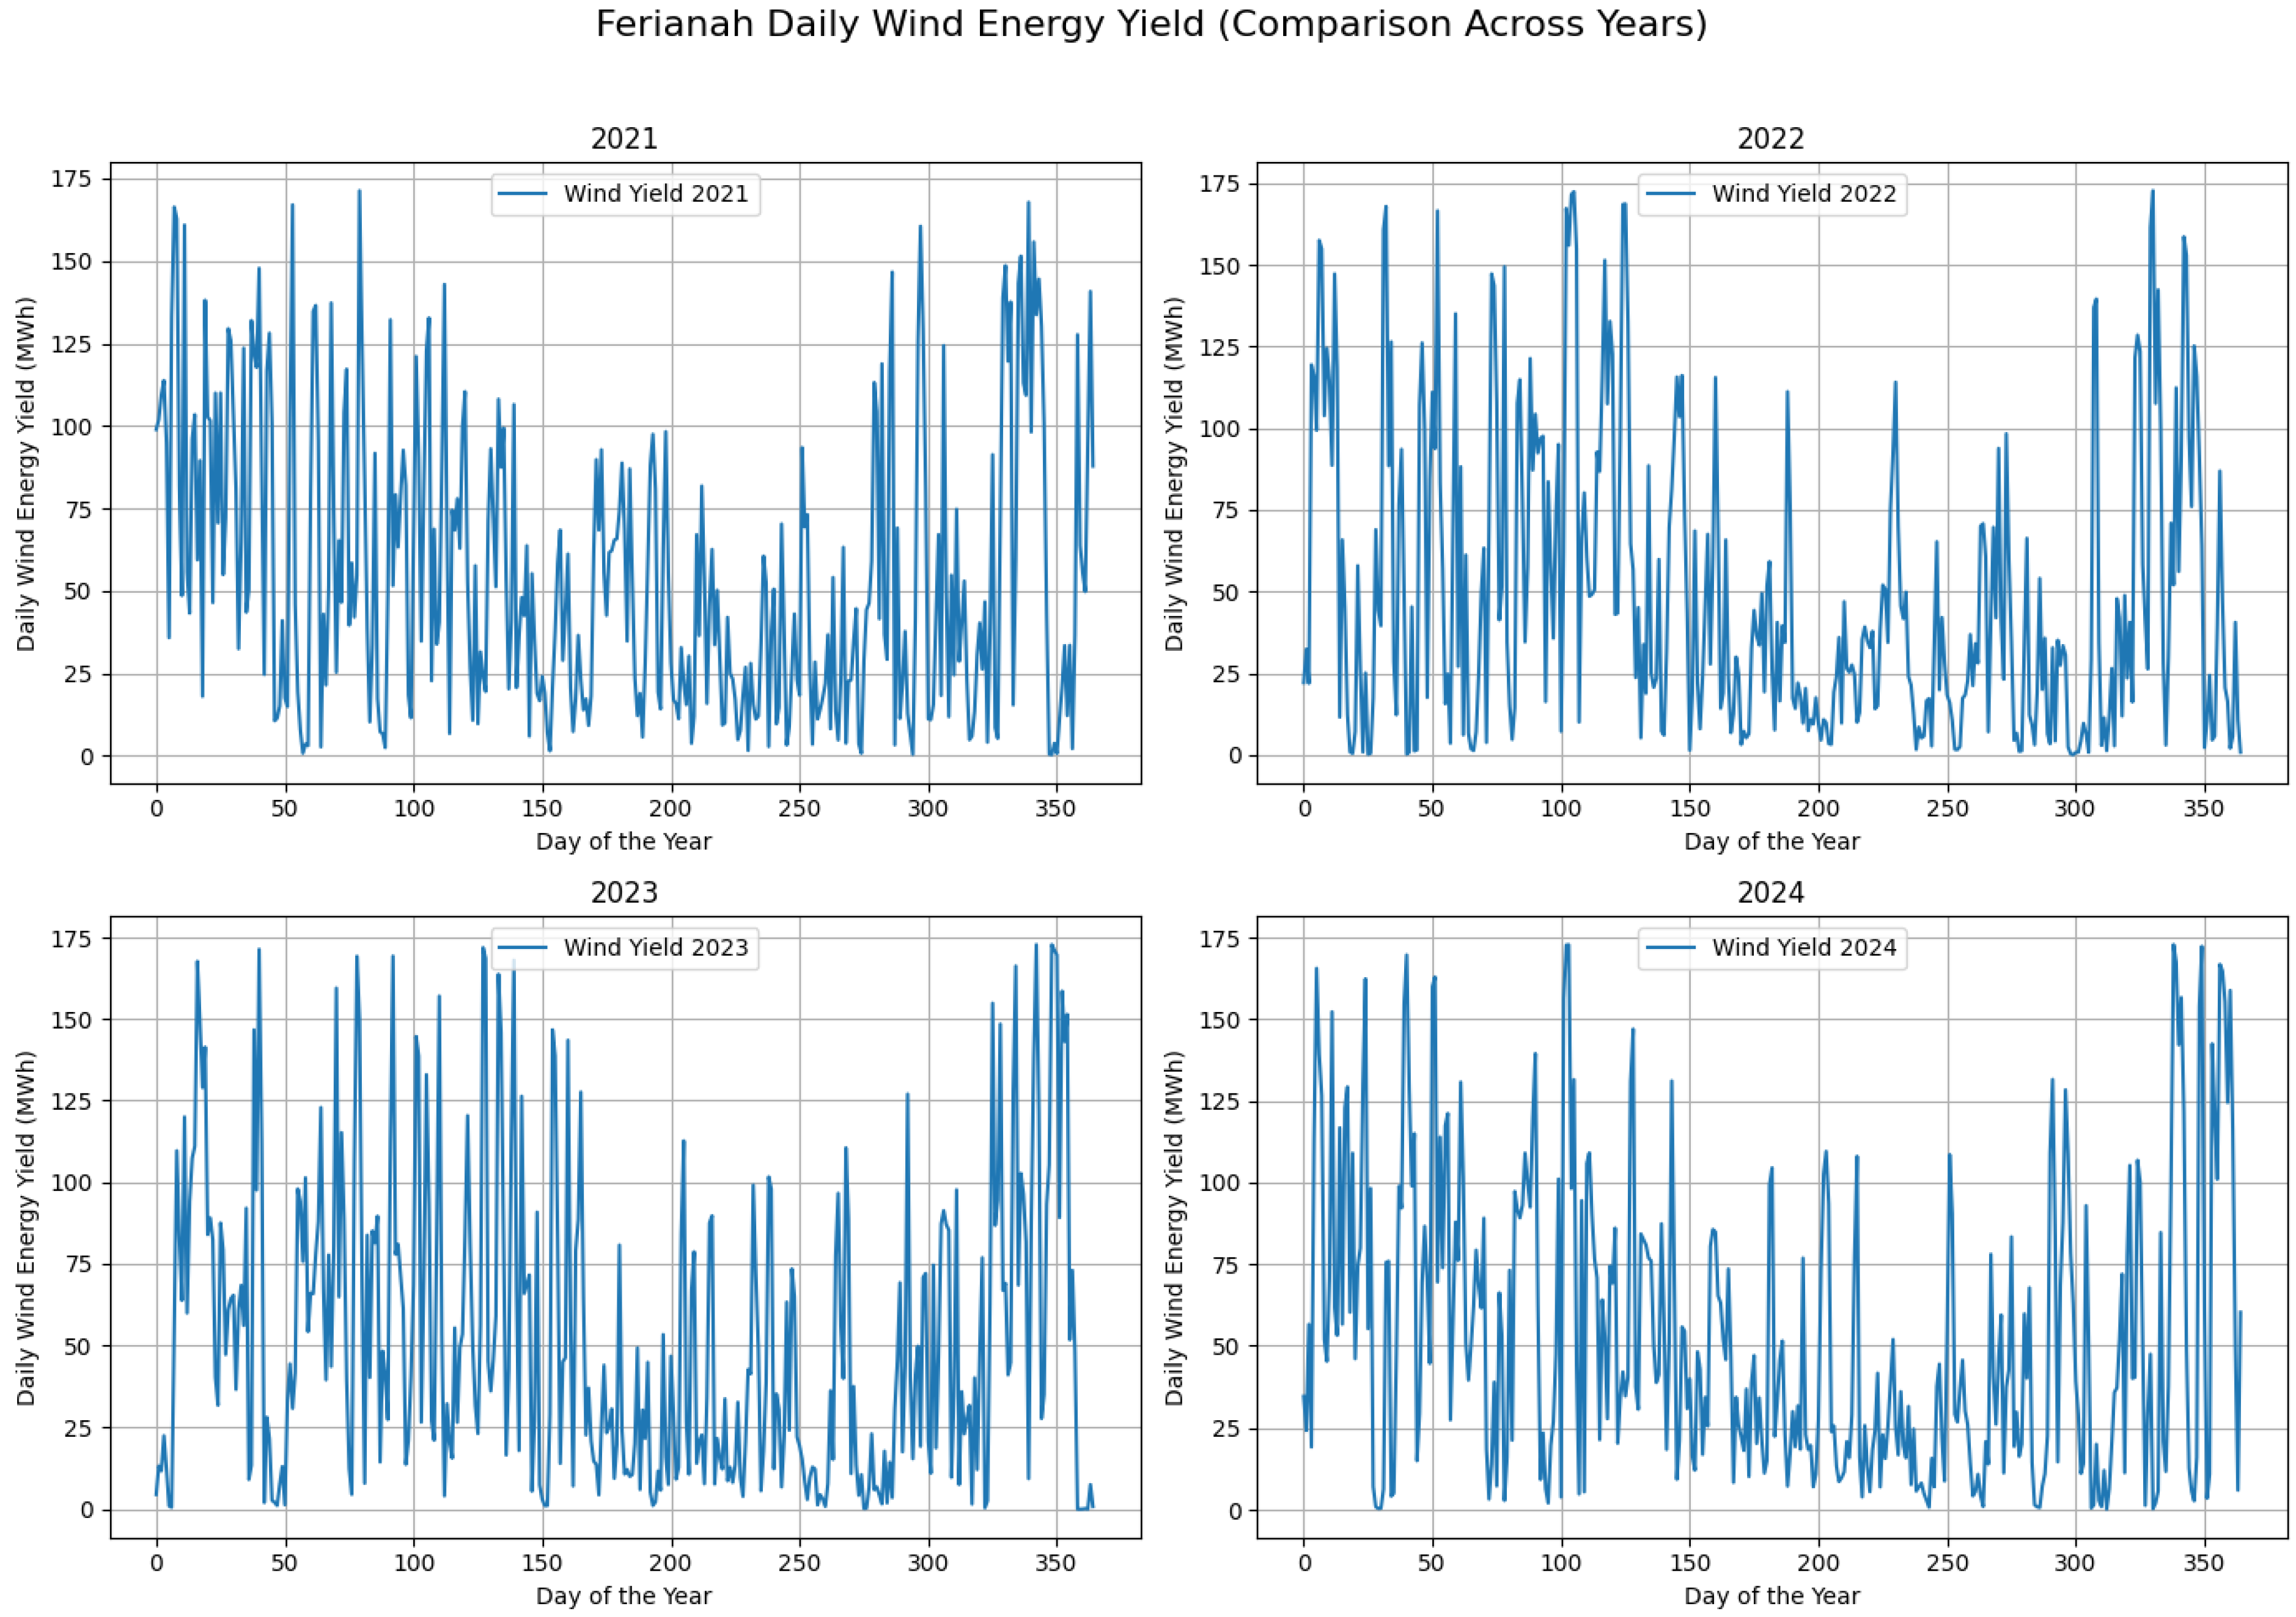
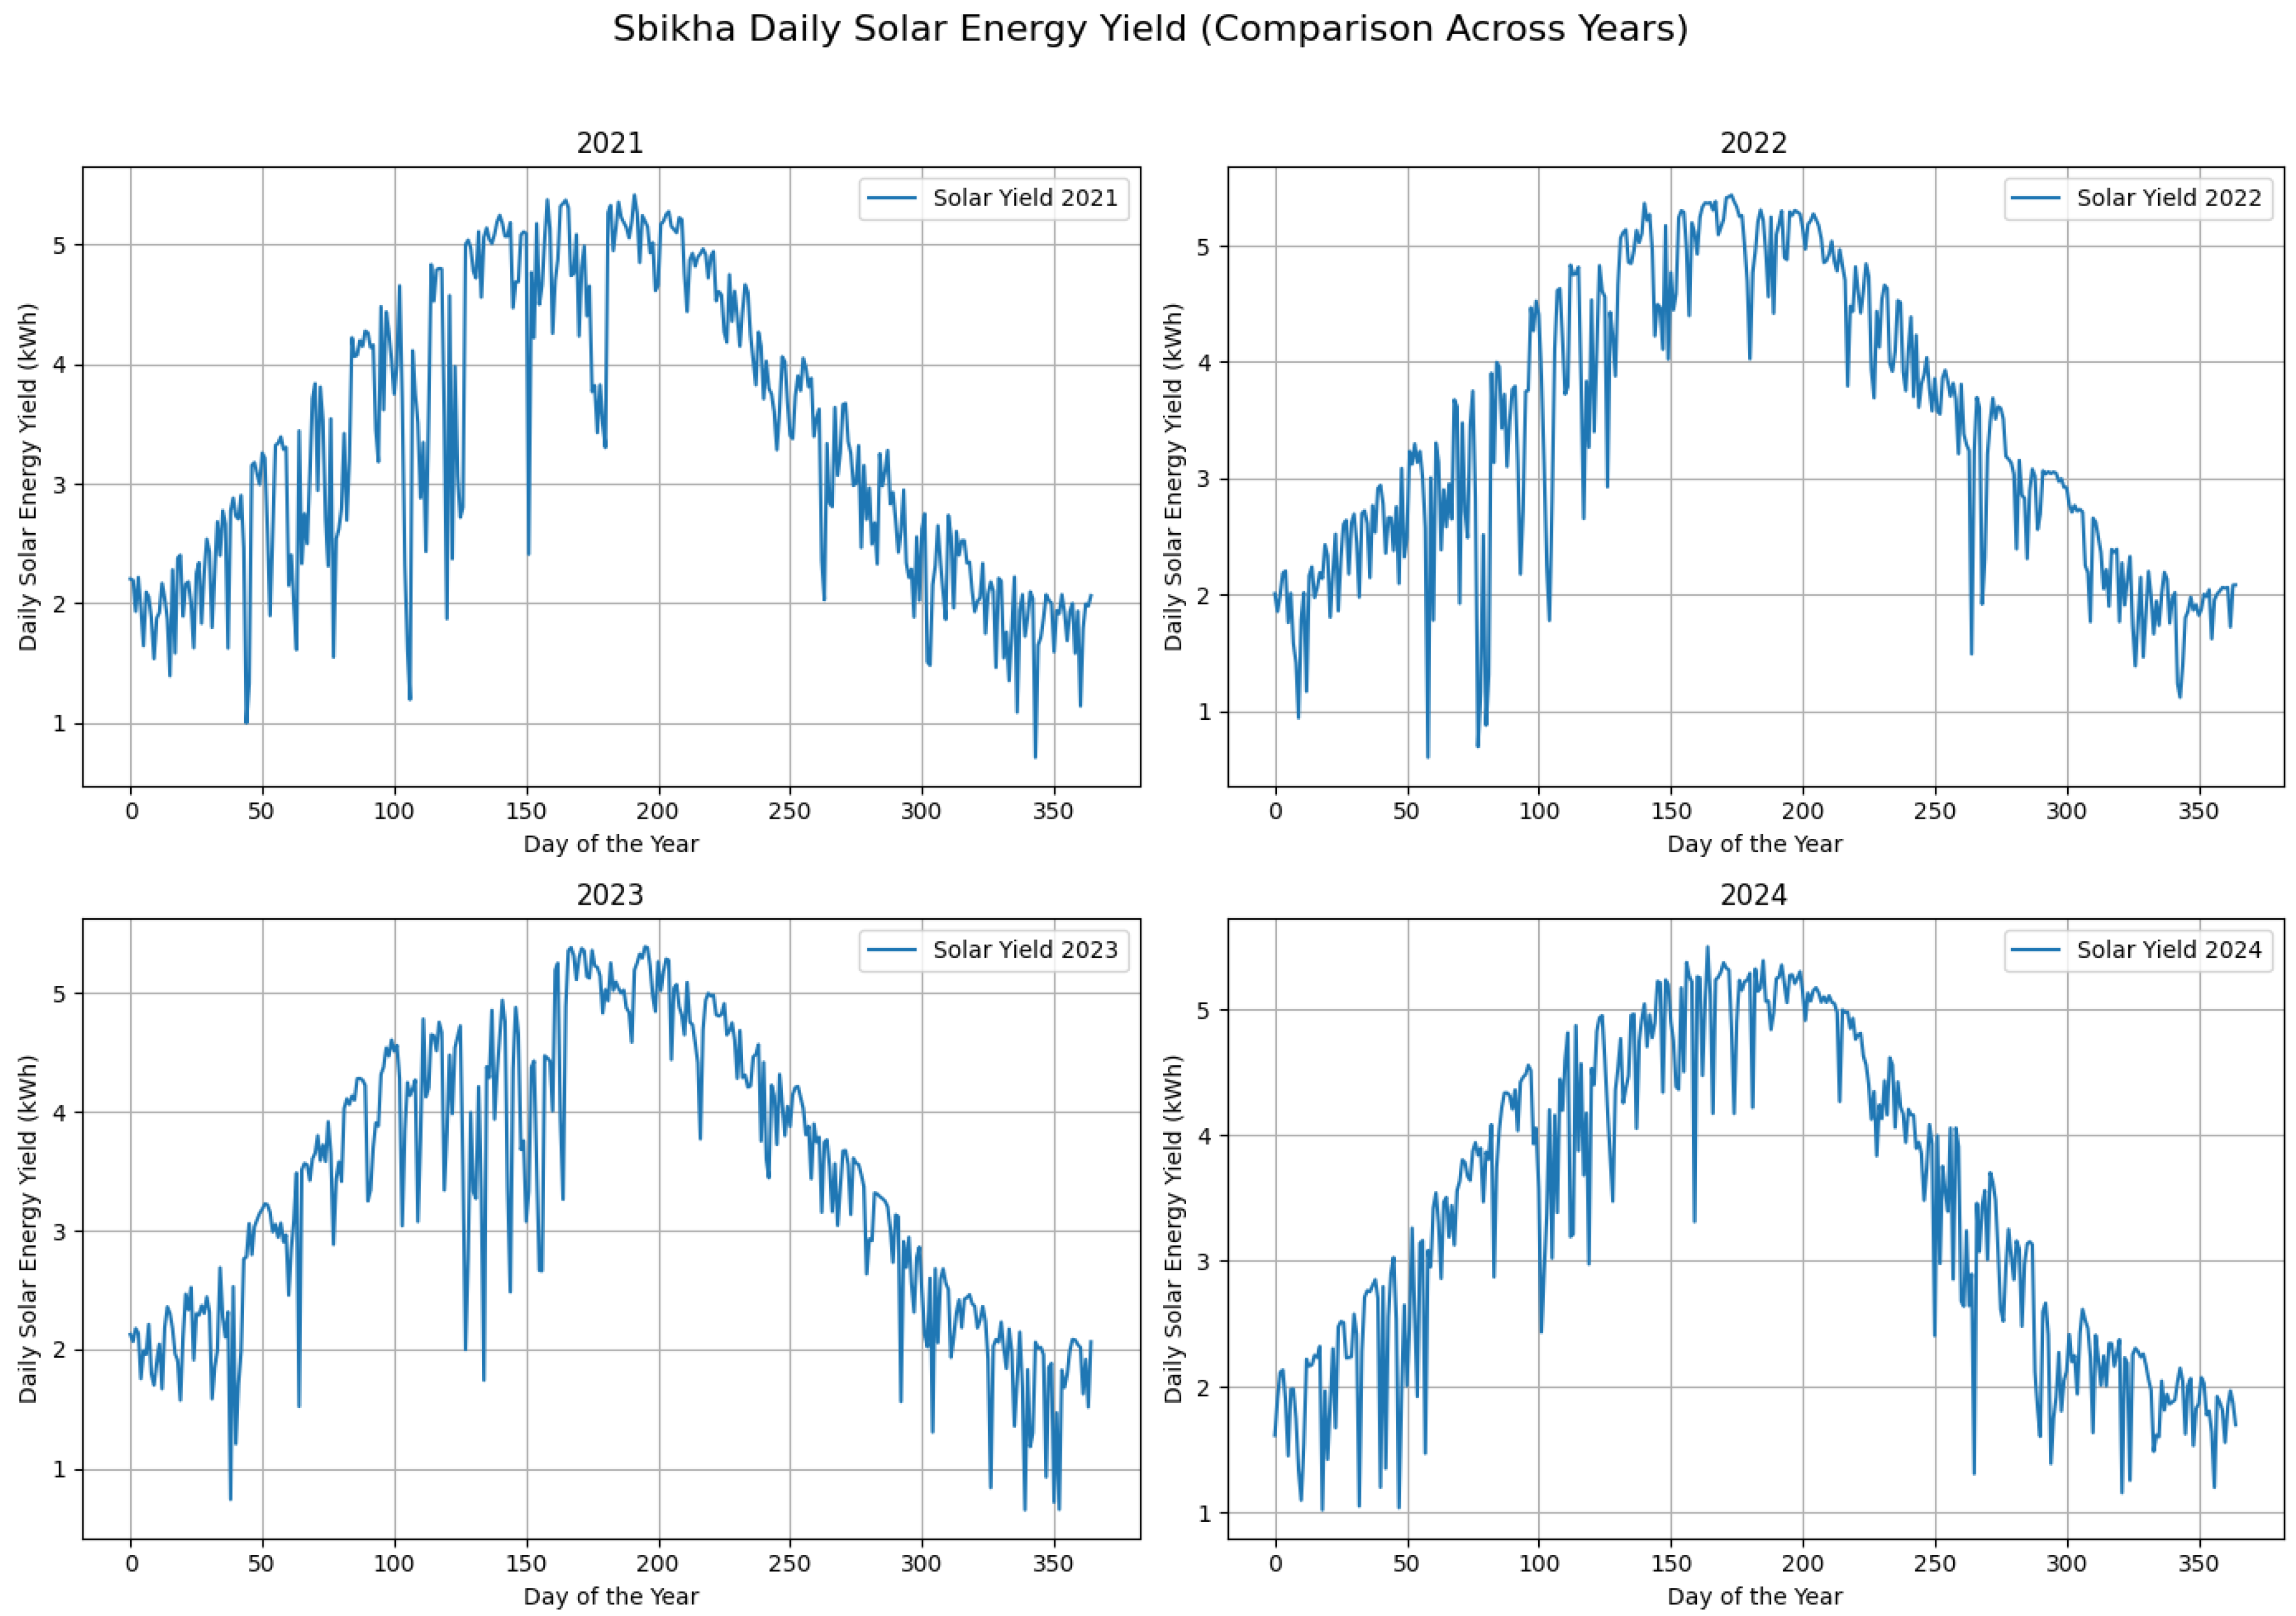
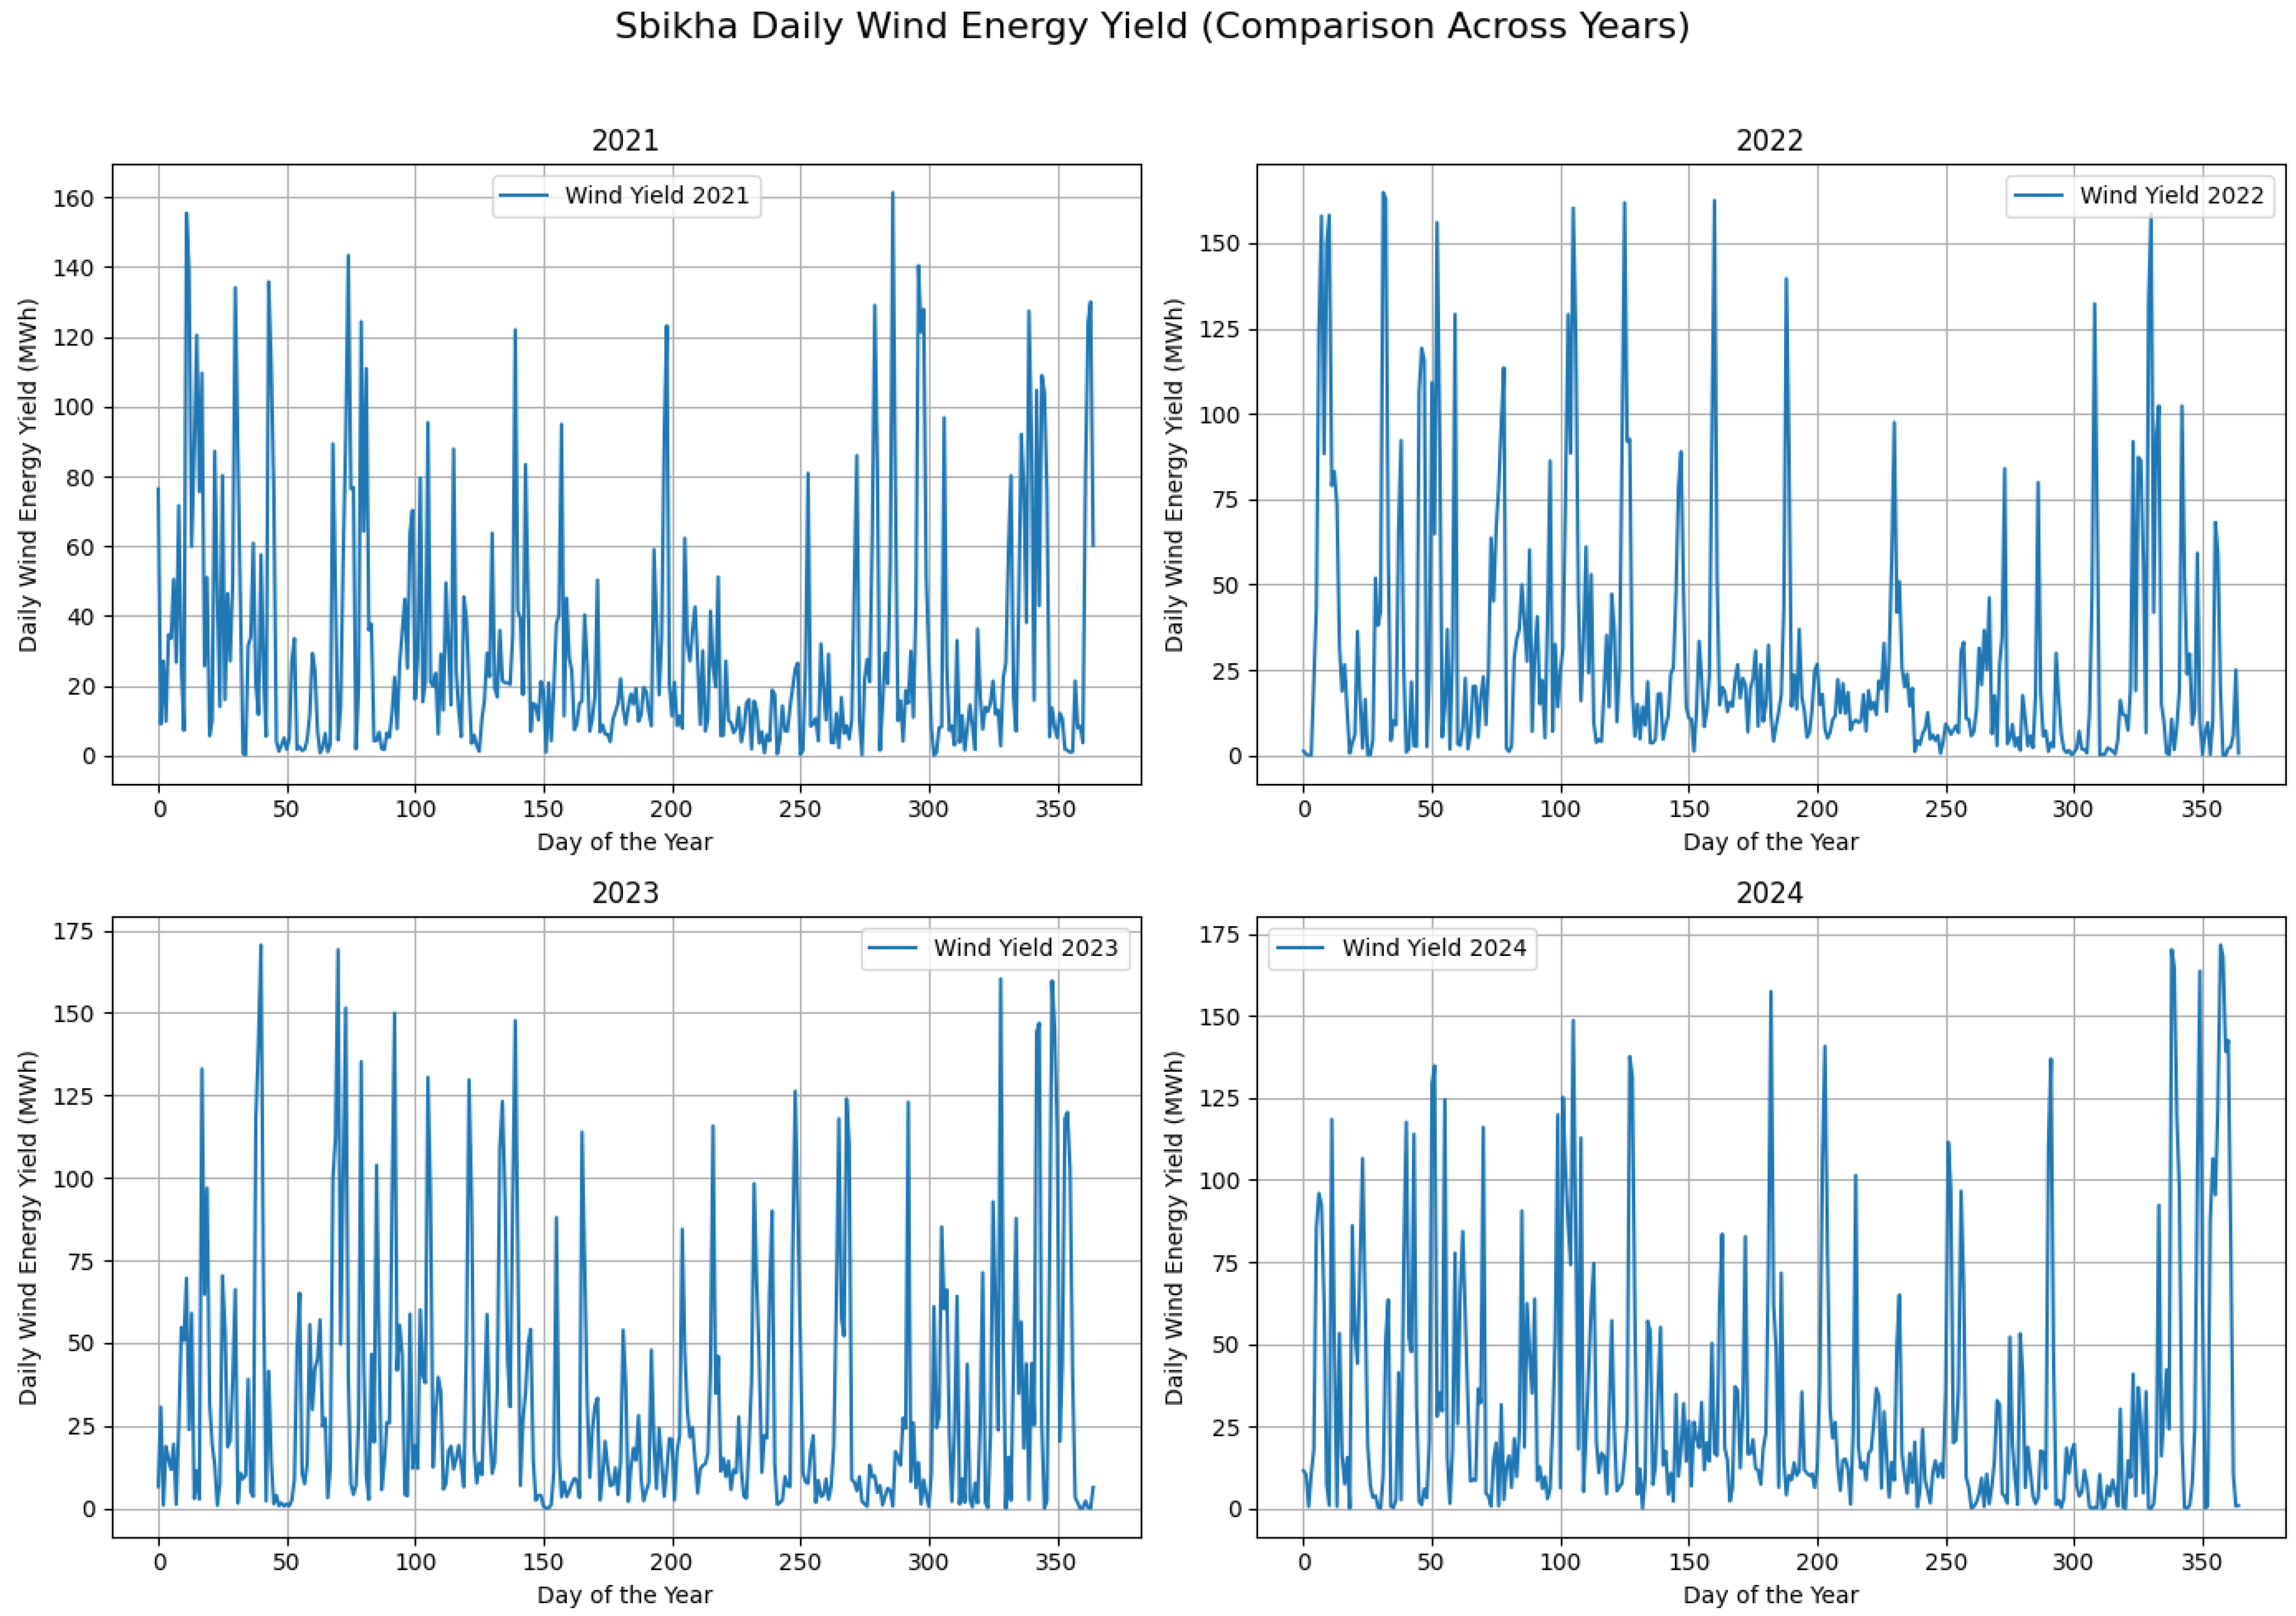
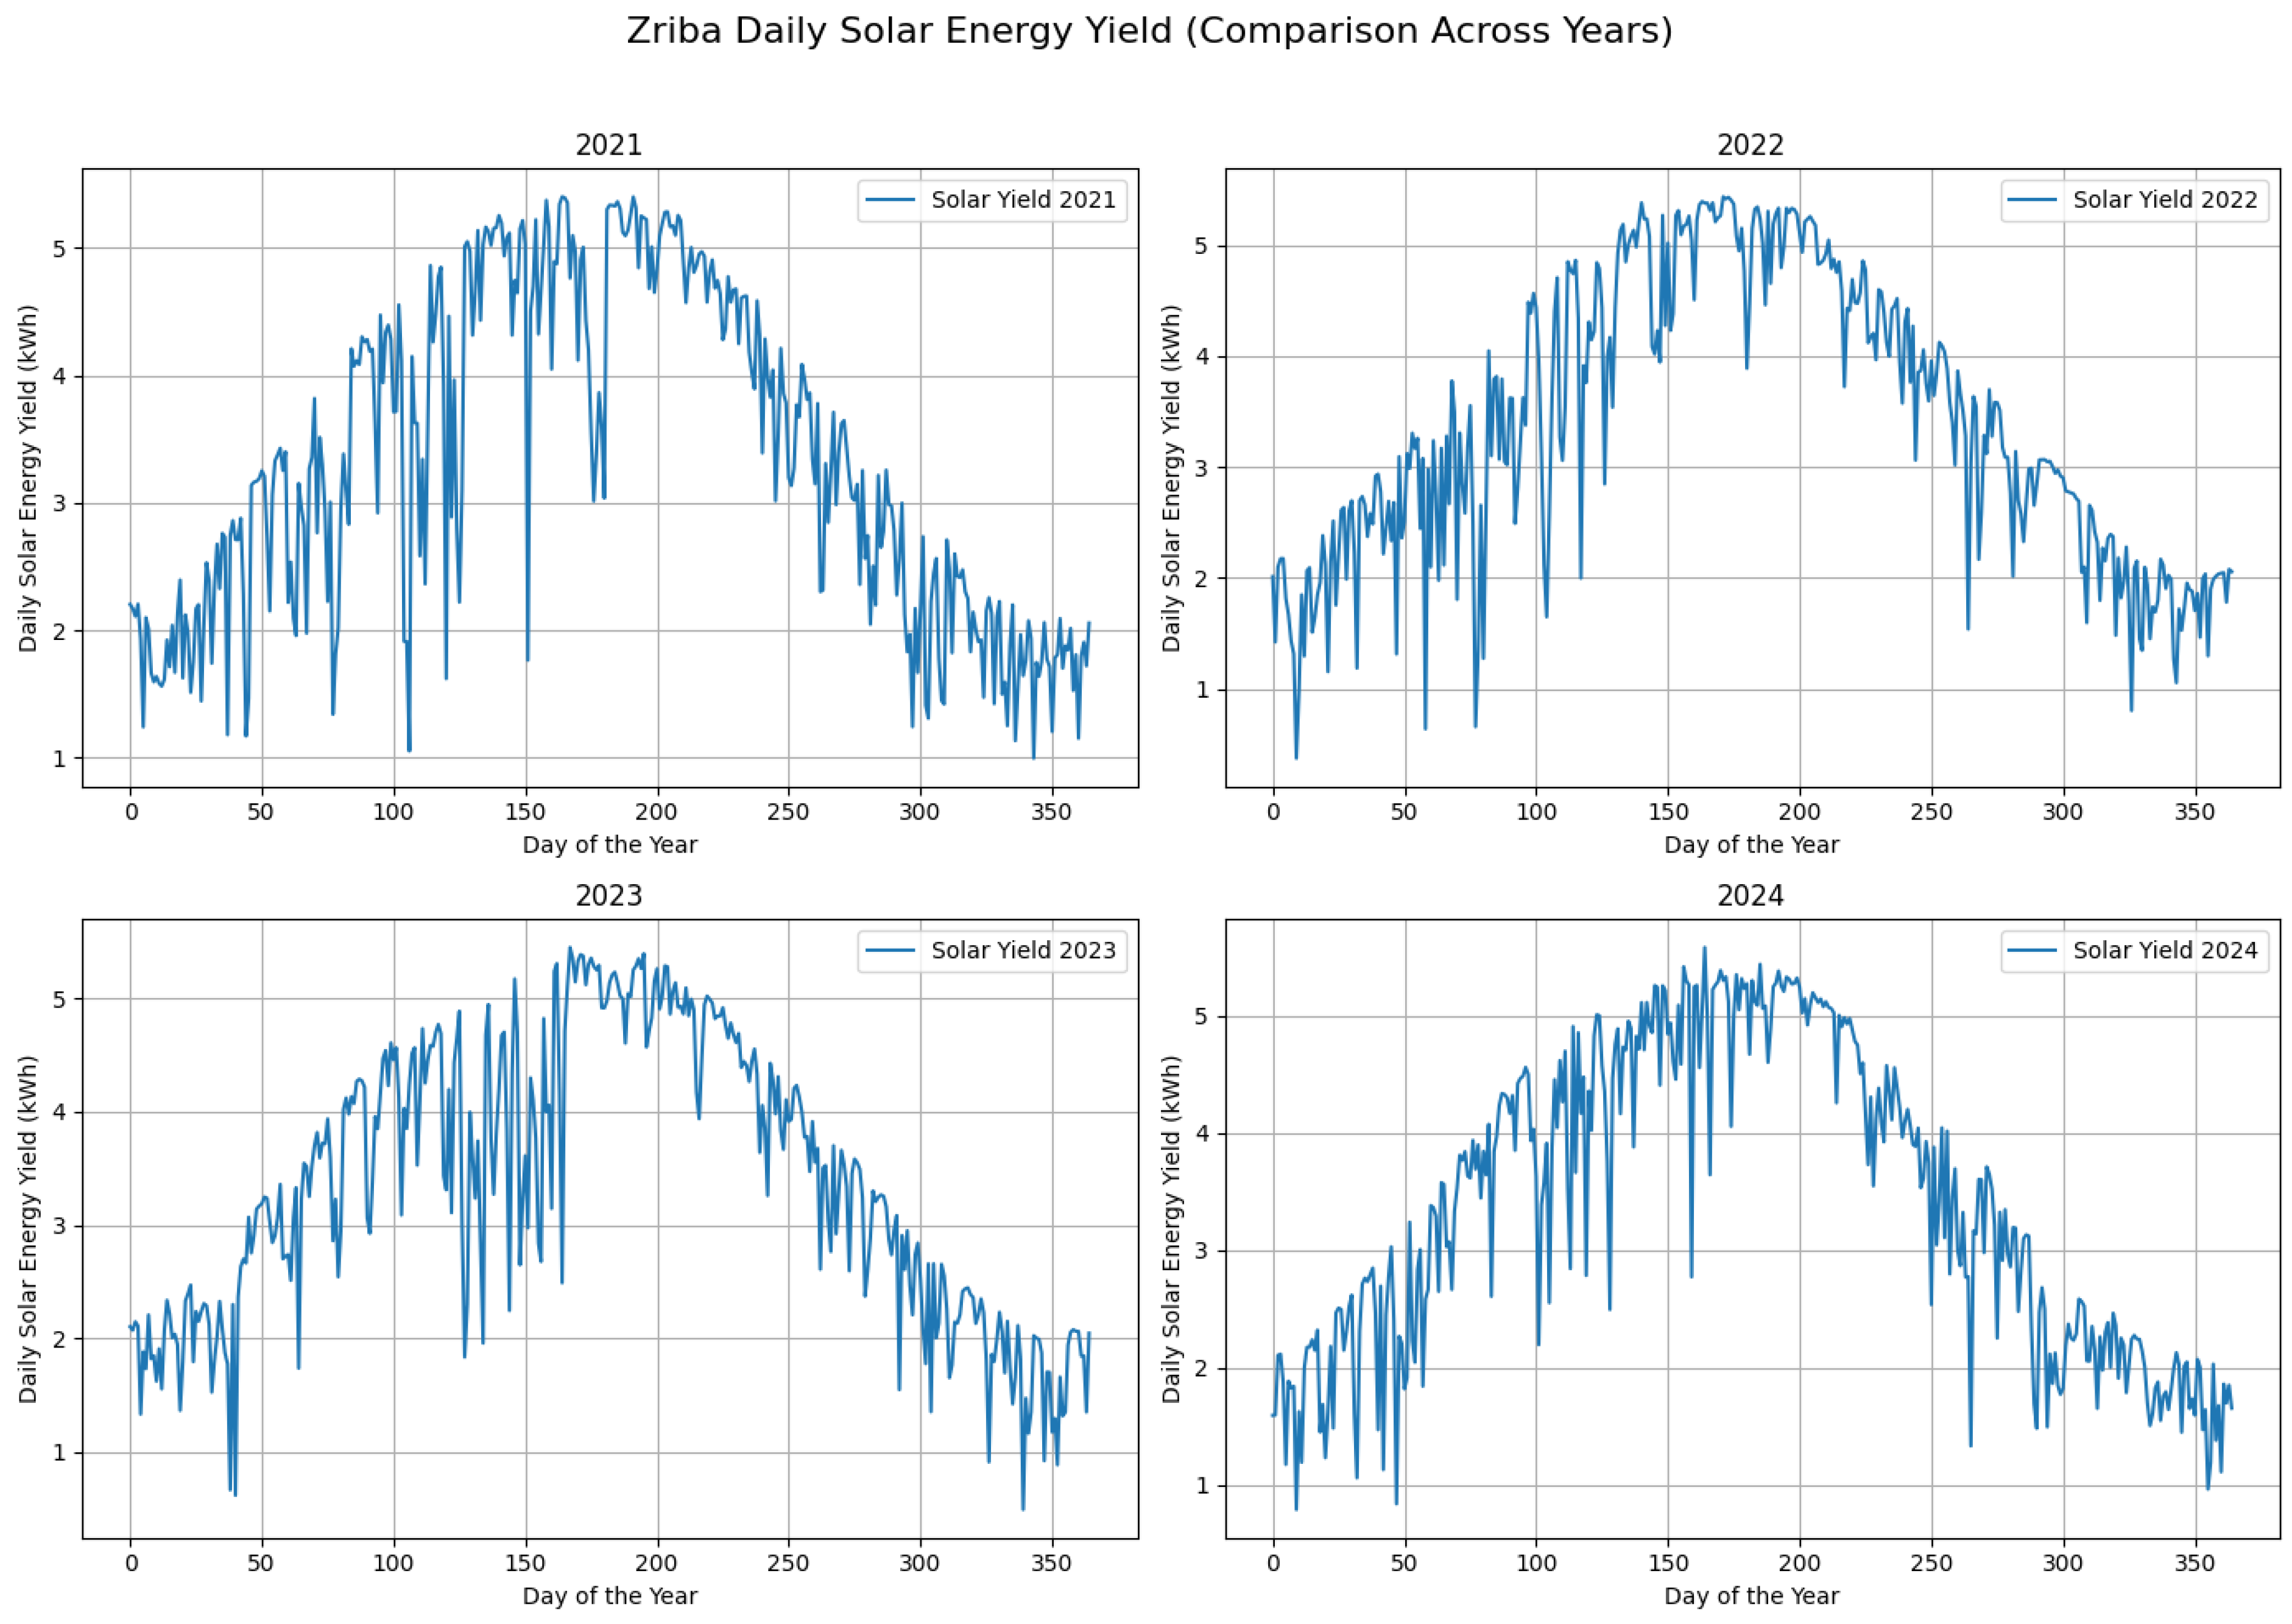
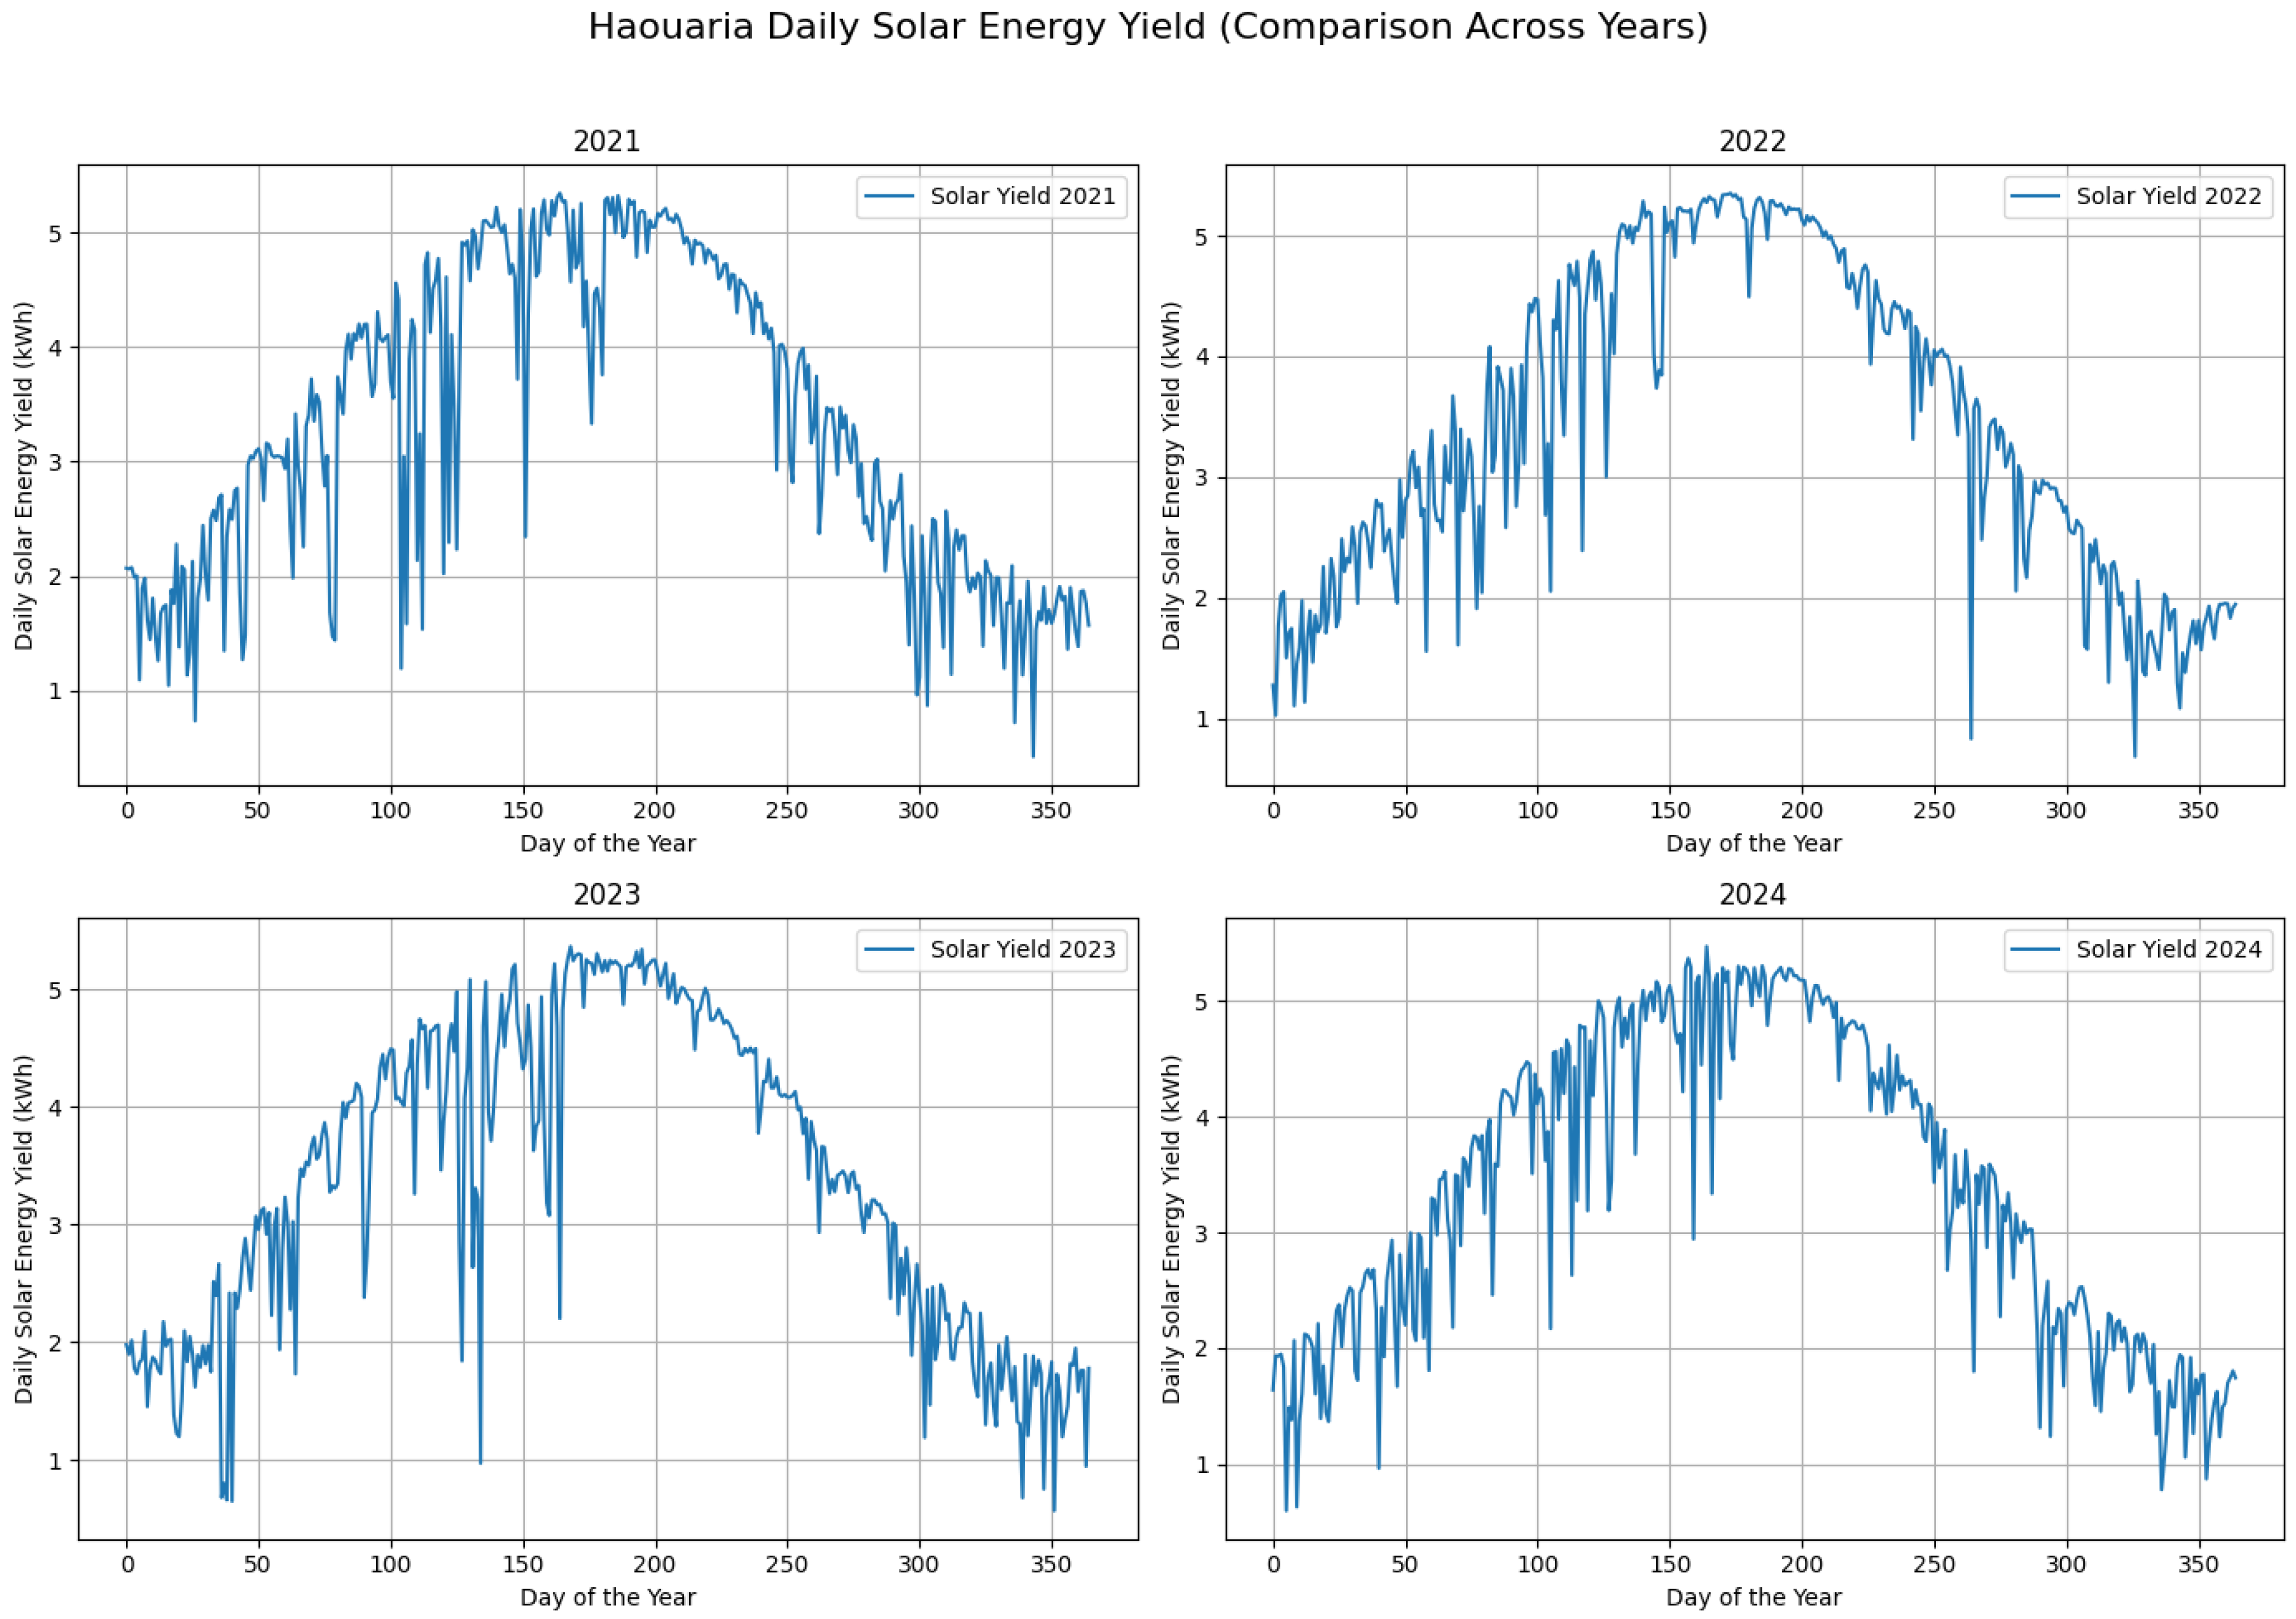
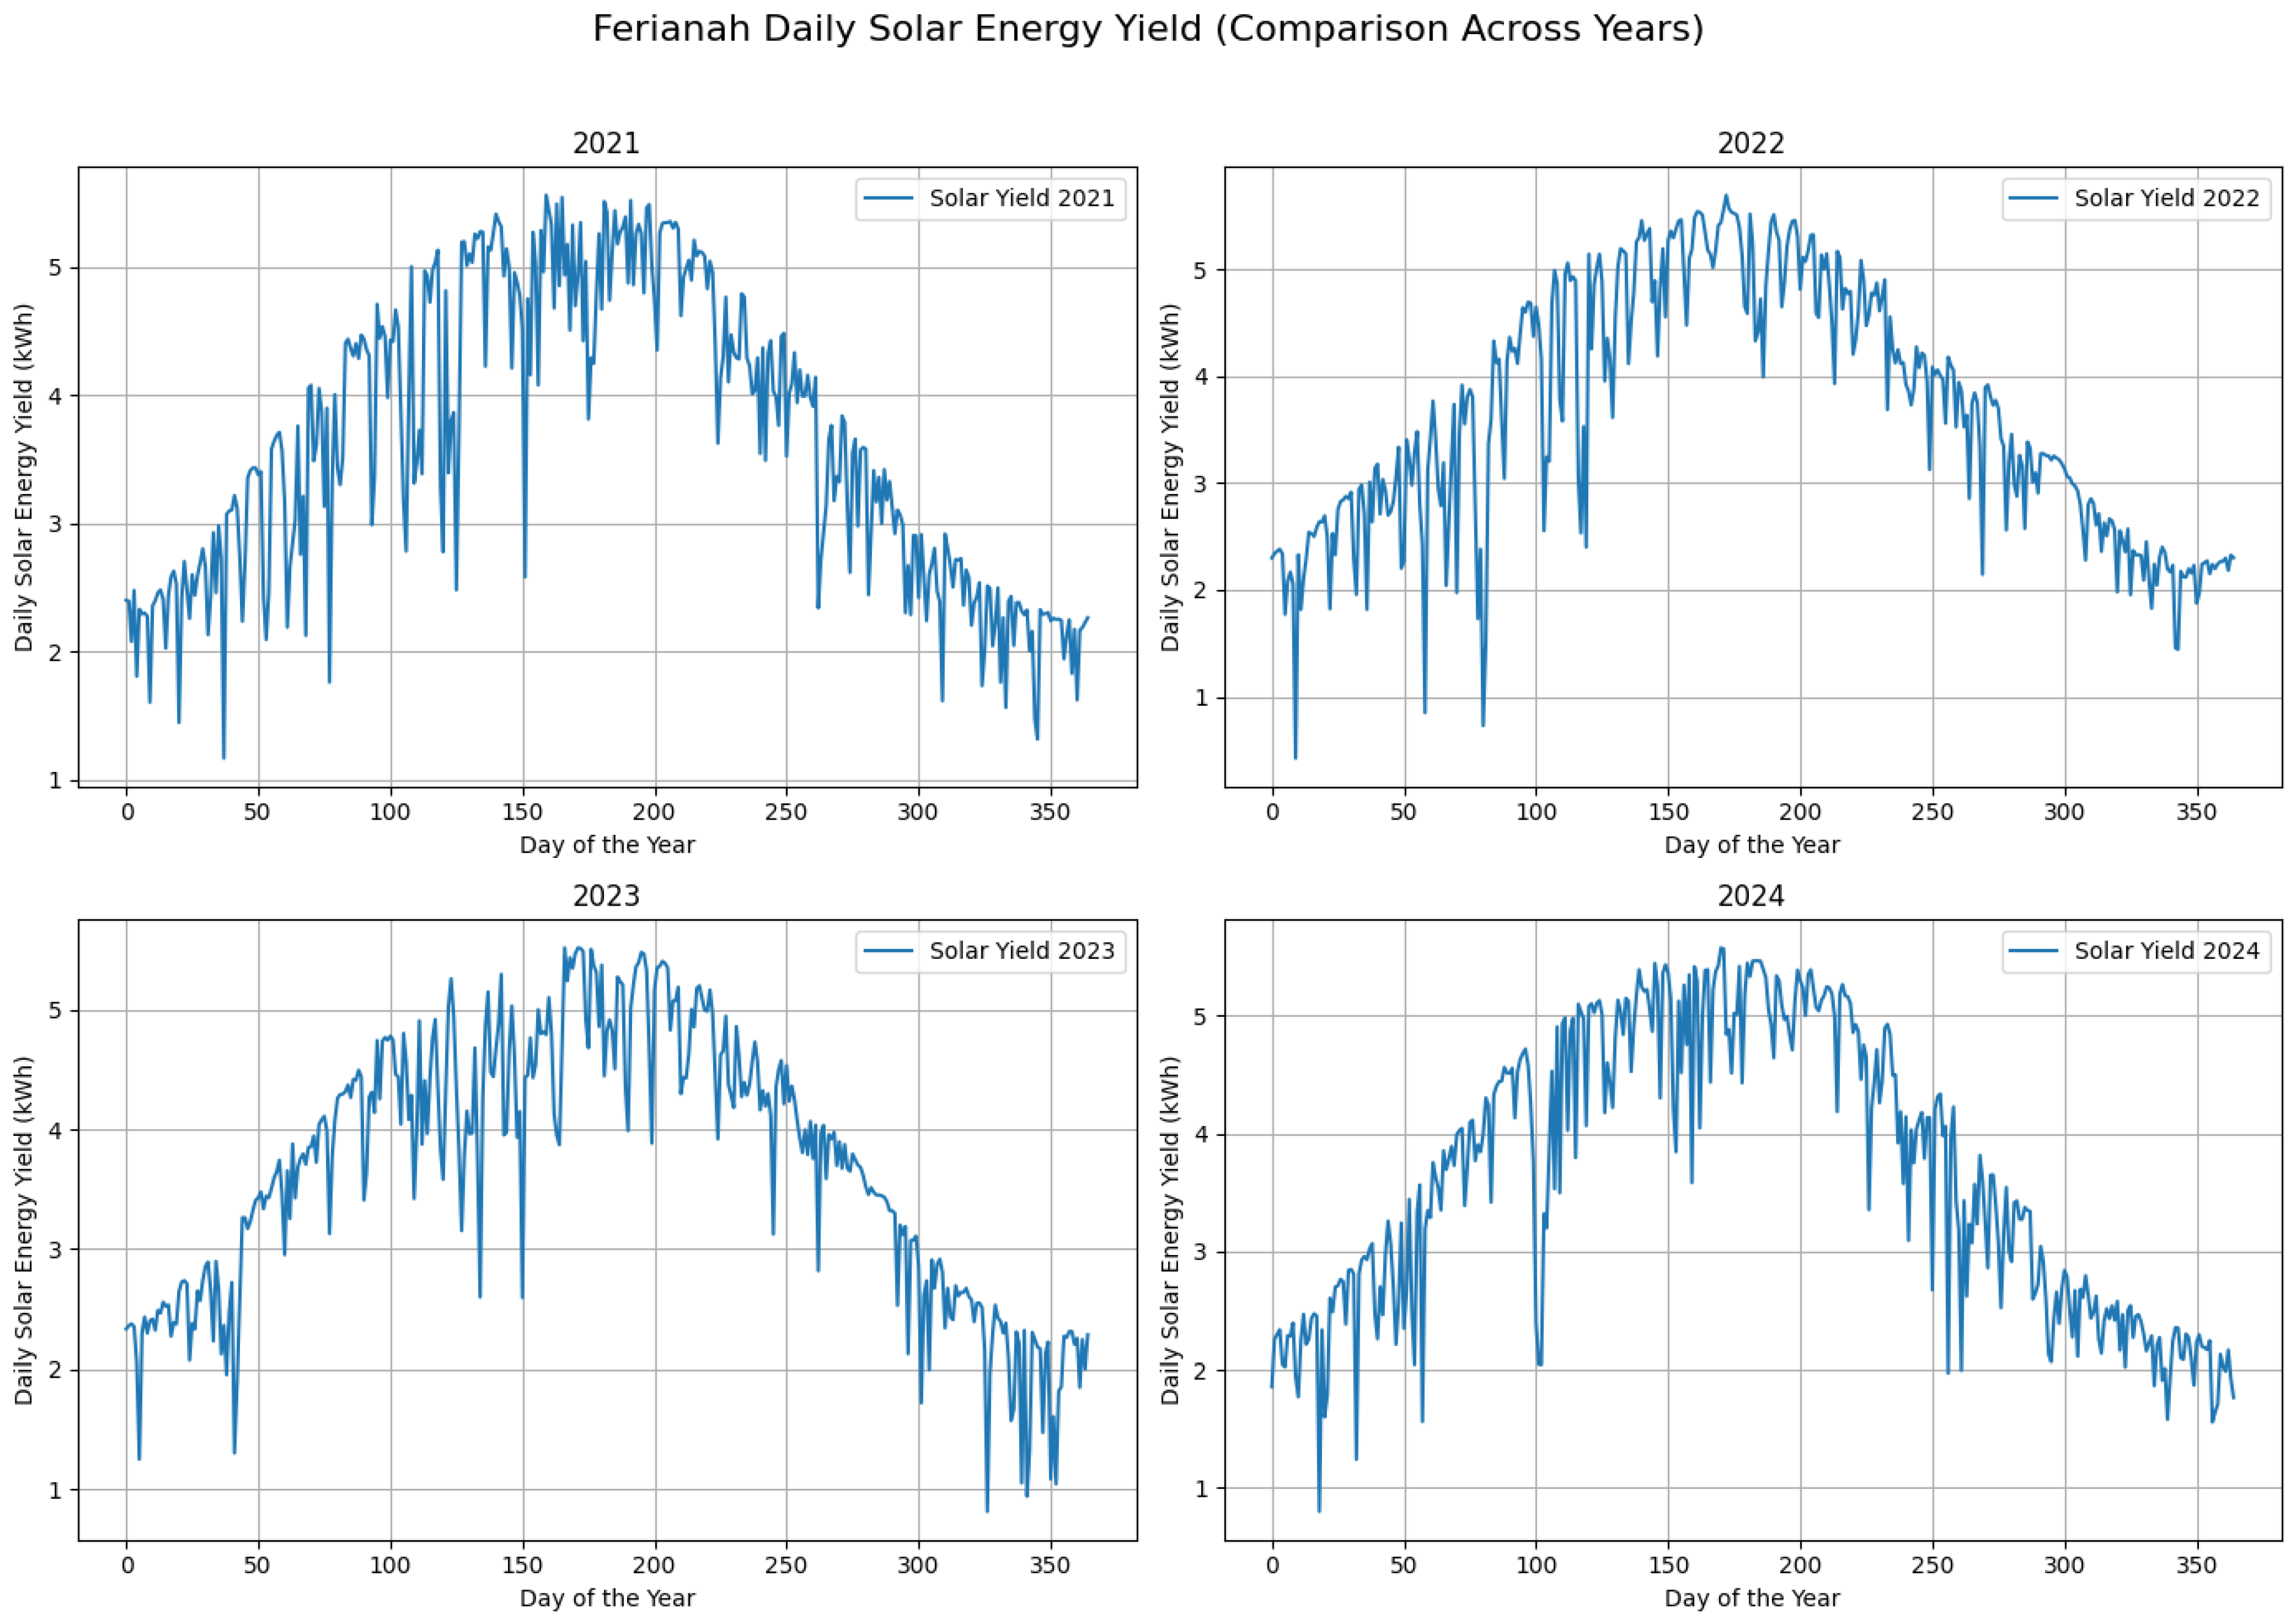
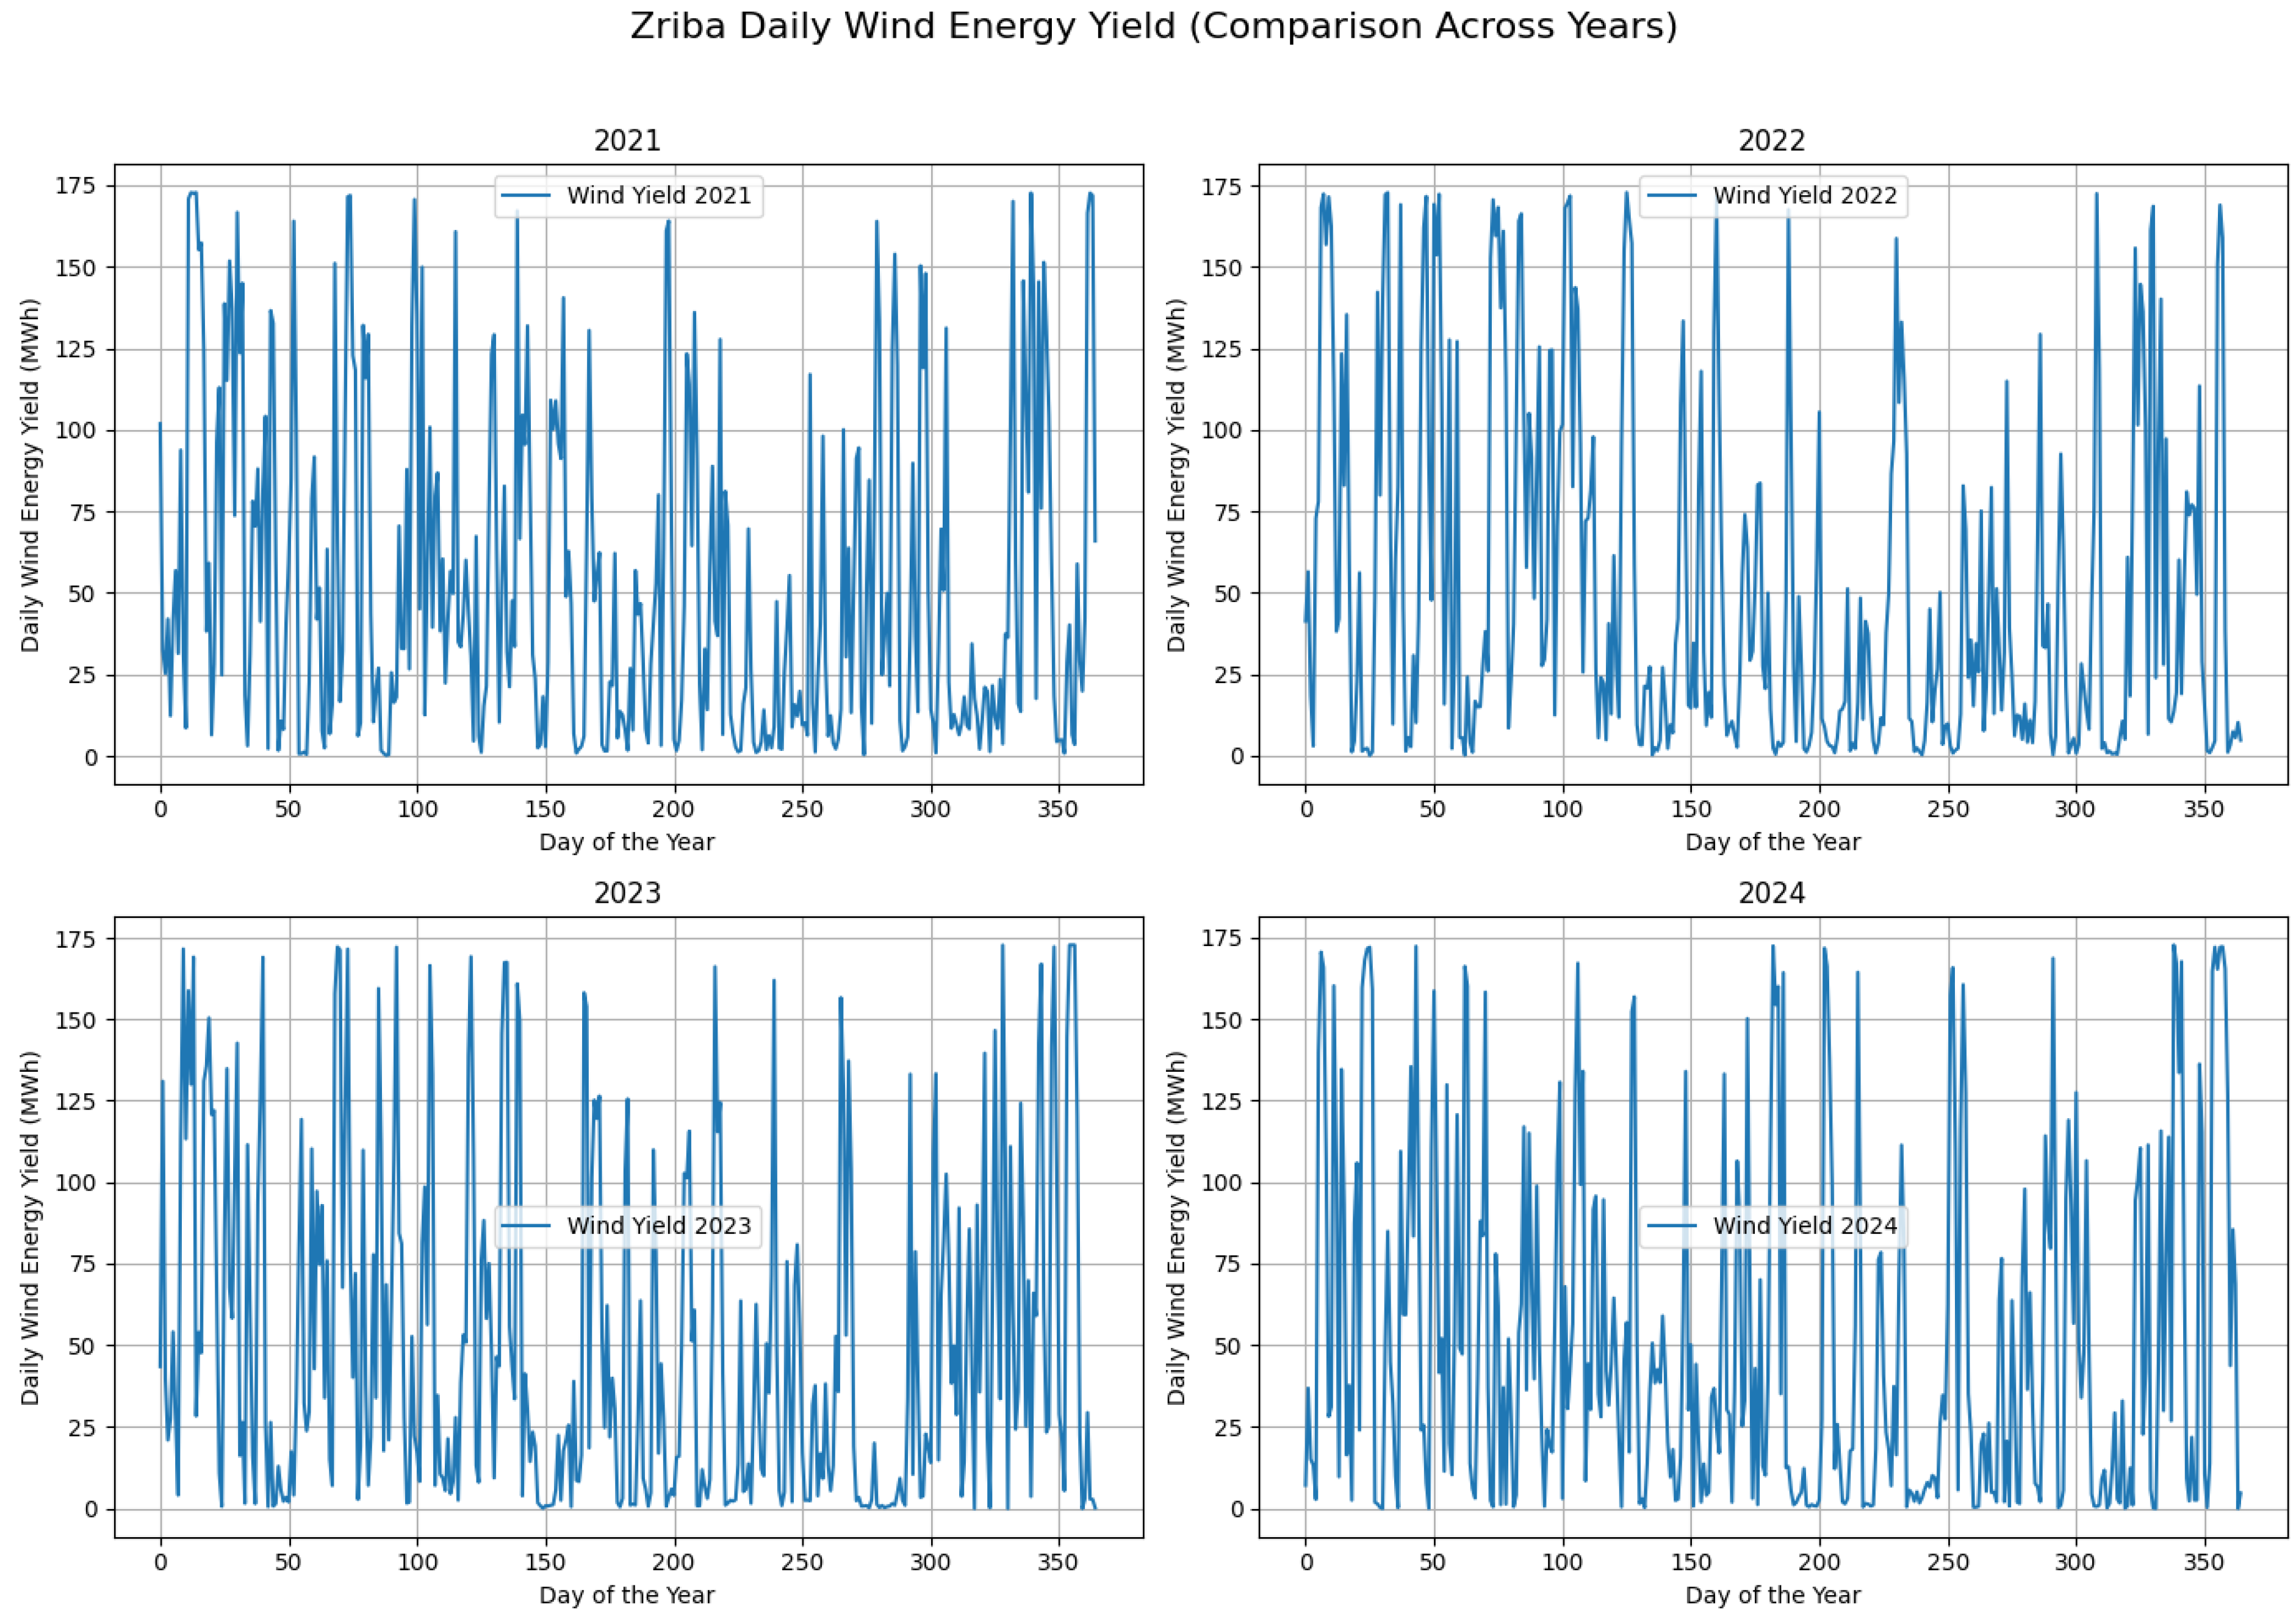
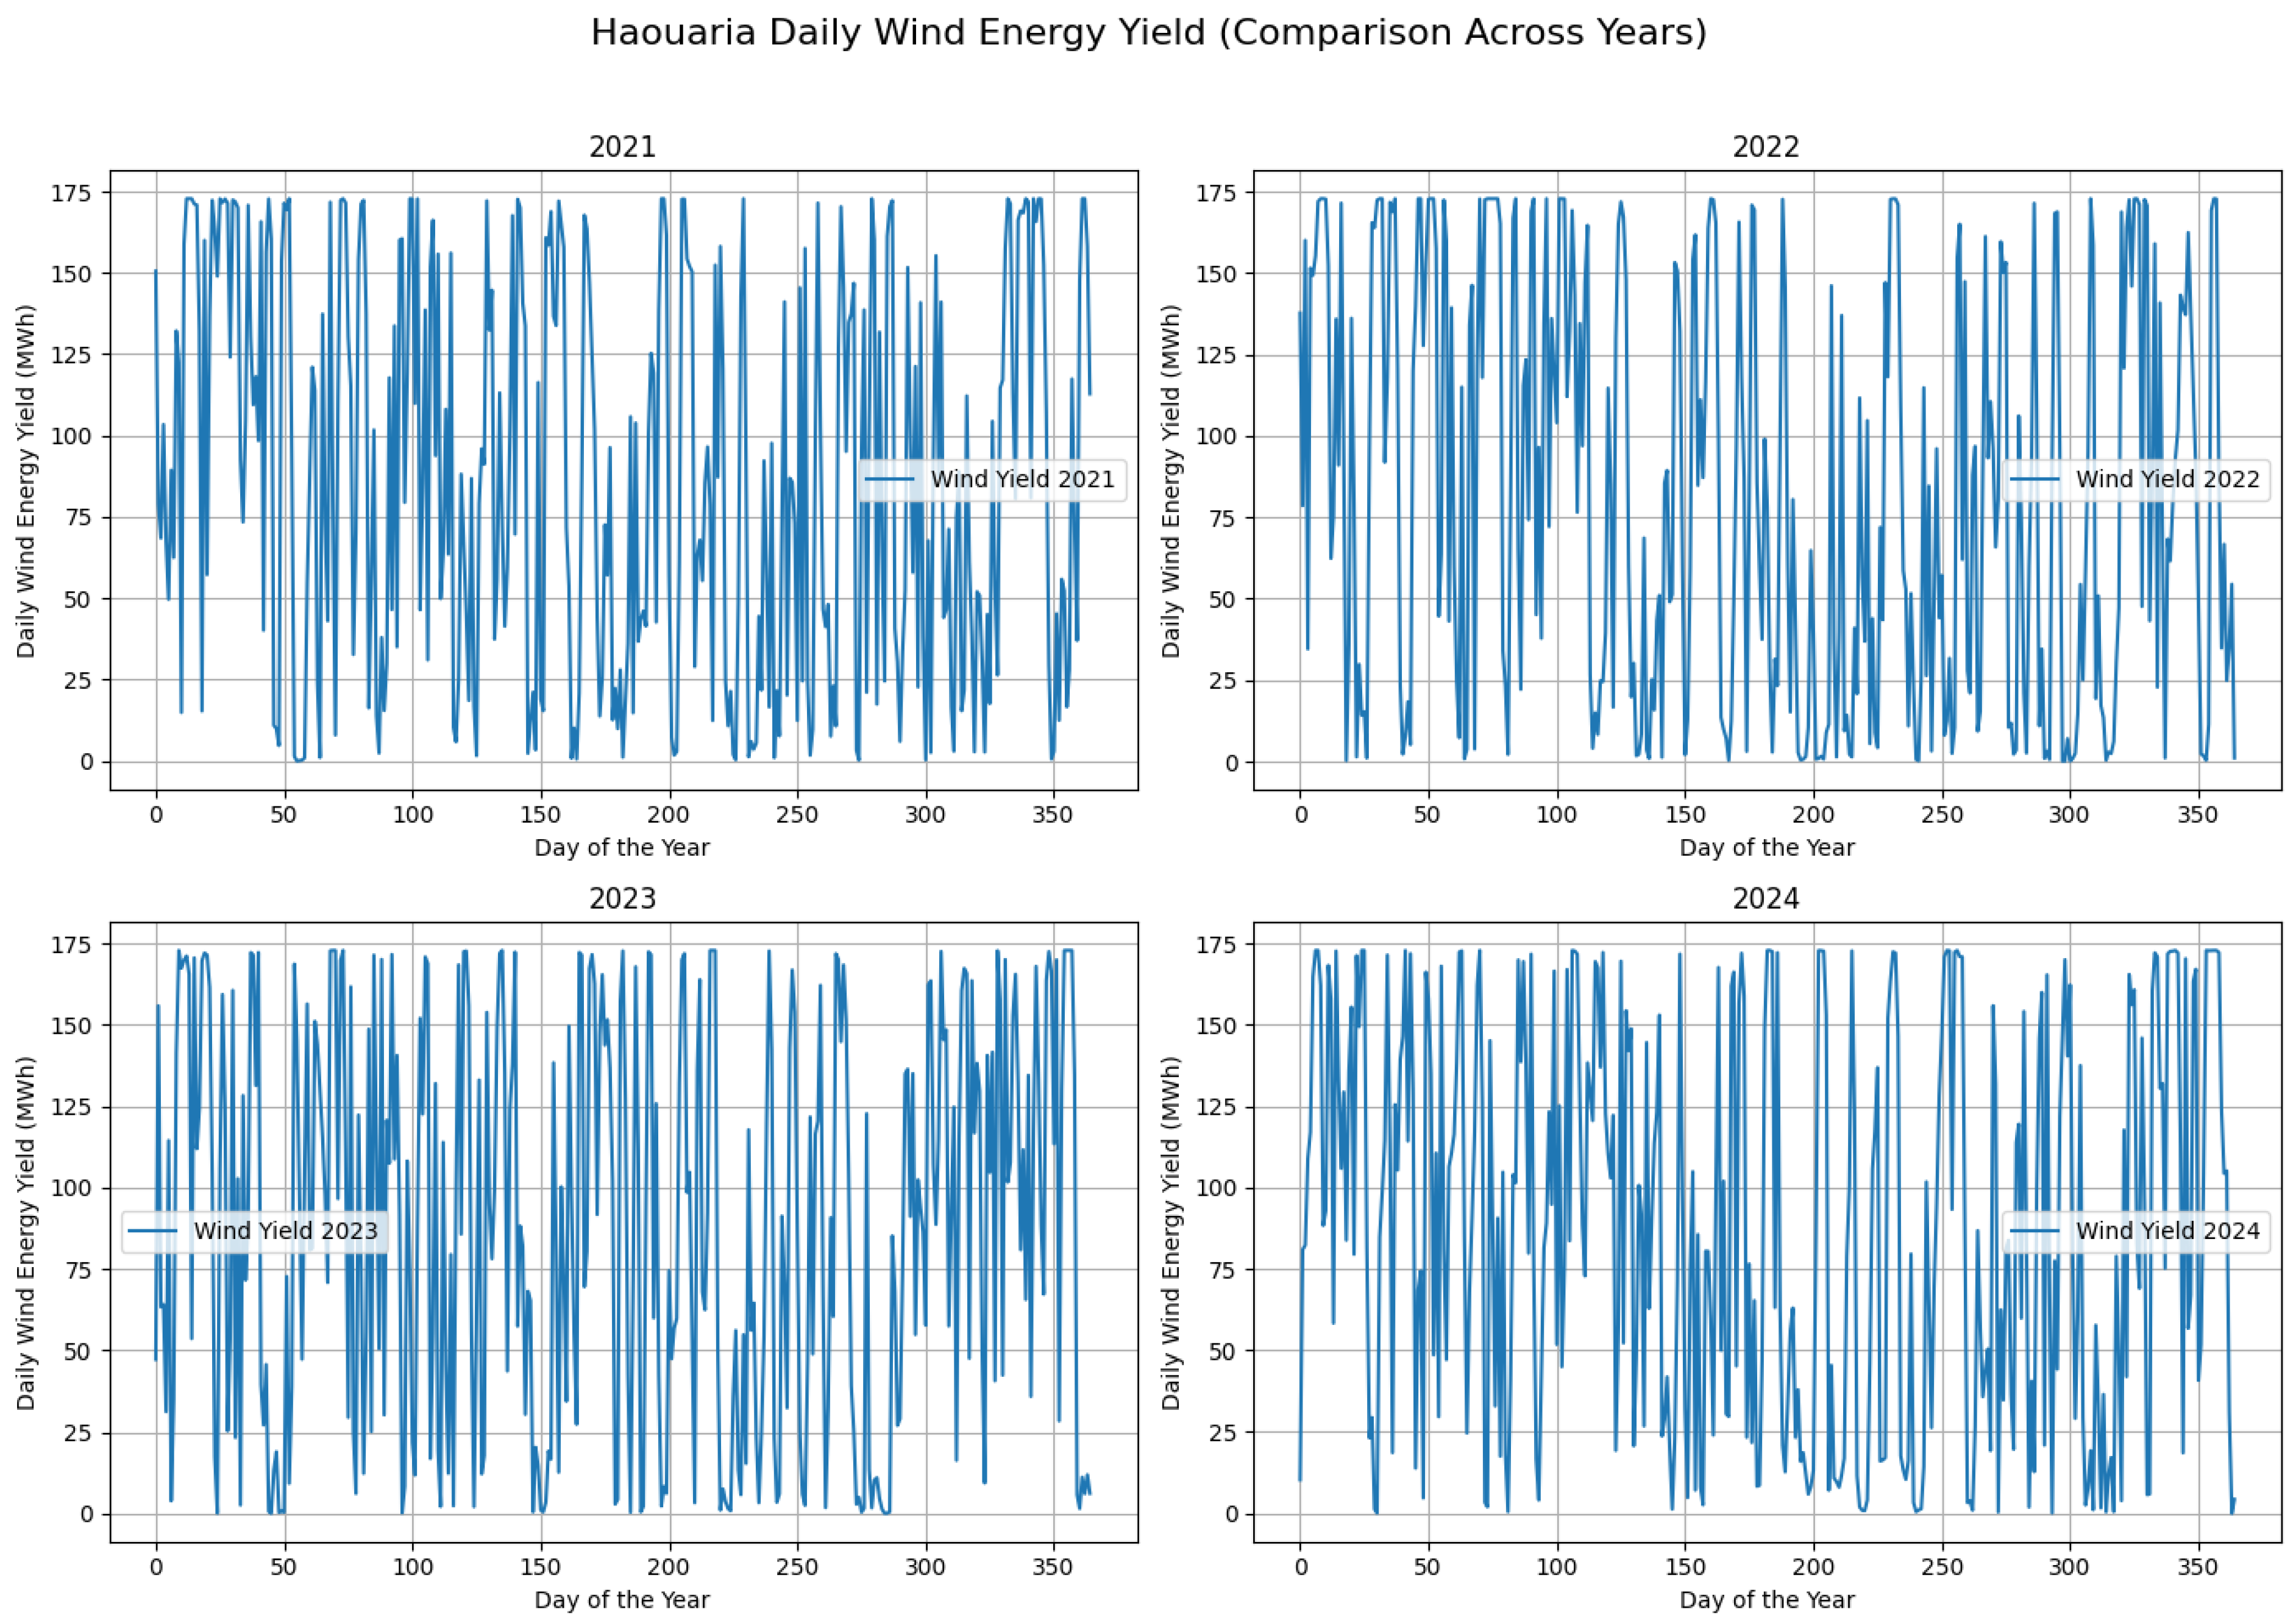
The solar and wind energy yields from 2021 to 2024 across the four selected locations (Figure A1, Figure A2, Figure A3, Figure A4, Figure A5, Figure A6, Figure A7 and Figure A8)—were analyzed using data collected from the Open-Meteo API for historical weather records [30]. Feriana, offering approximately 1500 hectares of available land, stands out for its stable and high solar output, especially during summer months. Wind performance is more irregular but still contributes effectively during spring and fall. Overall, Feriana is clearly suited for a solar-dominant configuration, with wind playing a smaller supporting role. Sbikha, with 500 hectares, shows slightly stronger and more consistent wind output than Feriana, while solar remains solid and regular. That makes Sbikha suitable for a mixed system, though solar would still take the lead in terms of capacity. Zriba, limited to 450 hectares, shows balanced performance in both solar and wind. Solar energy is reliable, and wind yield has good peaks despite noticeable fluctuations. Given the smaller land size, a balanced hybrid setup helps maximize energy production from the site. El Haouaria has the least space, approximately 200 hectares, but it clearly leads in wind energy. The wind output is both high and steady across the years. While solar is also consistent, the limited land and outstanding wind performance make wind the dominant choice here.
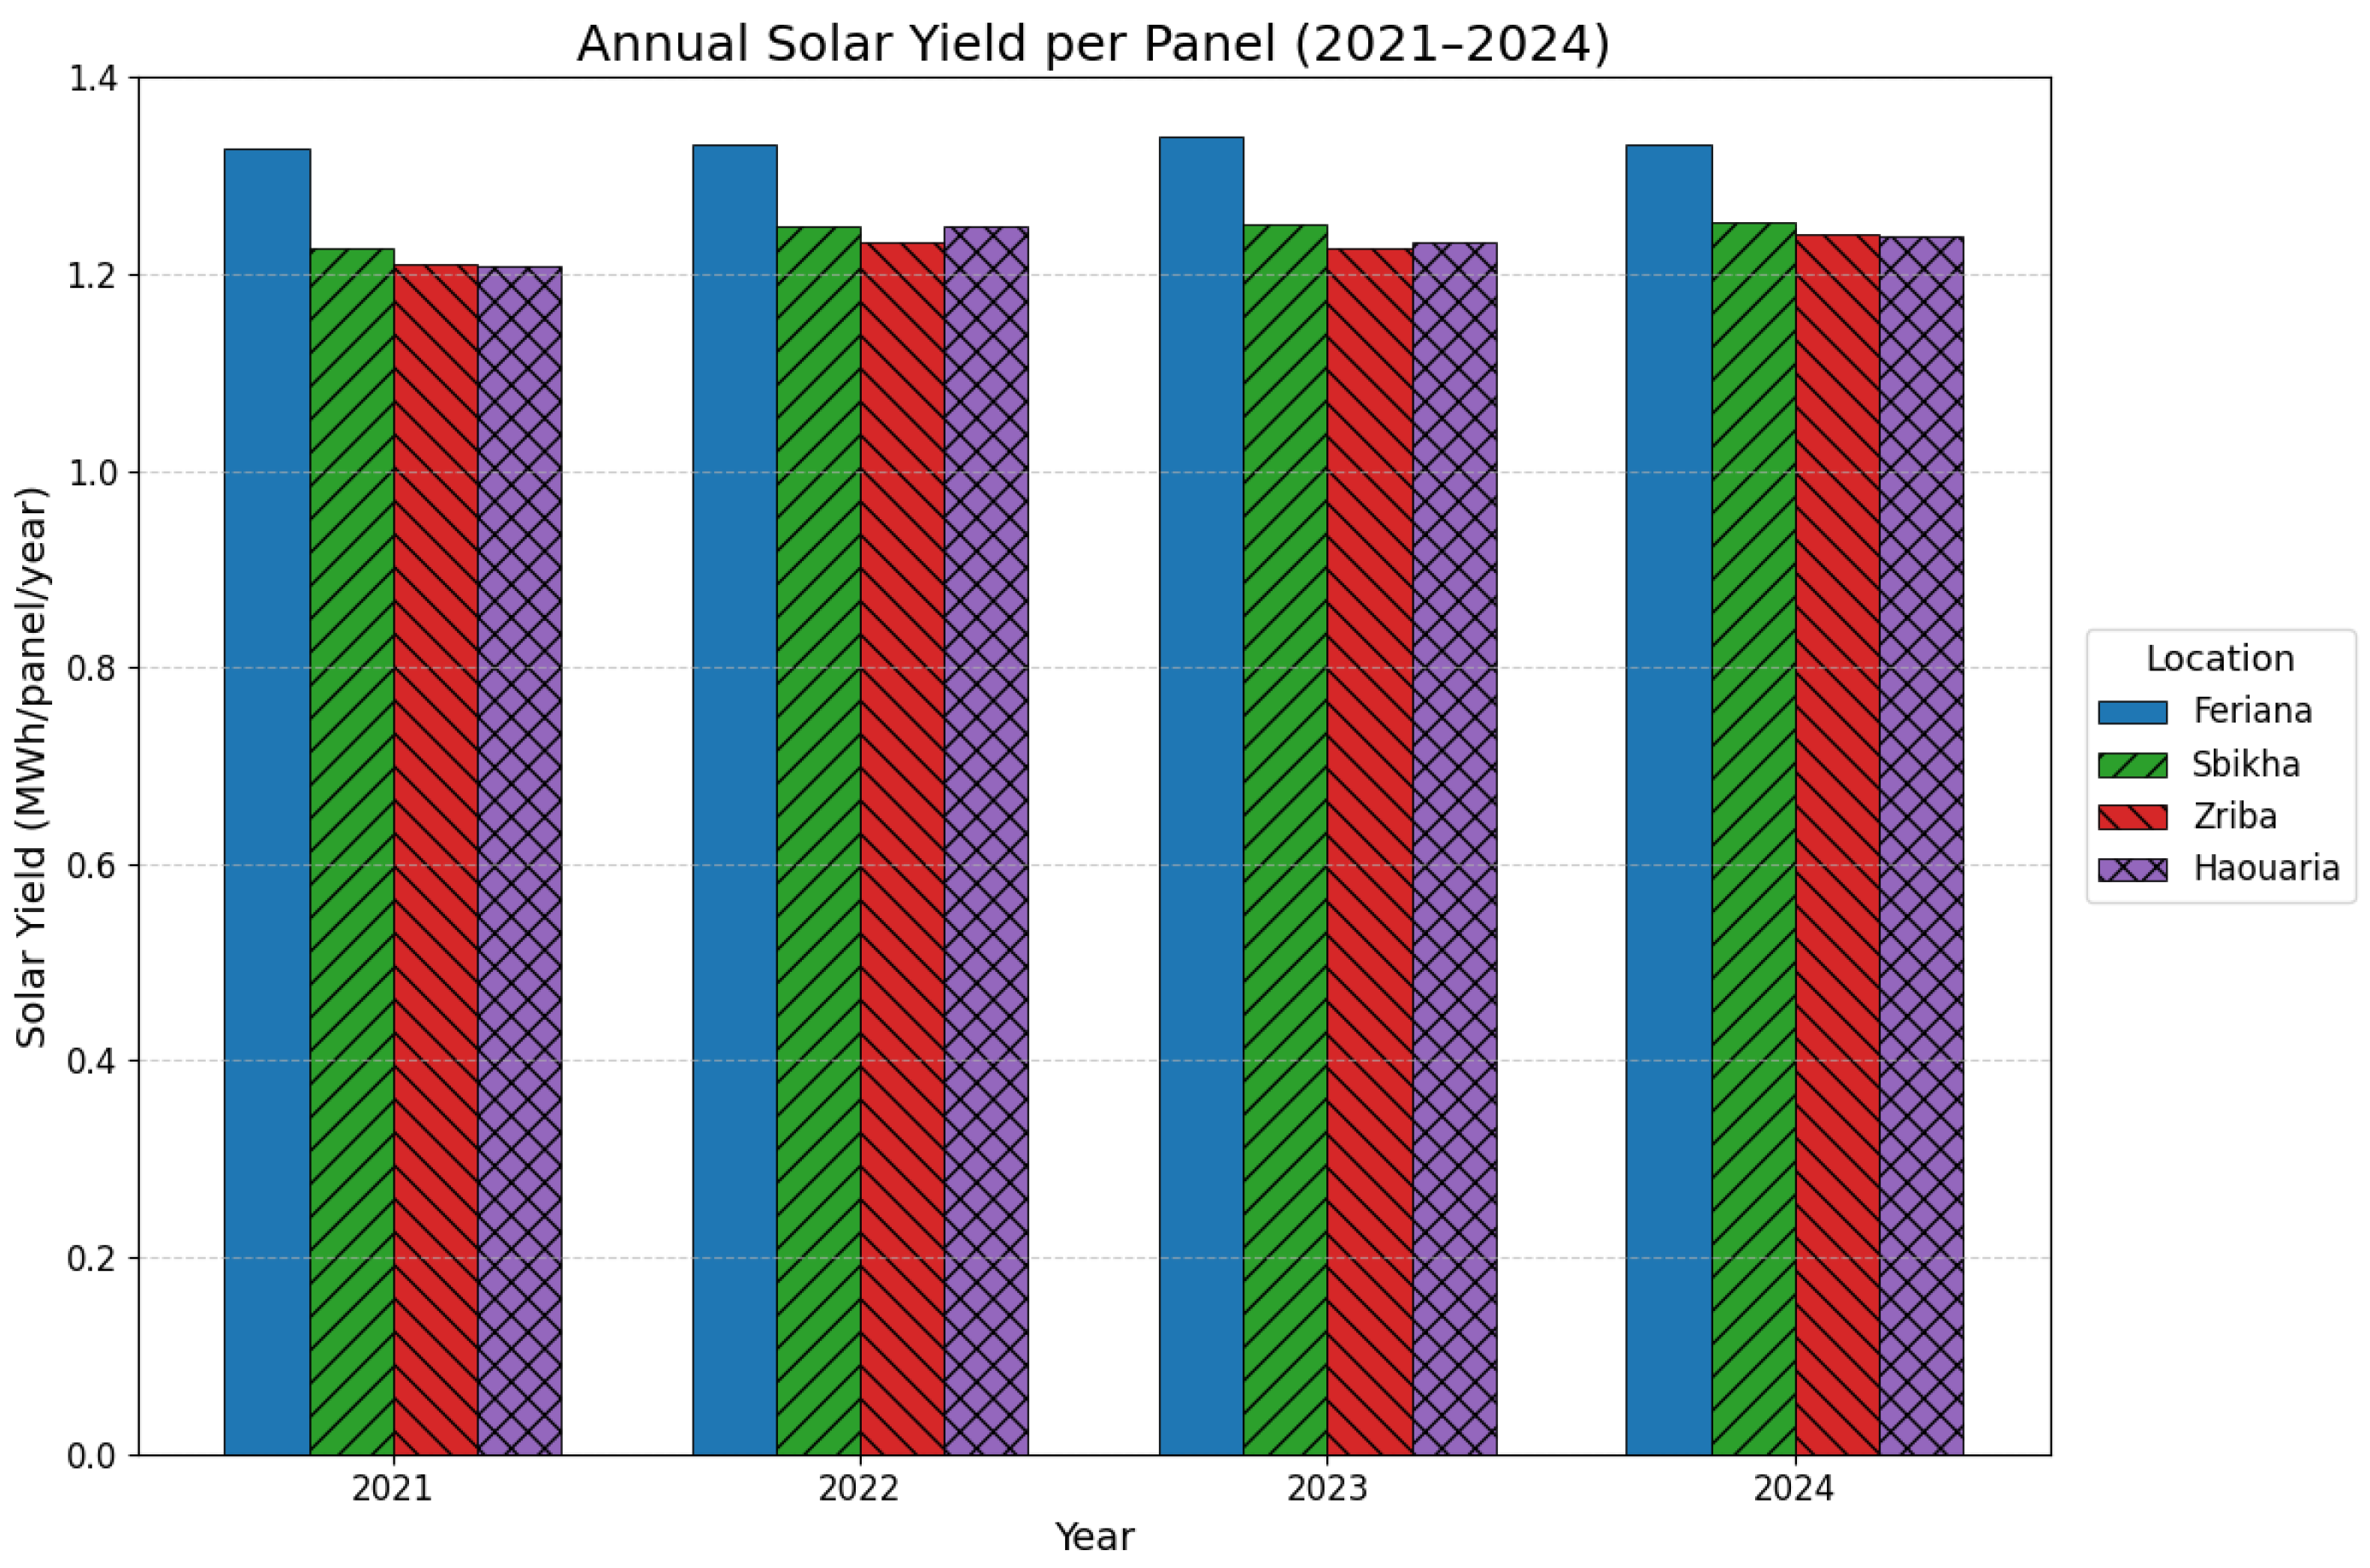
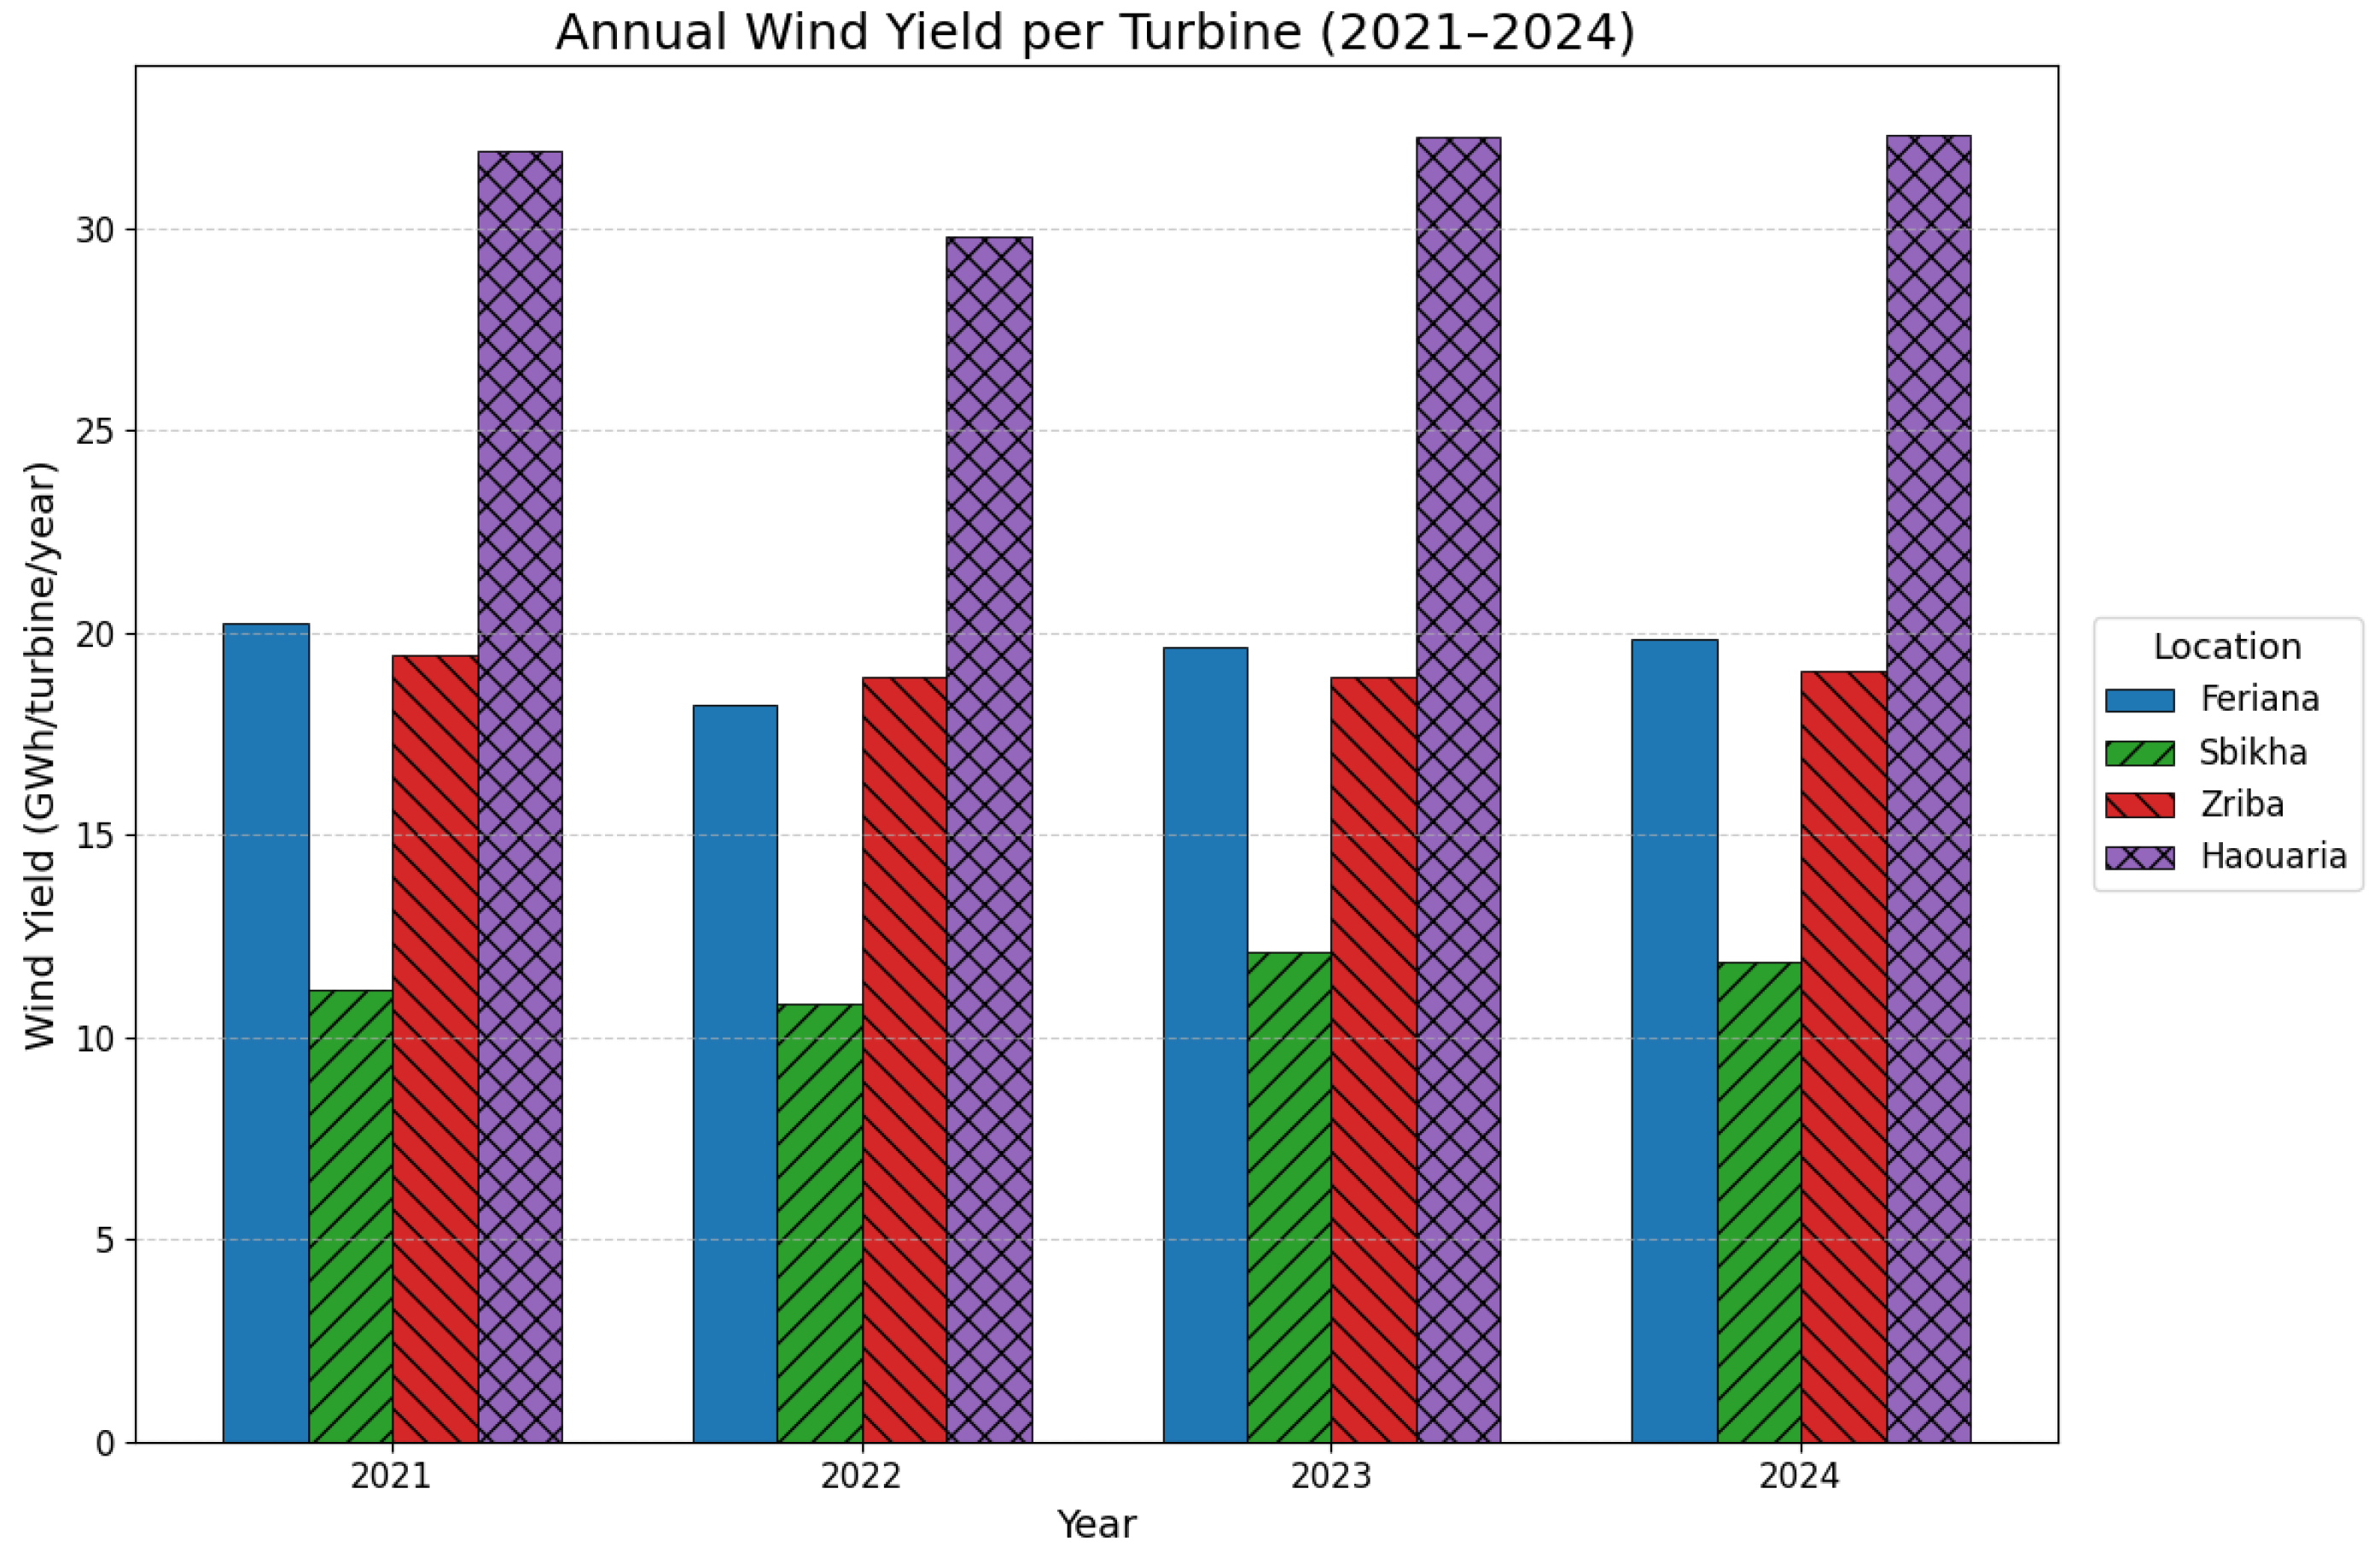
Figure 8 summarizes the annual energy yield per panel and Figure 9 provides the annual energy yield per wind turbine for each location between 2021 and 2024. These data provide a quantitative basis for comparing site performance and determining optimal configurations.
  • Feriana: With 1500 hectares of land and high solar yields (1.33 MWh/PV annually), Feriana anchors the system. Its wind potential (18–20 GWh/turbine) is strongest in non-summer months, offering seasonal complementarity that enables reliable, year-round production.
  • Sbikha: Wind yields average just 11 GWh/turbine, significantly lower than other sites. With steady solar output (1.25 MWh/PV) and 500 hectares available, Sbikha is best suited for solar-only deployment to maximize land efficiency.
  • Zriba: Though limited to 450 hectares, Zriba supports both solar (1.23 MWh/PV) and wind (18.9 GWh/turbine). A well-balanced hybrid setup is needed to exploit its space efficiently and maintain steady annual output.
  • Haouaria: With exceptional wind yields (29–32 GWh/turbine) and just 100–200 hectares of land, Haouaria is a wind-centric site. Its high wind consistency justifies full specialization in wind energy.
These findings, averaged over four years, serve as a benchmark to estimate the energy yield of each technology. They are later used to calculate the total hydrogen production by multiplying the per-unit annual yield by the estimated number of installed units and the project lifetime, forming the basis for LCOH evaluation.

3.3. Energy Evaluation Setup

Following the energy yield analysis, the focus is on translating the site-specific solar and wind potential into concrete energy configurations. Using the previously calculated unit energy outputs, shown in Figure 8 and Figure 9, along with land availability constraints and cost parameters, an optimization procedure was conducted to determine the most efficient allocation of PV panels and wind turbines across the four selected sites.
Rather than adopting a uniform strategy, the optimization considered each site’s land capacity, resource quality, and economic impact to minimize the overall LCOH. This process provided a tailored configuration for each location, specifying the number of PV panels and wind turbines to be installed in order to maximize hydrogen production while ensuring cost-efficiency and land sustainability.
The optimization results determine the optimal number of PV panels and wind turbines that can be deployed at each site while satisfying land and cost constraints. The site-dependent inputs, namely solar yield, wind yield, and available land, are summarized in Table 2. The remaining parameters are treated as fixed across all locations: the PV system is represented by 720 W modules with a unit cost of 280$/panel and a land footprint of 0.0006 ha/panel, while the wind system is represented by 7.2 MW onshore turbines with a unit cost of 6 M$/turbine and a land footprint of 5 ha/turbine. The electrolyzer cost is set to 800$/kW, and additional system costs are assumed to represent 25% of the total capital cost. Annual operation and maintenance costs are fixed at 2% of the corresponding capital cost for all technologies, including PV systems, wind turbines, and electrolyzers.

3.4. Overall Integration and Outcomes

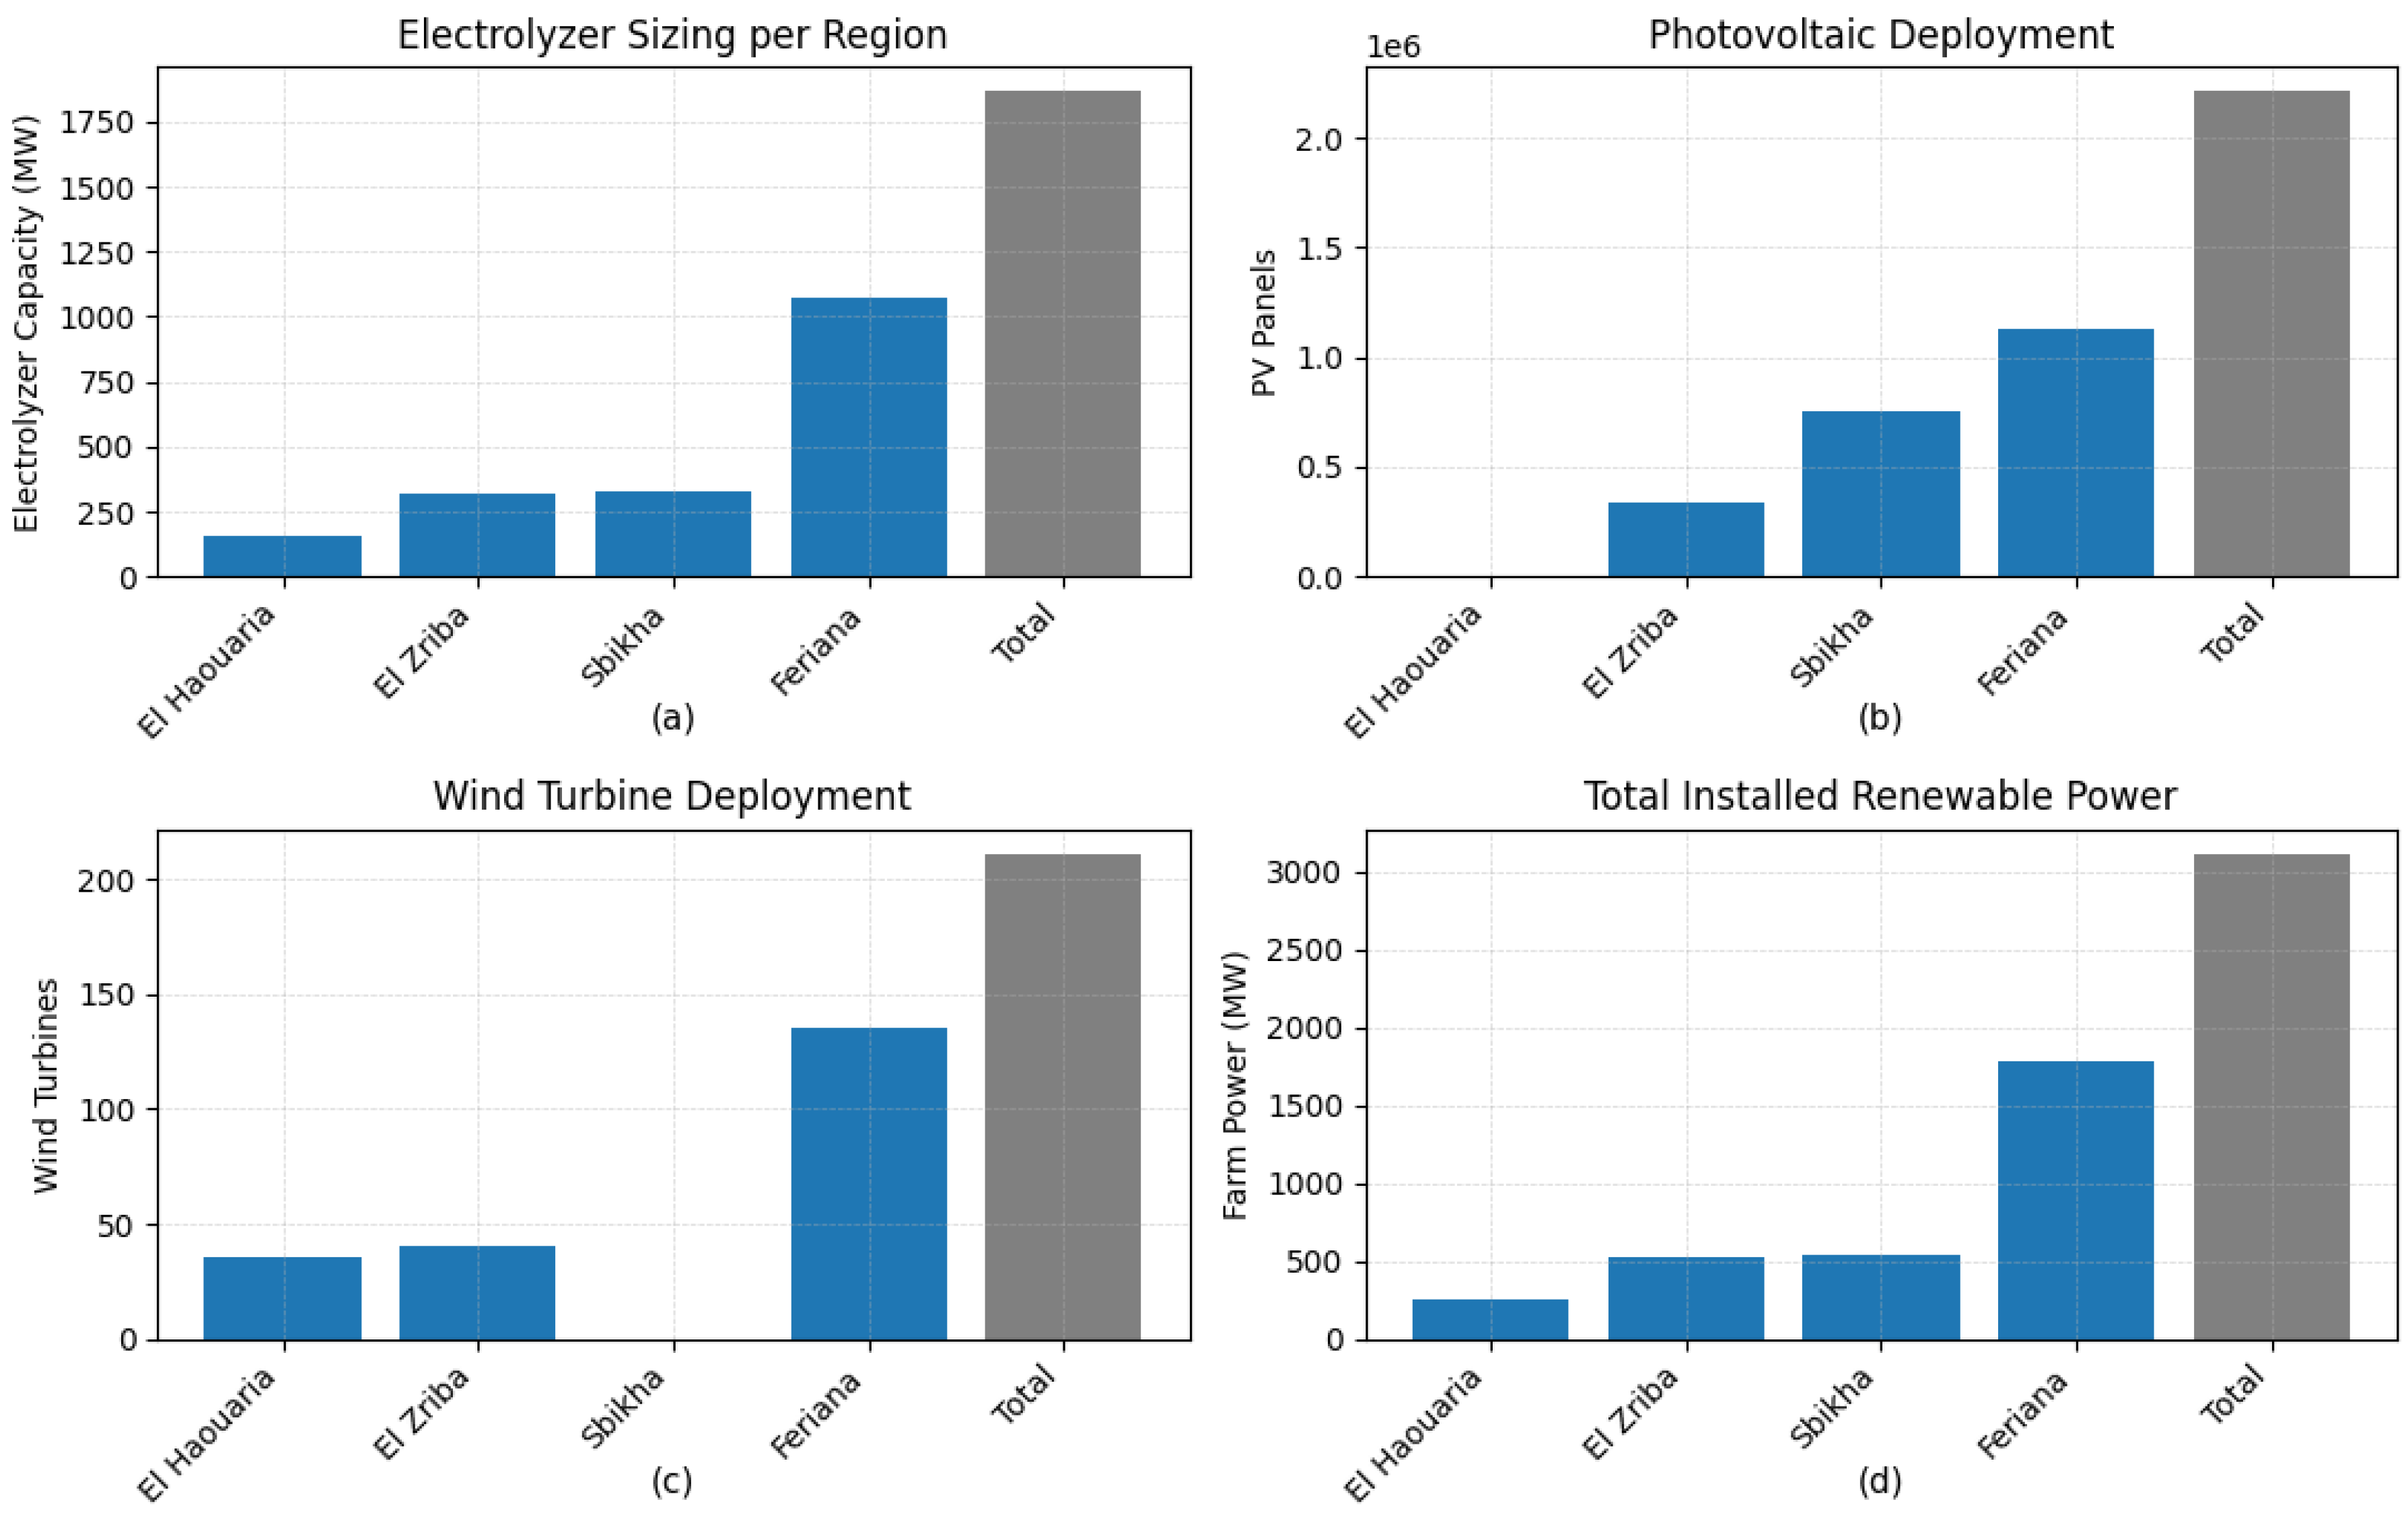
The analysis of hydrogen production and renewable energy integration across the four selected locations yields the following results. The calculations consider land availability, renewable energy yields, and system costs. The following results report the number of PV panels, the number of wind turbines, the farm power, the electrolyzer capacity, and the LCOH values for each location.
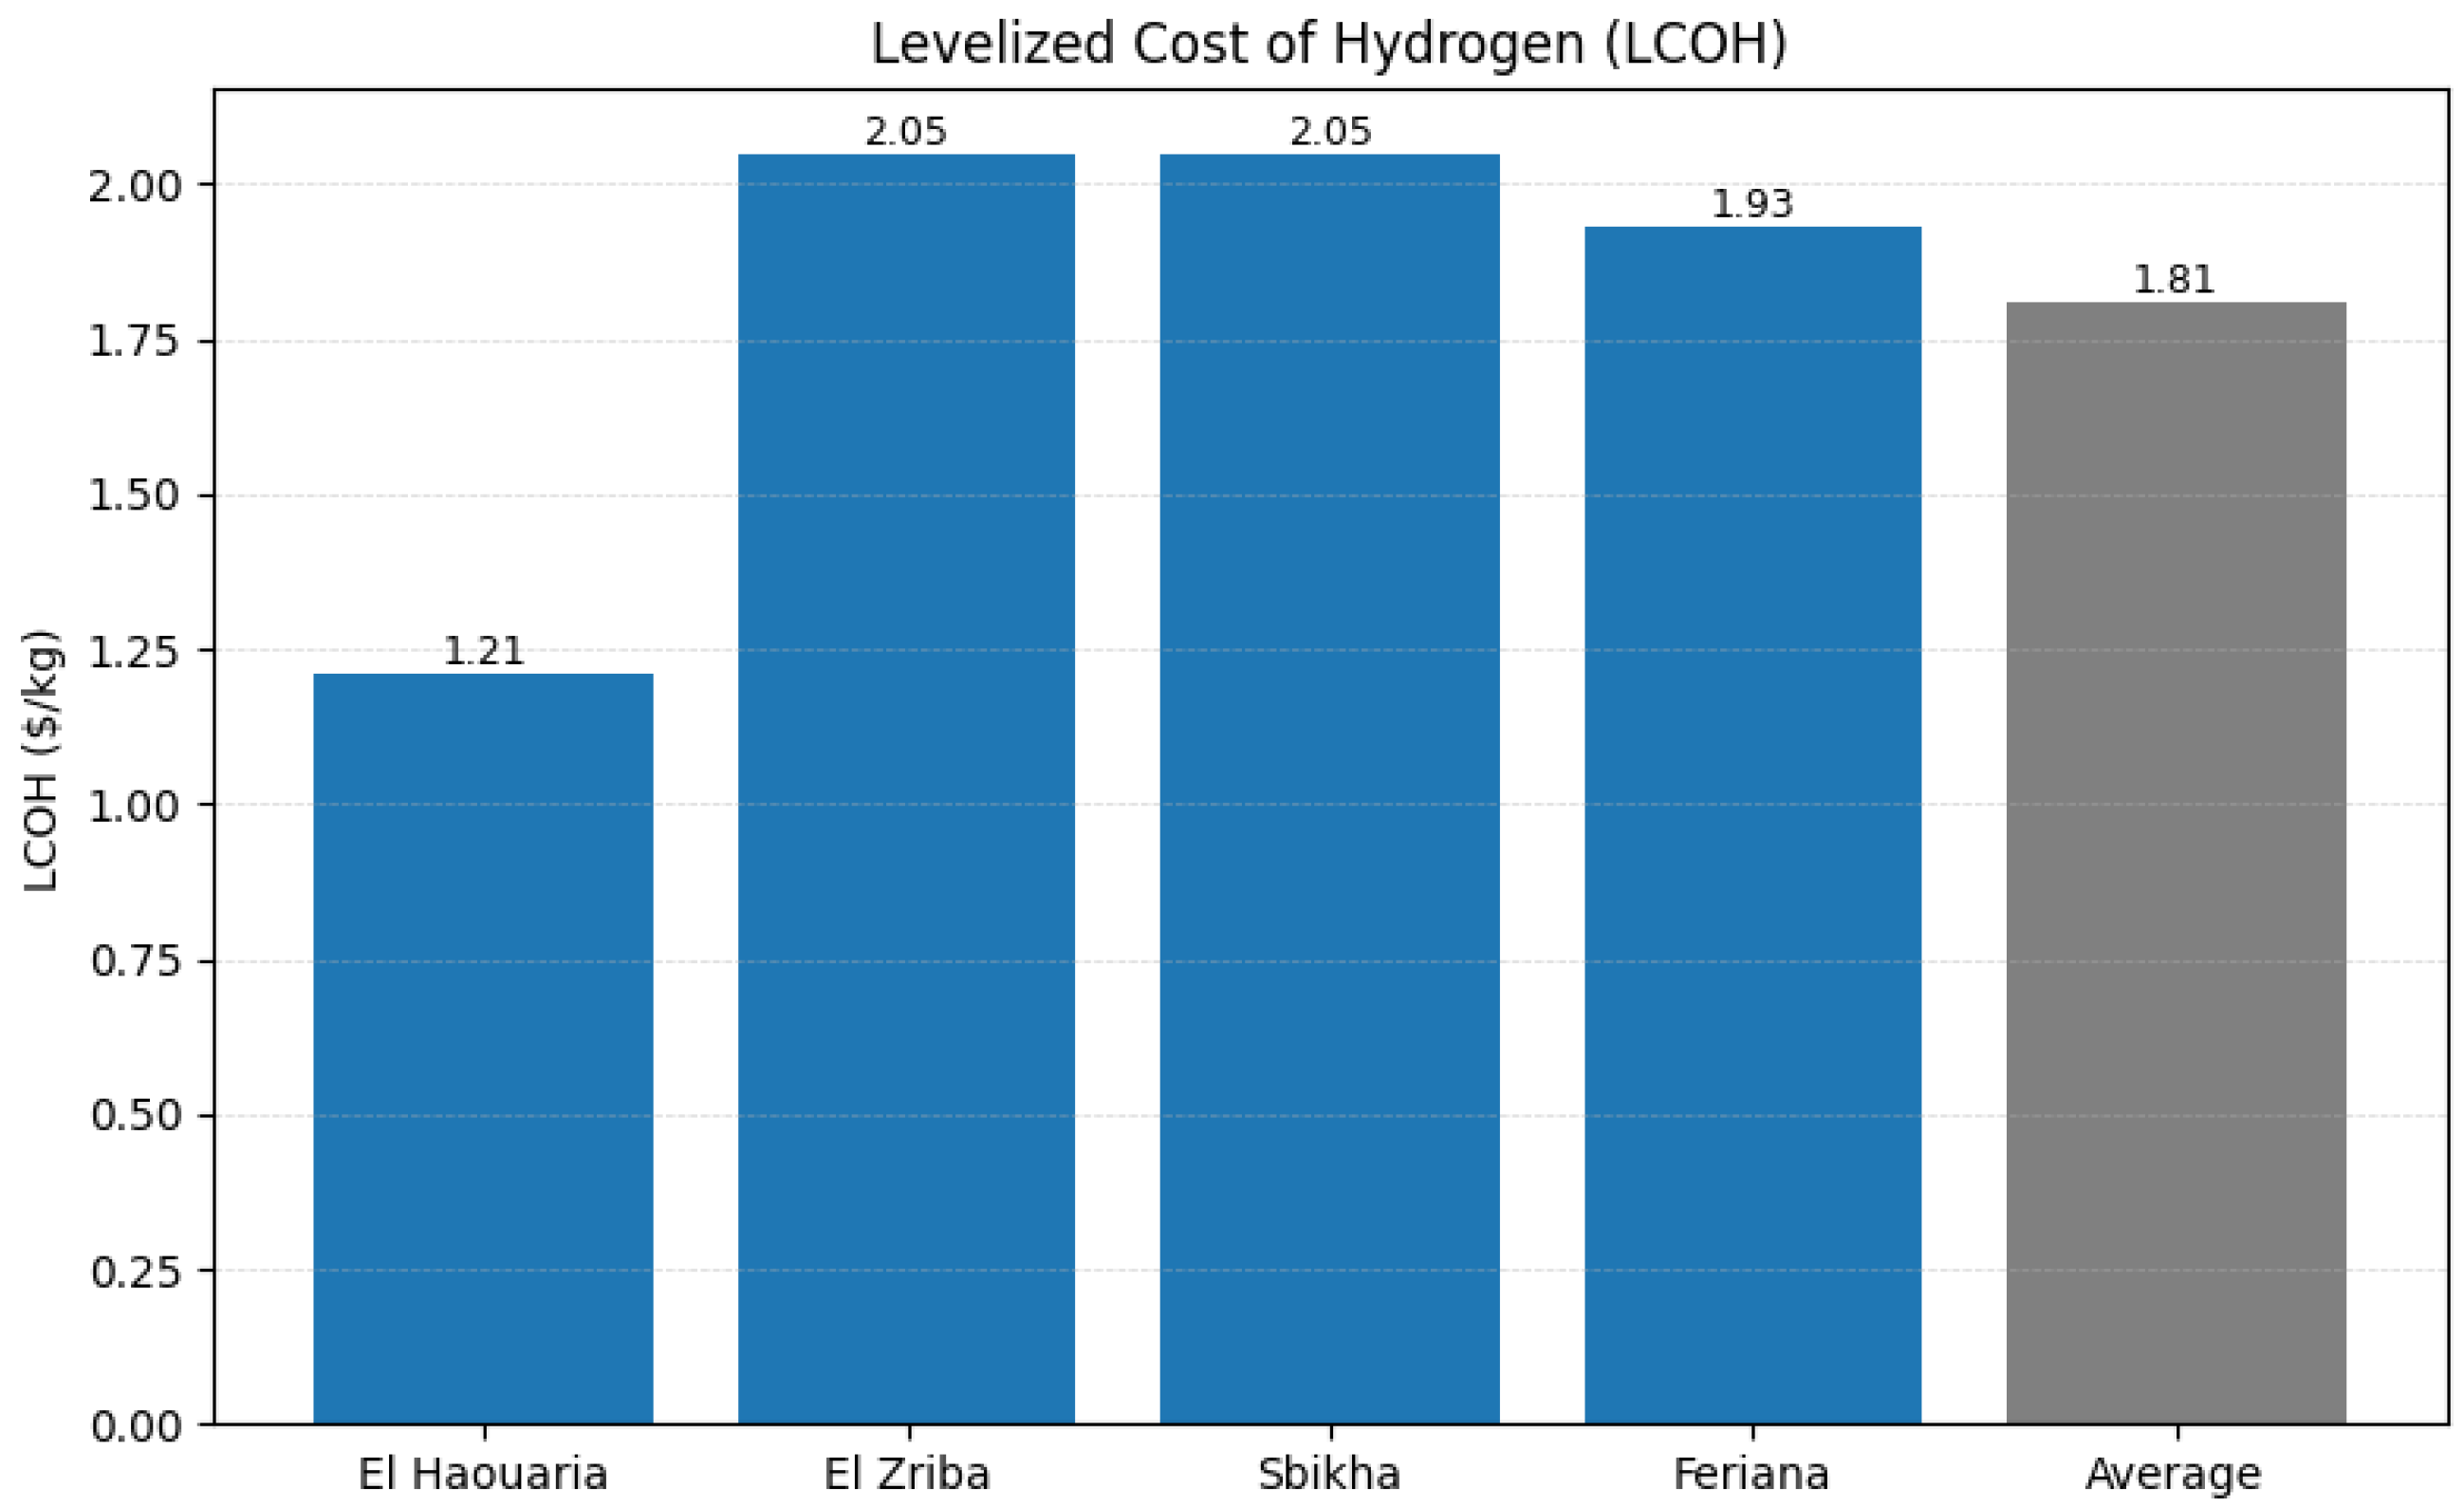
The results, in Figure 10 and Figure 11 as well as Table 3, highlight the potential for optimizing green hydrogen production using renewable energy sources across the four locations. The LCOH varies between 1.21$/kg and 2.05$/kg depending on the site-specific energy yields, land availability, and infrastructure configurations.
El Haouaria relies exclusively on wind turbines due to its strong wind resource and limited available land, achieving the lowest LCOH among the selected configurations at 1.21$/kg H2. Its wind yield reaches 32 GWh per turbine, which is almost 34% higher than the next strongest wind sites, Feriana and El Zriba, and nearly three times higher than Sbikha. This explains its high hydrogen output per production unit, even though its total installed capacity remains limited by land availability. El Zriba adopts a balanced 50% solar and 50% wind configuration, achieving an LCOH of 2.05$/kg H2, where the combination of both resources compensates for the limitations of relying on a single technology. Feriana also adopts a 50% solar and 50% wind configuration, achieving an LCOH of 1.93$/kg H2. Owing to its much larger available land area, Feriana becomes the highest production site, with the largest installed renewable capacity and electrolyzer power among all locations. Sbikha relies entirely on solar deployment due to its weaker wind yield, achieving an LCOH of 2.05$/kg H2.
To further validate the obtained results, the LCOH range calculated in this study was compared with recent values reported in the literature, as summarized in Table 4. The obtained LCOH values, ranging from 1.20 to 2.05$/kg, are competitive with comparable MENA, European, and global renewable-hydrogen studies.
In addition to the economic comparison, the water requirement for hydrogen production was estimated to address the sustainability of local water use. The annual hydrogen production at each site was calculated from the annual renewable electricity output and the water consumption factor of 18 L/kg H2 was then adopted to account for the stoichiometric water requirement, purification losses, and auxiliary water needs [31,32]. The resulting annual water requirements are summarized in Table 5.
The total annual water requirement for all the locations is therefore estimated at approximately 2.44 Mm3/year. At the site level, the required water represents approximately 2.86% of the quantified Boulaaba dam capacity for Feriana, 1.36% of the combined Oued Rmel retention lake and aquifer resources for Zriba, 0.55% of the quantified water resources considered for Haouaria, and 0.93% of the Balaoum reservoir capacity for Sbikha. These values suggest that the water demand associated with the proposed hydrogen production remains limited compared with the identified local water resources. In the cost assessment, the delivered-water cost, including extraction, treatment, purification, and pumping, was assumed to be approximately 0.50$/m3 based on recent estimates for high-consumption water users in Tunisia. This assumption is also consistent with reported desalination-related costs for hydrogen production, which add only about 0.01–0.02$/kg H2 to the overall production cost [17]. Therefore, the water-related contribution is considered within the additional-cost term and remains limited compared with the total LCOH.

3.5. Sensitivity Analysis: Impact of CAPEX Variation on LCOH

To further evaluate the robustness of the selected deployment configurations, a sensitivity analysis was conducted by varying the capital costs of PV systems, wind turbines, and electrolyzers within the ranges reported in the literature. In this analysis, the selected architecture of each site is kept fixed, meaning that the number of PV panels and wind turbines is not re-optimized for each cost scenario. Instead, the LCOH is recalculated under different CAPEX combinations to assess how sensitive each selected solution is to capital-cost uncertainty.
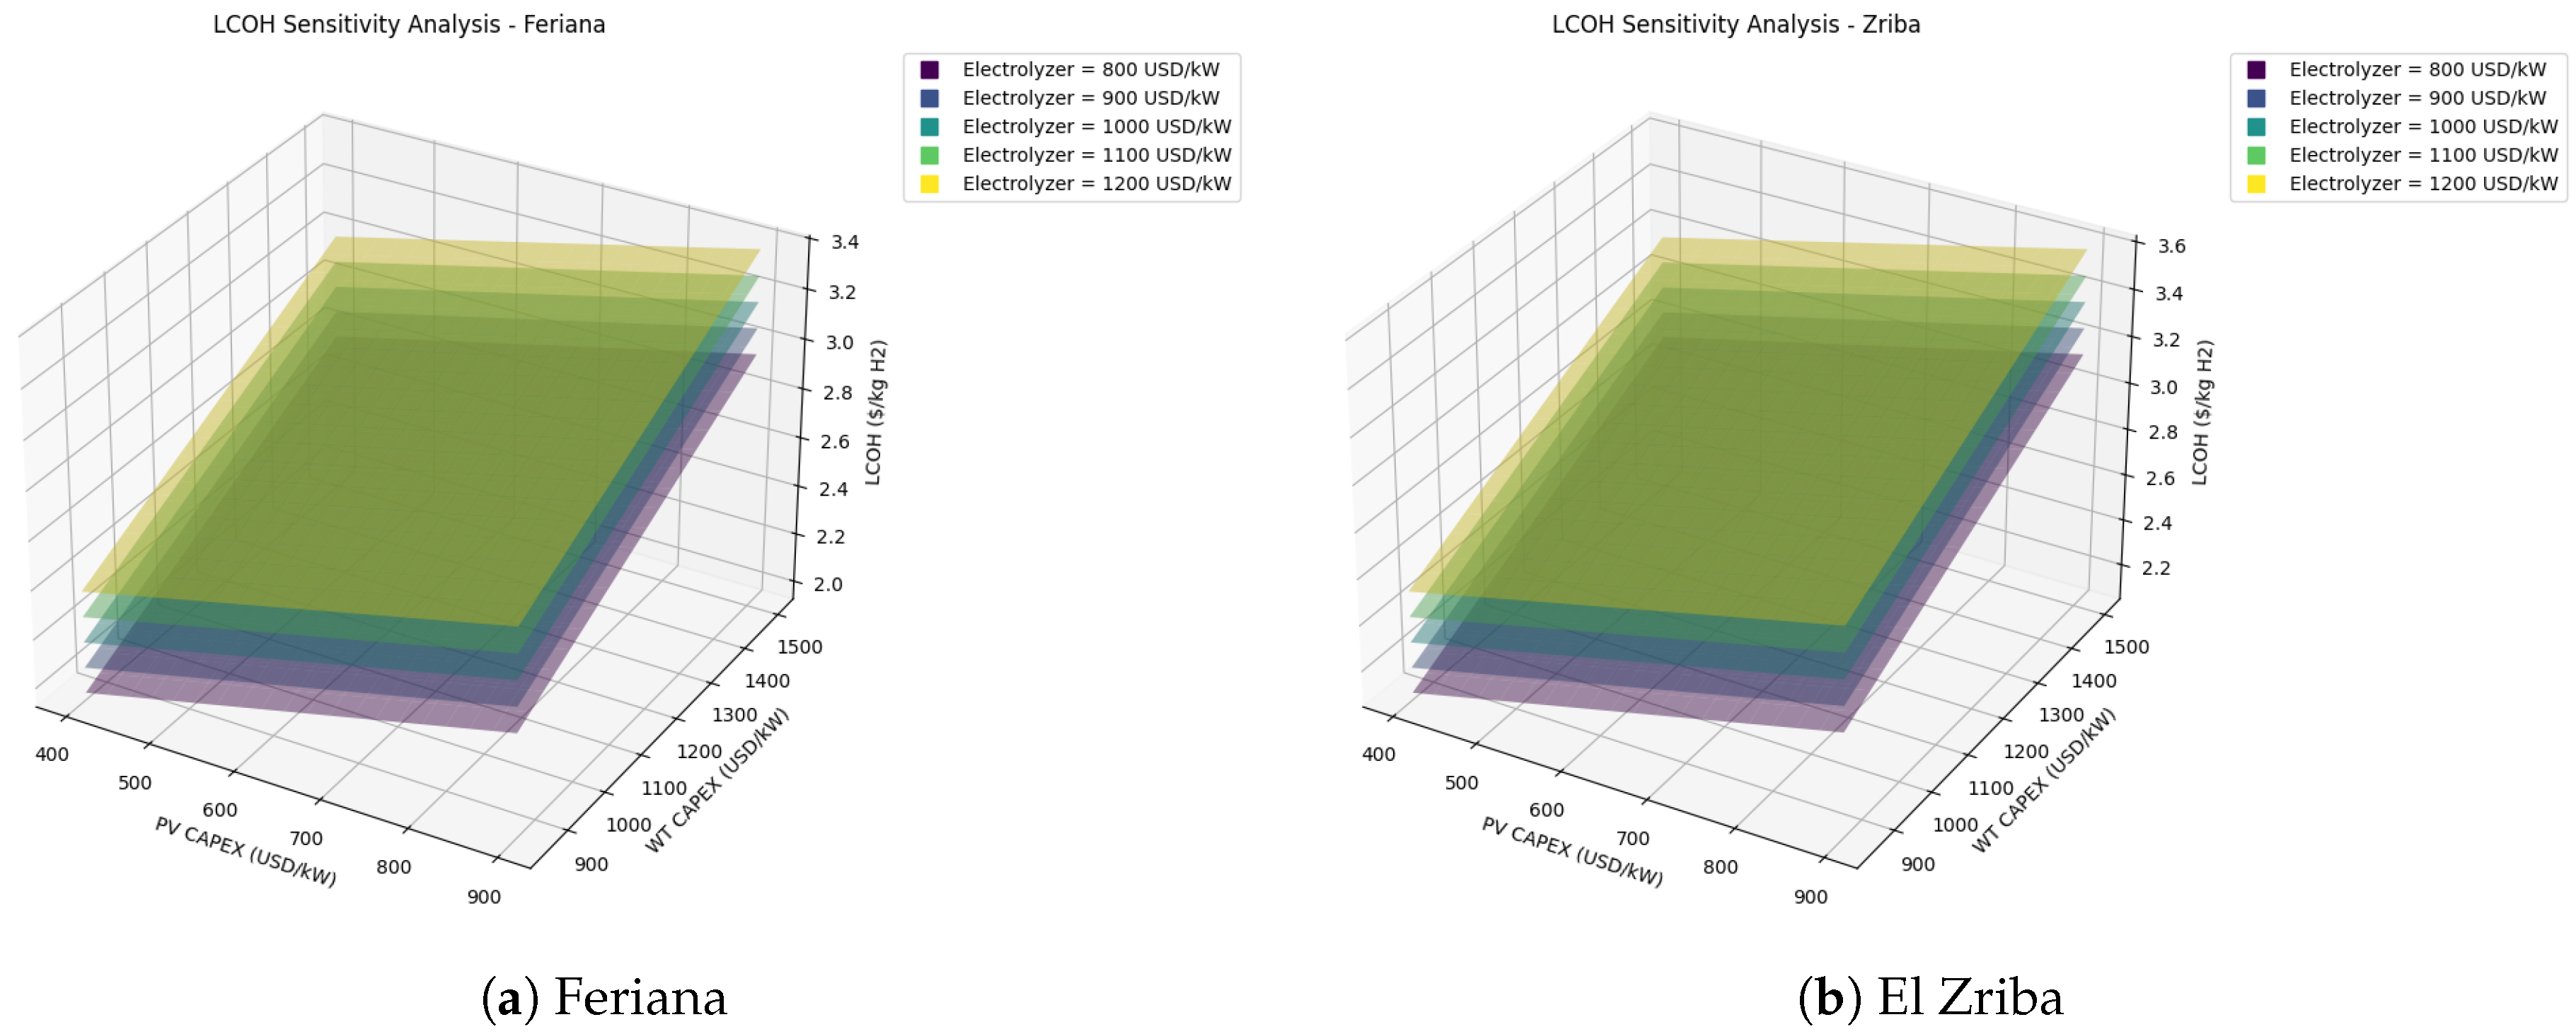
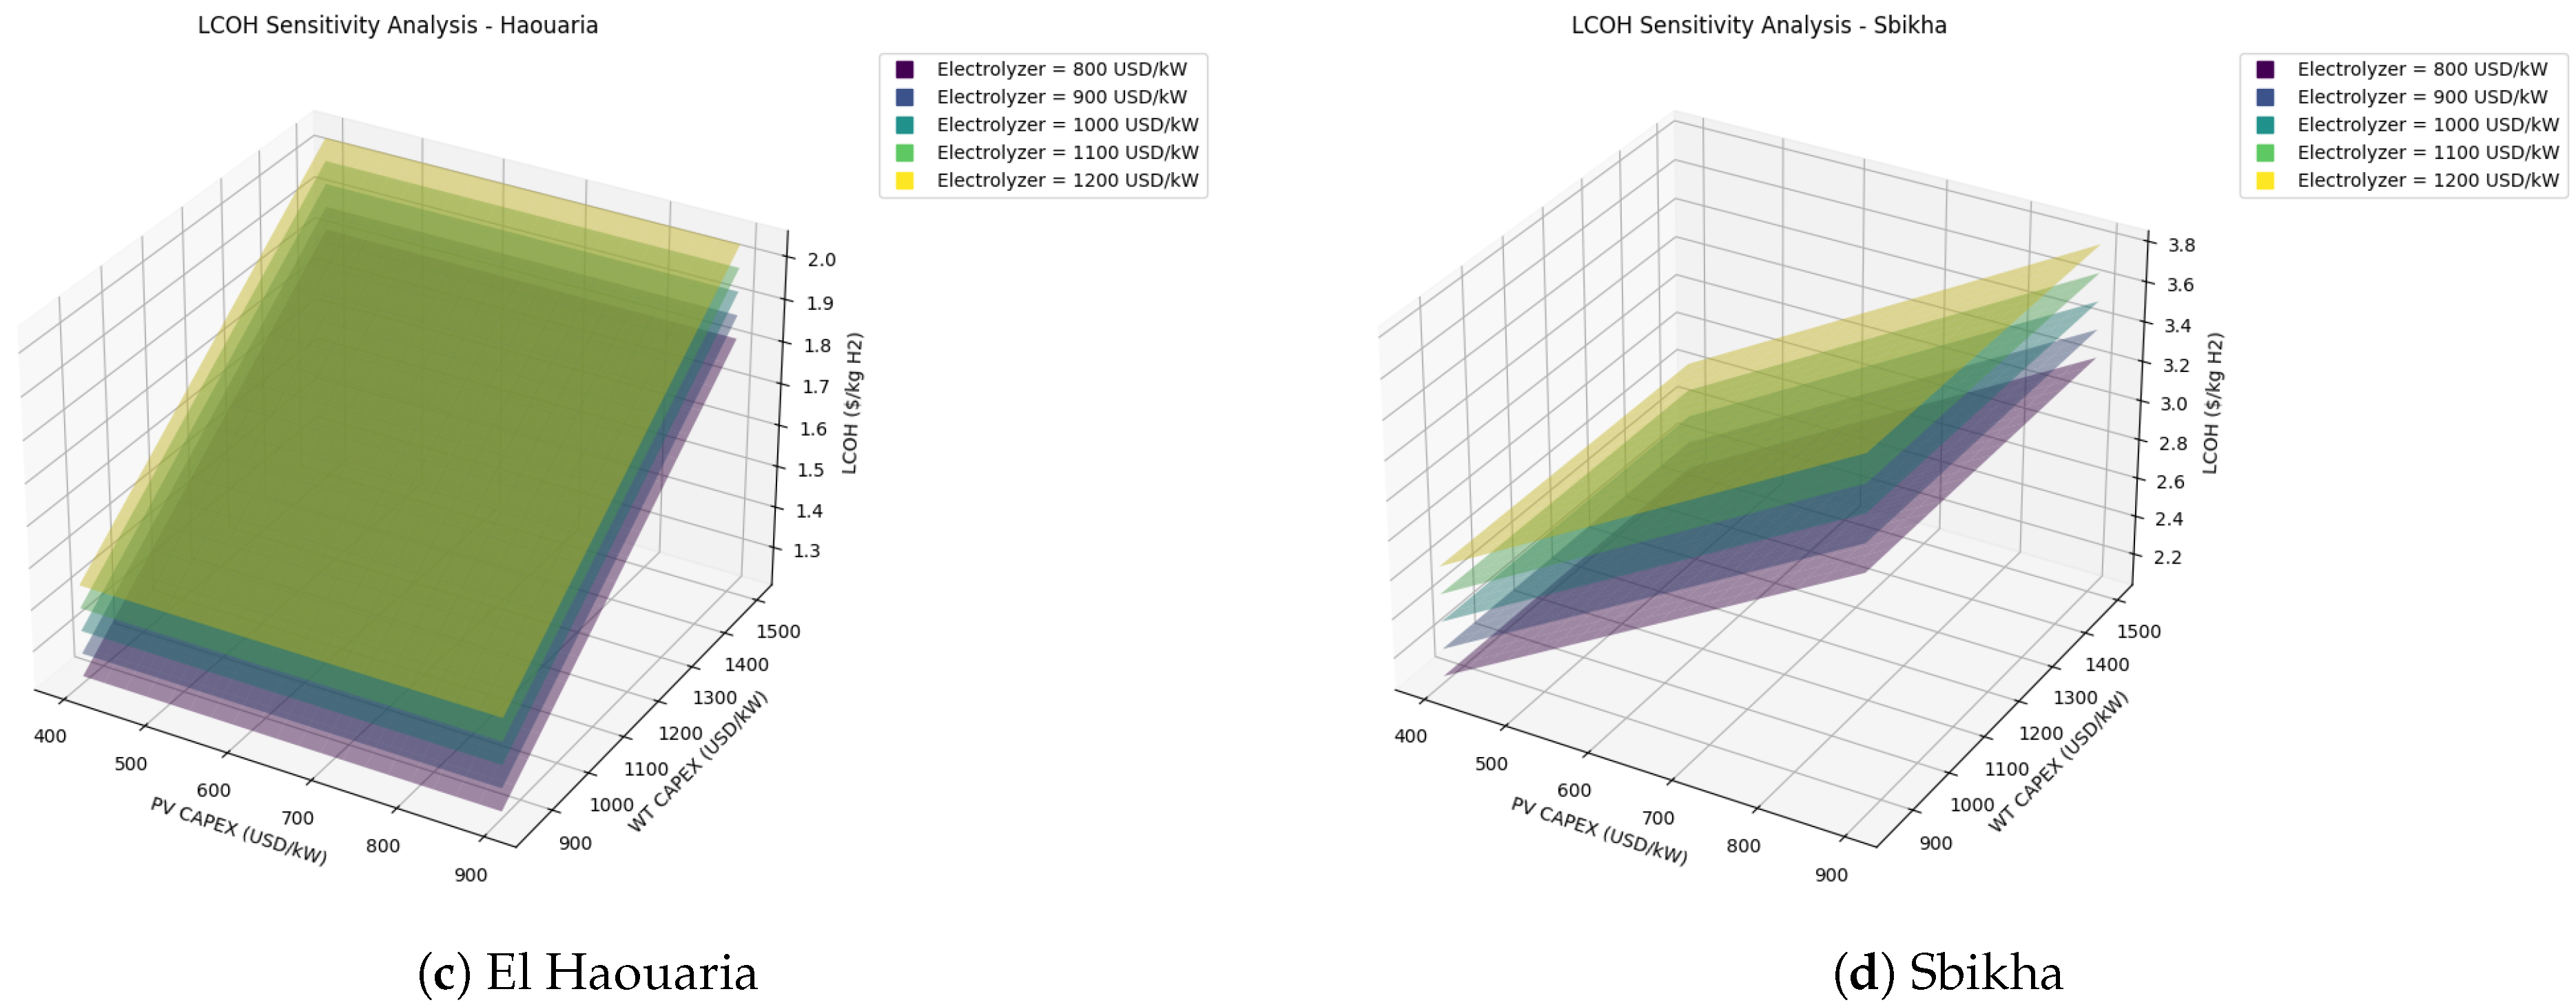
The PV CAPEX was varied between 400 and 900$/kW, the wind turbine CAPEX between 850 and 1500$/kW, and the electrolyzer CAPEX between 800 and 1200$/kW.
The results, seen in Figure 12, show that the impact of CAPEX variation differs significantly between locations depending on the selected technology mix and resource quality. El Haouaria remains the most resilient site, with an LCOH range of 1.223–2.042$/kg H2, mainly due to its high wind yield and exclusive reliance on wind power. Feriana shows a wider range of 1.954–3.381$/kg H2, reflecting the large scale of its mixed solar–wind configuration and its higher exposure to simultaneous PV, wind turbine, and electrolyzer cost increases. El Zriba and Sbikha reach higher upper-bound LCOH values of 3.594 and 3.815$/kg H2, respectively, indicating stronger sensitivity under conservative cost assumptions. Overall, the analysis confirms that the selected configurations remain competitive under favorable cost conditions, while higher CAPEX assumptions can substantially increase LCOH, particularly for lower-yield or solar-dominated configurations.

4. Conclusions

This paper assessed the feasibility and cost-effectiveness of green hydrogen production in northern Tunisia by analyzing four strategically located sites along the TRANSMED pipeline. Using nearly 3.1 GW of renewable energy capacity and a constraint-based optimization framework, the research identified site-specific configurations that minimized the LCOH while accounting for land availability, resource potential, and infrastructure access.
The results showed that a diversified, multi-site strategy enabled robust and economically viable hydrogen production, with base-case LCOH values ranging from 1.21$/kg to 2.05$/kg H2. El Haouaria emerged as the most cost-effective site due to its strong wind resource, while Feriana provided the largest production capacity because of its larger available land area. The analysis also demonstrated the importance of combining wind and solar power to enhance energy stability and reduce cost sensitivity. The CAPEX sensitivity analysis further showed that LCOH values can increase up to approximately 3.8$/kg H2 under conservative cost assumptions. The water assessment also showed that the estimated annual water demand remains limited compared with the quantified local water resources at the selected sites, representing only 0.5–2.9% of the total available water at each site.
A key finding of this work was the strategic advantage offered by the existing TRANSMED pipeline corridor, which could support future hydrogen integration and reduce the need for fully new long-distance transportation infrastructure. The present study concluded that northern Tunisia holds strong potential as a regional hub for green hydrogen production and export, especially when leveraging existing assets and tailoring energy deployment to site-specific strengths. These findings lay the groundwork for future research into dedicated hydrogen transport through retrofitted natural gas pipelines, aiming to further optimize North Africa–Europe hydrogen logistics.


Author Contributions

Conceptualization, I.D.; methodology, I.D. and C.B.; software, C.B.; data curation, C.B.; formal analysis, I.D.; resources, I.D.; visualization, I.D.; writing—original draft preparation, I.D.; writing—review and editing, S.C. and M.S.; supervision, S.C. and M.S.; project administration, S.C. and M.S. All authors have read and agreed to the published version of the manuscript.

Funding

This research received no external fundings.
Data Availability Statement

The weather data used in this study were obtained from the Open-Meteo open-access weather database [30], which provides freely available meteorological data for non-commercial research purposes (available at https://open-meteo.com/). The site-specific data corresponding to the four studied locations were extracted from previous research work conducted by the company of the first author in earlier years. These data were reused with permission and were essential to the present analysis. Due to ownership and confidentiality considerations, these data are not publicly available. For further information or data-related inquiries, interested readers may contact the first author at iderouiche@planet.tn.
Acknowledgments

The authors acknowledge the use of AI-based tools, ChatGPT 5.3–5.5, to support linguistic revision, grammar correction, formatting consistency, and minor LaTeX coding assistance. All scientific content, analysis, interpretations, and conclusions remain the responsibility of the authors.

Conflicts of Interest

The authors declare no conflicts of interest.

Nomenclature

SymbolDescriptionUnit
H i Total hydrogen produced at site ikg
Y PV , i Annual energy yield per PV panel for site iMWh/unit/year
Y WT , i Annual energy yield per wind turbine for site iMWh/unit/year
N PV Number of installed PV panels
N WT Number of installed wind turbines
α E H 2 Energy required to produce 1 kg of hydrogenkWh/kg
C Total Total cost of the project$
C PV Cost per PV panel$
C WT Cost per wind turbine$
P electrolyser Required electrolyser capacityMW
C electrolyser Cost per MW of electrolyser capacity$/MW
α O & M , WT O&M cost adjustment factor for wind turbines
α actualization Actualization term for 20 years
IRInflation rate%
rDiscount rate%
α Additional cost coefficient%
A PV Area required per PV panelha/unit
A WT Area required per wind turbineha/unit
A i Total available land area in site iha

Abbreviations

IEAInternational Energy Agency
LCOHLevelized Cost of Hydrogen
CAPEXCapital Expenditures
OPEXOperational Expenditures
PVSolar Photovoltaic Panels
WTWind Turbines

Appendix A

This appendix provides the meteorological inputs used in the renewable energy assessment. For each investigated region (Feriena, Sbikha, Zriba, and El Haouaria), two figures are reported over the period 2021 to 2024: the first shows the solar radiation time series used to characterize PV resource availability, and the second shows the wind speed time series used to characterize wind resource availability. These datasets support the site to site comparison and the subsequent sizing and cost optimization results.
Figure A1. Solar radiation in Feriena over the period 2021 to 2024.
Hydrogen 07 00091 g0a1
Figure A2. Wind speed in Feriena over the period 2021 to 2024.
Hydrogen 07 00091 g0a2
Figure A3. Solar radiation in Sbikha over the period 2021 to 2024.
Hydrogen 07 00091 g0a3
Figure A4. Wind speed in Sbikha over the period 2021 to 2024.
Hydrogen 07 00091 g0a4
Figure A5. Solar radiation in Zriba over the period 2021 to 2024.
Hydrogen 07 00091 g0a5
Figure A6. Wind speed in Zriba over the period 2021 to 2024.
Hydrogen 07 00091 g0a6
Figure A7. Solar radiation in El Haouaria over the period 2021 to 2024.
Hydrogen 07 00091 g0a7
Figure A8. Wind speed in El Haouaria over the period 2021 to 2024.
Hydrogen 07 00091 g0a8

References

  1. International Energy Agency. Global Hydrogen Review 2024; IEA: Paris, France, 2024. [Google Scholar]
  2. Du, L.; Yang, Y.; Zhou, L.; Liu, M. Greenhouse Gas Reduction Potential and Economics of Green Hydrogen via Water Electrolysis: A Systematic Review of Value-Chain-Wide Decarbonization. Sustainability 2024, 16, 4602. [Google Scholar]
  3. Hydrogen Council. Hydrogen Scaling Up: A Sustainable Pathway for the Global Energy Transition; Hydrogen Council: Brussels, Belgium, 2017. [Google Scholar]
  4. Zhao, X.; Li, Y.; Chen, Z. Current Status of Green Hydrogen Production Technology. Sustainability 2024, 16, 9070. [Google Scholar] [CrossRef]
  5. Canan, A.; Ibrahim, D. Review and evaluation of hydrogen production methods for better sustainability. Int. J. Hydrogen Energy 2019, 44, 10644–10666. [Google Scholar]
  6. Bhandari, R.; Trudewind, C.A.; Zapp, P. Life cycle assessment of hydrogen production methods: A review. Renew. Sustain. Energy Rev. 2014, 28, 555–563. [Google Scholar]
  7. International Energy Agency (IEA). The Future of Hydrogen; IEA: Paris, France, 2019. [Google Scholar]
  8. U.S. Department of Energy. Energy Requirements for Hydrogen Gas Compression and Liquefaction as Related to Vehicle Storage Needs; U.S. Department of Energy: Germantown, MD, USA, 2009. [Google Scholar]
  9. Faran, R.; Ibrahim, D. Renewable energy development and hydrogen economy in MENA region: A review. Renew. Sustain. Energy Rev. 2022, 168, 112763. [Google Scholar] [CrossRef]
  10. Gado, M.G.; Hassan, H. Potential of prospective plans in MENA countries for green hydrogen generation driven by solar and wind power sources. Sol. Energy 2023, 263, 111942. [Google Scholar] [CrossRef]
  11. Pinto, M.C.; Gaeta, M.; Arco, E.; Boccardo, P.; Corgnati, S.P. Mapping the suitability of North Africa for green hydrogen production: An application of a multi-criteria spatial decision support system combining GIS and AHP for Tunisia. Energy Sustain. Soc. 2025, 15, 20. [Google Scholar] [CrossRef]
  12. Ammar, E.B.; Ammar, S. Green Hydrogen in Tunisia—A New Mechanism of Plunder and Exploitation; HIC-HLRN: Cairo, Egypt, 2024. [Google Scholar]
  13. Reichartz, T.; Jacobs, G.; Rathmes, T.; Blickwedel, L.; Schelenz, R. Optimal position and distribution mode for on-site hydrogen electrolyzers in onshore wind farms for a minimal levelized cost of hydrogen (LCoH). Wind Energy Sci. 2024, 9, 281–295. [Google Scholar] [CrossRef]
  14. Povacz, L.; Bhandari, R. Analysis of the levelized cost of renewable hydrogen in Austria. Sustainability 2023, 15, 4575. [Google Scholar] [CrossRef]
  15. Vatankhah Ghadim, H.; Haas, J.; Breyer, C.; Gils, H.C.; Odonkor, P.; Read, E.G.; Xiao, M. Clean Technology Cost Projections: Investment and Levelized Costs of Solar, Wind, Battery, and Hydrogen. Sci. Data 2025, 12, 1670. [Google Scholar] [CrossRef] [PubMed]
  16. Bhandari, R.; Shah, R.R. Hydrogen as energy carrier: Techno-economic assessment of decentralized hydrogen production in Germany. Renew. Energy 2021, 177, 915–931. [Google Scholar] [CrossRef]
  17. Mazza, A.; Forte, A.; Bompard, E.; Cavina, G.; Angelini, A.M.; Melani, M. Assessment of the role of green hydrogen as the commodity enabling a new green dialogue among the Mediterranean shores. Energy Convers. Manag. 2024, 23, 100614. [Google Scholar] [CrossRef]
  18. European Commission, Joint Research Centre. PVGIS 5.2: Photovoltaic Geographical Information System; European Commission, Joint Research Centre: Ispra, Italy, 2023. [Google Scholar]
  19. Piero, L.; Luca, S. The relation between climate change in the Mediterranean region and global warming. Reg. Environ. Change 2018, 18, 1481–1493. [Google Scholar] [CrossRef]
  20. Skoplaki, E.; Palyvos, J.A. On the temperature dependence of photovoltaic module performance: A review of efficiency/power correlations. Sol. Energy 2009, 83, 614–624. [Google Scholar]
  21. Jamdade, P.G.; Patil, S.V.; Jamdade, S.G. Assessment of Power Coefficient of an Offline Wind Turbine Generator System. Electron. J. Energy Environ. 2013, 1, 597. [Google Scholar] [CrossRef]
  22. Mendler, F.; Fragoso Garcia, J.; Kleinschmitt, C.; Voglstätter, C. Global Optimization of Capacity Ratios between Electrolyser and Renewable Electricity Source to Minimize Levelized Cost of Green Hydrogen. Int. J. Hydrogen Energy 2024, 82, 986–993. [Google Scholar] [CrossRef]
  23. Bagheri, B.; Kumagai, H.; Hashimoto, M.; Sugiyama, M. Techno-Economic Assessment of Green Hydrogen Production in Australia Using Off-Grid Hybrid Resources of Solar and Wind. Energies 2025, 18, 3285. [Google Scholar] [CrossRef]
  24. Ghadim, H.V.; Haas, J.; Breyer, C.; Gils, H.C.; Read, E.G.; Xiao, M.; Peer, R. Are We Too Pessimistic? Cost Projections for Solar Photovoltaics, Wind Power, and Batteries Are Over-Estimating Actual Costs Globally. Appl. Energy 2025, 390, 125856. [Google Scholar] [CrossRef]
  25. IEA-PVPS. Trends in Photovoltaic Applications 2023; IEA: Paris, France, 2023. [Google Scholar]
  26. Global Wind Energy Council. China Will Continue to Lead Global Wind Power Growth in the Decades to Come; Global Wind Energy Council: Bruxelles, Belgium, 2023. [Google Scholar]
  27. International Energy Agency. Global Hydrogen Review 2025: Assumptions Annex, revised version; International Energy Agency: Paris, France, 2025. [Google Scholar]
  28. Badgett, A.; Brauch, J.; Thatte, A.; Rubin, R.; Skangos, C.; Wang, X.; Ahluwalia, R.; Pivovar, B.; Ruth, M. Updated Manufactured Cost Analysis for Proton Exchange Membrane Water Electrolyzers; Technical Report NREL/TP-6A20-87625; National Renewable Energy Laboratory: Golden, CO, USA, 2024. [Google Scholar]
  29. International Renewable Energy Agency. Green Hydrogen Cost Reduction: Scaling Up Electrolysers to Meet the 1.5 °C Climate Goal; International Renewable Energy Agency: Abu Dhabi, United Arab Emirates, 2020. [Google Scholar]
  30. Open-Meteo. Open-Meteo: Free Weather API for Non-Commercial Use; Open-Meteo: Bürglen, Switzerland, 2024. [Google Scholar]
  31. International Renewable Energy Agency and Bluerisk. Water for Hydrogen Production; International Renewable Energy Agency: Abu Dhabi, United Arab Emirates, 2023; Available online: https://www.irena.org/Publications/2023/Dec/Water-for-hydrogen-production (accessed on 13 May 2026).
  32. Rocky Mountain Institute. Hydrogen Reality Check: Distilling Green Hydrogen’s Water Consumption; RMI: Boulder, CO, USA, 2023; Available online: https://rmi.org/hydrogen-reality-check-distilling-green-hydrogens-water-consumption/ (accessed on 22 May 2026).
Figure 1. The New Hydrogen Nerve Path: (1) El Haouaria, (2) Zriba, (3) Sbikha, and (4) Feriana.
Hydrogen 07 00091 g001
Figure 2. El Haouaria project land. Yellow pins indicate the candidate project parcels, while the yellow star marks the city of El Haouaria.
Hydrogen 07 00091 g002
Figure 3. Zriba project land.
Hydrogen 07 00091 g003
Figure 4. Water infrastructure potentially supplying the Sbikha hydrogen facility.
Hydrogen 07 00091 g004
Figure 5. Feriana site location. The pin marks the existing Feriana power station, while the proposed hydrogen project area is expected to be located in the surrounding available land.
Hydrogen 07 00091 g005
Figure 6. Methodology workflow for hydrogen system design and evaluation.
Hydrogen 07 00091 g006
Figure 7. Schematic representation of the implemented SLSQP-based optimization procedure for LCOH minimization.
Hydrogen 07 00091 g007
Figure 8. Annual solar energy yield per PV panel for each location from 2021 to 2024.
Hydrogen 07 00091 g008
Figure 9. Annual wind energy yield per turbine for each location from 2021 to 2024.
Hydrogen 07 00091 g009
Figure 10. Overview of renewable energy infrastructure by region for the selected deployment configurations: (a) electrolyzer capacity per region in MW, (b) photovoltaic deployment in number of panels, (c) wind turbine deployment in number of wind turbines, and (d) total installed renewable power in MW.
Hydrogen 07 00091 g010
Figure 11. LCOH values for the selected deployment configurations at each location, with the average value included.
Hydrogen 07 00091 g011
Figure 12. LCOH sensitivity analysis for the selected deployment configurations: (a) Feriana, (b) El Zriba, (c) El Haouaria, and (d) Sbikha.
Hydrogen 07 00091 g012aHydrogen 07 00091 g012b
Table 1. Estimated CAPEX ranges and selected cost assumptions for the main components used in the techno-economic model.
ComponentUnit ConsideredCAPEX Range ($/kW)Selected Cost ($/kW)References
PV system720 W module250–900400[10,15,17,23,24,25]
Wind turbine7.2 MW onshore turbine316–1500850[10,15,17,23,24,26]
ElectrolyzerMW-scale system455–1200800[10,13,17,23,27,28,29]
Table 2. Site-dependent input parameters for the energy distribution optimization.
LocationSolar Yield (MWh/Unit)Wind Yield (GWh/Unit)Available Land (ha)
Feriana1.33201500
Sbikha1.2511500
Zriba1.2319450
Haouaria1.2332200
Table 3. Aggregated Results Across the Selected Deployment Configurations.
MetricValue
Average LCOH ($/kg H2)1.809
Total PV Panels2,212,500
Total Wind Turbines211
Total Farm Power (MW)3112.20
Total Electrolyzer Power (MW)1867.32
Table 4. Comparison of the obtained LCOH values with recent literature.
StudyRegionTechnologyLCOH ($/kg)
Razi et al. [9]MENAPV–Wind hybrid2.0–6.5
Bhandari et al. [16]EuropePV + electrolyzer2.2–8
Mazza et al. [17]TunisiaPV–Wind layouts + electrolyzer1.34–4.06
Mendler et al. [22]GlobalPV–Wind optimal2.0–7.5
This studyNorthern TunisiaPV–Wind hybrid1.20–2.05
Table 5. Estimated annual hydrogen production, water requirement, and share of local quantified water resources for each site.
SiteAnnual H2 Production (t/Year)Water Requirement (Mm3/Year)Quantified Local Water ResourceAvailable Water (Mm3)Annual Share (%)
Feriana76,2951.373Boulaaba dam48.02.86
Zriba21,3660.385Oued Rmel retention lake + aquifer28.31.36
Haouaria20,9450.377Lebna dam + shallow/deep aquifers + desalination68.450.55
Sbikha17,0450.307Balaoum reservoir33.00.93
Total135,6522.442
Disclaimer/Publisher’s Note: The statements, opinions and data contained in all publications are solely those of the individual author(s) and contributor(s) and not of MDPI and/or the editor(s). MDPI and/or the editor(s) disclaim responsibility for any injury to people or property resulting from any ideas, methods, instructions or products referred to in the content.