
Article

A Simple Study of Hydrogen Production from Recycled Aluminum Microparticles in Alkaline Media
by
Sergio Martínez-Vargas
,
José-Enrique Flores-Chan
,
Humberto-Julián Mandujano-Ramírez
,
Salatiel Pérez-Montejo
,
Damián Calan-Canche
and
Cristobal Patino-Carachure
*
Facultad de Ingeniería, Universidad Autonoma del Carmen, Campus III, Ciudad del Carmen 24115, CP, Mexico
*
Author to whom correspondence should be addressed.
Hydrogen 2026, 7(2), 55; https://doi.org/10.3390/hydrogen7020055
Submission received: 14 February 2026 / Revised: 17 April 2026 / Accepted: 18 April 2026 / Published: 22 April 2026
(This article belongs to the Special Issue Women’s Special Issue Series: Hydrogen)

Abstract

Hydrogen (H2) was produced from recycled aluminum microparticles (180–250, 300–425, and 425–500 μm) via alkaline hydrolysis using a 1.0 M NaOH solution to enhance oxide layer removal and aluminum dissolution. Maximum hydrogen flow rates of approximately 13, 15, and 19 mL·min−1 were obtained, confirming that smaller particle sizes promote faster reaction rates due to increased specific surface area. The hydrogen evolution exhibited two-stage kinetic behavior: an initial stage characterized by rapid aluminum dissolution and increasing H2 production, followed by a gradual decline associated with the formation of a passivating Al(OH)3 layer. Despite the higher reaction rates observed for smaller particles, the maximum cumulative hydrogen production was obtained for the intermediate particle size (363 µm, 132 mL), compared to 106 mL and 102 mL for 215 µm and 463 µm, respectively, indicating a trade-off between surface area and passivation effects. Kinetic analysis based on the shrinking core model showed excellent agreement (R2 = 99.94–99.97%), with rate constants of 0.137, 0.064, and 0.050 min−1. The relationship k ∝ d−n (n ≈ 1.4) suggests a mixed kinetic regime involving both surface reaction and diffusion through the Al(OH)3 layer. These findings indicate that hydrogen generation can be modulated by particle size; however, the relatively low flow rates and yields limit its immediate practical applicability.

Graphical Abstract

1. Introduction

In recent years, clean energy sources have gained increasing global attention, with hydrogen emerging as a promising alternative to reduce dependence on fossil fuels. Currently, global hydrogen production is dominated by natural gas steam reforming, followed by other hydrocarbons (~30%), coal gasification (~18%), water electrolysis (~3.9%), and minor alternative routes (~0.1%) [1,2,3,4,5,6,7]. However, these conventional processes are associated with significant greenhouse gas emissions, highlighting the need for more sustainable production pathways [8,9].
In addition to production, hydrogen storage remains a major challenge, particularly for portable and on-demand energy systems. Conventional storage methods, such as compressed gas and metal hydrides, present limitations related to efficiency, cost, and energy consumption. Although materials such as lithium borohydride (LiBH4) offer high energy density, their practical application is constrained by cost and scalability issues [10,11,12,13].
A promising alternative for hydrogen generation is the reaction between metallic aluminum (Al) and water. Aluminum is an attractive energy carrier due to its abundance, recyclability, and high theoretical hydrogen yield (~1.245 L g−1 at standard temperature and pressure) [14,15,16,17]. The use of aluminum waste, such as beverage cans, provides an additional advantage by enabling a sustainable and circular approach to hydrogen production, which has recently gained increasing attention in waste-to-energy strategies [18,19,20]. However, aluminum hydrolysis is hindered by the presence of a passivating Al2O3 layer (2–5 nm), which limits its reactivity [21]. To overcome this limitation, several activation strategies have been proposed, including acidic or alkaline media and mechanical treatments [22]. Among these, alkaline activation is particularly attractive due to its simplicity, low cost, and rapid reaction kinetics. The main reactions of aluminum with NaOH in aqueous solution are described by Equations (1)–(3), where NaOH acts as a promoter and is regenerated during the process [23,24,25,26,27]:
2Al(s) + 6H2O(l) + 2NaOH(s) → 2NaAl(OH)4(aq) + 3H2(g)
2NaAl(OH)4(aq) → 2NaOH(s) + 2Al(OH)3(aq)
2Al(s) + 6H2O(l) → 2Al(OH)3(aq) + 3H2(g)
NaOH consumed in (1) is regenerated in (2), completing the overall process in (3). However, passivation by Al(OH)3 and Al2O3 films can reduce hydrolysis by ~30%, lowering H2 yield by ~33% [28].
Nevertheless, the formation of Al(OH)3 introduces diffusional limitations, reducing hydrogen yield and reaction rate [25]. Recent studies have highlighted that hydrogen generation from aluminum in alkaline media is frequently governed by diffusion through the product layer or by mixed kinetic regimes, depending on particle size and reaction conditions [18,29].
Although hydrogen production from aluminum has been widely studied, most kinetic analyses have focused on high-purity aluminum under controlled conditions, limiting their applicability to real systems. In contrast, recycled aluminum exhibits heterogeneity in particle size, morphology, and surface composition, which significantly affects reaction kinetics [30].
In this work, a kinetic–empirical approach is applied to hydrogen generation from recycled aluminum microparticles in alkaline media, with particular emphasis on particle size effects. The study identifies an optimal particle size that maximizes cumulative hydrogen production, while smaller particles enhance reaction rates. Additionally, kinetic parameters based on the shrinking core model (SCM) [31], together with regression-based correlations, are established to describe the dependence of hydrogen generation on particle size. The results further support the presence of a mixed kinetic regime involving both surface reaction and diffusion through the Al(OH)3 layer.
These findings provide a realistic framework for aluminum–water reactions and support the design of sustainable hydrogen generation systems from recycled materials. The obtained kinetic parameters enable preliminary small-scale reactor design; however, extrapolation to significantly different particle sizes requires experimental validation, as it may modify the controlling mechanisms described by the SCM.

2. Materials and Methods

Aluminum beverage cans were used to obtain aluminum alloy ingot. The chemical components of each can part were as follows: AA 5182/H48 (beverage can lids) [32], AA 5042/H18 (beverage can tabs) [33], and AA 3104/H19 (beverage can body) [34], as shown in Table 1.
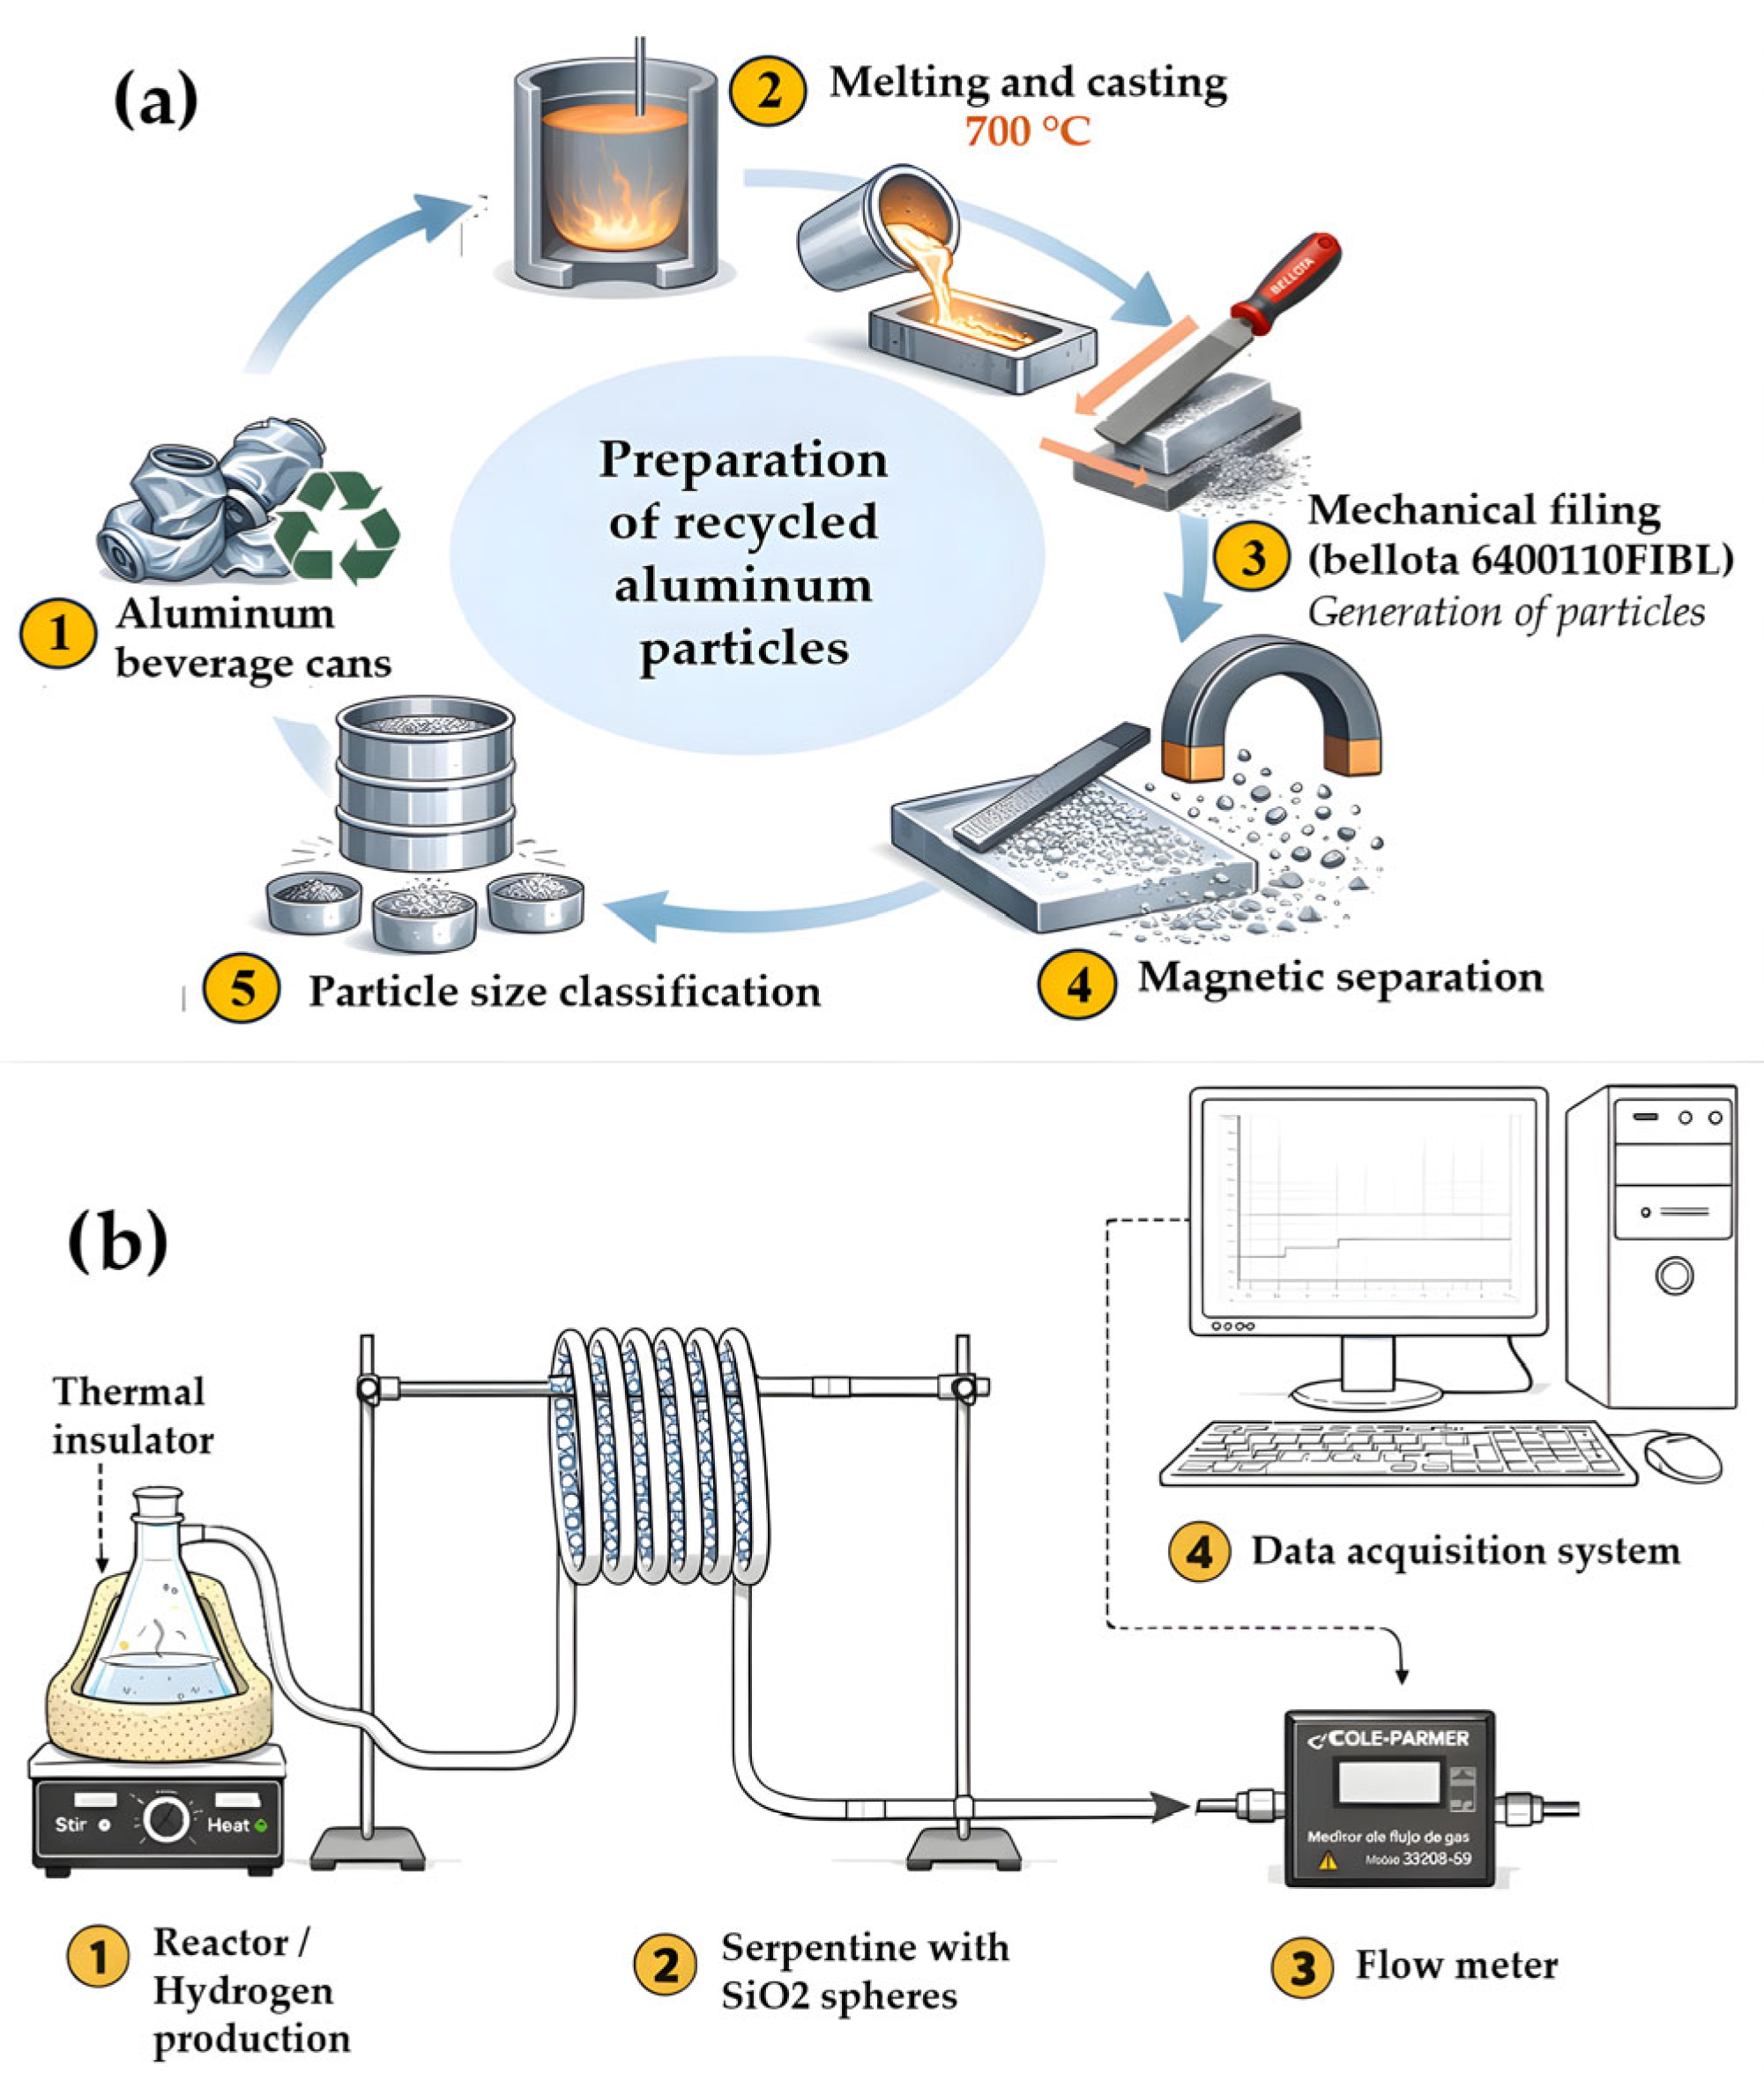
First, the paint covering the cans was removed using sandpaper and solvent. Subsequently, the cans were compacted. Figure 1a illustrates the main steps involved in the recycling of aluminum cans. (1) Preparation: Aluminum beverage cans were collected and mechanically shredded to reduce their volume prior to melting. (2) Melting and casting: The shredded cans were placed in a crucible inside a melting furnace and heated to approximately 700 °C (1292 °F). Once completely molten, the aluminum was poured into a mold and allowed to cool at room temperature to form an ingot. (3) Mechanical filing: The obtained aluminum ingot was mechanically filed using a 25 cm (10-inch) Bellota steel flat file (model 6400110F1BL) in order to produce recycled aluminum powder. (4) Magnetic separation: A permanent neodymium magnet was passed repeatedly over the aluminum powder to remove any ferrous contaminants. (5) Particle size classification: The iron-free aluminum powder was sieved to classify the particle size using standard sieves in accordance with ASTM E11-22 [35].
It is worth mentioning that Jayaraman et al. [17] reported that the specific surface area and reaction temperature influence the reaction rate of aluminum with water, which in turn modifies the yield of hydrogen generation and the compounds formed. For this reason, particles of different sizes were obtained by gradually filing.
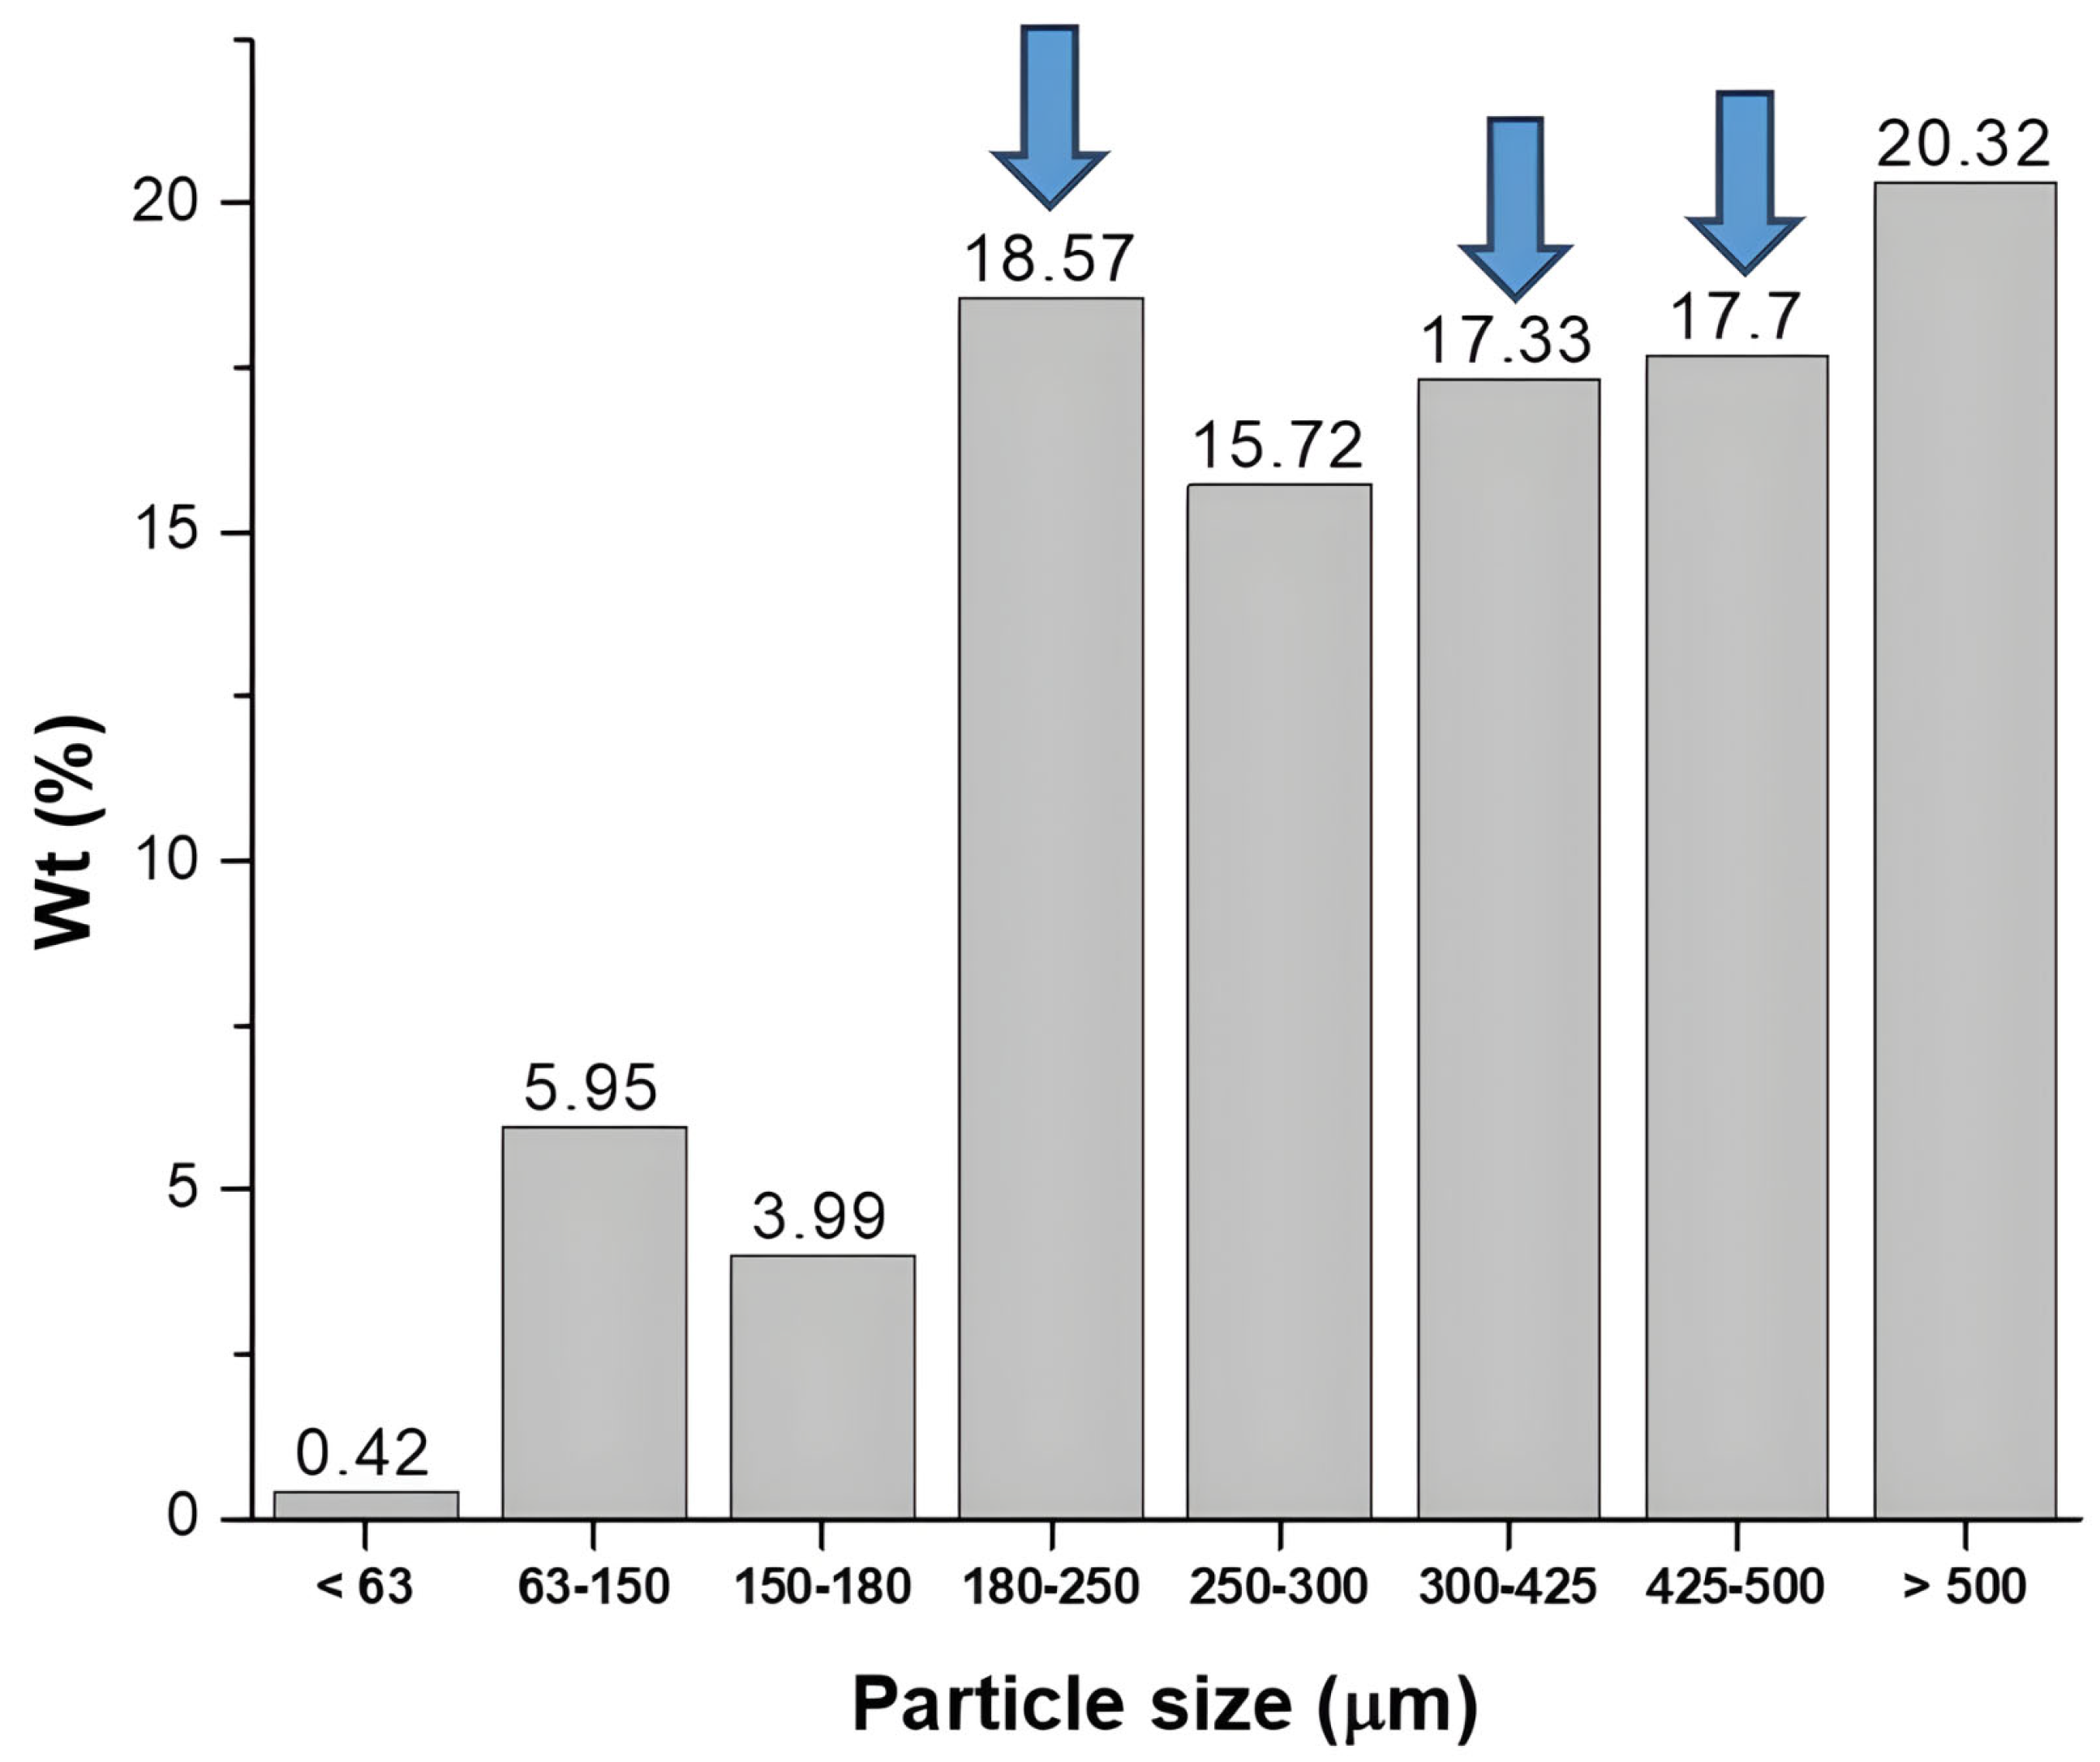
Next, numbered sieves ranging from 230 to 35 (ASTM E11-22) were used to classify the particles. The resulting particle size distribution is presented in the histogram shown in Figure 2. Based on this distribution, three particle size ranges were selected for testing: 180–250 µm, 300–425 µm, and 425–500 µm, as indicated by the arrows in Figure 2.
Figure 1b shows a schematic of the custom-made laboratory equipment for quantification of the hydrogen production rates and its performance from recycled aluminum in alkaline medium. To guarantee the reliability and reproducibility of the kinetic measurements, rigorous control of the experimental boundary conditions was implemented. The reaction was carried out in a 250 mL Kitasato flask operating at local atmospheric pressure. To eliminate external mass transfer resistance and ensure homogeneous contact between the aluminum particles and the 1.0 M NaOH solution, constant magnetic stirring at 400 rpm was applied using a hot plate stirrer. The reaction temperature was strictly maintained at 55 ± 1 °C using a PID controller integrated into the heating plate, complemented by an external thermal insulator to mitigate heat loss from the exothermic reaction.
Prior to each experimental run, the entire setup—including the reactor, the silica gel (SiO2) serpentine, and the connecting hoses—was subjected to a leak test by temporarily pressurizing the system and monitoring for pressure drops, thereby ensuring complete hermeticity. The volumetric hydrogen flow rate was continuously recorded using a Cole-Parmer digital flowmeter. To validate the measurements, the flowmeter was pre-calibrated using a standard water displacement method. The overall experimental uncertainty for the volumetric flow measurements, considering the instrumental sensitivity (±0.01 mL/min) and propagated errors, was estimated to be less than 5%. Given that the theoretical maximum hydrogen yield matched the integrated volume obtained, the purity of the evolved gas was considered highly consistent with the expected reaction stoichiometry (Equations (1) and (3)), with the silica gel effectively preventing moisture interference.
Three repetitions were performed for each particle size distribution. The same procedure was carried out for particles sized 300–425 µm and 425–500 µm. Hydrogen production occurred through Al–NaOH reactions (see Equations (4) and (5)), in a cyclic process where environmental pollution is avoided and aluminum is efficiently reused [14,15,18,19,20].
2Al(s) + 2NaOH(s) + 6H2O(l) → 2Al(OH)3(aq) + 3H2(g)
2Al(s) + 2Al(OH)3(aq) + 4NaOH(s) + 6H2O(l) → 4NaAl(OH)4(aq) + 3H2(g)
Bayerite, a form of aluminum hydroxide (Al(OH)3), dissolves in NaOH to produce soluble NaAl(OH)4. This reaction is a key step in the Bayer process [37]. The ratio of the Al(OH)3(aq) (Bayerite) to NaAl(OH)4(aq) on the reaction (5) is basically independent of temperature [38]. Moreover, the oxidative behavior of aluminum in hydrogen production strongly depends on the nature of the dissolved species present when it interacts with aqueous solutions. Machanás et al. have taken advantage of this behavior to develop a new sustainable method (the AlHidrox process) to produce hydrogen from water under mild conditions, in such a way that they have achieved to reduce the surface passivation of aluminum for produce hydrogen through a process that allows reduced hydrogen production costs [39].
In early moments aluminum comes into contact with the environment, it forms on the aluminum an oxide film (Al2O3) of about 2–4 nanometers on its surface [40]. This Al2O3 on the aluminum surface is not homogeneous and has imperfections, through its ambient humidity comes into contact with aluminum, forming aluminum hydroxide Al(OH)3 on its surface and releasing H2 into the environment (see Equation (3)). The formation and consequent growth of Al(OH)3 on the aluminum surface minimizes the reaction with water molecules in the early moments. Although in alkaline conditions Equation (1), is favored by the destruction of Al2O3 on the surface, giving reaction product NaAl(OH)4 and the release of hydrogen into the environment. Hydrogen generation is increased by the interaction of the alkaline medium (NaOH) with the aluminum surface and by the same hydrogen generated by the embrittlement mechanism [41].
In addition, the average flow and the average volume of hydrogen produced were determined where different stages during hydrogen production were identified. The compounds and phases formed from the residual products were characterized by X-ray diffraction (XRD), and scanning electron microscopy (SEM).
To establish a rigorous kinetic framework beyond empirical correlations, the cumulative volume of hydrogen generated in the reactor was converted into the aluminum conversion degree (α), defined as: α = V t V m a x , where V t is the hydrogen volume at time t and V m a x is the total hydrogen volume produced.
The experimental conversion–time profiles were analyzed using the Shrinking Core Model [42]. To identify the rate-controlling step of the solid–liquid reaction between aluminum and the NaOH solution, the data were fitted to the following fundamental expressions:
Surface   chemical   reaction   control :   1 ( 1 α ) 1 / 3 = k r t
Diffusion   control   through   the   product   layer :   1 3 ( 1 α ) 2 / 3 + 2 ( 1 α ) = k d t
where k r and k d are the apparent rate constants for chemical reaction and diffusion control, respectively.
Finally, the reaction rates were normalized with respect to the initial surface area, calculated under the assumption of spherical particle morphology and mean diameters for the three sieved size fractions, in order to decouple intrinsic kinetic effects from geometric influences.

3. Results

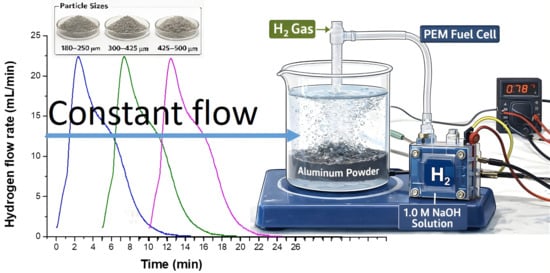
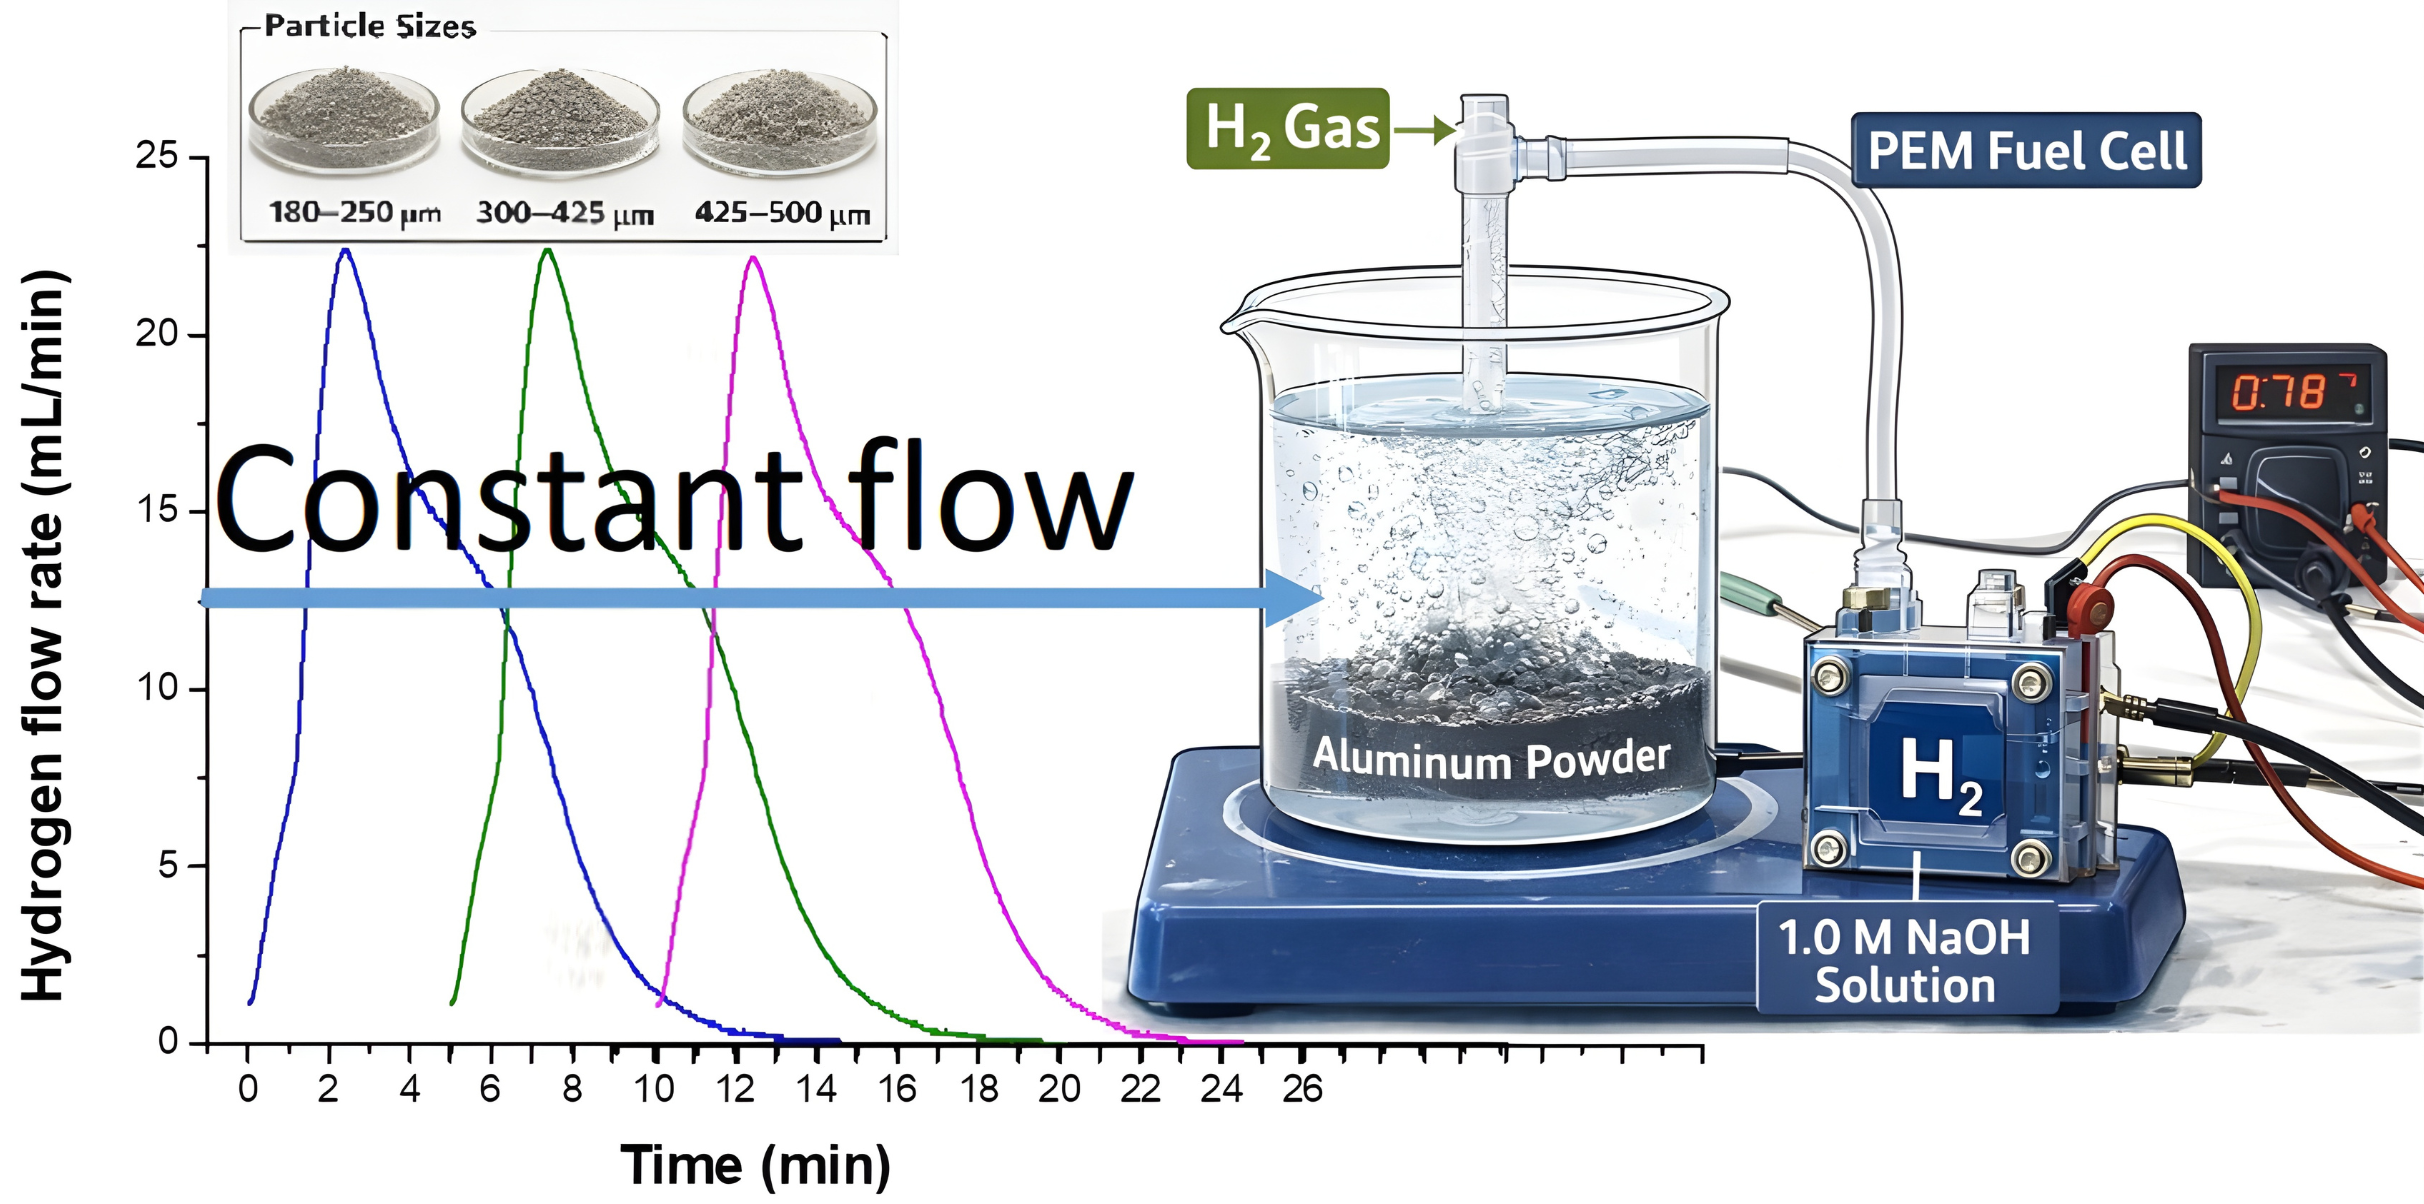
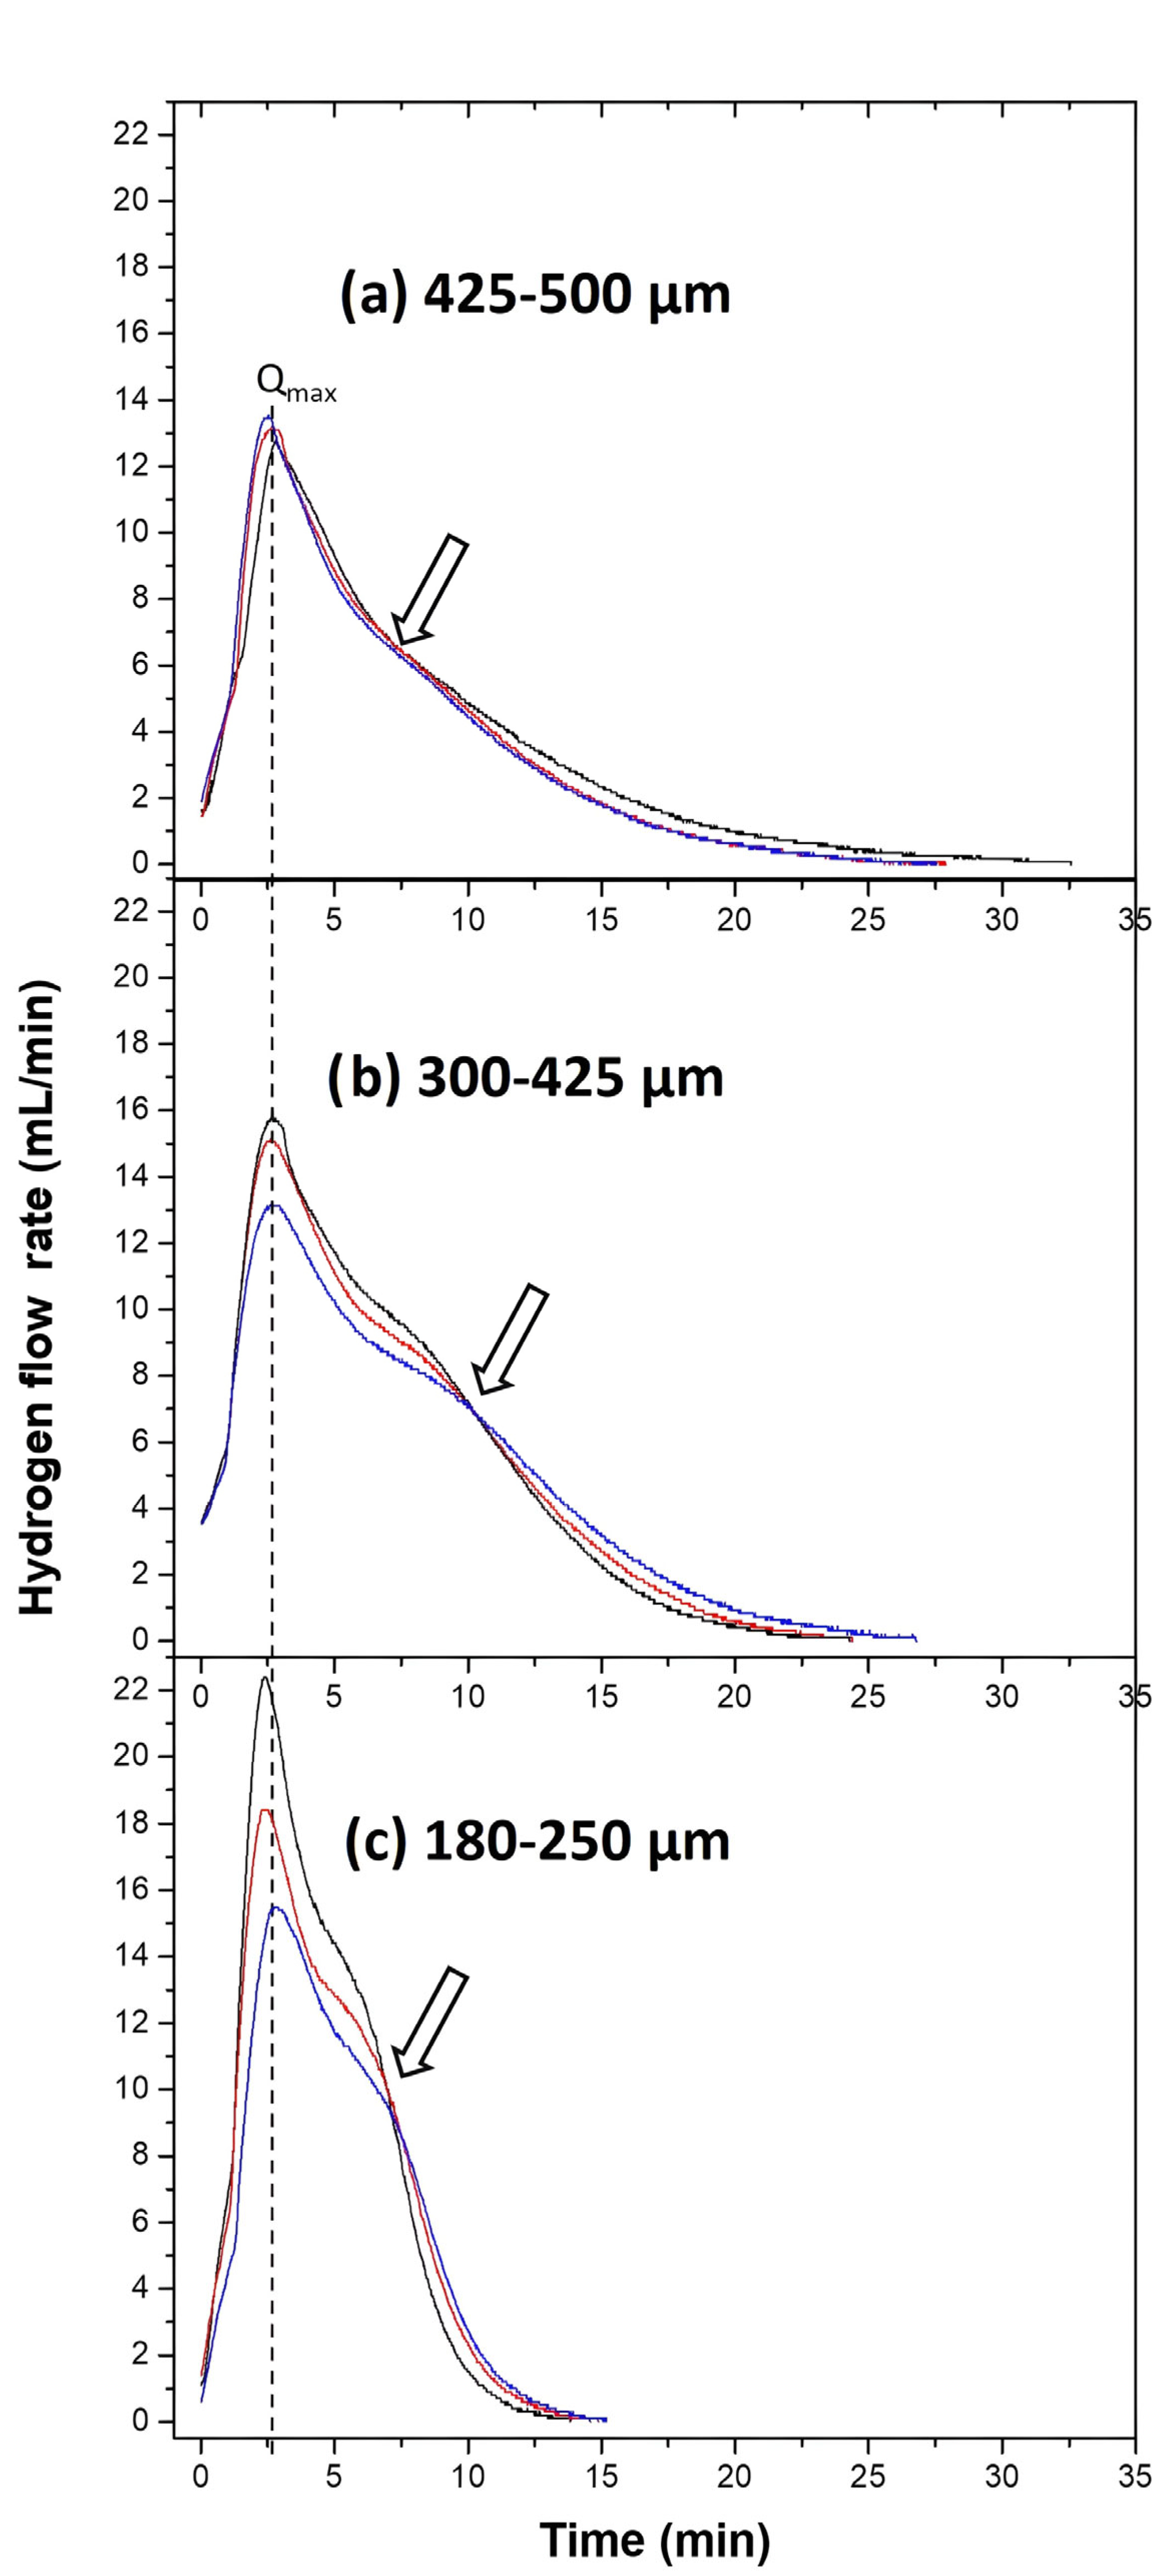
Figure 3 shows the three hydrogen production flux curves as a function of time for each particle size distributions ((a) 425–500 µm, (b) 300–425 µm, and (c) 180–250 µm). The behavior of the H2 fluxes for the three particle sizes is described in two stages (separated by a dashed line): the first occurs in the initial moments of interaction of the aluminum particles with the NaOH solution, which tends to increase to a maximum flow rate (Qmax) of approximately 13 mL/min. Then, in the second stage, the flow rates tend to decrease to values close to zero. This effect is due to the increased thickness of the Al2O3 coating on the aluminum particles according to the Cabrera–Mott mechanism [43]. On the other hand, an increase in hydrogen flux is observed as the particle size decreases; for example, in size distribution (b) the Qmax reached varies from 13 to 16 mL/min, while in distribution (c) it varies from 15 to 22 mL/min, from this it can be deduced that the decrease in particle size plays an important role in the kinetics of hydrogen production.
An inflection point can also be seen in the curve, after passing through the maximum indicated by arrows for each particle distribution. This suggests a second hydrogen production reaction, albeit at a lower rate compared to the first region.
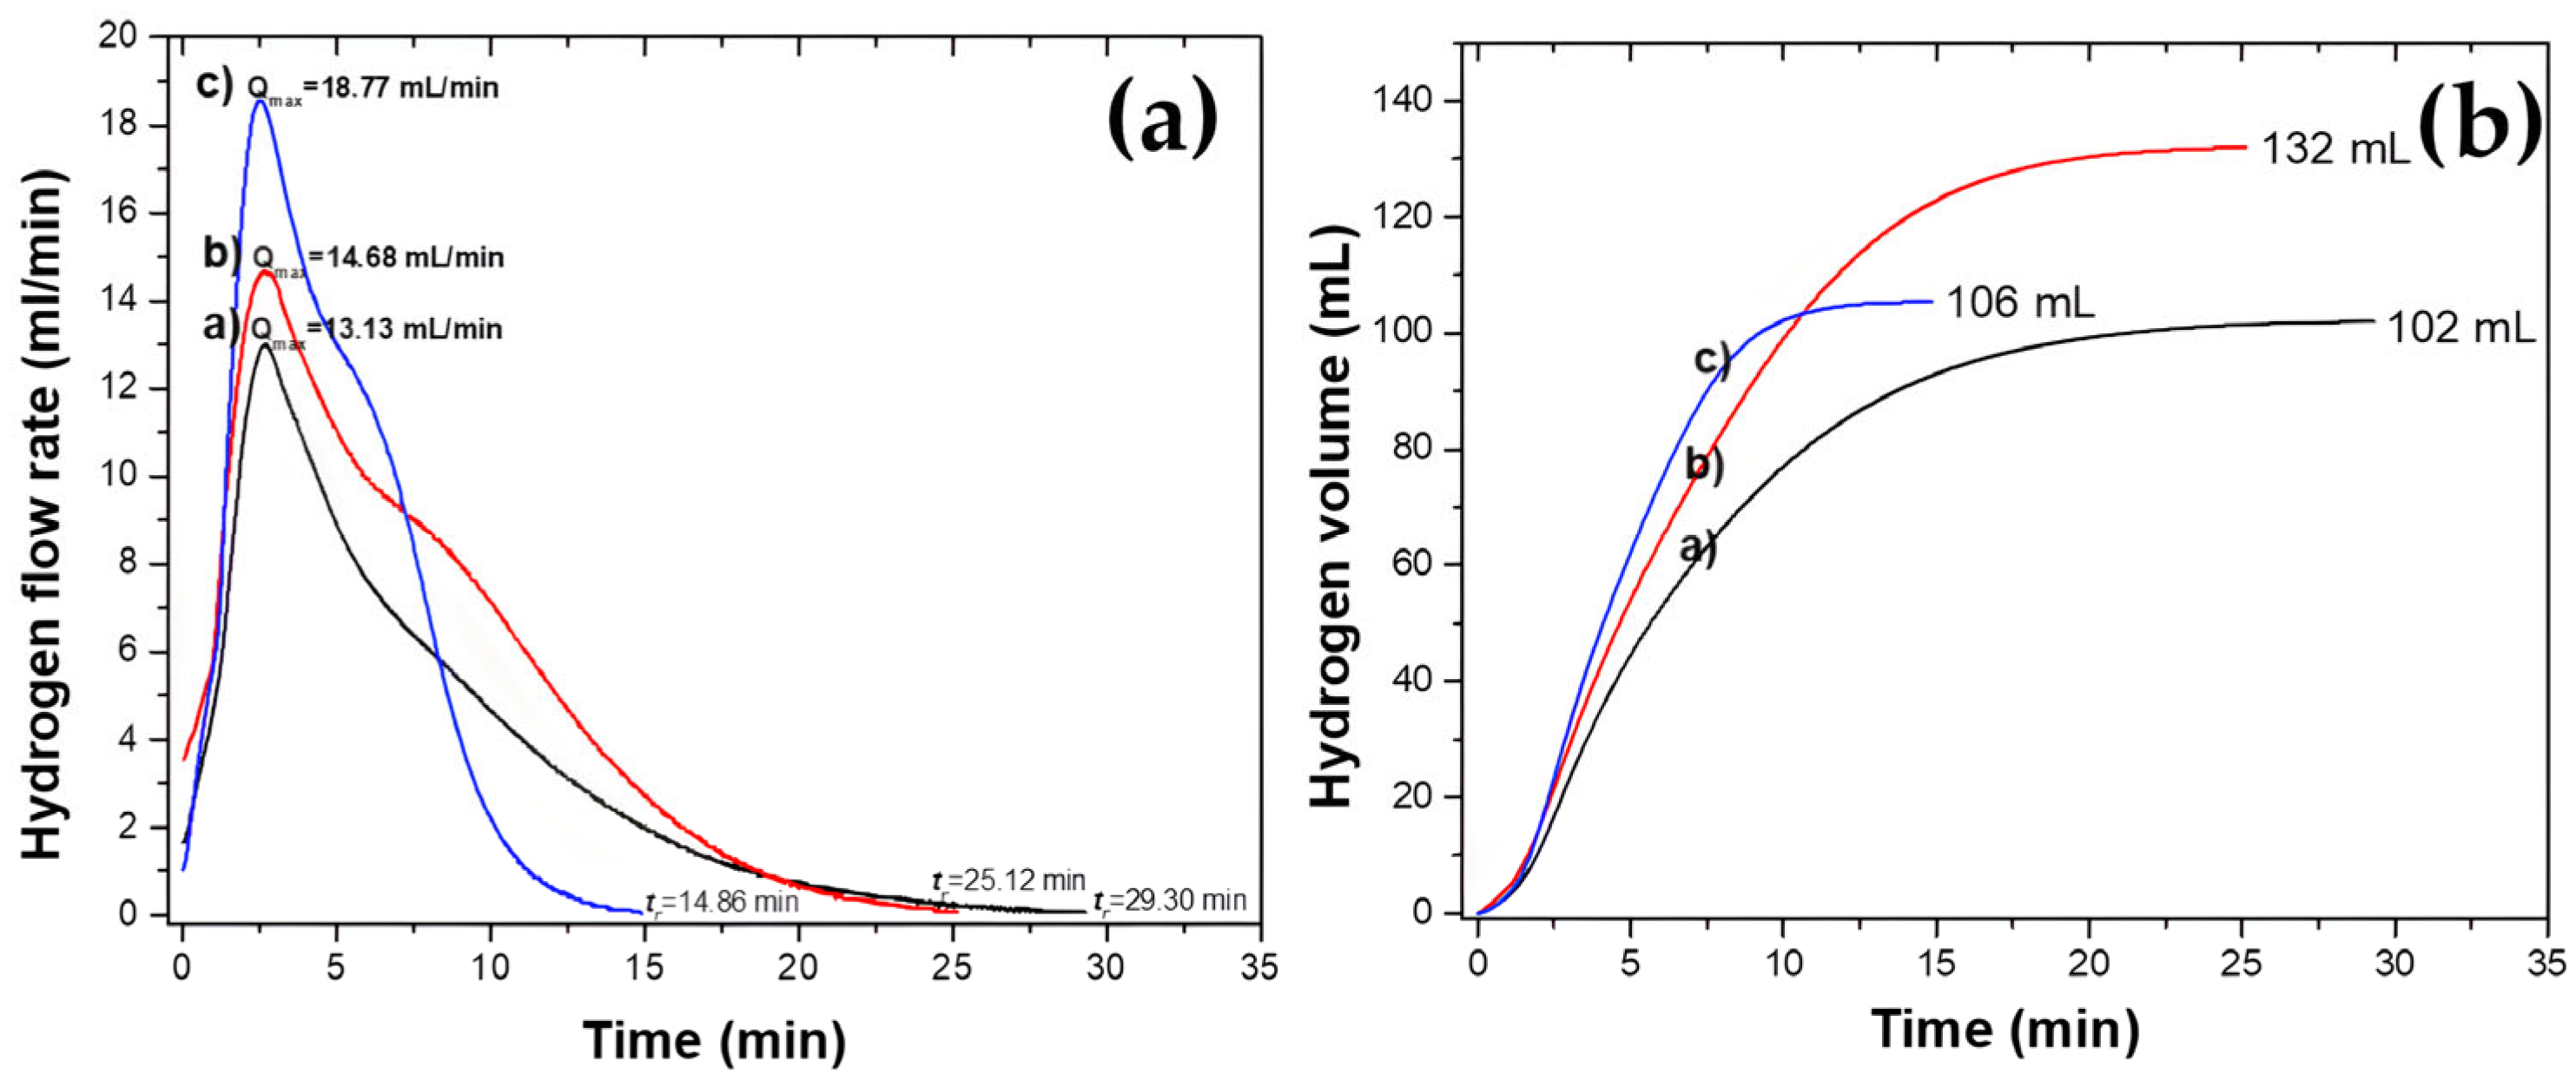
Figure 4a presents the average hydrogen flow curve, where the behavior of each hydrogen production process can be observed in greater detail. Also, it shows that the Qmax obtained for each particle size distribution (a), (b) and (c) are 13.13, 14.68, and 18.77 mL/min, respectively, indicating an increase as particle size decreases. Furthermore, the curves indicate hydrogen production reaction times (tᵣ) of 29.30, 25.12, and 14.86 min for cases (a), (b), and (c), respectively, revealing a decrease in t r with decreasing particle size.
Figure 4b shows the cumulative volume obtained from the H2 production flow data as a function of time. This figure shows that particle size curve (a) accumulates a volume of 102 mL, while curve (b) accumulates 132 mL and curve (c) 106 mL of hydrogen. This interesting result suggests the following explanation: in the first region, the particles react very rapidly, achieving a very high flow rate and becoming coated with Al(OH)3, which quickly decreases the hydrogen production reaction, resulting in a smaller cumulative volume. Thus, larger particles have a longer reaction time compared to smaller particles.
To quantitatively evaluate the effect of the average particle size (dp) on the Qmax and tr, a statistical analysis of the experimental results was carried out. Table 2 presents the descriptive statistics of the variables studied. The average particle size (dp = 215, 363 and 463 µm) was used as the input factor, while the Qmax and the tr obtained in each experiment were considered as the response variables.
To characterize the dispersion of the experimental data, the main statistical parameters were calculated. All experiments were performed in triplicate (n = 3). The data are expressed as the mean ± the standard error of the mean (SEM*), which was chosen to illustrate the precision of the estimated average values for the maximum hydrogen flow rate and reaction time across the different particle size distributions.
Based on the observed behavior of the average Qmax values as a function of particle size, a power-law model is proposed to describe the relationship between these variables, expressed as follows:
Q m a x = a d p b
where:
Qmax represents the dependent variable;
dp corresponds to the independent variable;
a is a proportionality constant;
b is the characteristic exponent of the model.
To determine the constants a and b using linear regression techniques, a natural logarithmic transformation was applied to both sides of Equation (6). By taking the natural logarithm (ln), the following expression (Equation (7)) is obtained:
ln(Qmax) = ln(a) − b ln(dp)
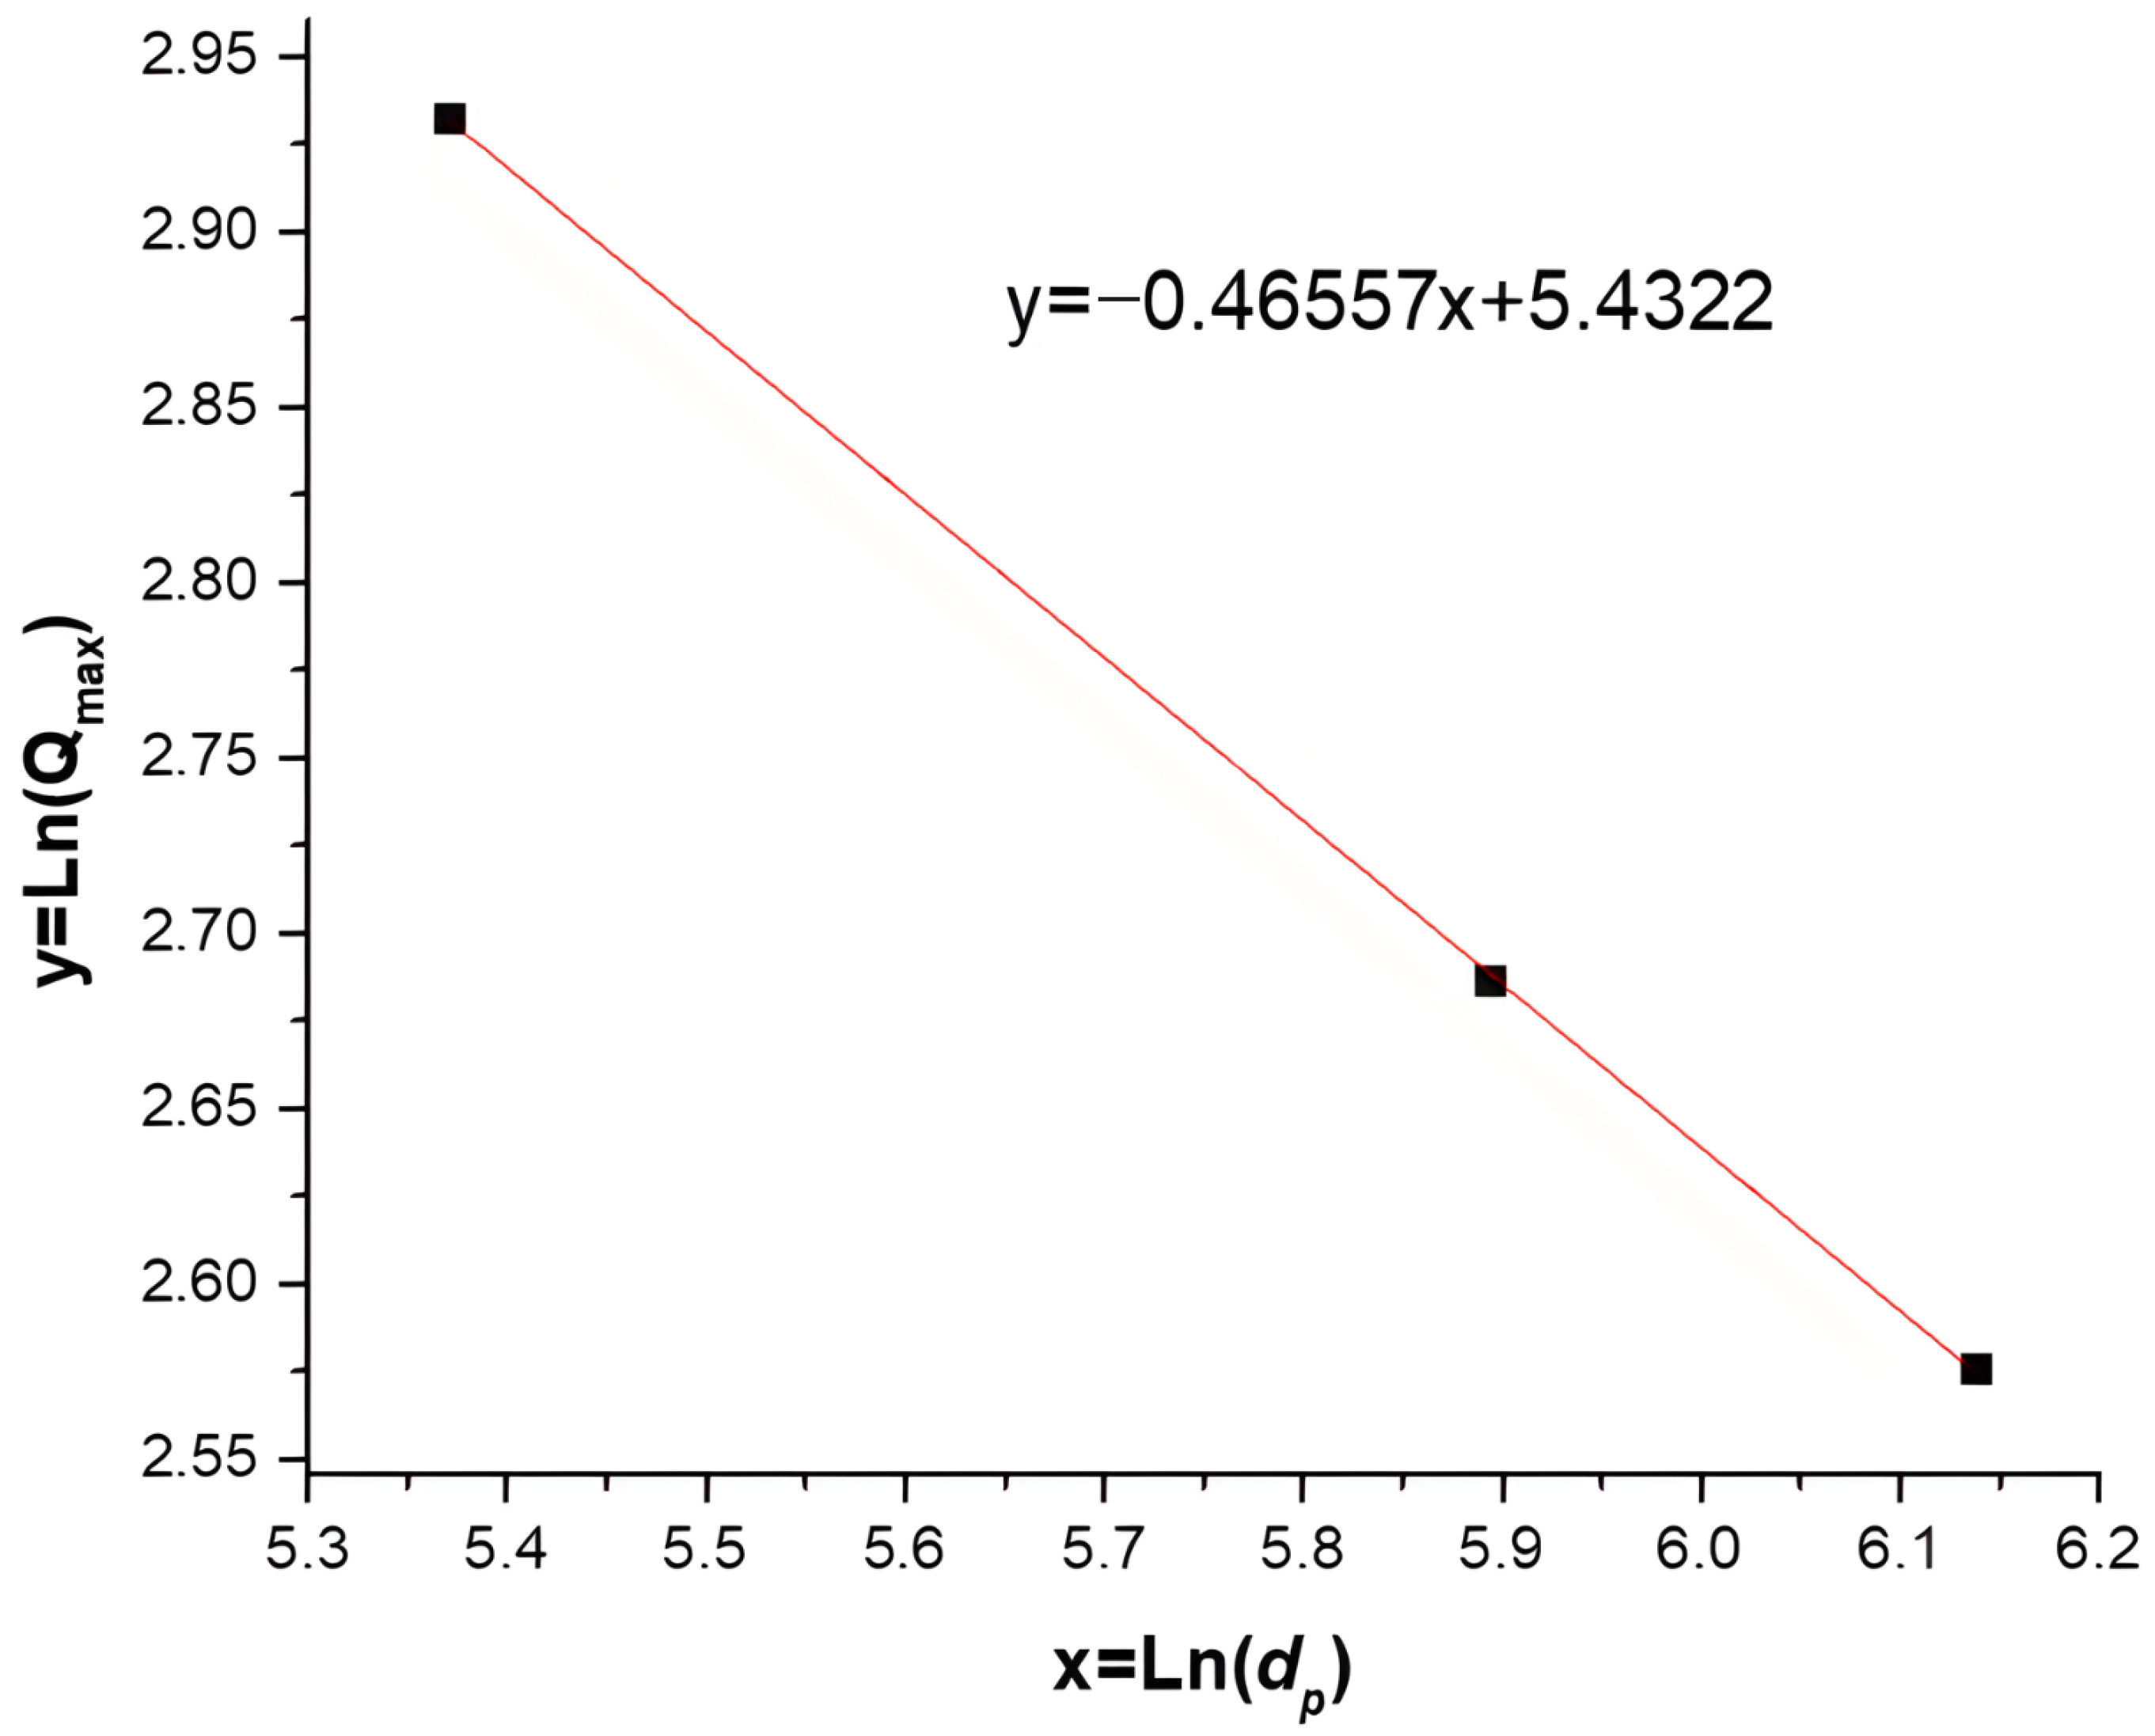
This transformation converts the power-law model into a linear relationship between the variables: y = ln(Qmax) and x = ln(dp) which allows the model parameters to be estimated using simple linear regression. Based on the average values of the maximum flow rate and particle size presented in Table 2, a data linearization procedure was performed, and the results are summarized in Table 3. Subsequently, Figure 5 shows the graphical representation of ln(Qmax) as a function of ln(dp). This plot allows the parameters of the power-law model to be determined from the slope and the intercept of the fitted linear regression line.
Through linear regression fitting of the logarithmically transformed data, the parameters of the proposed power-law model were determined. In this linear representation, the slope of the fitted line corresponds to the value of −b, while the intercept represents the term ln(a).
Based on this procedure, the following power-law model was obtained, which describes the relationship between particle size and the maximum hydrogen flow rate:
Q m a x = 228.652 d p 0.46557
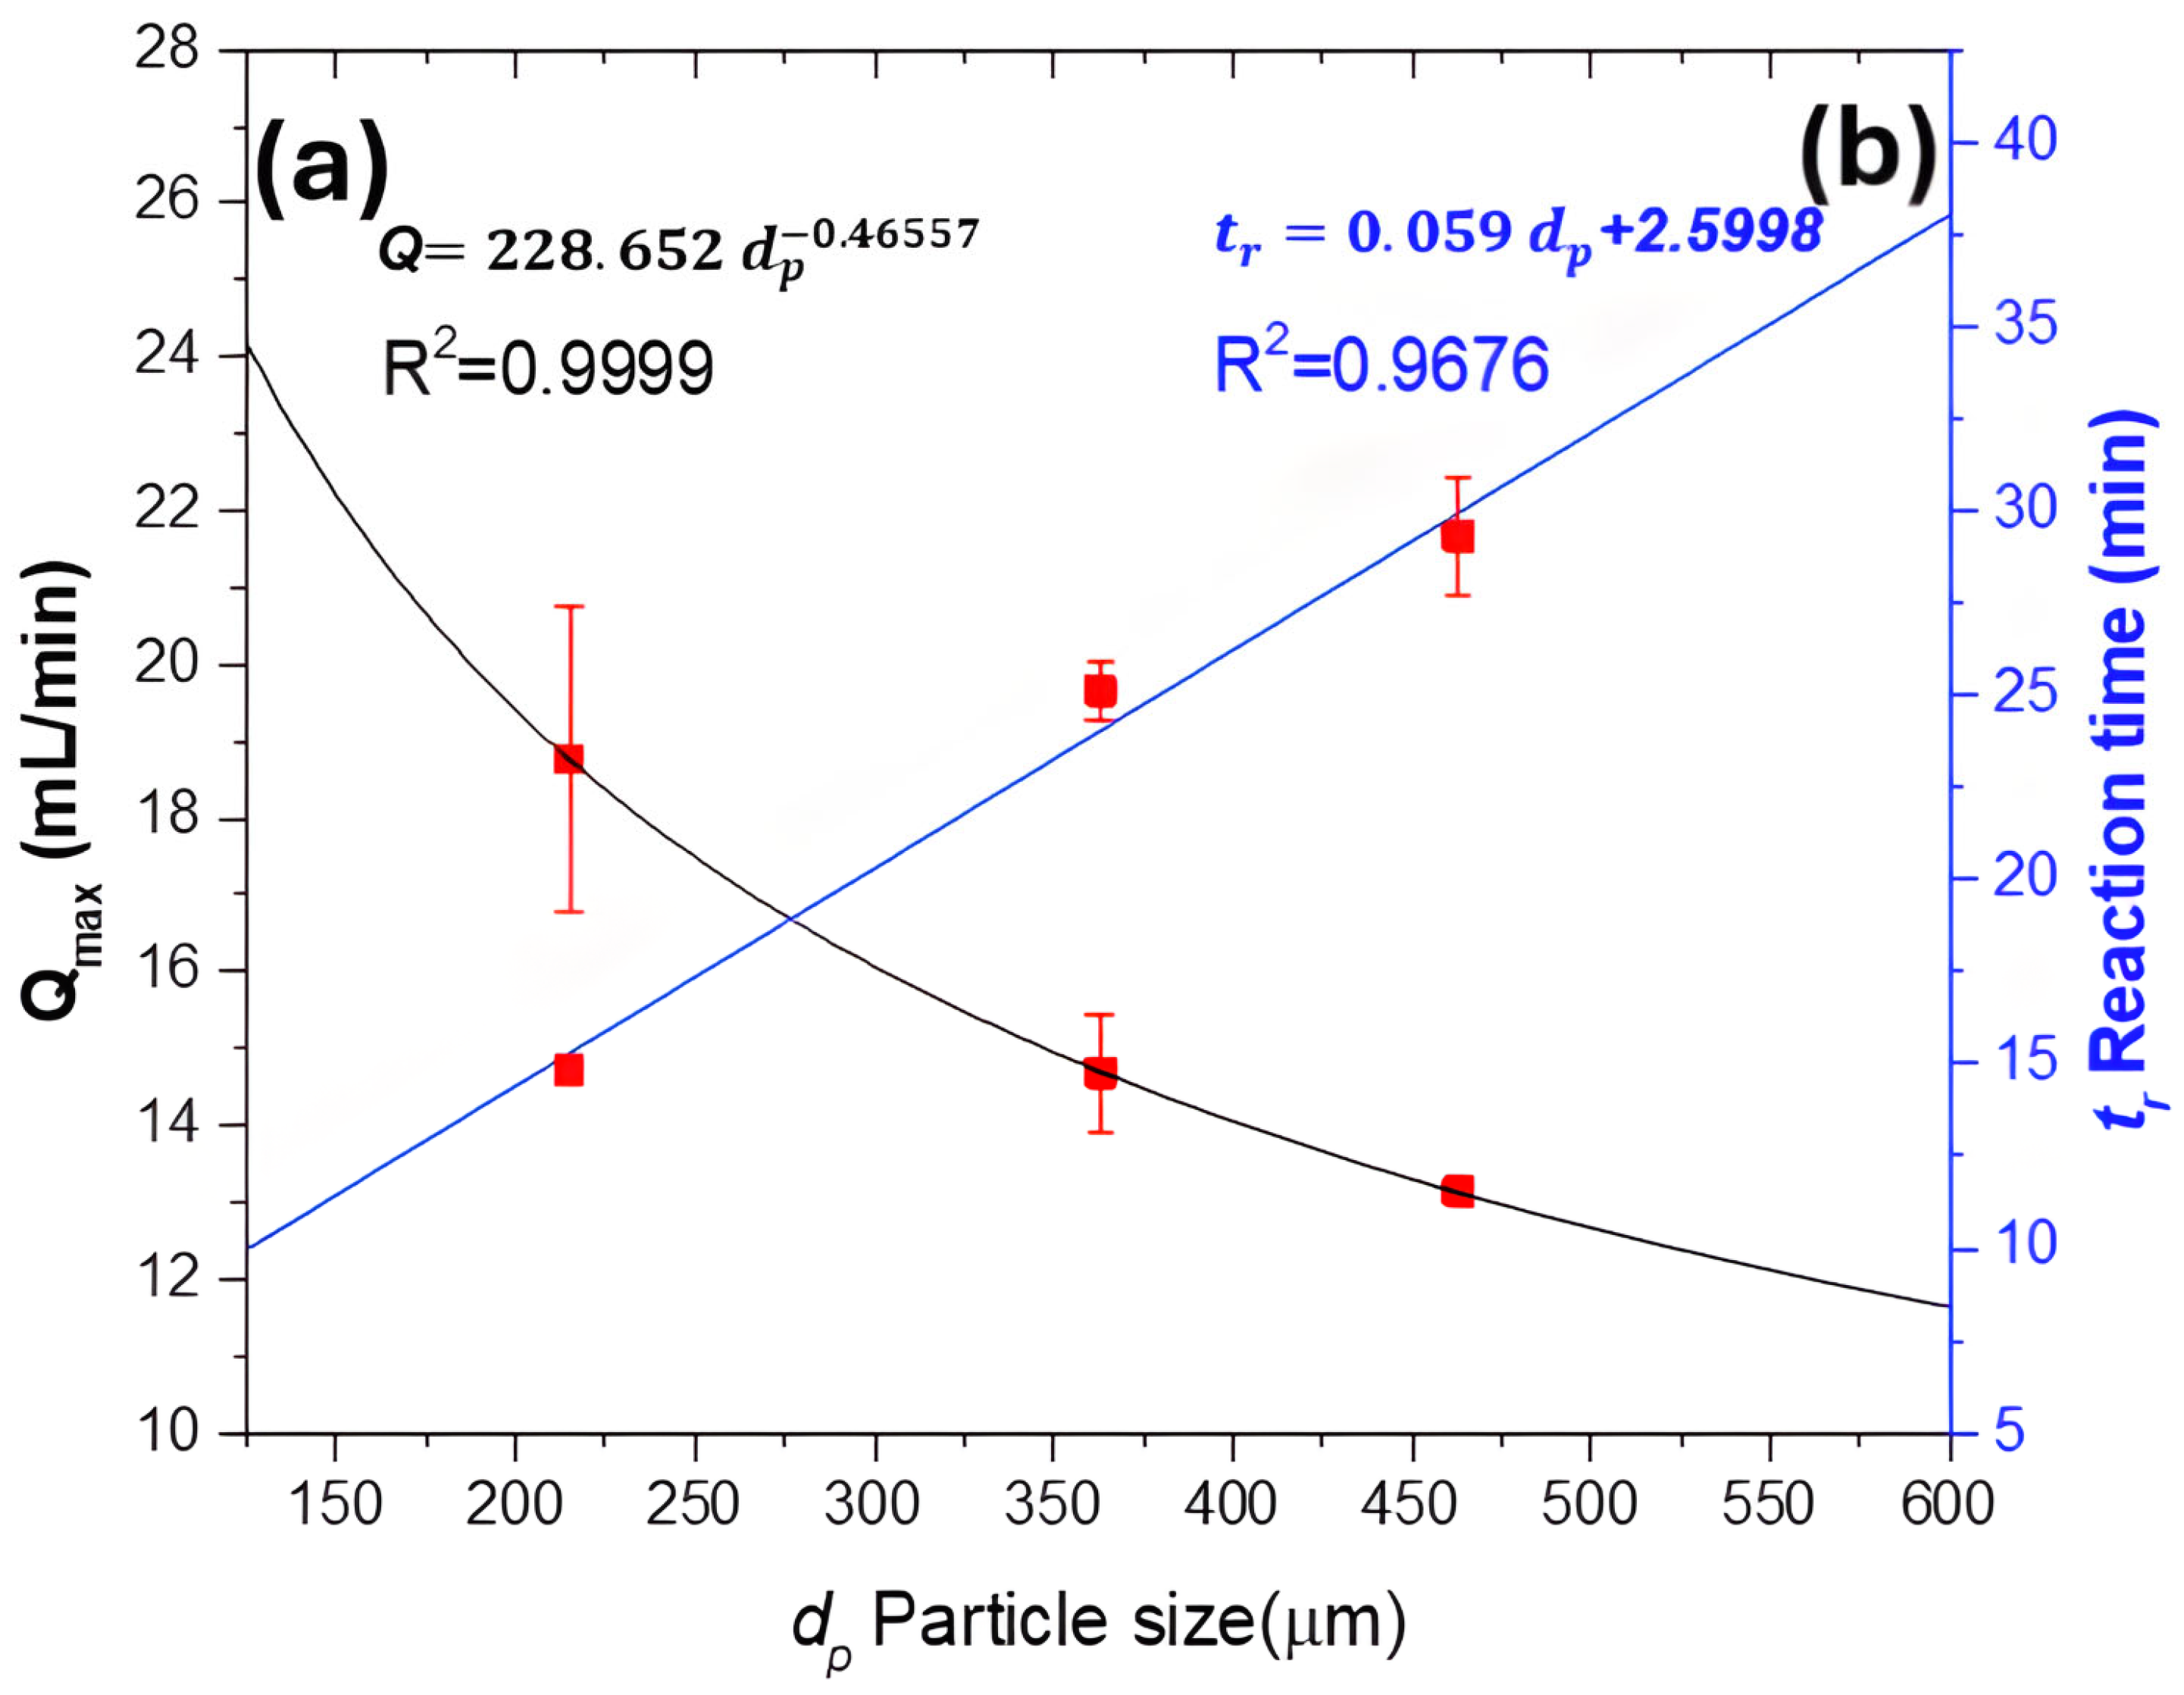
The statistical analysis of the fit showed a coefficient of determination R2 ≈ 0.9999, indicating that approximately 99.99% of the observed variability in the maximum flow rate can be explained by the proposed power-law model (see Figure 6a).
On the other hand, in order to analyze the relationship between particle size ( d p ) and reaction time ( t r ), the average values reported in Table 2 were used. Based on a preliminary observation of the data behavior, a simple linear regression model was proposed, described by Equation (9):
t r = m d p + b
where:
d p = particle size (µm);
t r = reaction time (min);
m = slope of the linear regression;
b = y-intercept.
The parameters corresponding to the slope m and the intercept b were determined by linear regression fitting, and the results are presented in Figure 6b. From this analysis, the following empirical expression was obtained (Equation (10)):
t r = 0.059 d p + 2.5998
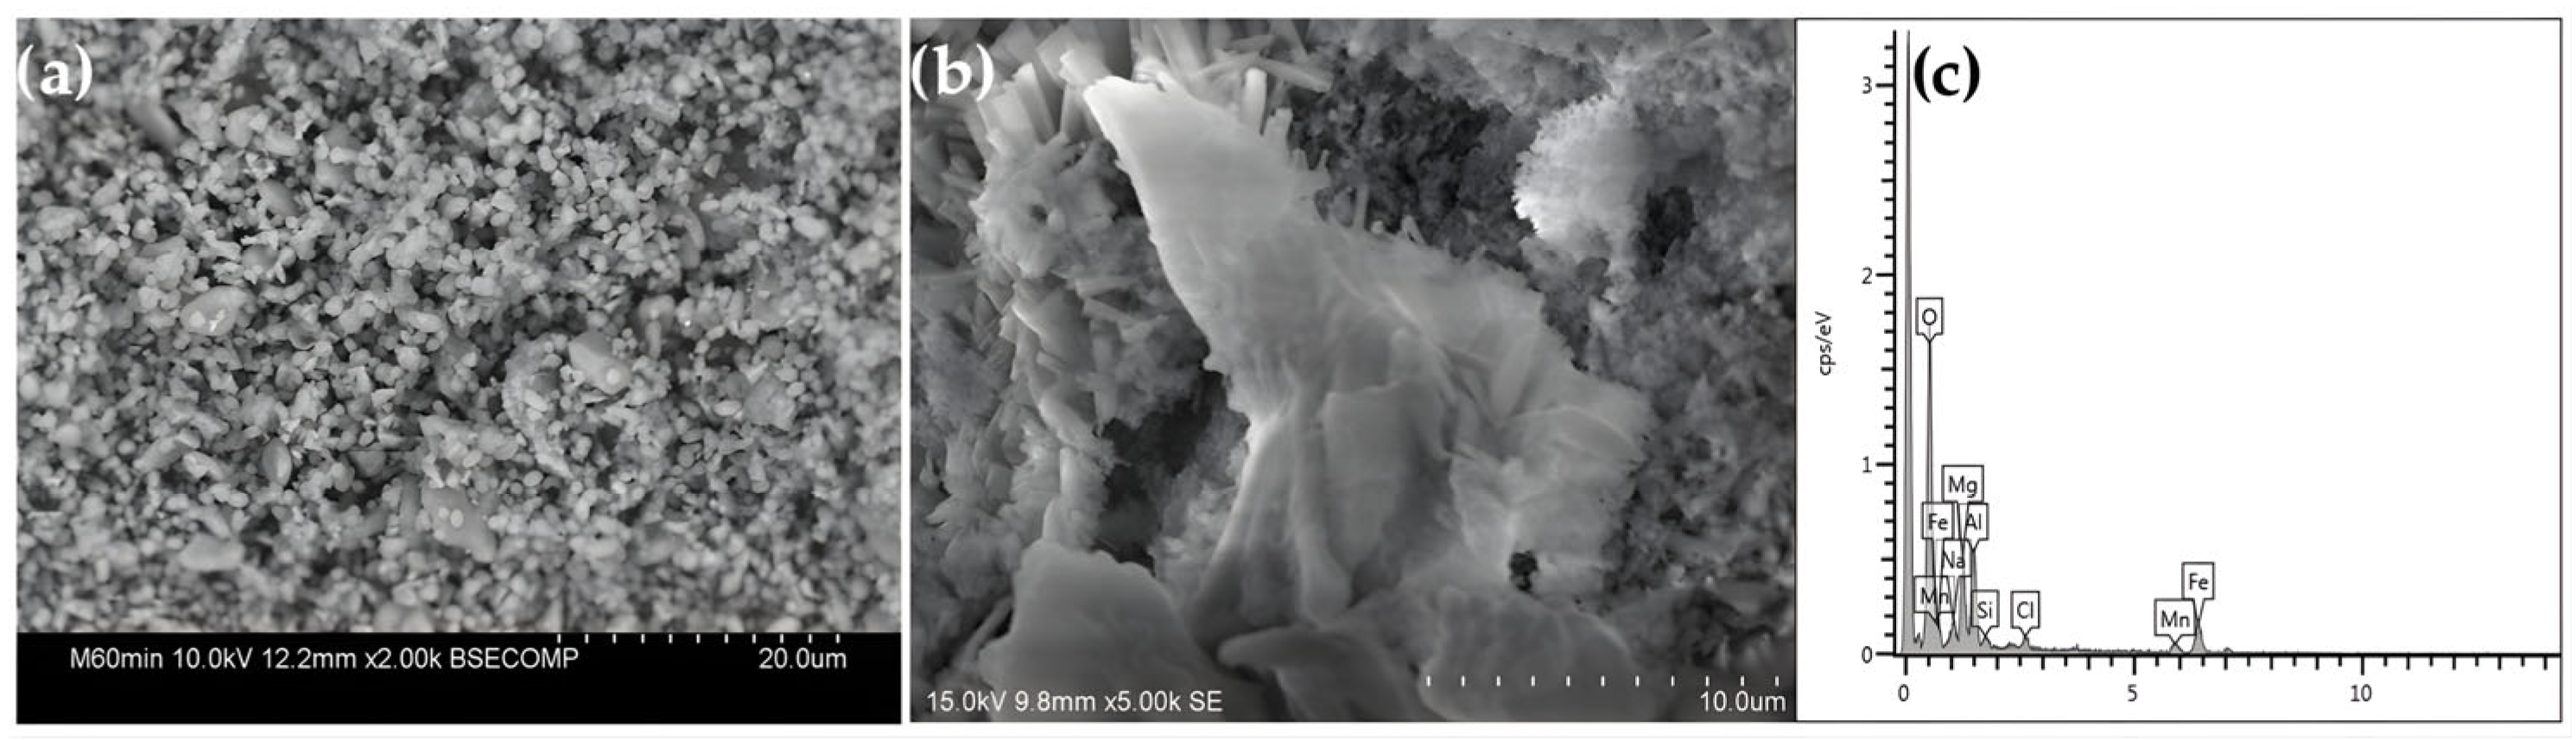
To determine the microstructural features of the samples after the experiments, scanning electron microscopy (SEM) was performed, as shown in Figure 7. Backscattered electron imaging reveals a homogeneous powder distribution at a magnification of 2000× (Figure 7a). A gray-scale contrast associated with oxidized particles coated with Al(OH)3 can also be observed. For a more detailed observation, secondary electron imaging was conducted at a magnification of 5000× (Figure 7b), where the acicular growth of the Al(OH)3 phase on the surface of the aluminum alloy particles is clearly visible. Furthermore, the coexistence of the main alloying elements was identified by Energy-dispersive X-ray spectroscopy (EDS), as presented in Figure 7c. Oxygen is detected in the highest proportion, which is attributed to the oxidation of aluminum. The remaining elements, including Fe, Mg, Mn, Na, and Si, correspond to the alloy constituents listed in Table 1. Chlorine (Cl) was also detected, which is attributed to impurities in the NaOH reagent.
These microstructural observations support the kinetic results obtained during hydrogen generation, indicating that the reaction proceeds through surface oxidation of aluminum particles followed by the precipitation of Al(OH)3, which progressively modifies the reactive surface during the process.
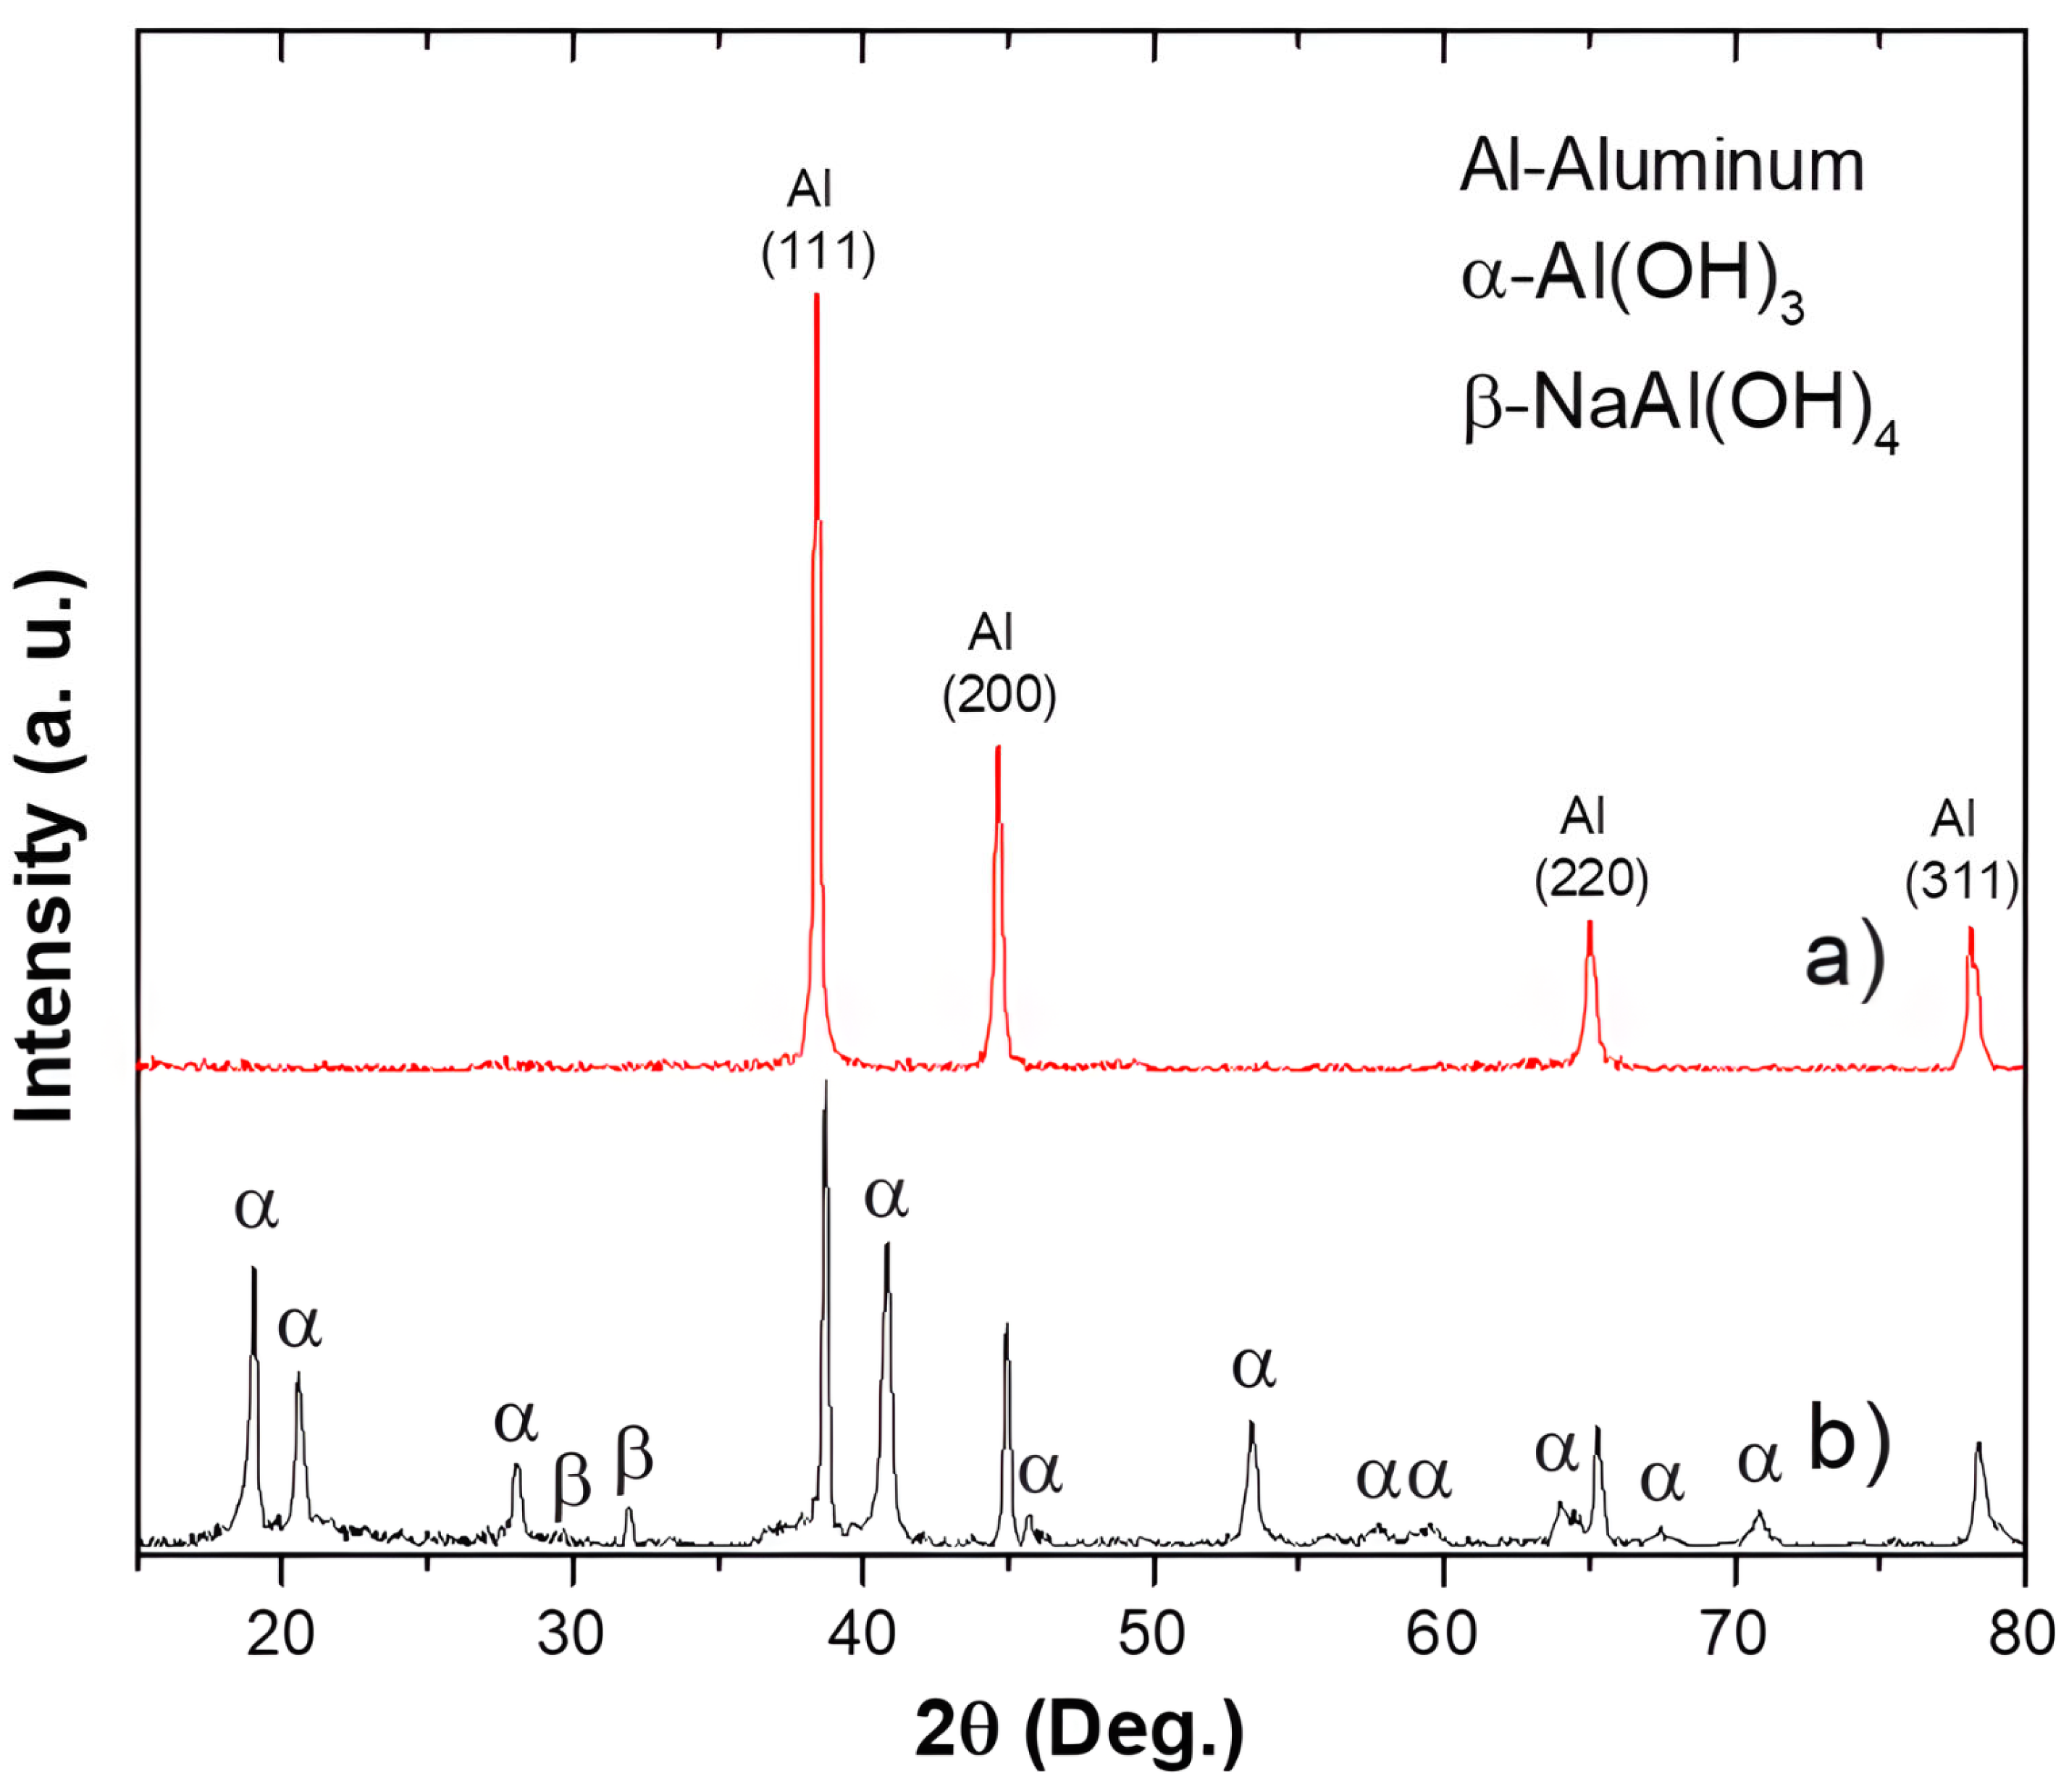
The samples were subjected before and after to X-ray diffraction (XRD) to determine the phases of the byproducts of the production reaction between aluminum and the alkaline medium of sodium hydroxide (see Figure 8). Figure 8a shows the XRD pattern of the powder sample before being subjected to the hydrogen production reaction. It displays the typical crystalline structure of aluminum with its respective principal crystallographic planes (111), (200), (220), and (311), which diffract in this 2θ region according to Bragg’s law. It is important to note that the alloying chemical components shown in Table 1 are not visible in the pattern. This is because the alloying elements are randomly distributed within the aluminum structure and at grain boundaries, as previously reported [44]. According to the random distribution of alloying elements within the aluminum matrix and at grain boundaries, several critical microstructural effects occur. The XRD pattern corresponding to the sample subjected to the hydrogen production reaction is shown in Figure 8b, where it is possible to determine the coexistence of phases such as: Al, Al(OH)3, and NaAl(OH)4. These results confirm that hydrogen generation occurs through the alkaline oxidation of aluminum, leading to the formation of hydroxide and aluminate phases (Equations (1)–(5)), while residual metallic Al indicates that the reaction proceeds progressively from the particle surface.

4. Discussion

The differences in hydrogen generation kinetics (Figure 3) are primarily attributed to particle size effects resulting from the mechanical fragmentation of the aluminum ingot. Particle size reduction increases specific surface area and surface energy, thereby enhancing aluminum dissolution in alkaline media [32,36,40]. In addition, smaller particles exhibit a higher density of surface defects, facilitating oxide disruption, and accelerating hydrogen evolution [22,45,46,47,48].
For the largest particles (425–500 μm), a lower Qmax (~13 mL·min−1) and longer induction time (~30 min) were observed. In contrast, the intermediate fraction (300–425 μm) showed improved performance (~15 mL·min−1) with more sustained hydrogen production, indicating particle size-dependent kinetics [49]. The smallest particles (180–250 μm) reached the highest Qmax (~19 mL·min−1) rapidly, followed by a decline due to the formation of an Al2O3/Al(OH)3 layer that limits mass transfer [50,51]. While smaller particles enhance initial reactivity, the intermediate size range provides a better balance between surface area and reaction stability, resulting in the highest cumulative hydrogen production (Figure 4b). Hydrogen generation from recycled aluminum is comparable to that of activated or high-purity systems, despite simple operating conditions, highlighting its practical advantages [25,52,53,54,55,56]. The observed behavior is consistent with literature reports, with differences attributed to particle morphology, oxide thickness, and impurities [25,57].
The power-law model indicates a strong correlation between particle diameter and maximum hydrogen flow rate. The exponent (b = 0.46557) suggests a nonlinear inverse relationship characteristic of surface-dependent and mass transfer-controlled processes. Linear regression analysis yielded R2 = 0.9676, indicating that 96.76% of the variability in reaction time is explained by particle size. The positive slope (m = 0.059 min·μm−1) confirms that reaction time increases with particle size, consistent with surface-controlled kinetics, which is consistent with the research cited above.
On the other hand, SEM micrographs and XRD patterns confirmed the precipitation and acicular growth of an Al(OH)3 layer on the aluminum surface, a well-known feature of aluminum hydrolysis systems [58,59]. The progressive thickening of this layer acts as a diffusion barrier, hindering the transport of the alkaline solution toward the unreacted aluminum core [59]. Consequently, the reaction follows a shrinking unreacted core mechanism, consistent with the classical core–shell model [42].
To further elucidate the kinetic mechanism, experimental data were analyzed using the Shrinking Core Model. Initially, the exposed aluminum surface is in direct contact with the NaOH solution, resulting in a high hydrogen evolution rate (Figure 4b). As the reaction progresses, a porous product layer forms around the unreacted core, requiring diffusion of the reaction through this layer to sustain the reaction.
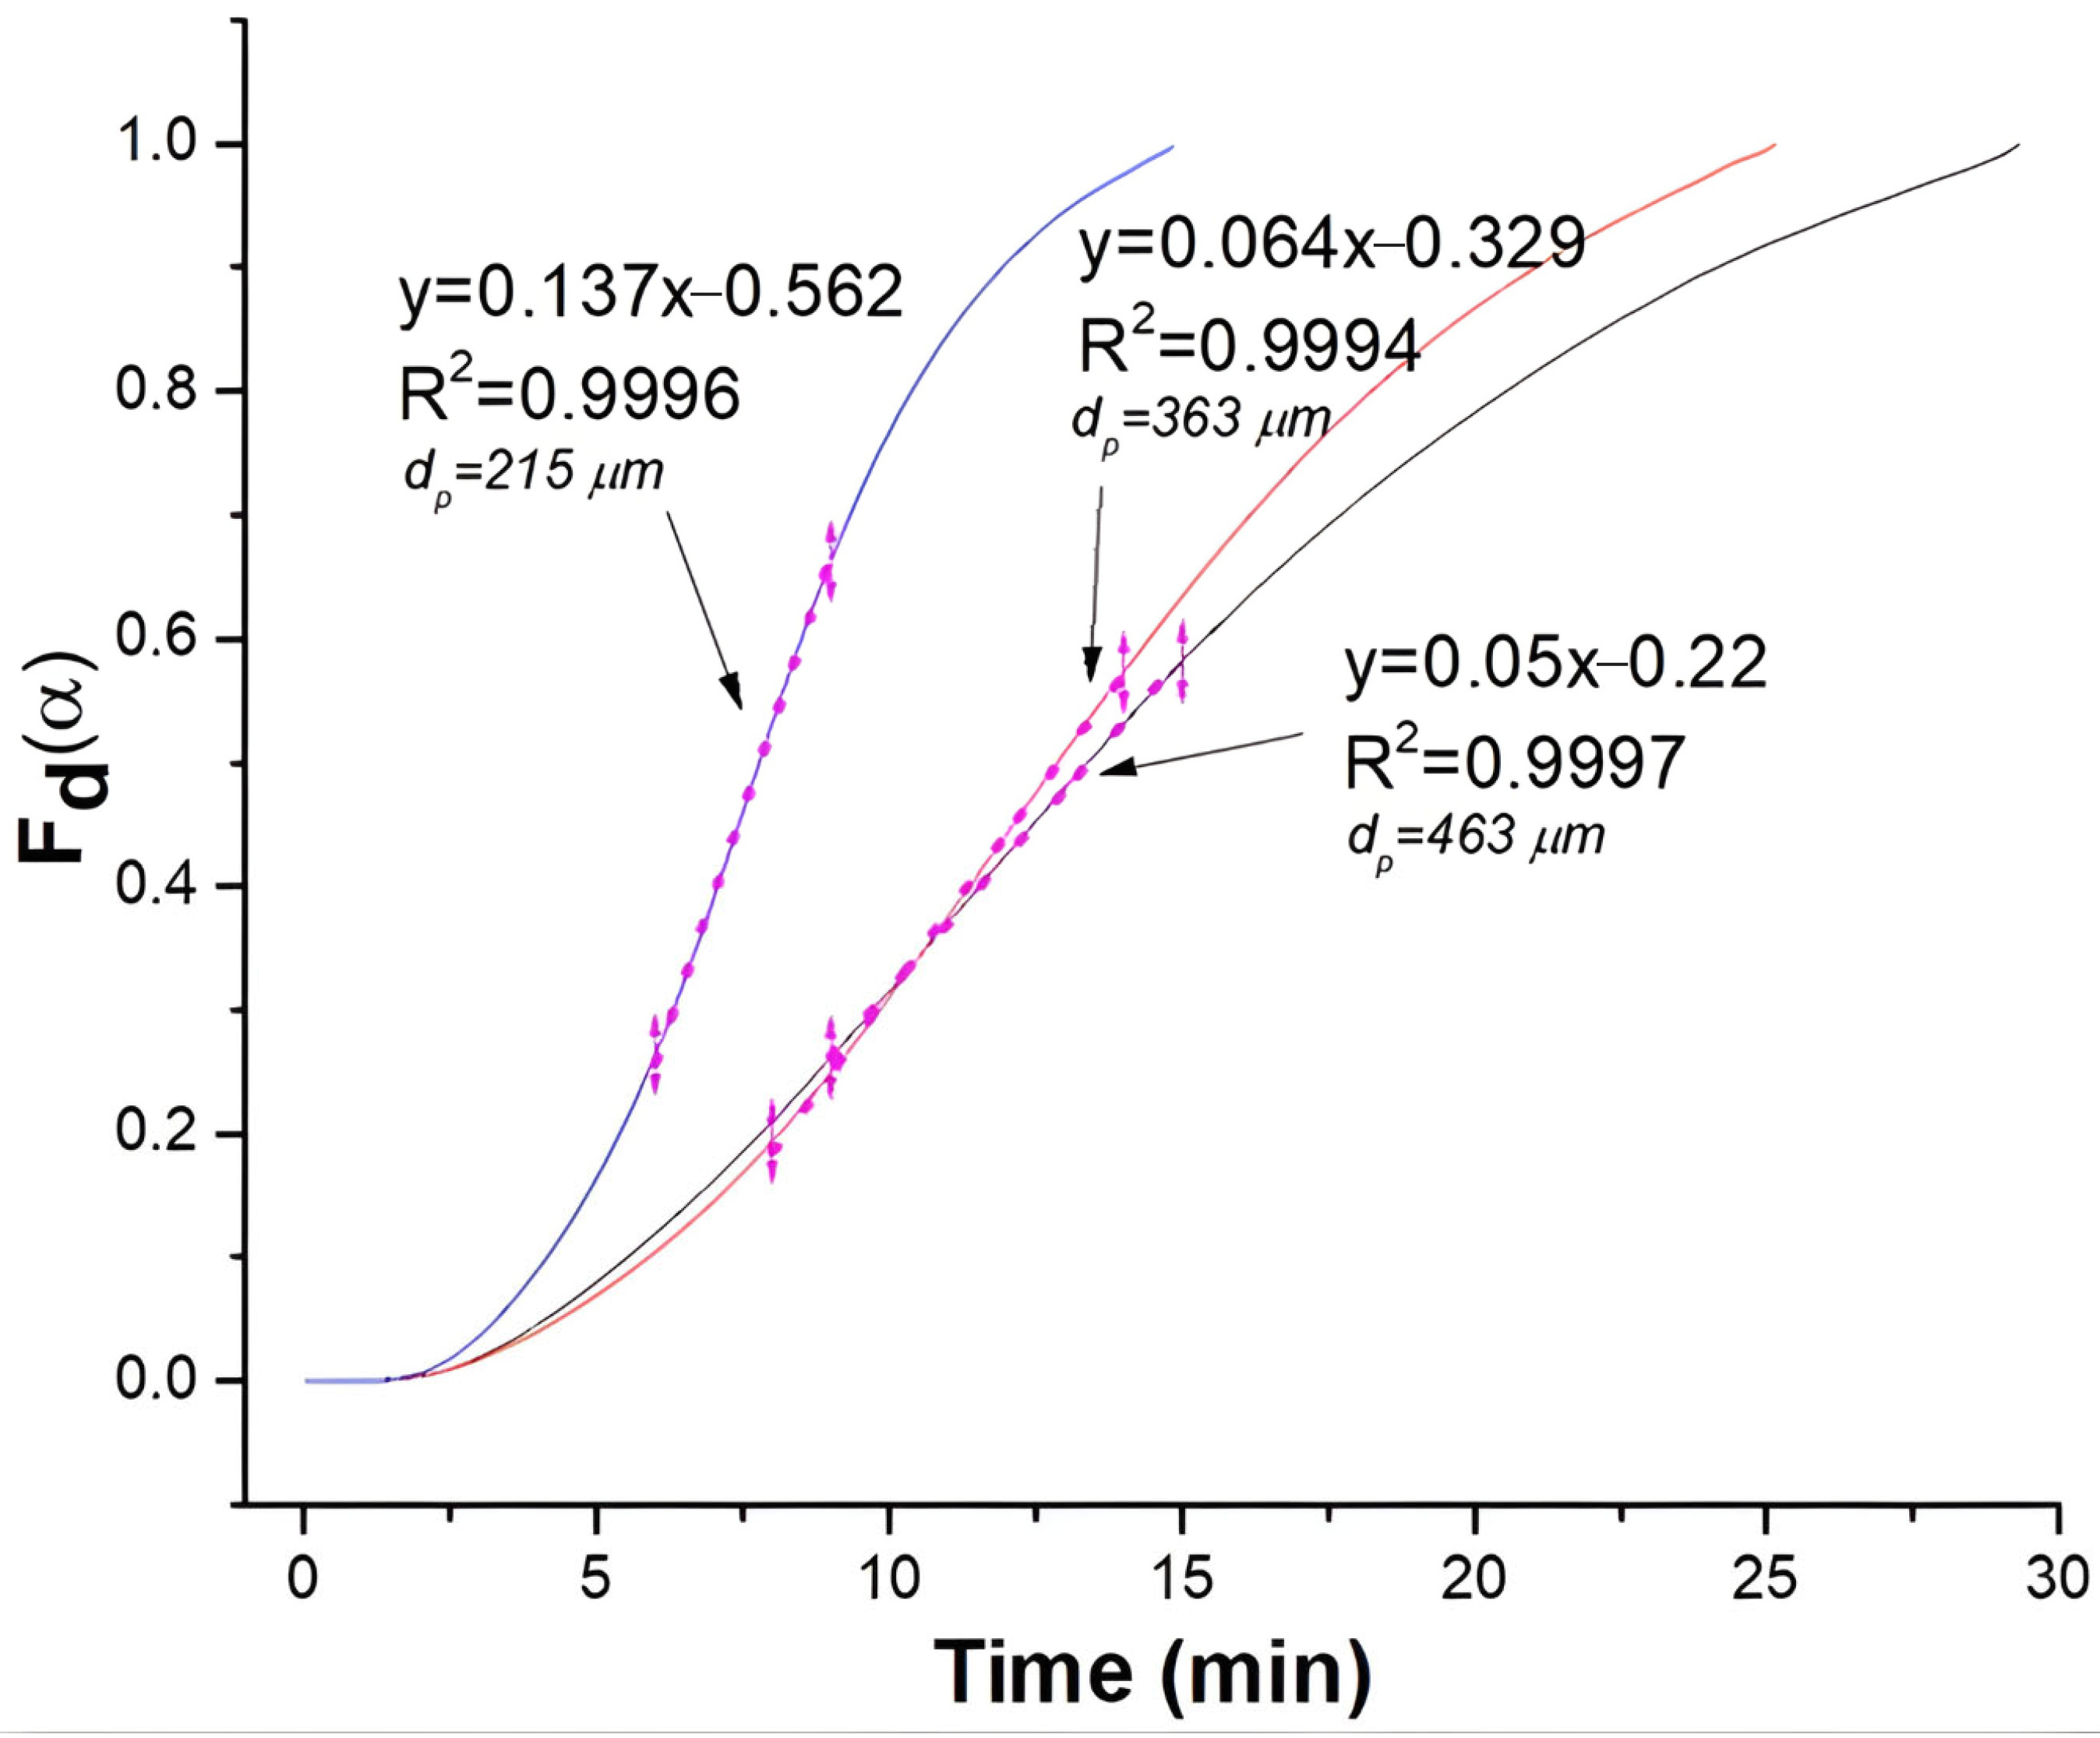
Assuming diffusion control through the product layer for spherical particles, the conversion-dependent expression (Equation (11)) was applied:
F d ( α ) = 1 3 ( 1 α ) 2 / 3 + 2 ( 1 α ) = k d t
where α = Vt/Vmax is the conversion degree, Vt is the cumulative hydrogen volume at time t, and Vmax is the total hydrogen volume. It is important to note that 1 g of aluminum theoretically yields 1245 mL of hydrogen at standard temperature and pressure. In this work, the reported total volume corresponds to the cumulative hydrogen volume obtained experimentally under these conditions, as presented in Figure 4b. The parameter kd (min−1) represents the apparent diffusion rate constant.
The linear regions of the transformed data (Figure 9) allowed the determination of kd values of 0.137, 0.064, and 0.05 min−1 for increasing particle sizes, with high coefficients of determination (R2 > 0.99), supporting diffusion through the product layer as the rate-controlling step [29,42].
The calculated rate constants decrease with increasing particle size, which is consistent with heterogeneous reaction theory [29]. This trend is attributed to the increased diffusion path length and mass transfer resistance imposed by the growing hydroxide layer [4,6]. Additionally, the effective diffusivity evolves during the reaction due to structural densification and porosity changes [20,58].
The kinetic constant follows a power-law dependence on particle size (k ∝ d−n). Linear regression of the logarithmic form yields n ≈ 1.4, indicating a mixed kinetic regime between chemical reaction control (n = 1) and diffusion control (n = 2), in agreement with the Shrinking Core Model [30,42]. This supports a multi-step mechanism involving simultaneous interfacial reaction, diffusion, and mass transfer processes, as reported in recent studies of aluminum–water systems [23]. It should be noted that this relationship is valid only within the evaluated particle size range, as variations in morphology and passivation layer properties may alter the controlling mechanisms [22].
Overall, the progressive growth and densification of the oxide/hydroxide layer significantly increase intraparticle diffusion resistance of OH ions toward the unreacted core, explaining the gradual decline in hydrogen generation rate. This behavior is consistent with modified Shrinking Core Model approaches that account for variable diffusivity and structural evolution within the product layer [42,59].
Finally, the predictive capability of the regression models is restricted to the particle size range of 180 to 500 μm. Extrapolation beyond this interval may lead to significant deviations, as variations in particle size can alter the underlying kinetic mechanisms governing the process.

5. Conclusions

Hydrogen was successfully generated from recycled aluminum cans via alkaline hydrolysis using a 1.0 M NaOH solution, which effectively promotes oxide layer removal and aluminum dissolution.
The results show that hydrogen production rate increases as particle size decreases due to the higher specific surface area, with the smallest range (180–250 μm) exhibiting the highest reaction rate and shortest reaction time. In contrast, the maximum cumulative hydrogen production was obtained for the intermediate particle size (363 µm, 132 mL), compared to 106 mL and 102 mL for 215 µm and 463 µm, respectively, indicating a trade-off between reaction rate and passivation effects.
The hydrogen evolution process followed a two-stage kinetic behavior: an initial stage dominated by rapid aluminum dissolution, followed by a slower stage associated with the formation of a passivating Al(OH)3 layer.
The dependence of hydrogen generation on particle size was adequately described by both power-law and regression models, confirming that smaller particles enhance reaction kinetics, while larger particles extend reaction time.
The shrinking core model provided an excellent fit (R2 = 99.94–99.97%), with rate constants of 0.137, 0.064, and 0.050 min−1. The relationship k ∝ d−n (n ≈ 1.4) indicates a mixed kinetic regime, where surface reaction dominates at early stages, while diffusion through the Al(OH)3 layer becomes increasingly significant over time.
SEM/XRD analyses confirmed the formation of Al(OH)3, supporting the proposed mechanism. Despite the ability to control hydrogen generation through particle size, the relatively low flow rates and yields, together with the absence of purity and energy analyses, limit practical applicability. Therefore, these results should be considered as a laboratory-scale kinetic assessment.

Author Contributions

Conceptualization, C.P.-C. and S.M.-V.; methodology, S.P.-M.; validation, C.P.-C., S.M.-V. and J.-E.F.-C.; formal analysis, D.C.-C.; investigation, S.P.-M.; resources, D.C.-C.; data curation, H.-J.M.-R.; writing—original draft preparation, C.P.-C. and S.M.-V.; writing—review and editing, C.P.-C. and S.M.-V. All authors have read and agreed to the published version of the manuscript.

Funding

This research received no external funding.

Data Availability Statement

The original contributions presented in this study are included in the article. Further inquiries can be directed to the corresponding author.

Acknowledgments

To technicians Agustin Vazquez-Escudero and Ivan Castro-Cisneros for their support in the use and handling of characterization equipment. During the preparation of this manuscript/study, the author(s) used: An APD 2000 X-ray diffractometer equipped with Cu Kα radiation (λ = 1.54321 Å), a Cole-Parmer flowmeter (model 32908-59; 1–100 mL/min), and a Hitachi scanning electron microscope operating at an accelerating voltage of 20–30 kV. The authors have reviewed and edited the output and take full responsibility for the content of this publication.

Conflicts of Interest

The authors declare no conflicts of interest.

Abbreviations

The following abbreviations are used in this manuscript:
SEM*Standard error of the mean
XRDX-ray diffraction
SEMScanning electron microscopy
NaOHSodium hydroxide
Al(OH)3Aluminum hydroxide
Al2O3Aluminum oxide
NaAl(OH)4Hydrated sodium aluminate
EDS Energy-dispersive X-ray spectroscopy
QmaxMaximum flow rate
trReaction time
SCMShrinking core model
FdFractional conversion

References

  1. Hassanpouryouzband, A.; Veshareh, M.J.; Wilkinson, M.; Nick, H.M.; Ngwenya, B.T.; Haszeldine, R.S. In Situ Hydrogen Generation from Underground Fossil Hydrocarbons. Joule 2025, 9, 101809. [Google Scholar] [CrossRef]
  2. Ikpeka, P.M.; Ugwu, J.O. In Situ Hydrogen Production from Hydrocarbon Reservoirs—Modelling Study. RSC Adv. 2023, 13, 12100–12113. [Google Scholar] [CrossRef]
  3. Seyitoglu, S.S.; Dincer, I.; Kilicarslan, A. Energy and Exergy Analyses of Hydrogen Production by Coal Gasification. Int. J. Hydrogen Energy 2017, 42, 2592–2600. [Google Scholar] [CrossRef]
  4. Dai, F.; Zhang, S.; Luo, Y.; Wang, K.; Liu, Y.; Ji, X. Recent Progress on Hydrogen-Rich Syngas Production from Coal Gasification. Processes 2023, 11, 1765. [Google Scholar] [CrossRef]
  5. Muradov, N.; Vezirolu, T. From Hydrocarbon to Hydrogen? Carbon to Hydrogen Economy. Int. J. Hydrogen Energy 2005, 30, 225–237. [Google Scholar] [CrossRef]
  6. Pant, K.K.; Gupta, R.B. Fundamentals and Use of Hydrogen as a Fuel. In Hydrogen Fuel: Production, Transport and Storage; Gupta, R.B., Ed.; CRC Press: Boca Raton, FL, USA, 2008. [Google Scholar]
  7. Gimpel, J.A.; Specht, E.A.; Georgianna, D.R.; Mayfield, S.P. Advances in Microalgae Engineering and Synthetic Biology Applications for Biofuel Production. Curr. Opin. Chem. Biol. 2013, 17, 489–495. [Google Scholar] [CrossRef]
  8. Moore, R. Economic Feasibility of Advanced Technology for Hydrogen Production from Fossil Fuels. Int. J. Hydrogen Energy 1983, 8, 905–911. [Google Scholar] [CrossRef]
  9. Boretti, A.; Banik, B.K. Advances in Hydrogen Production from Natural Gas Reforming. Adv. Energy Sustain. Res. 2021, 2, 2100097. [Google Scholar] [CrossRef]
  10. Halder, P.; Babaie, M.; Salek, F.; Haque, N.; Savage, R.; Stevanovic, S.; Bodisco, T.A.; Zare, A. Advancements in Hydrogen Production, Storage, Distribution and Refuelling for a Sustainable Transport Sector: Hydrogen Fuel Cell Vehicles. Int. J. Hydrogen Energy 2024, 52, 973–1004. [Google Scholar] [CrossRef]
  11. Nnabuife, S.G.; Ugbeh-Johnson, J.; Okeke, N.E.; Ogbonnaya, C. Present and Projected Developments in Hydrogen Production: A Technological Review. Carbon Capture Sci. Technol. 2022, 3, 100042. [Google Scholar] [CrossRef]
  12. Tashie-Lewis, B.C.; Nnabuife, S.G. Hydrogen Production, Distribution, Storage and Power Conversion in a Hydrogen Economy—A Technology Review. Chem. Eng. J. Adv. 2021, 8, 100172. [Google Scholar] [CrossRef]
  13. Bannenberg, L.J.; Heere, M.; Benzidi, H.; Montero, J.; Dematteis, E.M.; Suwarno, S.; Jaroń, T.; Winny, M.; Orłowski, P.A.; Wegner, W.; et al. Metal (Boro-) Hydrides for High Energy Density Storage and Relevant Emerging Technologies. Int. J. Hydrogen Energy 2020, 45, 33687–33730. [Google Scholar] [CrossRef]
  14. Hammad, A.; Ning, F.; Zou, S.; Liu, Y.; Tian, B.; He, C.; Chai, Z.; Wen, Q.; He, L.; Zhou, X. Aluminum Hydrolysis for Hydrogen Generation Enhanced by Sodium Hydride. Int. J. Hydrogen Energy 2024, 77, 138–148. [Google Scholar] [CrossRef]
  15. Trowell, K.A.; Goroshin, S.; Frost, D.L.; Bergthorson, J.M. Aluminum and Its Role as a Recyclable, Sustainable Carrier of Renewable Energy. Appl. Energy 2020, 275, 115112. [Google Scholar] [CrossRef]
  16. Wang, H.-W.; Huang, L.-Y. A Green Energy Closed-Loop System Based on Aluminum. Energies 2026, 19, 853. [Google Scholar] [CrossRef]
  17. Jayaraman, K.; Chauveau, C.; Gökalp, I. Effects of Aluminum Particle Size, Galinstan Content and Reaction Temperature on Hydrogen Generation Rate Using Activated Aluminum and Water. Energy Power Eng. 2015, 7, 426–432. [Google Scholar] [CrossRef]
  18. Wang, H.Z.; Leung, D.Y.C.; Leung, M.K.H.; Ni, M. A Review on Hydrogen Production Using Aluminum and Aluminum Alloys. Renew. Sustain. Energy Rev. 2009, 13, 845–853. [Google Scholar] [CrossRef]
  19. Reda, R.; Ashraf, A.; Magdy, I.; Ragab, M.; Eldabaa, N.; Abo Elmagd, M.; Abdelhafiz, M.; El-Banna, O.; Fouad, A.; Aly, H.A.; et al. An Investigation on the Potential of Utilizing Aluminum Alloys in the Production and Storage of Hydrogen Gas. Materials 2024, 17, 4032. [Google Scholar] [CrossRef]
  20. Mutlu, R.N.; Kandasamy, J.; Kıymaz, T.B.; Güleryüz, D.; Böncü, E.; Eroğlu, E.; Gökalp, İ. Optimization of Aluminum Hydrolysis Reactions and Reactor Design for Continuous Hydrogen Production Using Aluminum Wire Feeding. Int. J. Hydrogen Energy 2024, 52, 1390–1403. [Google Scholar] [CrossRef]
  21. Teng, H.-T.; Lee, T.-Y.; Chen, Y.-K.; Wang, H.-W.; Cao, G. Effect of Al(OH)3 on the Hydrogen Generation of Aluminum–Water System. J. Power Sources 2012, 219, 16–21. [Google Scholar] [CrossRef]
  22. Musicco, N.; Gelfi, M.; Iora, P.; Venturelli, M.; Artioli, N.; Montorsi, L.; Milani, M. A Review of Hydrogen Generation Methods via Aluminum-Water Reactions. Int. J. Thermofluids 2025, 27, 101152. [Google Scholar] [CrossRef]
  23. Mezulis, A.; Richter, C.; Lesnicenoks, P.; Knoks, A.; Varnagiris, S.; Urbonavicius, M.; Milcius, D.; Kleperis, J. Studies on Water–Aluminum Scrap Reaction Kinetics in Two Steps and the Efficiency of Green Hydrogen Production. Energies 2023, 16, 5554. [Google Scholar] [CrossRef]
  24. Bolt, A.; Dincer, I.; Agelin-Chaab, M. Experimental Study of Hydrogen Production Process with Aluminum and Water. Int. J. Hydrogen Energy 2020, 45, 14232–14244. [Google Scholar] [CrossRef]
  25. Dong, Z.; Yao, W.; Niu, F.; Chen, D.; Huang, Y. Hydrogen Generation Dynamics of the Reaction between Metal Aluminum and Sodium Hydroxide Solution under Pressurized Condition. Int. J. Hydrogen Energy 2026, 198, 152795. [Google Scholar] [CrossRef]
  26. Gorobez, J.; Maack, B.; Nilius, N. Growth of Self-Passivating Oxide Layers on Aluminum—Pressure and Temperature Dependence. Phys. Status Solidi B 2021, 258, 2000559. [Google Scholar] [CrossRef]
  27. Soler, L.; Macanás, J.; Muñoz, M.; Casado, J. Hydrogen Generation from Aluminum in A Non-Consumable Potassium Hydroxide Solution. In Proceedings of the International Hydrogen Energy Congress and Exhibition IHEC, Istanbul, Turkey, 3–15 July 2005; pp. 1–7. [Google Scholar]
  28. Kaur, P.; Verma, G. A Critical Assessment of Aluminum-Water Reaction for on-Site Hydrogen-Powered Applications. Mater. Today Energy 2024, 40, 101508. [Google Scholar] [CrossRef]
  29. Martínez-Salazar, A.L.; Melo-Banda, J.A.; Coronel-García, M.A.; González-Barbosa, J.J.; Domínguez-Esquivel, J.M. Hydrogen Generation by Aluminum Alloy Corrosion in Aqueous Acid Solutions Promoted by Nanometal: Kinetics Study. Renew. Energy 2020, 146, 2517–2523. [Google Scholar] [CrossRef]
  30. Maulana, F.R.; Fadhilah, N.; Wahyuono, R.A.; Risanti, D.D. Hydrogen Production from Waste Aluminum Foil AA1235 Using the Aluminum-Water Reaction Method with Thickness Variations. Adv. Mat. Res. 2023, 1175, 9–15. [Google Scholar] [CrossRef]
  31. Wanta, K.C.; Astuti, W.; Perdana, I.; Petrus, H.T.B.M. Kinetic Study in Atmospheric Pressure Organic Acid Leaching: Shrinking Core Model versus Lump Model. Minerals 2020, 10, 613. [Google Scholar] [CrossRef]
  32. Kokoszka, P.; Milenin, A. The Influence of Aging on Buckle Strength Loss in AA5182-H48 for Beverage Can Ends. Comput. Methods Mater. Sci. 2023, 23, 5–17. [Google Scholar] [CrossRef]
  33. Wang, Z.; Yu, Y.; Jin, Y.; Li, Z.; Sun, S.; Xu, H.; Wu, C.; Zhang, D. Solid State Recycling of Used Aluminum Alloy Beverage Cans by Thermomechanical Consolidation. Heat Treat. Surf. Eng. 2022, 4, 90–98. [Google Scholar] [CrossRef]
  34. Shi, Y.; Jin, H.; Wu, P.D. Analysis of Cup Earing for AA3104-H19 Aluminum Alloy Sheet. Eur. J. Mech.—A/Solids 2018, 69, 1–11. [Google Scholar] [CrossRef]
  35. ASTM E11-22; Standard Specification for Woven Wire Test Sieve Cloth and Test Sieves. ASTM International: West Conshohocken, PA, USA, 2022. [CrossRef]
  36. Soler, L.; Macanás, J.; Muñoz, M.; Casado, J. Aluminum and Aluminum Alloys as Sources of Hydrogen for Fuel Cell Applications. J. Power Sources 2007, 169, 144–149. [Google Scholar] [CrossRef]
  37. Vogrin, J.; Santini, T.; Peng, H.; Vaughan, J. The Anion Effect on Sodium Aluminosilicates Formed under Bayer Process Digestion Conditions. Hydrometallurgy 2020, 192, 105236. [Google Scholar] [CrossRef]
  38. Li, H.; Addai-Mensah, J.; Thomas, J.C.; Gerson, A.R. The Crystallization Mechanism of Al(OH)3 from Sodium Aluminate Solutions. J. Cryst. Growth 2005, 279, 508–520. [Google Scholar] [CrossRef]
  39. Macanás, J.; Soler, L.; Candela, A.M.; Muñoz, M.; Casado, J. Hydrogen Generation by Aluminum Corrosion in Aqueous Alkaline Solutions of Inorganic Promoters: The AlHidrox Process. Energy 2011, 36, 2493–2501. [Google Scholar] [CrossRef]
  40. Saif, M.T.A.; Zhang, S.; Haque, A.; Hsia, K.J. Effect of Native Al2O3 on the Elastic Response of Nanoscale Al Films. Acta Mater. 2002, 50, 2779–2786. [Google Scholar] [CrossRef]
  41. Belitskus, D. Reaction of Aluminum with Sodium Hydroxide Solution as a Source of Hydrogen. J. Electrochem. Soc. 1970, 117, 1097. [Google Scholar] [CrossRef]
  42. Wang, X.; Li, G.; Eckhoff, R.K. Kinetics Study of Hydration Reaction between Aluminum Powder and Water Based on an Improved Multi-Stage Shrinking Core Model. Int. J. Hydrogen Energy 2021, 46, 33635–33655. [Google Scholar] [CrossRef]
  43. Cabrera, N.; Mott, N.F. Theory of the Oxidation of Metals. Rep. Prog. Phys. 1949, 12, 308. [Google Scholar] [CrossRef]
  44. Qian, X.; Dong, Z.; Jiang, B.; Lei, B.; Yang, H.; He, C.; Liu, L.; Wang, C.; Yuan, M.; Yang, H.; et al. Influence of Alloying Element Segregation at Grain Boundary on the Microstructure and Mechanical Properties of Mg-Zn Alloy. Mater. Des. 2022, 224, 111322. [Google Scholar] [CrossRef]
  45. Abdelghani-Idrissi, S.; Dubouis, N.; Grimaud, A.; Stevens, P.; Toussaint, G.; Colin, A. Effect of Electrolyte Flow on a Gas Evolution Electrode. Sci. Rep. 2021, 11, 4677. [Google Scholar] [CrossRef] [PubMed]
  46. Urbonavicius, M.; Varnagiris, S.; Girdzevicius, D.; Milcius, D. Hydrogen Generation Based on Aluminum-Water Reaction for Fuel Cell Applications. Energy Procedia 2017, 128, 114–120. [Google Scholar] [CrossRef]
  47. Gai, W.-Z.; Wang, L.-Y.; Lu, M.-Y.; Deng, Z.-Y. Effect of Low Concentration Hydroxides on Al Hydrolysis for Hydrogen Production. Energy 2023, 268, 126731. [Google Scholar] [CrossRef]
  48. Deng, Z.; Zhu, L.; Tang, Y.; Sakka, Y.; Ye, J.; Xie, R. Role of Particle Sizes in Hydrogen Generation by the Reaction of Al with Water. J. Am. Ceram. Soc. 2010, 93, 2998–3001. [Google Scholar] [CrossRef]
  49. González-Solórzano, M.G.; Morales, R.; Ávila, J.R.; Muñiz-Valdés, C.R.; Bastida, A.N. Alumina Nucleation, Growth Kinetics, and Morphology: A Review. Steel Res. Int. 2023, 94, 2200678. [Google Scholar] [CrossRef]
  50. Aleksandrov, Y.A.; Tsyganova, E.I.; Pisarev, A.L. Reaction of Aluminum with Dilute Aqueous NaOH Solutions. Russ. J. Gen. Chem. 2003, 73, 689–694. [Google Scholar] [CrossRef]
  51. Poznyak, A.; Pligovka, A.; Turavets, U.; Norek, M. On-Aluminum and Barrier Anodic Oxide: Meeting the Challenges of Chemical Dissolution Rate in Various Acids and Solutions. Coatings 2020, 10, 875. [Google Scholar] [CrossRef]
  52. Bolt, A.; Dincer, I.; Agelin-Chaab, M. A Review of Unique Aluminum–Water Based Hydrogen Production Options. Energy Fuels 2021, 35, 1024–1040. [Google Scholar] [CrossRef]
  53. Cuzacq, L.; Silvain, J.-F.; Sabatier, J.; Bobet, J.-L. Hydrogen Production by Hydrolysis of Bulk Porous Aluminum. ACS Appl. Energy Mater. 2025, 8, 7394–7401. [Google Scholar] [CrossRef]
  54. Abdelkareem, M.A.; Ayoub, M.; Al Najada, R.I.; Alami, A.H.; Olabi, A.G. Hydrogen from Waste Metals: Recent Progress, Production Techniques, Purification, Challenges, and Applications. Sustain. Horiz. 2024, 9, 100079. [Google Scholar] [CrossRef]
  55. Salueña-Berna, X.; Marín-Genescà, M.; Mujal Rosas, R.; Arias, M.-J.L. Controlled and Safe Hydrogen Generation from Waste Aluminum and Water, a New Approach to Hydrogen Generation. Materials 2024, 17, 5885. [Google Scholar] [CrossRef]
  56. Shmelev, V.; Nikolaev, V.; Lee, J.H.; Yim, C. Hydrogen Production by Reaction of Aluminum with Water. Int. J. Hydrogen Energy 2016, 41, 16664–16673. [Google Scholar] [CrossRef]
  57. Trowell, K.; Goroshin, S.; Frost, D.; Bergthorson, J. Hydrogen Production Rates of Aluminum Reacting with Varying Densities of Supercritical Water. RSC Adv. 2022, 12, 12335–12343. [Google Scholar] [CrossRef]
  58. Gao, Z.; Ji, F.; Cheng, D.; Yin, C.; Niu, J.; Brnic, J. Hydrolysis-Based Hydrogen Generation Investigation of Aluminum System Adding Low-Melting Metals. Energies 2021, 14, 1433. [Google Scholar] [CrossRef]
  59. Razavi-Tousi, S.S.; Szpunar, J.A. Modification of the Shrinking Core Model for Hydrogen Generation by Reaction of Aluminum Particles with Water. Int. J. Hydrogen Energy 2016, 41, 87–93. [Google Scholar] [CrossRef]
Figure 1. Schematic representations for (a) obtaining recycled aluminum powders and (b) quantification of hydrogen production [36] from recycled aluminum using NaOH.
Hydrogen 07 00055 g001
Figure 2. Particle size distribution of sieved aluminum powders (mesh 230–35), highlighting the selected size ranges (180–250, 300–425, and 425–500 µm).
Hydrogen 07 00055 g002
Figure 3. Hydrogen flow rate versus time for particle sizes of (a) 425–500 µm, (b) 300–425 µm, and (c) 180–250 µm.
Hydrogen 07 00055 g003
Figure 4. (a) Average hydrogen flow rate and (b) cumulative volume versus time for different particle sizes.
Hydrogen 07 00055 g004
Figure 5. Determination of the constants a and b by linear regression of the power-law model.
Hydrogen 07 00055 g005
Figure 6. Relationship between particle size and the experimental response variables: (a) maximum hydrogen flow rate described by the power-law model and (b) reaction time described by the linear regression model. Error bars represent the standard error of the mean (SEM*) based on n = 3 independent replicates.
Hydrogen 07 00055 g006
Figure 7. SEM images of aluminum particles after NaOH reaction: (a) Al(OH)3-coated particles; (b) 5000× magnification showing acicular Al(OH)3 growth; (c) EDS confirms alloying elements and oxidation.
Hydrogen 07 00055 g007
Figure 8. XRD patterns of aluminum powders before (a) and after (b) reaction with NaOH solution.
Hydrogen 07 00055 g008
Figure 9. Linear fitting of the diffusion-controlled shrinking core model by plotting F d ( α ) as a function of time for different aluminum particle sizes. The slopes of the fitted lines correspond to the apparent diffusion rate constants ( k d ), showing excellent agreement with the model (R2 > 0.99).
Hydrogen 07 00055 g009
Table 1. Chemical composition of the can’s alloys [14,19,20,28,32,33,34].
AlloyComposition %
SiFeCuMnMgCr
AA 5182/H48Min0.000.000.000.204.000.00
(Beverage can lids)Max0.200.350.150.505.000.00
AA 5042/H18Min0.000.000.000.203.000.00
(Beverage can tabs)Max0.200.350.150.504.000.10
AA 3104/H19Min0.000.000.050.800.800.00
(Beverage can body)Max0.200.800.251.401.300.05
Table 2. Descriptive statistics of the maximum hydrogen flow rate (Qmax) and reaction time (tr) for different average particle sizes.
Descriptive Statisticsdp Average Particle Size (µm)
215363463
Qmax22.4115.0512.81
18.4015.7713.17
15.5113.2313.44
x ¯ = x i n   ±   σ n 18.77 ± 2.0014.68 ± 0.7613.14 ± 0.18
s 2 = ( x i x ¯ ) 2 n 1 12.001.710.10
σ = s 2 3.471.310.32
tr14.5524.3632.56
14.8524.2627.85
15.1826.7527.48
x ¯ = x i n   ±   σ n 14.86 ± 0.1825.12 ± 0.8129.30 ± 1.64
s 2 = ( x i x ¯ ) 2 n 1 0.101.998.02
σ = s 2 0.321.412.83
Table 3. Variable transformation used for the linearization of the power-law model.
x = dp (µm)y = Qmax (mL/min)ln(x)ln(y)
21518.77 ± 2.005.370642.93226
36314.68 ± 0.765.894402.68649
46313.14 ± 0.186.137732.57566
Disclaimer/Publisher’s Note: The statements, opinions and data contained in all publications are solely those of the individual author(s) and contributor(s) and not of MDPI and/or the editor(s). MDPI and/or the editor(s) disclaim responsibility for any injury to people or property resulting from any ideas, methods, instructions or products referred to in the content.