Article

Cost-Optimal Design of a Stand-Alone PV-Driven Hydrogen Production and Refueling Station Using Genetic Algorithms

Department of Engineering Science, Guglielmo Marconi University, Via Paolo Emilio 29, 00192 Rome, Italy
*
Author to whom correspondence should be addressed.
Hydrogen 2025, 6(4), 98; https://doi.org/10.3390/hydrogen6040098
Submission received: 4 September 2025 / Revised: 20 October 2025 / Accepted: 28 October 2025 / Published: 3 November 2025

Abstract

Driven by the growing availability of funding opportunities, electrolyzers have become increasingly accessible, unlocking significant potential for large-scale green hydrogen production. The goal of this investigation is to develop a techno-economic optimization framework for the design of a stand-alone photovoltaic (PV)-driven hydrogen production and refueling station, with the explicit objective of minimizing the levelized cost of hydrogen (LCOH). The system integrates PV generation, a proton-exchange-membrane electrolyzer, battery energy storage, compression, and high-pressure hydrogen storage to meet the daily demand of a fleet of fuel cell buses. Results show that the optimal configuration achieves an LCOH of 11 €/kg when only fleet demand is considered, whereas if surplus hydrogen sales are accounted for, the LCOH reduces to 7.98 €/kg. The analysis highlights that more than 75% of total investment costs are attributable to PV and electrolysis, underscoring the importance of capital incentives. Financial modeling indicates that a subsidy of about 58.4% of initial CAPEX is required to ensure a 10% internal rate of return under EU market conditions. The proposed methodology provides a reproducible decision-support tool for optimizing off-grid hydrogen refueling infrastructure and assessing policy instruments to accelerate hydrogen adoption in heavy-duty transport.

1. Introduction

Fossil fuel combustion remains the dominant source of anthropogenic CO2 emissions worldwide. In response, the European Union (EU) has committed to reducing greenhouse gas (GHG) emissions by at least 55% by 2030 relative to 1990 levels and to achieve climate neutrality by 2050 [1]. The transport sector is among the largest contributors to EU GHG [2], with heavy-duty vehicles (HDVs) responsible for roughly one quarter of road-transport CO2 [3]. Nevertheless, transport remains overwhelmingly dependent on fossil fuels, posing a persistent barrier to the EU’s climate objectives [4].
Hydrogen has emerged as one of the most prominent and widely discussed options for decarbonizing HDVs and, more broadly, other hard-to-abate sectors at both national and international levels [5]. Building on this momentum, an increasing number of countries and regions have issued hydrogen strategies, roadmaps, and policy packages to stimulate technology development, catalyze market formation, and integrate hydrogen into energy systems. Within transport specifically, HDVs are a priority use case: although they constitute only 2.5% of the vehicle fleet [6], they account for a disproportionate share of CO2 emissions. HDVs also play a central role in logistics and public services, underpinning the EU economy by transporting roughly 75% of goods moved over land [7]. On the passenger side, buses and coaches, part of the HDV category, still provide 7.4% of EU inland passenger-kilometers, underscoring that decarbonizing HDVs has implications for both freight and public mobility [8].
In this context, the heavy-duty and long-haul segment offers strong prospects for hydrogen application due to high flexibility, long range, and rapid refueling. These advantages position hydrogen as a strong alternative to battery-electric vehicles (BEVs), which, while benefiting from lower investment and operational costs, often face limitations in terms of battery capacity, long charging and power requirements that reduce their viability for certain heavy-duty use cases, all of which reduce their suitability for certain heavy-duty applications [9]. Importantly, recent projections by the United States Department of Energy suggest that heavy-duty fuel-cell systems could achieve costs of approximately 160–170 $/kW (≈150–160 €/kW) at 50 k–100 k units/year, thereby narrowing the upfront gap with battery drivetrains [10]. On the fuel side, station-level analyses for HDV refueling in a 2030 timeframe find levelized costs of dispensed hydrogen spanning ~3.8–12.6 $/kg (≈3.5–11.5 €/kg) depending primarily on station capacity (2–18 t/day), supply mode (liquid delivery vs. on-site production), and lifetime utilization, underscoring the centrality of scale and throughput to competitiveness [11]. Against this backdrop, battery pack prices continued their structural decline to a global average of 115 $/kWh in 2024 (≈105 €/kWh), reinforcing the total cost of ownership (TCO) advantage of BEV trucks in short/medium-haul, depot-charging use cases [12].
Consistent with these unit-cost trajectories, European TCO assessments generally identify BEV trucks as the lowest-cost option across most segments before 2030, with FCEV trucks approaching parity later in duty cycles that value rapid refueling, high daily utilization, and extended range—provided dispensed hydrogen converges to ~4–6 €/kg and further reductions in stack cost [13,14,15]. Peer-reviewed syntheses reach similar conclusions, highlighting hydrogen price and stack cost as the pivotal drivers of FCEV truck competitiveness beyond 2030 [16].
On the supply side, progress in water electrolysis is shaping the hydrogen economy. Proton-exchange-membrane (PEM) electrolyzers operate at relatively low temperatures and employ a solid polymer electrolyte that enables rapid ion transport, permitting high current densities and compact system designs [17]. Recent innovations in PEM focus on improved membranes and catalysts, enhancing performance while reducing costs [18]. By contrast, anion-exchange-membrane electrolysers seek to combine alkaline-type material cost advantages with PEM-like performance, offering compact architectures, fast dynamics, high current densities, and elevated outlet pressures, with substantial cost-reduction potential [19].
Given these trajectories, quantifying affordability via the LCOH, integrating capital and operating expenditures, asset lifetime, and utilization, has become central in transport-sector evaluations [20], while dynamic simulation environments are widely used to examine system sizing, operational strategies, and their cost implications [21,22,23]. Beyond design, accurate estimation of transport LCOH (LCOH-T) is critical for investment appraisal: model misspecification propagates into fleet TCO assessments, potentially distorting conversion strategies and delaying decarbonization [11].
Within literature, most studies still assume grid-connected or hybrid configuration. By contrast, fully stand-alone, PV-powered refueling stations—and the use of metaheuristics, particularly Genetic Algorithms (GA), to co-optimize technical layouts and LCOH—remain comparatively underexplored. For example, Genovese et al. propose a mathematical model for a multi-service energy system with hydrogen production of 360 kg [23]; Zhang et al. validate a renewable-based hydrogen production and refueling concept using real data but retaining reliance on the grid [24], and Kim et al. explicitly account for hydrogen sales revenues and electricity purchases to cover shortfalls, again implying grid reliance [25]. HOMER (Hybrid Optimization of Multiple Energy Resources), developed by the National Renewable Energy Laboratory (NREL), is widely used to tackle large-scale, multi-objective problems. Using this software, Mansir presents a cost-effective hybrid supply for a hydrogen refueling station (HRS) in Saudi Arabia [26]; Okonkwo et al. replace deterministic or basic stochastic search with state-of-the-art nature-inspired optimization for a renewable hybrid HRS in Nizwa, Oman [27]; and Oueslati adopts a similar approach for French. Cities [28]. Finally, Al-Sharaf et al. integrate technical and socio-economic dimensions into a single HOMER-based framework but hold wind-turbines and electrolyzer sizes fixed [29]. However, the component modeling in such generic platforms often relies on fixed efficiencies and limited partial-load representation, which can constrain design fidelity especially in stand-alone contexts.
In this paper, the authors address these gaps by developing a GA-driven, time-resolved MATLAB (R2022b) model of a stand-alone PV-fed HRS for heavy-duty vehicles, with no grid exchanges, that co-optimizes PV capacity, number of electrolyzer modules (with a ≥1 MW minimum module size), battery capacity, hydrogen storage capacity, and the initial state of charge of the hydrogen store, while enforcing an end-of-horizon mass-balance constraint that precludes reliance on arbitrary initial hydrogen inventory. The model uses manufacturer-style performance curves to capture partial-load efficiencies and operational losses across PV, battery, electrolyzer, compression, and storage, thereby overcoming fixed-efficiency limitations common in tool-based studies. The objective is explicit minimization of LCOH-T under variable irradiance and HDV demand.
Conducting a parametric analysis across multiple configurations allows us to quantify the marginal contribution of technical and economic drivers to LCOH, enabling the identification of the principal cost components and measurement of their marginal impact on LCOH; the comparison of LCOH across alternative plant configurations against current and prospective support schemes; and policy-relevant insights to accelerate adoption of hydrogen-powered HDV fleets. Finally, this study provides a transparent input dataset to support reproducibility and facilitate subsequent research on PV-coupled electrolysis systems.

2. Materials and Methods

2.1. System Configuration

The case study investigates a refueling station integrated with an on-site hydrogen production facility. Hydrogen is generated through a proton exchange membrane (PEM) electrolyzer supplied with electricity from a photovoltaic (PV) system. PEM technology was selected due to its fast transient response, enabling effective integration with intermittent renewables [30]. In addition, PEM electrolyzers operate at higher efficiencies and deliver hydrogen at elevated pressures compared to the widely diffused alkaline systems, reducing the need for additional compression stages and thus improving the overall energy utilization [31]. At the same time, while anion-exchange membrane electrolyzers are increasingly explored as a next-generation technology, potentially combining the low-cost materials of alkaline systems with the compact design and high efficiency of PEM, current PEM units still exhibit comparatively lower capital costs at commercial scale, positioning them as the more mature and economically viable option for near-term deployment [32].
Beyond PV generation and the electrolyzer, the system includes a battery energy storage system (BESS) for short-term buffering, a two-stage compressor to raise the electrolyzer outlet pressure to storage level, and a stationary hydrogen storage unit at 500 bar.
This configuration ensures year-round continuity of refueling operations. A simplified schematic layout of the system under study is shown in Figure 1.
The analysis considers a hydrogen refueling station (HRS) with a target demand of 500 kg H2/day, representative of a medium-capacity facility [33]. While the literature shows that moving to large-scale systems can reduce LCOH through higher throughput and economies of scale [34,35], current deployment is dominated by medium-capacity stations, which are better aligned with near-term demand from light- and medium-duty fleets during the early market phase [36]. The storage capacity is designed to supply, within a single day, a fleet of 25 hydrogen buses with a nominal tank pressure of 350 bar. Typical onboard storage is about 20 kg of hydrogen, as documented in several real-world applications [37], which is sufficient to guarantee a driving range of over 200 km on a full tank [38,39].
Plant sizing uses an hourly demand profile derived by normalizing timestamped refueling observations from multiple depots that serve urban and extra-urban bus fleets [40]. In operational practice, depots complete fleet refueling within a 4–6 h operating window by running several dispensers in parallel. The resulting temporal pattern is concentrated in off-peak hours: the majority of refueling activity, i.e., 76%, occurs between 20:00 and 02:00, aligned with bus availability at the depot and first departures around 06:00. Minor shoulder activity is observed around 18:00–20:00 and 02:00–04:00, with limited daytime refueling for exceptions. The resulting hourly distribution of the bus refueling during the day is shown in Figure 2.

2.2. Optimization Framework

The analysis presented in this study aims to optimize both the sizing of the system components and the operational strategy for hydrogen management of a system designed to support the operation of a HDVs fleet, with the ultimate objective of minimizing the LCOH for the fleet. This parameter is a critical indicator for assessing the economic competitiveness of renewable gas technologies. To this end, a MATLAB-based model was developed [41], integrating advanced control logic and physical constraints specific to the system components.
The optimization focuses on four key decision variables: the nominal PV capacity ( P V P V n o m ), the number of electrolyzer units ( N s e t , e l ), the battery capacity ( c b a t t ) and the hydrogen storage capacity ( m s t ). In addition, the initial state of charge of the hydrogen storage system ( S O C s t ) was introduced as a fifth optimization parameter. The optimal configuration of these variables is determined by applying a genetic algorithm (GA).
The developed GA performs a comprehensive multi-parametric study, simultaneously exploring different sizes and configurations of the system components. Through an iterative process of evaluation, selection, crossover, and mutation, the algorithm progressively converges toward the solution that minimizes the objective function, i.e., the LCOH for the fleet, while satisfying all technical and design constraints. This approach not only identifies the most cost-effective configuration but also provides insight into the sensitivity of the solution, highlighting the range within which parameters can vary without compromising system competitiveness.
To achieve this, the model simulates on an hourly basis the interactions between PV electricity generation, electrolyzer operation, hydrogen storage mass balance, compression requirements, and associated economic parameters.

2.3. Description of the Solution Method

The genetic algorithm explores the solution space within predefined bounds by generating an initial set of configurations. At each generation, it eliminates low-performing solutions (low fitness) and creates new candidates by combining and mutating higher-performing ones. Iterating this cycle enables the identification of optimal values for the five decision variables while minimizing the fleet LCOH, defined as:
L C O H f l e e t = f x i ( g )
L C O H = ( C A P E X a + O P E X f i x + O P E X v a r + R E P L E X a ) H 2 p r o d u c e d
L C O H f l e e t = ( C A P E X a + O P E X f i x + O P E X v a r + R E P L E X a ) H 2   f l e e t   d e m a n d
The terms in the equation represent, respectively, the annualized investment cost, C A P E X a , which corresponds to the expenditure required for acquiring tangible assets; the fixed operating cost, O P E X f i x , associated with routine operation and maintenance (O&M) activities and typically estimated as a percentage of the investment cost; the variable operating cost, O P E X v a r , generally related to electricity expenses and energy consumption; and the annualized replacement cost, R E P L E X a , which accounts for the periodic substitution of plant components subject to wear over their operational lifetime. The design parameter vector x i ( g ) (referred to as an “solution”) for generation g includes the following five variables:
x i ( g ) = P V P V n o m ,   N s e t , e l ,   m s t ,   c b a t t ,   S O C s t
The fitness of a candidate solution is defined as follows. The function f x i ( g ) corresponds to the L C O H f l e e t , which is the objective to be minimized. In general, a lower LCOH results in a higher fitness value.
f i t n e s s x i ( g ) = 1 1 + f x i ( g )
In each generation, every candidate solution is assigned a selection probability proportional to its relative fitness. Consequently, solutions with higher fitness have a greater likelihood of being chosen as “parents,” thereby passing their decision variable values to the subsequent generation. Here, N denotes the population size.
p i ( g ) = f i t n e s s ( x i ( g ) ) k = 1 N f i t n e s s ( x k ( g ) )
From the selected population, new “offspring” solutions are generated through the crossover operator, which combines the design variables of two “parent” solutions x A and x B . In this process, the offspring inherit some characteristics from one parent and others from the second, with the aim of producing potentially more competitive solutions. The result is a new vector:
x o f f s p r i n g ( g ) = c r o s s o v e r ( x A , x B )
To maintain diversity and avoid premature convergence to local minimum, a mutation operator δ introduces random perturbations:
x o f f s p r i n g g x o f f s p r i n g g + δ
The new generation thus consists of elite individuals preserved from the previous cycle, offspring generated through crossover and mutation, and a subset of older solutions to ensure genetic diversity:
x i g + 1 e l i t e ,   x o f f s p r i n g , x o l d   p o p u l a t i o n
This iterative process continues until convergence toward the configuration with the lowest LCOH for the fleet operation that satisfies all technical and economic constraints.
For the case study, the genetic algorithm was configured in MATLAB’s GA toolbox with bounded, integer decision variables: PV size 6–16 MWp, electrolyzer power 2–8 MW, BESS energy 0–20 MWh, hydrogen inventory capacity 1000–5000 kg, and initial hydrogen SoC 10–80%. All variables are integer-constrained with lower and upper bounds, reflecting the discrete nature of engineering sizing and simplifying feasibility checks. This encoding markedly reduces the search space, thereby easing computation and accelerating convergence. A population size of 50 was adopted; pilot runs with larger populations (>70) increased runtime with negligible objective improvement. The algorithm was run for up to 40 generations with a function tolerance of 1 × 10⁻³, and convergence typically occurred within 20–30 generations, with termination triggered by the tolerance. The crossover fraction was set to MATLAB default equal to 0.8; lowering it to 0.6 did not materially change the optima but slowed convergence. Mutation employed the adaptive feasible operator, which adjusts step sizes near constraints to maintain feasibility, while alternative fixed mutation rates offered no advantage. Selection used stochastic uniform, retained for its robustness with small populations.

Simulation Logic

The hydrogen production logic implemented in the code is summarized in Figure 3. In this framework, the code simulates on an hourly basis the interaction among PV generation, electrolyzer operation, mass flow within the storage system, compression, and the associated economic parameters. The simulation proceeds as follows:
  • Step 1: Based on hourly meteorological data, PV generation is quantified. For each timestep, the model verifies whether the available power covers the auxiliary loads of the electrolyzer and compressor. Any surplus is allocated to hydrogen production, while deviations from nominal electrolyzer power are balanced by charging or discharging the battery.
  • Step 2: The produced hydrogen is compressed and sent to storage. A mass balance check ensures that the stored hydrogen remains within operational limits. Configurations that result in insufficient storage are discarded as infeasible.
  • Step 3: At each cycle, the GA evaluates candidate solutions in terms of CAPEX, OPEX, and L C O H f l e e t . Based on these metrics, the algorithm performs selection, crossover, and mutation to evolve toward the configuration that minimizes the objective function, ensuring compliance with all technical and economic requirements.
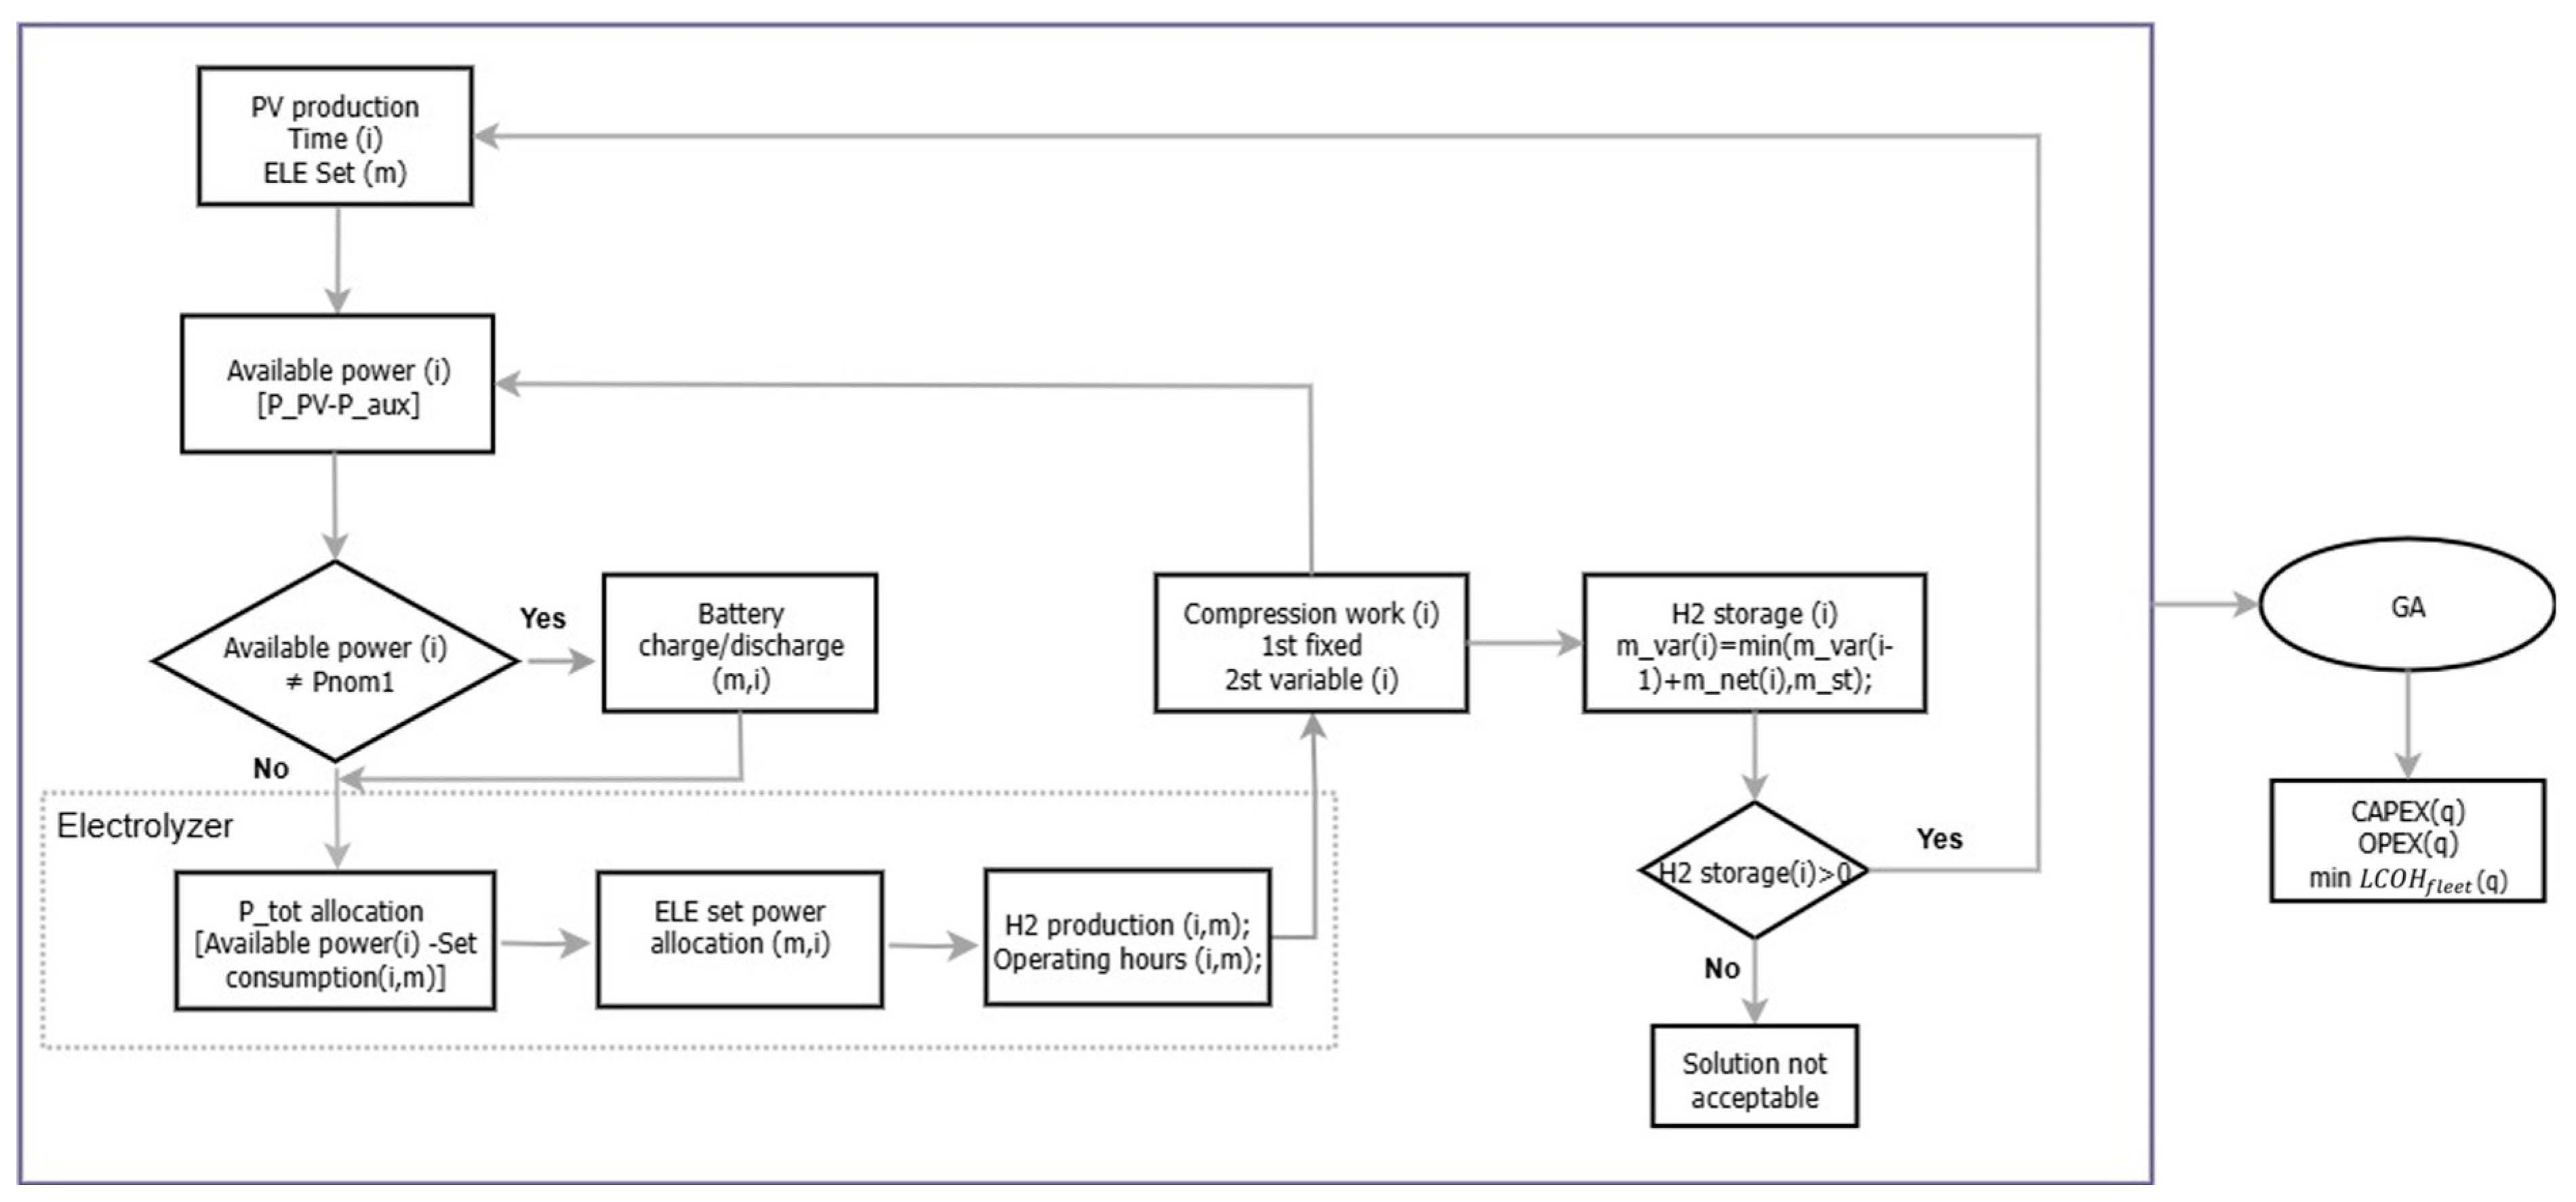
Figure 3. Logical scheme of the genetic algorithm calculation model for the identification of four key decision variables: nominal PV capacity, number of electrolyzer units, battery capacity, hydrogen storage capacity, and the initial state of charge of the hydrogen storage system.
Hydrogen 06 00098 g003

2.4. Governing Equations of the System Components

PV production: The photovoltaic output P P V (kW) was estimated based on the capacity factor, defined as the ratio between the actual PV energy produced at time t and the maximum theoretical energy that could be generated over the same time interval, as expressed in Equation (10). Multiplying the capacity factor by the nominal PV power simulated for the plant yields the average hourly electricity output of the system:
C F = P P V · t / ( P P V , n o m · t )
Table 1 reports the techno-economic parameters adopted for modeling electricity generation from PV systems, together with the corresponding references.
BESS: The battery energy storage system is integrated into the system to shift surplus solar production during peak hours to periods of insufficient generation. During charging, excess PV electricity is stored in the batteries, whereas in discharging mode the stored energy is supplied to extend the equivalent operating hours of the system.
The amount of energy stored during charging is determined by the available input, i.e., the difference between PV generation and system consumption, subject to two constraints: the maximum chargeable energy in a given time step, which depends on the nominal capacity and the c-rate of the battery, and the residual storage capacity, defined by the state of charge in the previous interval ( S o C b ).
Similarly, the discharge phase is defined by the net energy demand, i.e., the difference between system electricity consumption—including the compressor—and PV generation. The maximum extractable energy is constrained by two factors: the available stored energy, ensuring that the battery state of charge S o C b remains above the minimum safety threshold ( S o C m i n = 15 % ) , and the discharge limit imposed by the c-rate, which sets the maximum deliverable power in a single interval. The S o C b at a given time step i depends on its value in the previous interval and on the net energy variation, defined as the difference between the stored energy ( E c h ) and the discharged energy ( E d i s h ), normalized with respect to the nominal battery capacity c b a t t . The input data for the BESS are illustrated in Table 2:
S o C b ( i ) = S o C b i 1 + ( E c h E d i s h ) / c b a t t
PEM production: The hourly power supplied to the electrolyzers was modeled under a multi-MW approach. Specifically, the input power depends on the available energy, which may originate directly from the primary PV source or from the BESS contribution, and is capped by the maximum nominal capacity of the electrolyzer sets. The available power is then allocated to each 1 MW ( P e l ), while accounting for the constraints imposed by energy availability, stack operating limits, and the auxiliary loads required for proper system operation. The hydrogen production rate, m f l o w , H 2 (kg/h), is calculated according to Equation (12), where η s y s represents the system efficiency, modeled across three operating intervals as a function of the electrolyzer load (see Table 3 for the full set of input parameters). The lower heating value of hydrogen ( L H V H 2 ) is assumed to be equal to 33.33 kWh/kg [47]:
m f l o w , H 2 = P e l · η s y s / L H V H 2
Hydrogen storage: During periods of surplus production, the storage system is used to accumulate the hydrogen generated by the electrolyzer. Neglecting potential losses, a mass balance can be applied at each simulation step to quantify the amount of hydrogen stored. The net mass variation ( m n e t ) is computed as the difference between the total hydrogen production ( m f l o w , H 2 ) and the demand ( m d e m ) as expressed in Equation (13):
m n e t = m f l o w , H 2 m d e m
Subsequently, the hydrogen content of the storage tank ( m v a r ), is updated. If m n e t is positive, i.e., production exceeds demand, and the previous storage level has already reached or exceeded the maximum capacity, m_varis kept constant to prevent accumulation beyond the design limit. In all other cases, m v a r is updated by adding the net production to the previous level, thereby reflecting the balance between production and consumption in the current time step. The state of charge of the storage system ( S o C s t ) is defined as the ratio between the actual hydrogen mass in storage and the maximum storage capacity ( m s t ):
S o C s t = m v a r / m s t
To ensure consistency between total production and demand over the simulation horizon, the model enforces the condition that the final storage state of charge ( S o C s t , f i n ) at the end of the annual simulation must be greater than or equal to its initial value ( S o C s t , i n ) .
S o C s t , f i n S o C s t , i n
The techno-economic inputs for the compressed hydrogen storage model, with their citations, are reported in Table 4.
Compression system: A hydrogen compression system is modeled to restore the nominal pressure of the stationary storage unit, adopting a quasi-static approach based on isentropic compression. In this study, a two-stage reciprocating compressor is considered: the first stage operates with a fixed compression ratio, while the second stage is variable and equipped with intercooling, which returns the gas to ambient temperature and thereby reduces the overall compression work. The techno-economic parameters used in this study are summarized in Table 5.
The equations for calculating the electrical compression work and the associated cooling demand are developed under the following assumptions: steady-state conditions ( m f l o w , H 2 , i n m f l o w , H 2 , o u t = 0 ), adiabatic compression ( Q = 0 ), and negligible pressure drops. To ensure an accurate representation of the process, the model incorporates corrections based on the isentropic efficiency ( η i s ) of each stage. Accordingly, the total compression work (kW) is given by Equation (16):
W c = m f l o w , H 2 · h 1 s t , i s h 0 η i s , 1 s t + h 2 s t , i s h 1 s t , o u t η i s , 2 s t
In this formulation, h 0 denotes the specific enthalpy at the compressor inlet, h 1 s t , i s the isentropic outlet enthalpy of the first stage, h 2 s t , i s the isentropic outlet enthalpy of the second stage, and h 1 s t , o u t the specific enthalpy at the outlet of the first stage after intercooling.

2.5. Model Limitations

The model developed in this study has several limitations that future work should address. To manage computational cost, the optimization was performed over a single meteorological year rather than a multi-year time series. This choice limits the model’s ability to capture both intra-annual patterns (e.g., seasonal and sub-seasonal variability of irradiance) and inter-annual variability (year-to-year changes in PV yield).
Consistent with prior studies [54], the electrolyzer system is represented with a simplified, quasi-steady formulation that does not resolve transient operating states. Start-up and shut-down penalties, warm-up and thermal management effects are not explicitly simulated. In addition, stack degradation as a function of cumulative operating hours is not modelled; instead, a single mid-life stack replacement is assumed. Omitting a time-dependent degradation curve may bias lifecycle energy consumption, availability, and REPLEX estimates.
The hydrogen storage subsystem is likewise simplified. Storage pressures are treated at nominal set-points without partialization of pressure levels across tanks or cascades. Consequently, potential reductions in compressor work and cycling losses achievable via optimized pressure staging are not reflected. Moreover, economies of scale in the installation of the PV field and the electrolyzer plant are not considered; costs are assumed to scale proportionally with capacity, and no learning-curve or bulk-procurement effects are applied. Finally, the demand profile is treated as stationery over the project lifetime. The model does not incorporate deterministic trends or stochastic demand variability, and it does not explore scenario uncertainty. Accounting for these technical and economic factors would improve the fidelity of the analysis and the accuracy of minimum-LCOH estimates.

3. Results and Discussion

3.1. GA Optimization Results

Based on the modeling approach previously described, the subsequent analysis focuses on the identification of the system configuration that achieves the lowest L C O H f l e e t . Through the iterative GA process, the algorithm converges toward the configuration that satisfies technical constraints while minimizing L C O H f l e e t . The results therefore provide not only the optimal design point but also insights into the sensitivity of L C O H f l e e t with respect to component sizing and system operation.
The analysis shows that the optimal storage capacity is determined by the interaction between operational constraints and the seasonal variability of renewable generation. Notably, this value does not necessarily coincide with the theoretical maximum hydrogen output of the installed electrolyzer capacity. As a consequence, a share of the hydrogen produced exceeds the storage capability of the optimal configuration. Depending on the adopted strategy, this surplus may either require temporary curtailment of production or be valorized through external sales, with significant implications for the final L C O H f l e e t . Indeed, the presence or absence of revenues from surplus hydrogen strongly influences economic competitiveness.
Figure 4 reports the minimum L C O H f l e e t values obtained for electrolyzer capacities ranging from 2 MW to 8 MW, assuming that the demand is exclusively determined by the hydrogen requirements of a bus fleet. The optimal configuration, highlighted in red, corresponds to a 4 MW electrolyzer and yields a minimum L C O H f l e e t of about 11 €/kg. This result reflects the configuration that maximizes economic efficiency under the specified demand, local operating conditions, and assumed economic parameters. Smaller electrolyzer sizes lead to undersized production systems, which necessitate a significant increase in storage capacity to meet operational constraints, thereby raising costs. Conversely, larger electrolyzer capacities result in oversizing relative to demand, again increasing costs and moving away from the economic optimum. In both cases, deviations from the optimal configuration drive L C O H f l e e t upward, underlining the importance of a balanced system design tailored to demand and local resource availability.
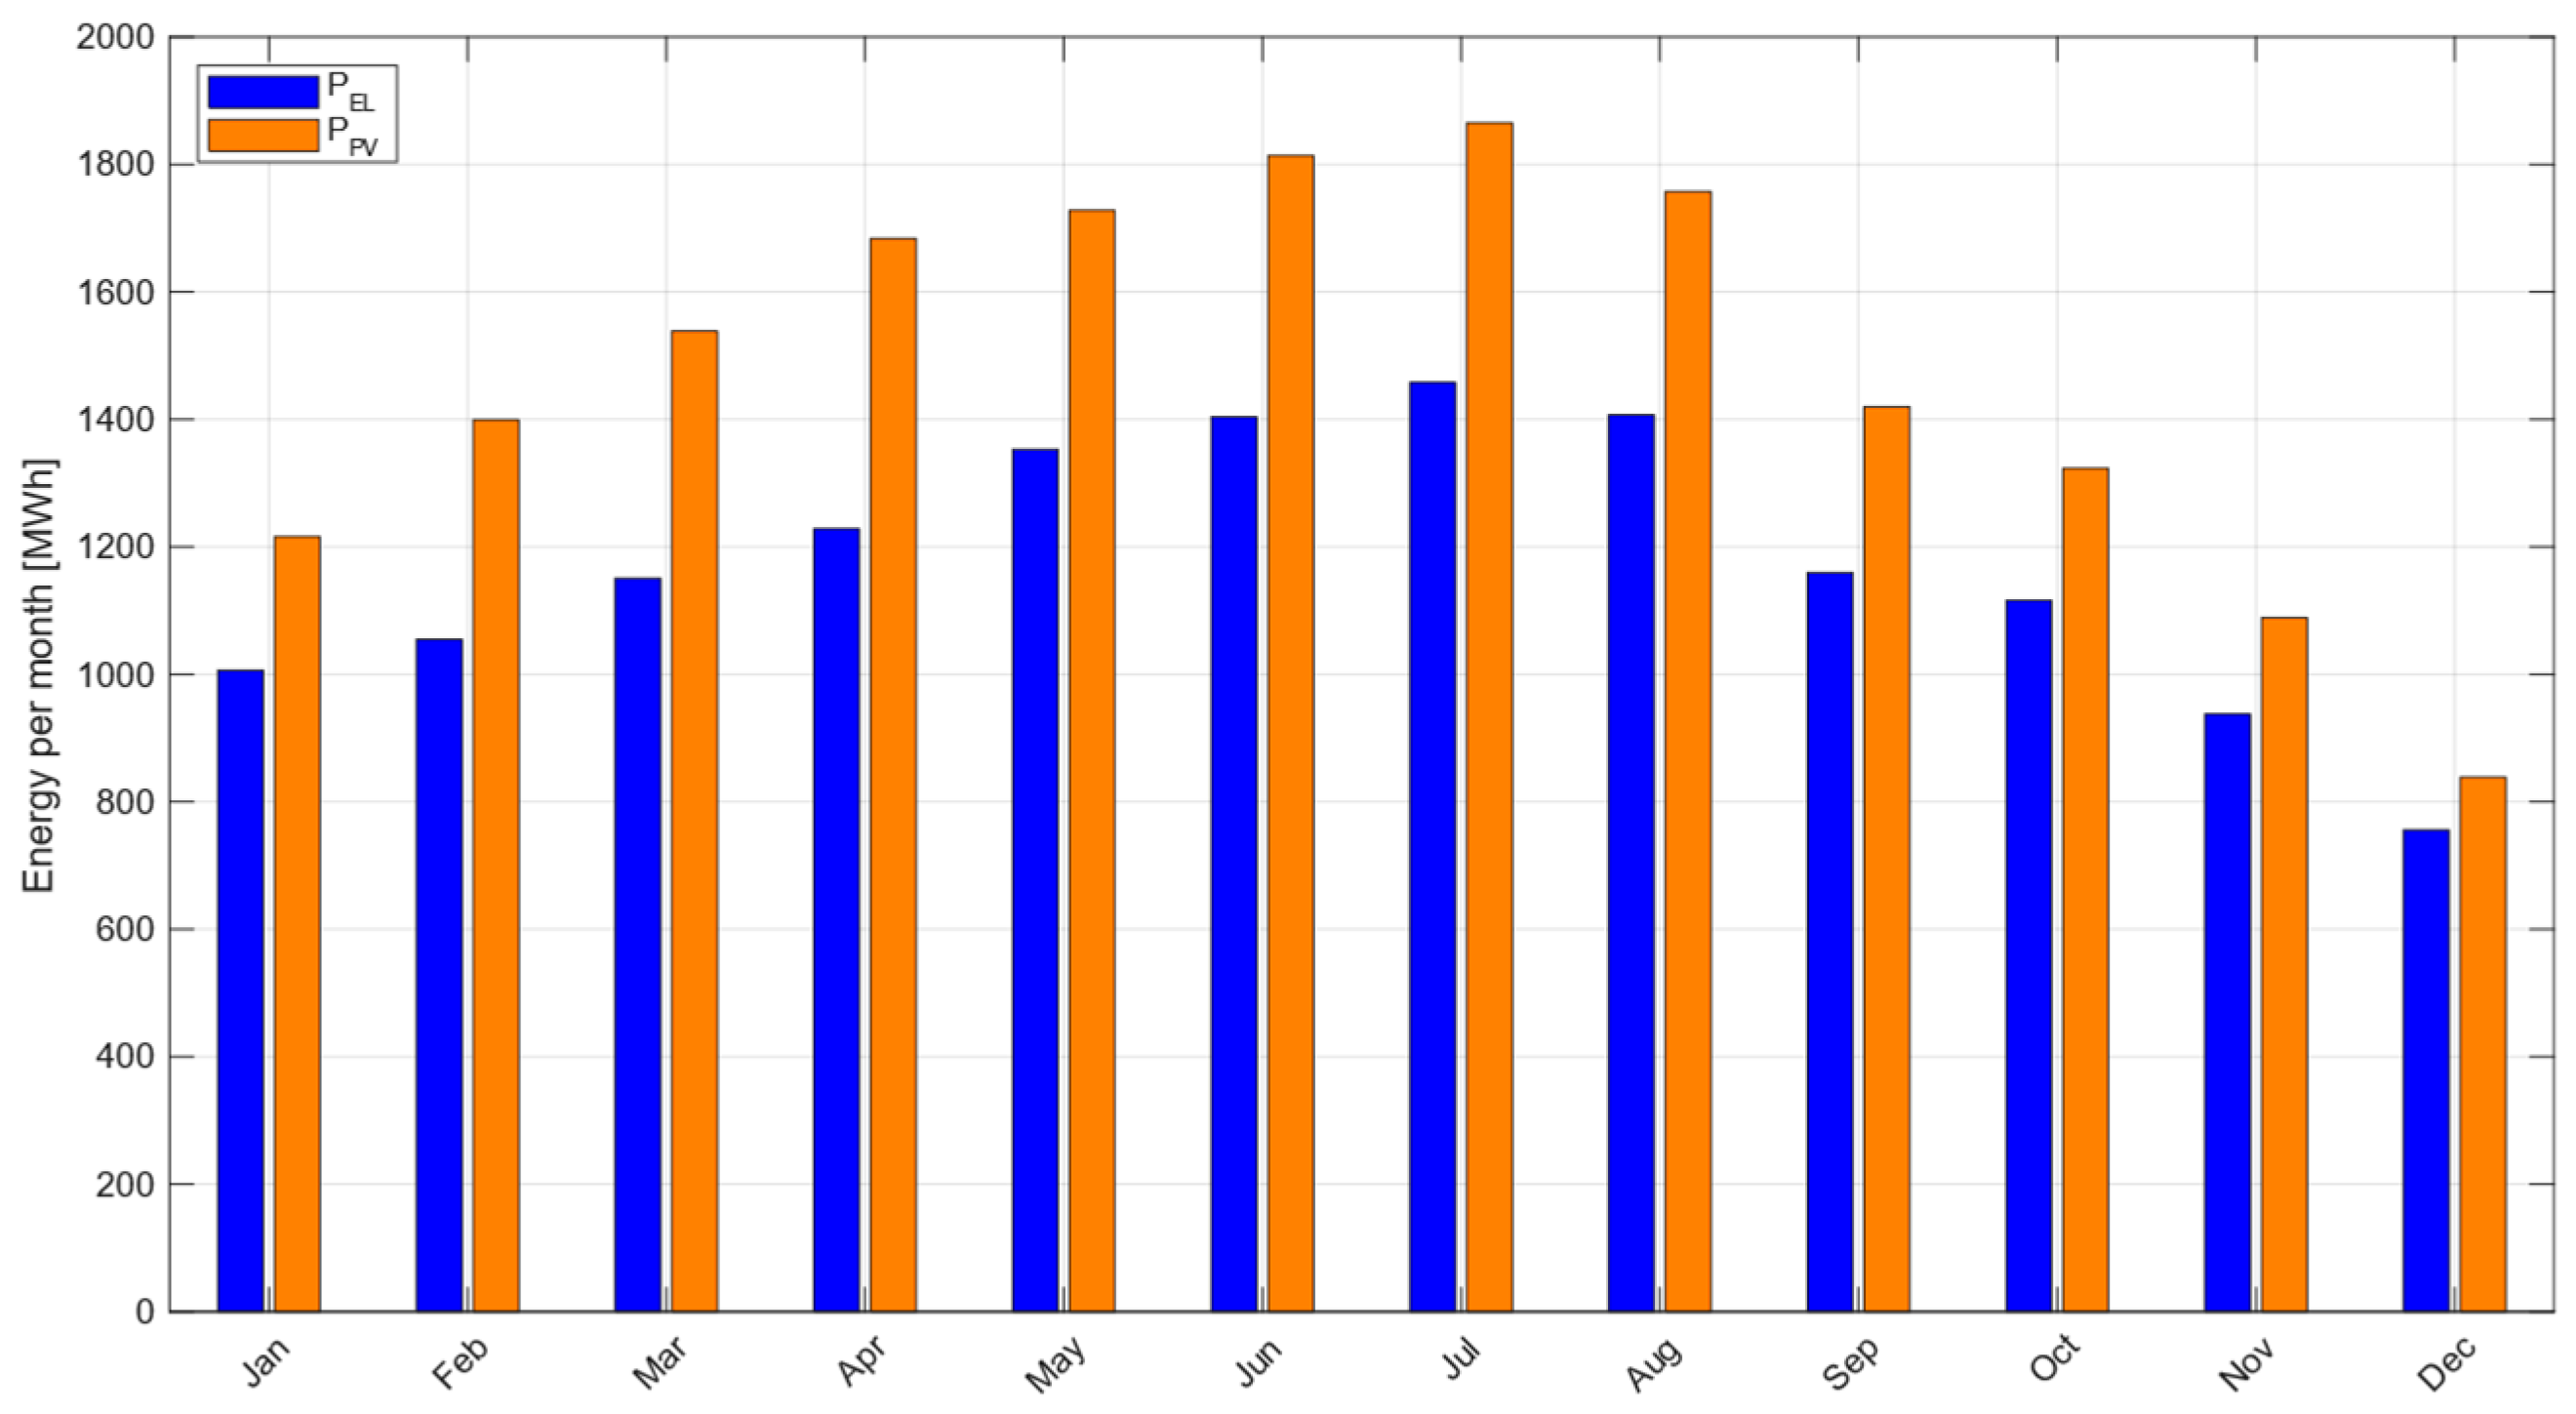
An additional optimized parameter within the model is the nominal capacity of the PV plant. The optimal value identified is 11 MWp. Figure 5 reports the weekly electricity production profile under a single-axis tracking configuration, together with the power absorbed by the electrolyzer. To further improve system performance, a BESS was incorporated, with an optimal capacity of 7 MWh, corresponding to an average of 270 charge–discharge cycles per year.
Although the solar capacity factor is relatively low at approximately 18%, suggesting potential improvements through advanced configurations such as bifacial modules or dual-axis tracking, the inclusion of the BESS significantly enhances the utilization rate of PV generation. Specifically, PV utilization exceeds 80% during winter and remains above 70% in summer, resulting in an average curtailment of around 20%.
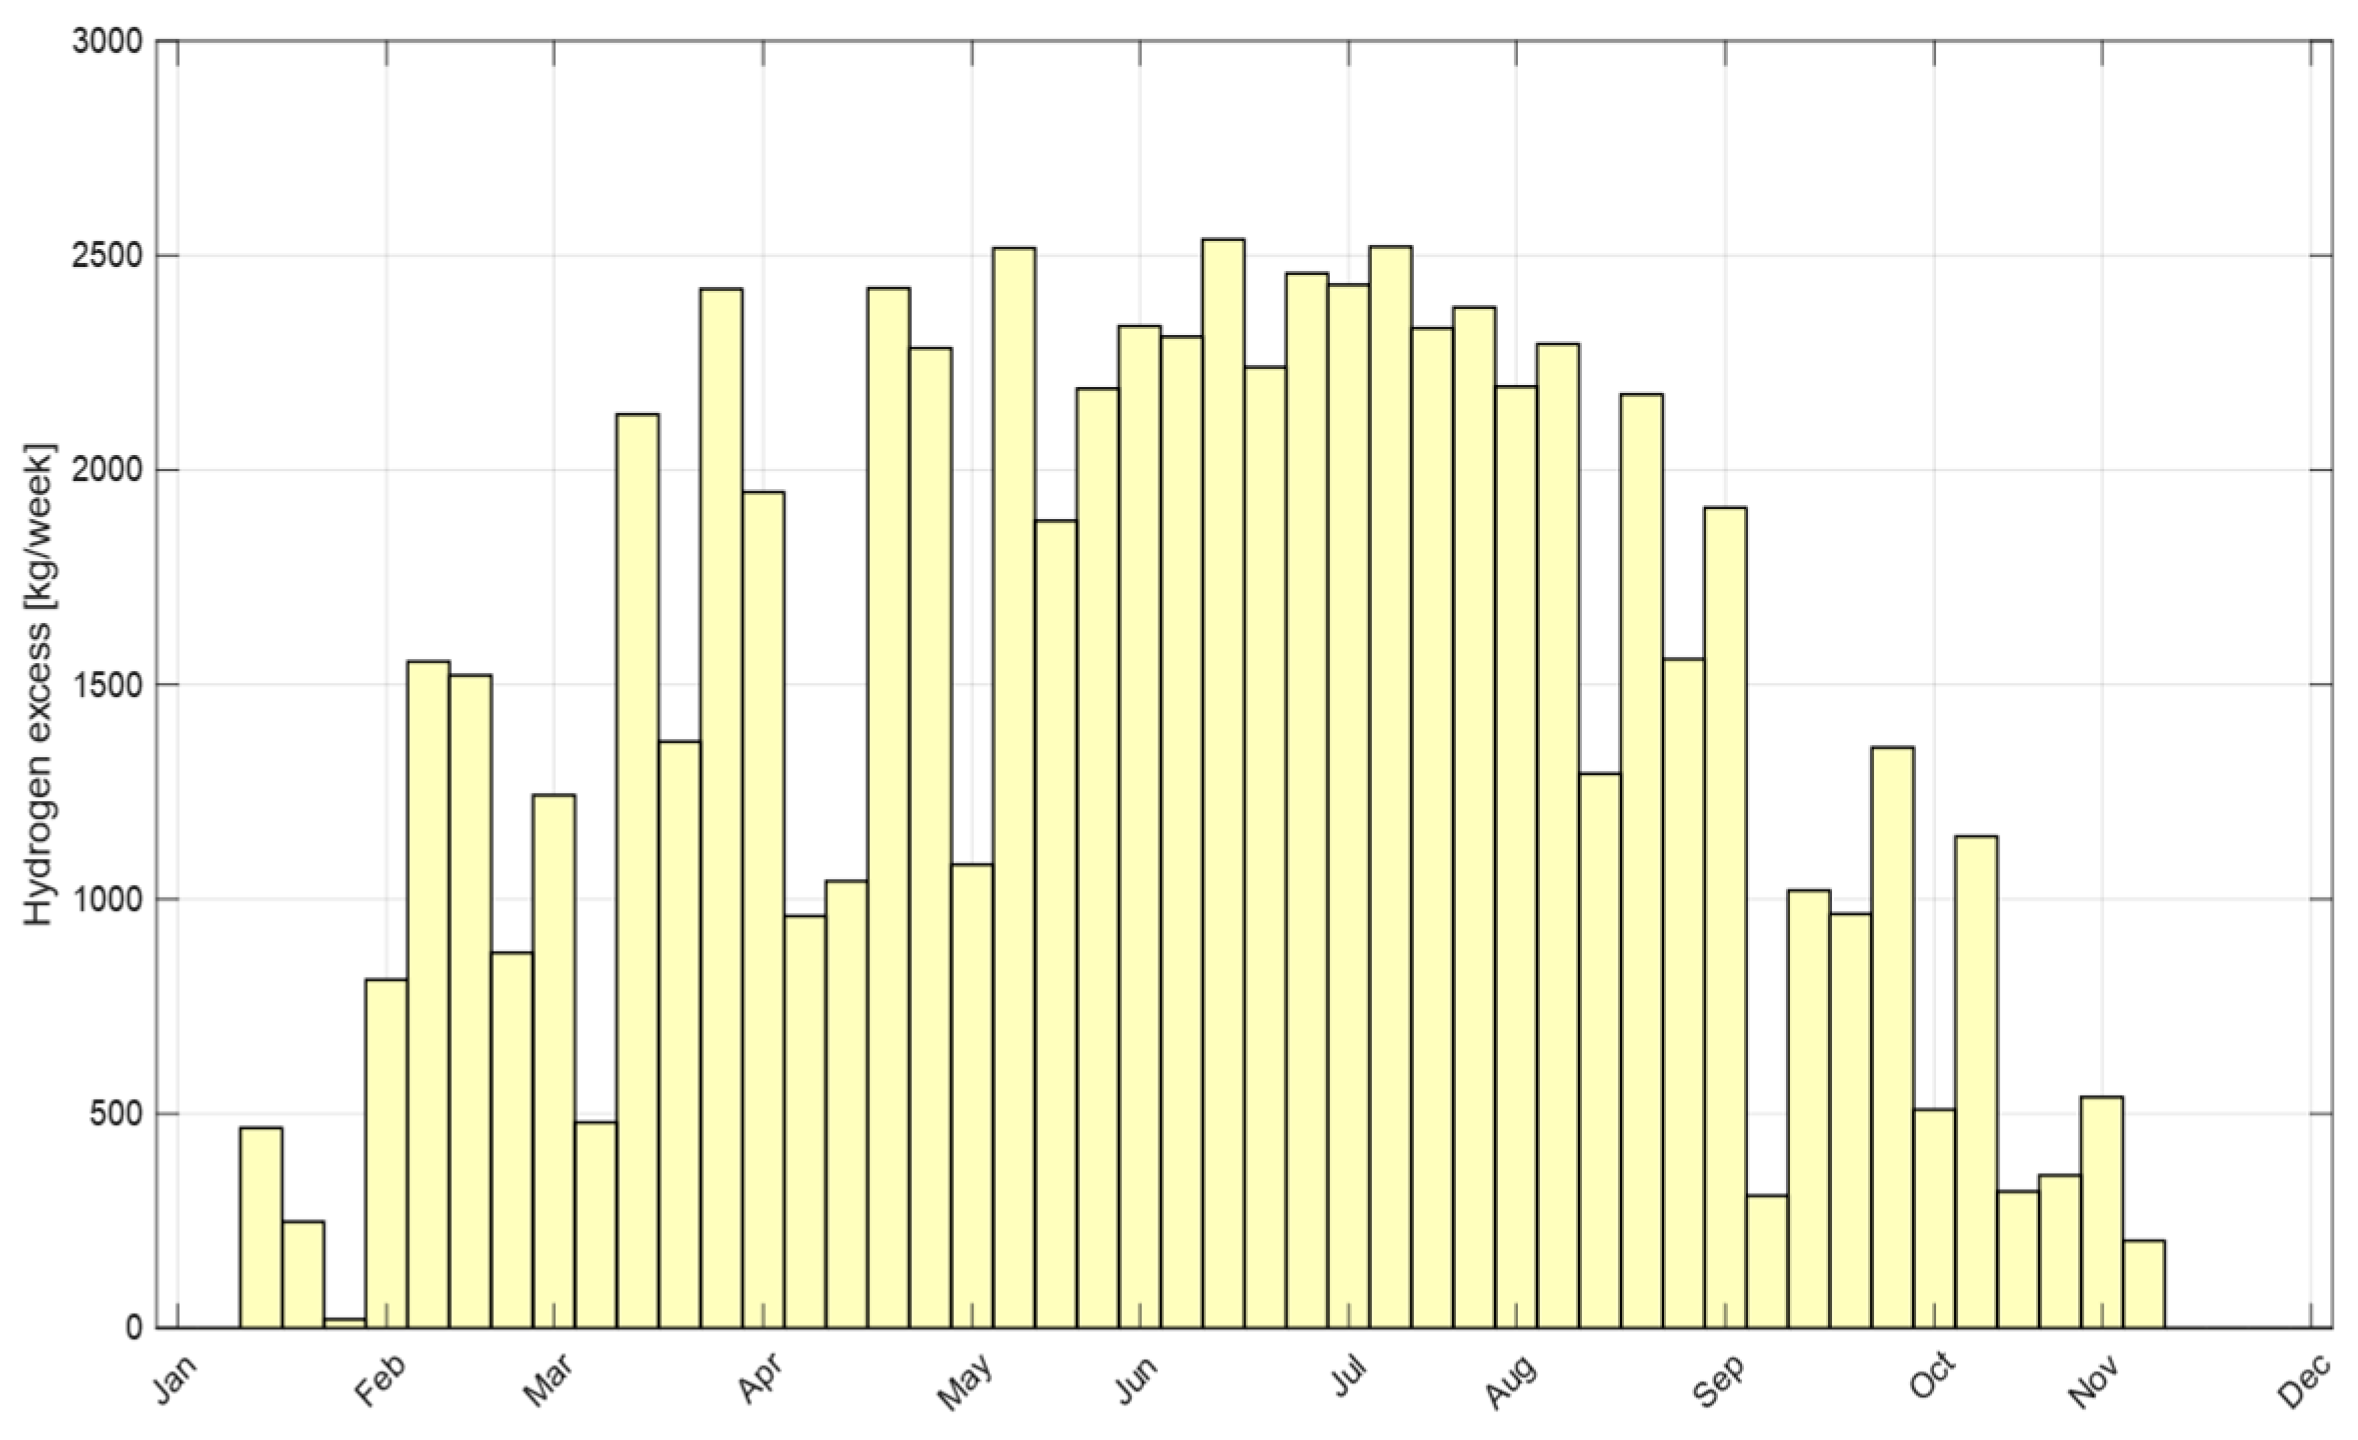
The analysis indicates that surplus hydrogen accounts for approximately 27% of the total annual production. This excess is primarily attributable to the high unit costs associated with compressed hydrogen storage, which leads the model to favor a configuration characterized by higher production capacity combined with reduced seasonal storage.
In particular, the optimal storage capacity is dimensioned to cover the fleet’s demand for a period of six days.
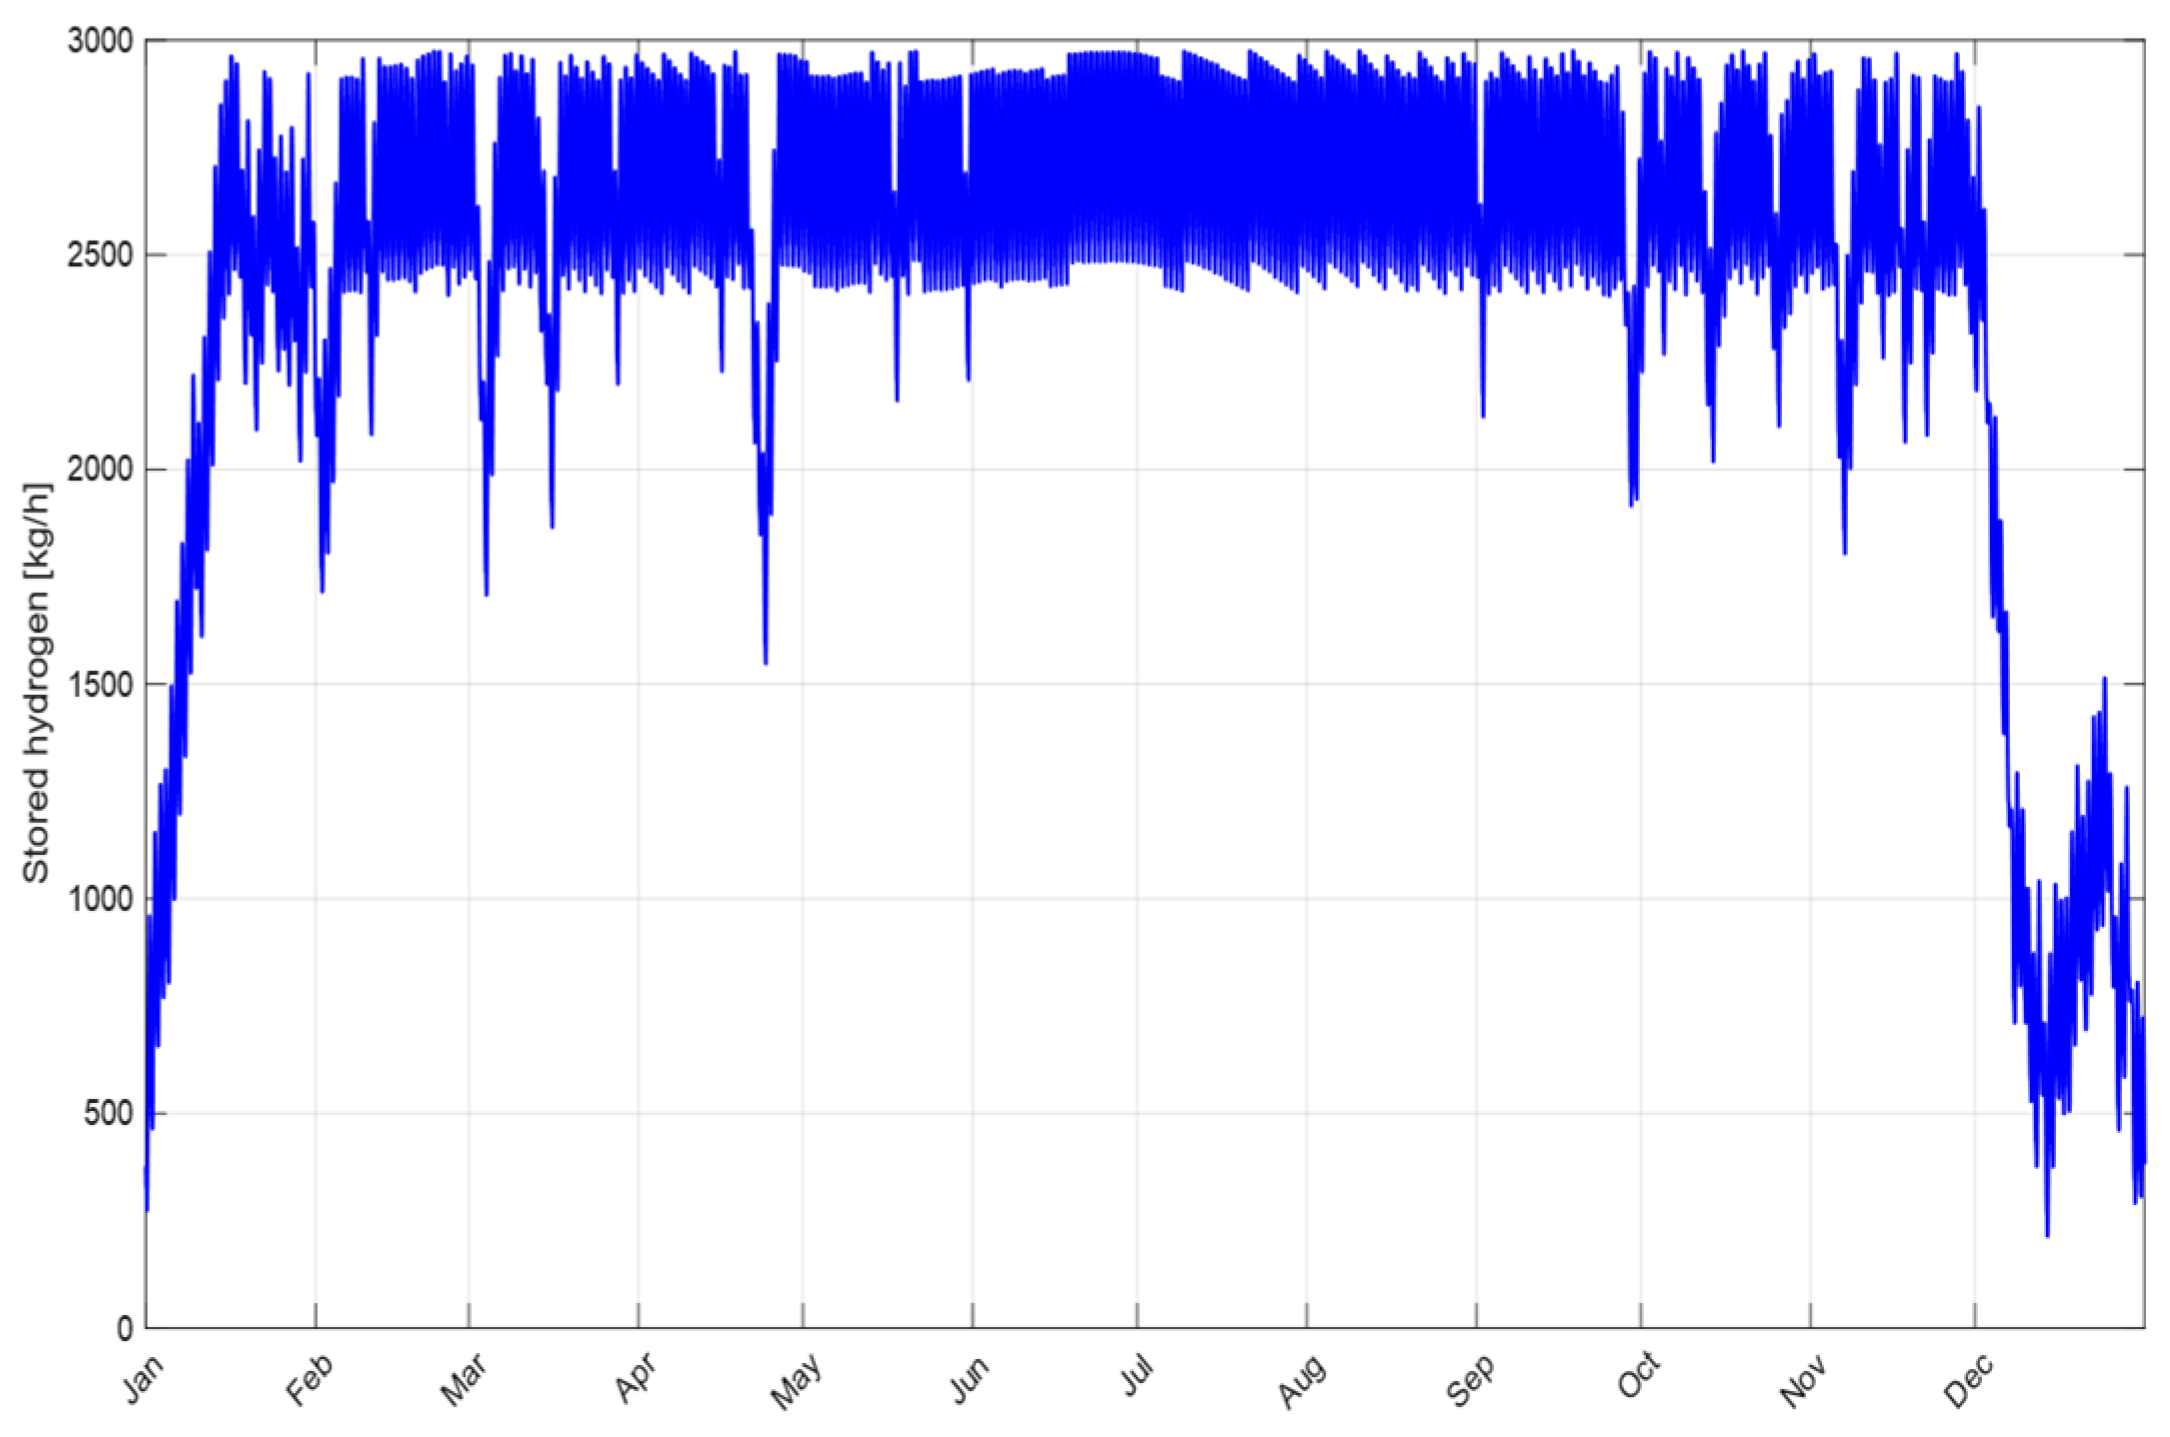
Figure 6 shows the annual hours during which hydrogen cannot be stored and could therefore be allocated to external users, while Figure 7 illustrates the evolution of the stored hydrogen throughout the year. A combined examination of the two figures highlights how the optimal sizing of the system represents a compromise between minimizing overall costs and ensuring demand satisfaction, particularly during the winter months. Considering the plant’s total hydrogen output (i.e., not only the fleet-dedicated share) lower the LCOH to 7.98 €/kg, compared with 11 €/kg when the facility serves exclusively the HDVs fleet for which it was optimized. Notably the selected system design does not optimize the overall LCOH it only optimizes the L C O H f l e e t based on assumed demand profiles and operational constraints. A summary of the techno-economic results for the identified optimal configuration is provided in Table 6.

3.2. Economic Viability of the Investment

Given that a substantial share of TCO is driven by the vehicle purchase price and O&M expenditures, and that policy instruments to accelerate the uptake of zero-emission HDVs typically lower upfront costs, rather than model the overall TCO, which depends on numerous variables, this study builds on the Joint Research Centre methodology [55] to develop a simplified approach for comparing at-the-pump prices for hydrogen and diesel. The theoretical hydrogen parity price with diesel can be obtained by imposing an energy-equivalence constraint whereby the mass of hydrogen dispensed delivers the same tank-to-wheel (TTW) useful energy as diesel, as formalized in Equation (17), in which L H V H 2 = 33.33 kWh/kg, L H V d = 11.6 kWh/kg, and tank-to-wheel efficiency for FCEVs and internal combustion vehicles (ICEs) are 45% [56] and 27% [57], respectively:
p H 2 = p d · L H V H 2 · η F C E V T T W L H V d · η I C E T T W
Because road diesel is subject to multiple nationally determined taxes, with an average fiscal burden across the EU-27 of roughly 90% of the wholesale fuel price [58], it is essential to select the appropriate benchmark price. Since VAT is a consumption tax borne by the final consumer and all EU member states exempt hydrogen used for road transport in FCEVs from fuel excise [58], the hydrogen price has been benchmarked against the retail diesel price inclusive of excise duties but net of VAT. Accordingly, applying Equation (17) to the EU-27 average diesel price of 1.28 €/L (2024 annual average) yields a diesel-parity hydrogen price of 7.48 €/kg. The hydrogen parity price derived herein must be interpreted as all-inclusive, covering the full costs of production, compression, storage, and dispensing. Accordingly, it embedded full remuneration of CAPEX and all OPEX, as detailed in the tables of Section 2.4.
As mentioned, the purpose of the present analysis is not to perform a like-for-like TCO comparison between FCEV and diesel HDVs, an exercise already covered extensively and shown to be highly sensitive to country-specific fiscal, financing, and duty-cycle assumptions [14,16]. Instead, we introduce an energy-equivalent “diesel-parity” hydrogen price, derived from Equation (17), as a neutral yardstick that isolates the fuel-cost dimension. This reference price can be juxtaposed to the modeled LCOH to infer the minimum support required—via production incentives, operating subsidies, excise relief, or other measures—to close the competitiveness gap at the pump. The approach is particularly useful given that each EU member state designs and administers zero-emission HDV purchase and operating incentives independently, yielding heterogeneous TCO outcomes that complicate cross-country comparability. By focusing on parity at equal tank-to-wheel useful energy, our metric offers a portable benchmark that policymakers and investors can combine ex post with national incentive packages, while remaining agnostic about broader powertrain choices and system-level trade-offs highlighted in comparative assessments of BEVs and FCEVs [14,16].
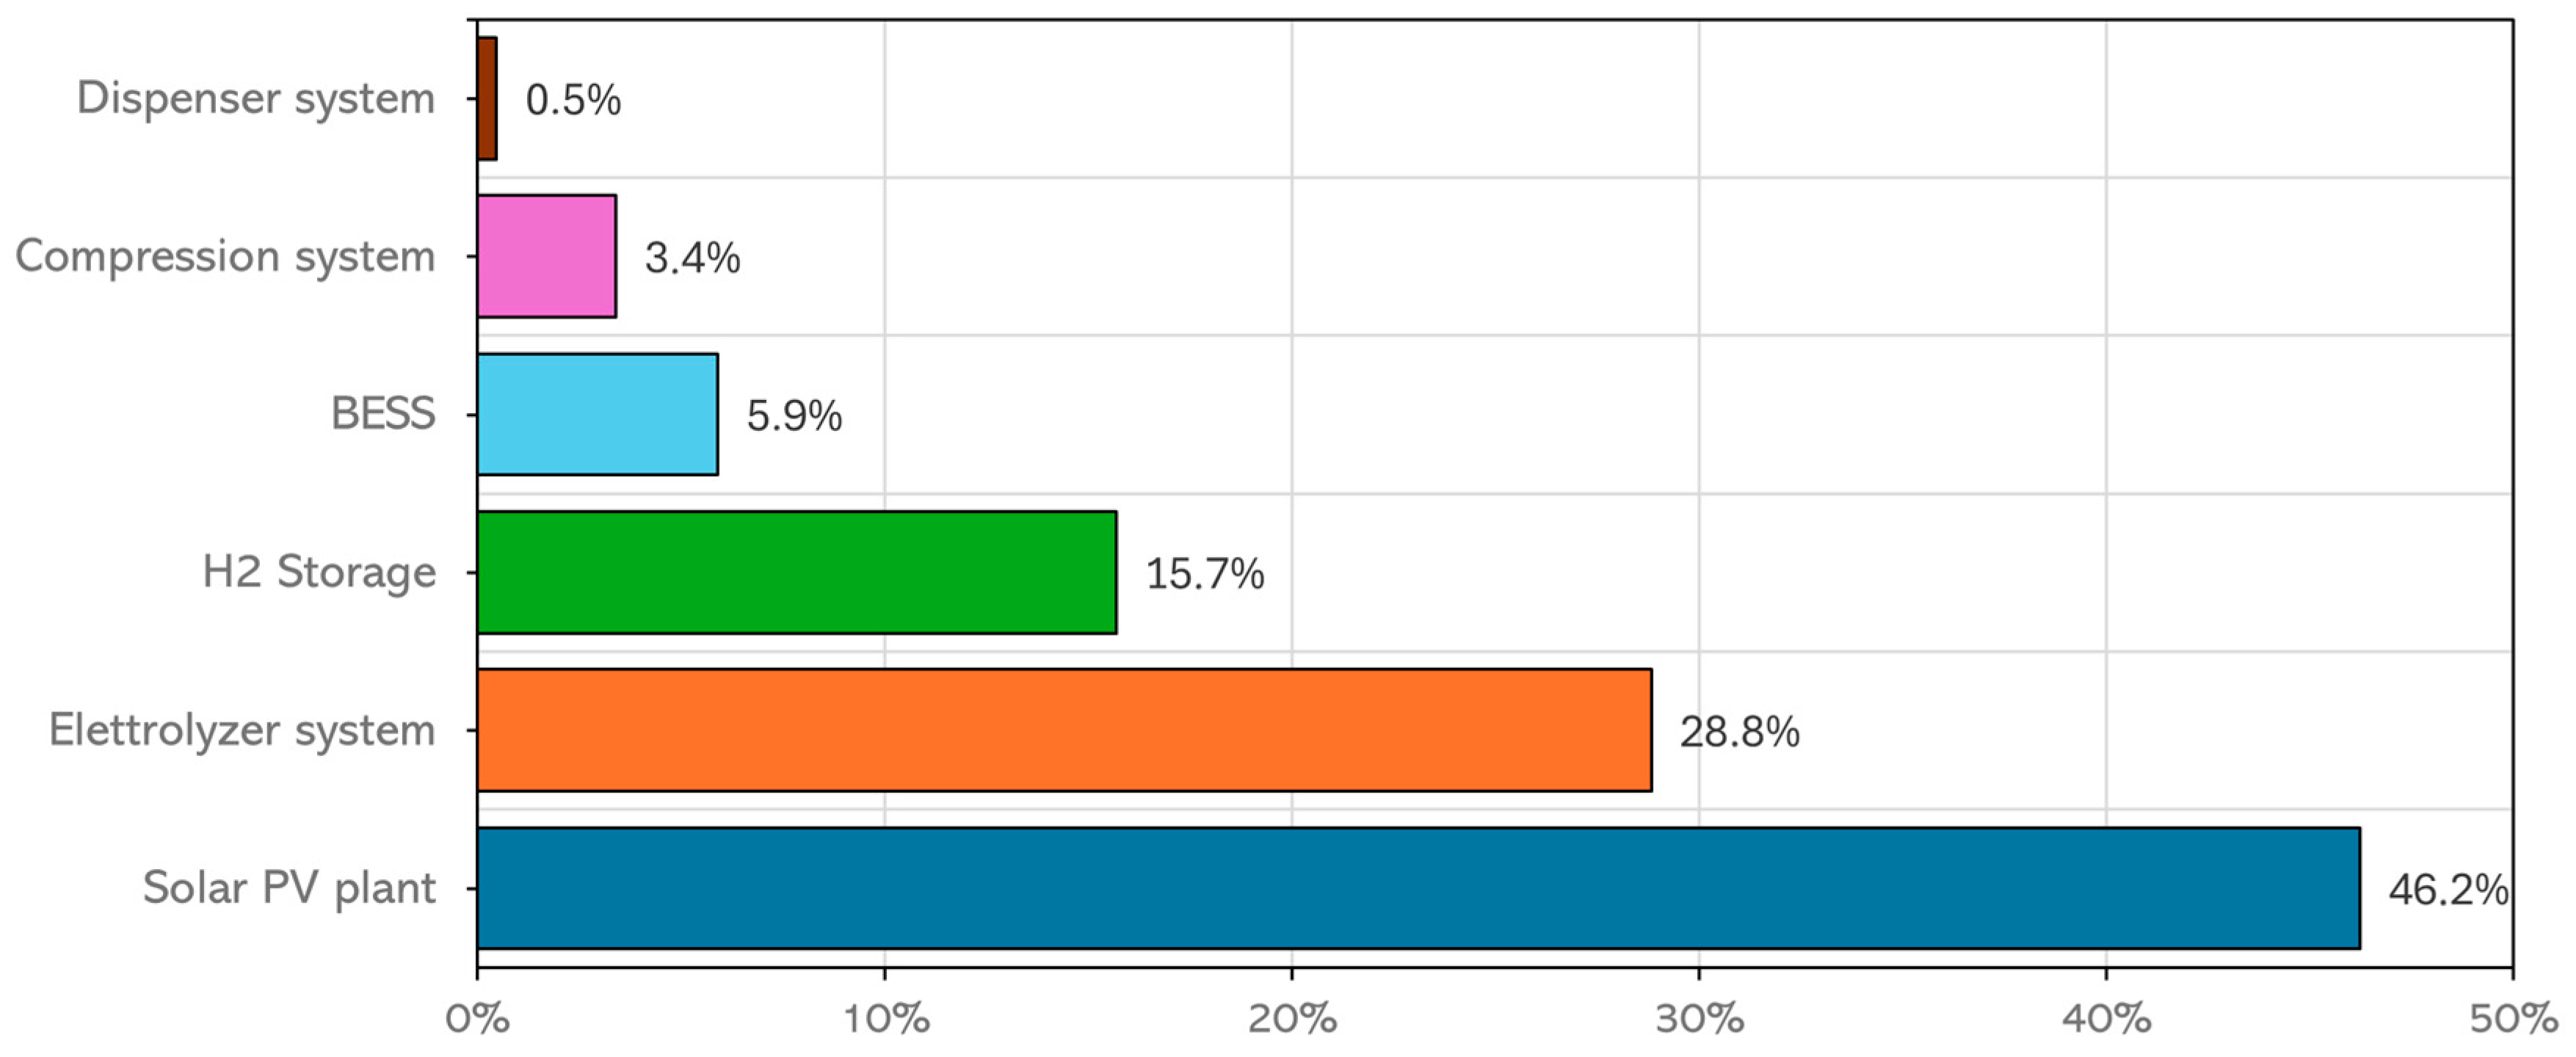
In the case study—aimed at minimizing fuel costs for a bus fleet refueled with on-site green hydrogen produced via PV-powered electrolysis—the L C O H f l e e t is 11 €/kg, which remains well above the diesel-parity—energy-equivalence—price. Because roughly 70% of total CAPEX is attributable to the PV plant and the electrolyzer, as shown in Figure 8, it is pertinent to quantify the minimum incentive intensity that would render the project investable while allowing hydrogen to be delivered to the fleet at the parity price.
Building on NREL capital-structure guidance [59], which indicates that a real, unlevered internal rate of return (IRR) of ≈10% is required to make early-stage hydrogen project attractive to private investors and to compensate for technology and market-immaturity risk. Combining this financing criterion with the previously derived diesel-parity price it was possible to infer the capital grant needed for bankability. The project’s gross revenue is 182,500 kg/yr × 7.48 €/kg = 1.365 M€/year. Using these inflows, together with modelled O&M and other cash costs, in a discounted cash-flow analysis calibrated to a 10% real, unlevered IRR, the financing model yields a maximum investable upfront outlay of 6.95 M€. Relative to the baseline no-incentive CAPEX, this implies a capital grant of 9.78 M€, that is 58.4% of total CAPEX.
If surplus hydrogen can be progressively monetized, for example, starting from 500 kg in the first year and doubling year-on-year until all excess production is absorbed, the required grant to meet the 10% IRR target falls to ~48%. In the limiting case, if all surplus hydrogen could be sold from day one, the fleet-level LCOH would coincide with the plant LCOH (7.98 €/kg), approaching the assumed diesel-parity price, underscoring the sensitivity of bankability to early-stage offtake ramp-up. From a policy-design perspective, complementary instruments could include fixed end-user hydrogen tariffs (for public retail/fleet uses), combined with temporary electricity-market revenues (spot sales and ancillary-services participation) to support site economics until hydrogen utilization reaches steady state.

4. Conclusions

This study investigated the optimal sizing of a hydrogen refueling station dedicated to the operation of a fixed fleet of fuel cell buses, with the overarching objective of minimizing the L C O H f l e e t . To this end, a dynamic MATLAB-based simulation framework, coupled with a genetic algorithm, was developed to explore alternative system configurations and operational strategies and identify the cost-optimal configuration under realistic operational constraints.
The results indicate that the optimal configuration consists of an electrolyzer capacity of 4 MW, combined with 11 MWp of solar PV, 7 MWh of battery energy storage, and a seasonal hydrogen storage system dimensioned to fleet demand coverage over the year. Deviations from this configuration—either undersizing or oversizing—significantly increase costs, due to the high unit cost of storage and the reduced utilization of excess electrolyzer capacity. The optimal L C O H f l e e t is 11 €/kg, which decreases to 7.98 €/kg if surplus hydrogen, approximately 27% of annual production, can be valorized through sales. However, achieving competitiveness with diesel requires targeted policy support. The financial analysis shows that progressive utilization of surplus hydrogen substantially lowers the capital incentive required to secure an IRR of 10%, considered adequate for investments in emerging hydrogen technologies. Under this scenario, a subsidy of about 9.78 M€ (≈58.4% of total investment) is required, with support measures primarily directed toward the PV and electrolyzer systems, which together account for more than 75% of overall capital expenditure.
Overall, the GA-based model developed in this work provides a robust methodological framework and critical input data to support both system design and policymaking. It can enable informed decisions on plant sizing, preventing over- or under-dimensioning and thereby reducing hydrogen production costs. At the same time, it constitutes a valuable decision-support tool for policymakers, fostering more efficient allocation of public resources. In the medium to long term, appropriate system sizing, combined with well-calibrated incentive schemes, will be essential to enhance the efficiency of the national energy system, reduce electricity costs for end users, and promote the sustainable use of renewable resources. Future work will extend the model to include the provision of ancillary grid services, the integration of additional renewable energy sources such as wind, and the impact of dynamic electricity prices and cross-sectoral hydrogen demand. This will allow a more comprehensive assessment of system competitiveness under evolving market and policy conditions.

Author Contributions

Conceptualization, D.V., R.C. and E.B.; methodology, R.C., D.V. and E.B.; software, D.V. and R.C.; Formal analysis, R.C.; validation, E.B. and U.D.M.; data curation, E.B.; writing—original draft preparation, D.V. and R.C.; writing—review and editing, E.B. and U.D.M.; supervision, E.B. All authors have read and agreed to the published version of the manuscript.

Funding

This work was conducted under the ‘Accordo di Programma MASE-ENEA sulla Ricerca di Sistema Elettrico—Piano Triennale di Realizzazione 2022–2024’—Integrated project ‘Hydrogen technologies’, which is supported by the ‘Fund for financing Research activities’ established at ‘Cassa per i servizi energetici e ambientali (CSEA)’. The origins of this research also trace back to activities undertaken by Università degli Studi Guglielmo Marconi within the LIFE3H project (LIFE3H-LIFE20 ENV/IT/000575).

Data Availability Statement

The original contributions presented in this study are included in the article. Further inquiries can be directed to the corresponding author.

Acknowledgments

The authors also acknowledge the cooperation with the colleague of ENEA Claudia Bassano for the valuable insights in the development of the model.

Conflicts of Interest

The authors declare no conflicts of interest.

Abbreviations

ηEfficiency, %
c Capacity, kWh
E Energy, kWh
H Enthalpy, kJ/kg
m Mass, kg
N Number
pPrice, €/kg
PPower, kW
QHeat transfer, kW
tTime, h
WWork, kW
Acronyms
BESSBattery energy storage system
BEVBattery electric vehicle
CAPEXCapital cost of expenditure
CFCapacity factor
EUEuropean Union
FCEVFuel cell electric vehicle
GAGenetic algorithm
GHGGreenhouse gas emissions
H2 Hydrogen
HDVHeavy-duty vehicle
HOMERHybrid optimization of multiple energy resources
HRSHydrogen refueling station
ICEInternal combustion engine
IRRInternal rate return
LCOHLevelized cost of hydrogen
LCOH-TLevelized cost of hydrogen for transport
LHVLow heating value
NRELNational Renewable Energy Laboratory
O&MOperation and maintenance
OPEXOperational cost of expenditure
PEMProton exchange membrane
PVPhotovoltaic
REPLEXReplacement cost
SOCState of charge
TCOTotal cost of ownership
TTWTank-to-wheel
VATValue Added Tax
Subscripts
1stFirst stage
2stSecond stage
aAnnualized
b, battBattery
cCompression
chCharge
dDiesel
demDemand
dishDischarge
elElectrolyzer
finFinal
fixFixed
inInitial
isIsentropic
minMinimum
nomNominal
sysSystem
stStorage
varVariable

References

  1. Erbach, G. Regulation (EU) 1119. In European Climate Law; European Commission: Brussel, Belgium, 2021. [Google Scholar]
  2. European Environment Agency. Greenhouse Gas Emissions from Transport in Europe. EEA. Available online: https://www.eea.europa.eu/en/analysis/indicators/greenhouse-gas-emissions-from-transport (accessed on 1 September 2025).
  3. European Environment Agency. Reducing Greenhouse Gas Emissions from Heavy-Duty Vehicles in Europe. EEA. Available online: https://www.eea.europa.eu/en/analysis/publications/reducing-greenhouse-gas-emissions-from-heavy-duty-vehicles-in-europe?activeTab=4dc6e920-0511-4a13-9e54-cdf81d43511f (accessed on 1 September 2025).
  4. European Environment Agency. Sustainability of Europe’s Mobility Systems; European Environment Agency: Copenhagen, Denmark, 2024. [CrossRef]
  5. Bhuiyan, M.M.H.; Siddique, Z. Hydrogen as an alternative fuel: A comprehensive review of challenges and opportunities in production, storage, and transportation. Int. J. Hydrogen Energy 2025, 102, 1026–1044. [Google Scholar] [CrossRef]
  6. Mulholland, E.; Miller, J.; Braun, C.; Sen, A.; Ragon, P.-L.; Rodríguez, F. The CO2 Standards Required for Trucks and Buses for Europe to Meet Its Climate Targets. International Council on Clean Transportation. 2022. Available online: https://theicct.org/publication/hdv-co2standards-recs-mar22/ (accessed on 1 September 2025).
  7. Grzelakowski, A.S. Market and Regulatory Challenges of the EU Road Freight Transport Transformation towards Zero Emissions. Eur. Res. Stud. J. 2025, XXVIII, 680–695. [Google Scholar] [CrossRef]
  8. Eurostat. EU People on the Move in 2022. Available online: https://ec.europa.eu/eurostat/web/products-eurostat-news/w/ddn-20240916-1 (accessed on 1 September 2025).
  9. IEA. The Future of Hydrogen; IEA: Paris, France, 2019.
  10. Kleen, G.; Gibbons, W. Heavy-Duty Fuel Cell System Cost—2023; U.S. Department of Energy: Washington, DC, USA, 2024.
  11. Bracci, J.; Koleva, M.; Chung, M. Levelized Cost of Dispensed Hydrogen for Heavy-Duty Vehicles; No. NREL/TP-5400-88818; National Renewable Energy Laboratory (NREL): Golden, CO, USA, 2024.
  12. Catsaros, O. Lithium-Ion Battery Pack Prices See Largest Drop Since 2017, Falling to $115 per Kilowatt-Hour; BloombergNEF: London, UK, 2024. [Google Scholar]
  13. Ahluwalia, R.K.; Wang, X.; Papadias, D.D.; Star, A.G. Performance and Total Cost of Ownership of a Fuel Cell Hybrid Mining Truck. Energies 2023, 16, 286. [Google Scholar] [CrossRef]
  14. De Wolf, D.; Smeers, Y. Comparison of Battery Electric Vehicles and Fuel Cell Vehicles. World Electr. Veh. J. 2023, 14, 262. [Google Scholar] [CrossRef]
  15. Hussein, B.; Rodríguez, F. A Total Cost of Ownership Comparison of Truck Decarbonization Pathways in Europe; International Council on Clean Transportation: Washington, DC, USA, 2023; pp. 1–35. [Google Scholar]
  16. Danielis, R.; Scorrano, M.; Masutti, M.; Awan, A.M.; Niazi, A.M.K. The Economic Competitiveness of Hydrogen Fuel Cell-Powered Trucks: A Review of Total Cost of Ownership Estimates. Energies 2024, 17, 2509. [Google Scholar] [CrossRef]
  17. Nnabuife, S.G.; Hamzat, A.K.; Whidborne, J.; Kuang, B.; Jenkins, K.W. Integration of renewable energy sources in tandem with electrolysis: A technology review for green hydrogen production. Int. J. Hydrogen Energy 2025, 107, 218–240. [Google Scholar] [CrossRef]
  18. Jolly, S.S.; Twinkle, A.R.; Sasi, B.S.A.; Reshma, R. Emerging paradigms in renewable hydrogen production: Technology, challenges, and global impact. Next Energy 2025, 8, 343. [Google Scholar] [CrossRef]
  19. Titheridge, L.J.; Marshall, A.T. Techno-economic modelling of AEM electrolysis systems to identify ideal current density and aspects requiring further research. Int. J. Hydrogen Energy 2024, 49, 518–532. [Google Scholar] [CrossRef]
  20. European Hydrogen Observatory. Clean Hydrogen Observatory. In Levelised Cost of Hydrogen (LCOH) Calculator Manual; European Hydrogen Observatory: Brussels, Belgium, 2024. [Google Scholar]
  21. Prokopou, G.I.; Faust, J.M.M.; Mitsos, A.; Bongartz, D. Cost-optimal design and operation of hydrogen refueling stations with mechanical and electrochemical hydrogen compressors. Comput. Chem. Eng. 2025, 192, 108862. [Google Scholar] [CrossRef]
  22. Chen, G.; Su, S.; Xu, Q.; Lv, H.; Zhao, Y.; Xia, L.; Zhang, G.; Hu, K. Optimization of hydrogen refueling strategy: Based on energy consumption and refueling demand. Int. J. Hydrogen Energy 2024, 71, 625–636. [Google Scholar] [CrossRef]
  23. Genovese, M.; Fragiacomo, P. Hydrogen station evolution towards a poly-generation energy system. Int. J. Hydrogen Energy 2022, 47, 12264–12280. [Google Scholar] [CrossRef]
  24. Zhang, Y.; Zhang, W.; He, Y.; Zhang, H.; Chen, W.; Yang, C.; Dong, H. Capacity Optimization of Renewable-Based Hydrogen Production–Refueling Station for Fuel Cell Electric Vehicles: A Real-Project-Based Case Study. Sustainability 2025, 17, 7311. [Google Scholar] [CrossRef]
  25. Kim, G.-W.; Park, S.-W.; Son, S.-Y. Techno-Economic Optimal Operation of an On-Site Hydrogen Refueling Station. Appl. Sci. 2025, 15, 10999. [Google Scholar] [CrossRef]
  26. Mansir, I.B. Design and optimization of hydrogen refueling station powered by hybrid energy system. J. Renew. Sustain. Energy 2025, 17, 046302. [Google Scholar] [CrossRef]
  27. Okonkwo, P.C.; Nwokolo, S.C.; Alarifi, S.S.; Ekwok, S.E.; Orji, R.; Udo, S.O.; Eldosouky, A.M.; Barhoumi, E.M.; Das, B.K.; Gomez-Ortiz, D.; et al. Bio-inspired computational intelligence metaheuristic-based optimization and sensitivity analysis approach to determine techno-economic feasibility of hydrogen refueling stations for fuel cell vehicles. Sci. Rep. 2025, 15, 12451. [Google Scholar] [CrossRef]
  28. Oueslati, F. HOMER optimization of standalone PV/Wind/Battery powered hydrogen refueling stations located at twenty selected French cities. Int. J. Renew. Energy Dev. 2023, 12, 1070–1090. [Google Scholar] [CrossRef]
  29. Al-Sharafi, A.; Al-Buraiki, A.S.; Al-Sulaiman, F.; Antar, M.A. Hydrogen refueling stations powered by hybrid PV/wind renewable energy systems: Techno-socio-economic assessment. Energy Convers. Manag. X 2024, 22, 100584. [Google Scholar] [CrossRef]
  30. Arunachalam, M.; Han, D.S. Efficient solar-powered PEM electrolysis for sustainable hydrogen production: An integrated approach. Emergent. Mater. 2024, 7, 1401–1415. [Google Scholar] [CrossRef]
  31. Hong, F.T.; Lin, H.; Vazquez-Sanchez, H.; Xue, X.; Li, Y.; Zhang, L.; Sarathy, S.M. Minimizing renewable hydrogen costs at producer’s terminal gate with alkaline electrolyser, proton exchange membrane, and their co-installment: A regional case study in China. Int. J. Hydrogen Energy 2024, 86, 1051–1062. [Google Scholar] [CrossRef]
  32. Liu, L.; Ma, H.; Khan, M.; Hsiao, B.S. Recent Advances and Challenges in Anion Exchange Membranes Development/Application for Water Electrolysis: A Review. Membranes 2024, 14, 85. [Google Scholar] [CrossRef]
  33. Apostolou, D.; Xydis, G. A literature review on hydrogen refuelling stations and infrastructure. Current status and future prospects. Renew. Sustain. Energy Rev. 2019, 113, 109292. [Google Scholar] [CrossRef]
  34. Caponi, R.; Bocci, E.; Del Zotto, L. Techno-Economic Model for Scaling Up of Hydrogen Refueling Stations. Energies 2022, 15, 7518. [Google Scholar] [CrossRef]
  35. IEA. Global Hydrogen Review 2024; IEA: Paris, France, 2024.
  36. H2 mobility. Overview Hydrogen Refuelling for Heavy Duty Vehicles; H2 Mobility: Berlin, Germany, 2021. [Google Scholar]
  37. Caponi, R.; Ferrario, A.M.; Del Zotto, L.; Bocci, E. Hydrogen refueling stations and fuel cell buses four year operational analysis under real-world conditions. Int. J. Hydrogen Energy 2022, 48, 20957–20970. [Google Scholar] [CrossRef]
  38. Gunawan, T.A.; Williamson, I.; Raine, D.; Monaghan, R.F.D. Decarbonising city bus networks in Ireland with renewable hydrogen. Int. J. Hydrogen Energy 2021, 46, 28870–28886. [Google Scholar] [CrossRef]
  39. Sayer, M.; Ajanovic, A.; Haas, R. On the economics of a hydrogen bus fleet powered by a wind park—A case study for Austria. Int. J. Hydrogen Energy 2022, 47, 33153–33166. [Google Scholar] [CrossRef]
  40. FCH-JU. New Bus ReFuelling for European Hydrogen Bus Depots. Guidance Document on Large Scale Hydrogen Bus Refuelling. 2017. Available online: https://www.fuelcellbuses.eu/ (accessed on 3 July 2025).
  41. MATLAB, Version 9.13 (R2022b); MATLAB: Natick, MA, USA, 2022.
  42. Vizza, D.; Caponi, R.; Bocci, E.; Del Zotto, L.; Bassano, C. Cost effective hydrogen production of coupled photovoltaic and electrolyzer systems considering plant lifetime and geographical location. Energy Convers. Manag. X 2025, 27, 101136. [Google Scholar] [CrossRef]
  43. Photovoltaic Geographical Information System (PVGIS). Version 5.2. 2017. Available online: https://re.jrc.ec.europa.eu/pvg_tools/en/#MR (accessed on 3 July 2025).
  44. Alshamri, H.; Cockerill, T.; Tomlin, A.S.; Al-Damook, M.; Al Qubeissi, M. On–off-Grid Optimal Hybrid Renewable Energy Systems for House Units in Iraq. Clean Technol. 2024, 6, 602–624. [Google Scholar] [CrossRef]
  45. Hettesheimer, T.; Neef, C.; Rosellón Inclán, I.; Link, S.; Schmaltz, T.; Schuckert, F.; Stephan, A.; Stephan, M.; Thielmann, A.; Weymann, L.; et al. Lithium-Ion Battery Roadmap—Industrialization Perspectives Toward 2030; Fraunhofer Institute for Systems and Innovation Research ISI: Karlsruhe, Germany, 2023. [Google Scholar] [CrossRef]
  46. Marocco, P.; Gandiglio, M.; Cianella, R.; Capra, M.; Santarelli, M. Design of hydrogen production systems powered by solar and wind energy: An insight into the optimal size ratios. Energy Convers. Manag. 2024, 314, 118646. [Google Scholar] [CrossRef]
  47. Klell, M. Storage of Hydrogen in the Pure Form. In Handbook of Hydrogen Storage: New Materials for Future Energy Storage; Hirscher, M., Ed.; Wiley-VCH Verlag GmbH & Co.: Weinheim, Germany, 2010; pp. 1–37. [Google Scholar] [CrossRef]
  48. Zheng, Y.; Huang, C.; Tan, J.; You, S.; Zong, Y.; Træholt, C. Off-grid wind/hydrogen systems with multi-electrolyzers: Optimized operational strategies. Energy Convers. Manag. 2023, 295, 117622. [Google Scholar] [CrossRef]
  49. U.S. Department of Energy. Pathways to Commercial Liftoff: Clean Hydrogen; U.S. Department of Energy: Washington, DC, USA, 2024.
  50. Seeger, K.; Genovese, M.; Schlüter, A.; Kockel, C.; Corigliano, O.; Díaz Canales, E.B.; Praktiknjo, A.; Fragiacomo, P. Techno-economic analysis of hydrogen and green fuels supply scenarios assessing three import routes: Canada, Chile, and Algeria to Germany. Int. J. Hydrogen Energy 2025, 116, 558–576. [Google Scholar] [CrossRef]
  51. Caponi, R.; Bocci, E.; Del Zotto, L. On-site hydrogen refuelling station techno-economic model for a fleet of fuel cell buses. Int. J. Hydrogen Energy 2024, 71, 691–700. [Google Scholar] [CrossRef]
  52. Pivetta, D.; Dall’armi, C.; Taccani, R. Multi-Objective Optimization of a Hydrogen Hub for the Decarbonization of a Port Industrial Area. J. Mar. Sci. Eng. 2022, 10, 231. [Google Scholar] [CrossRef]
  53. Franco, A.; Giovannini, C. Hydrogen Gas Compression for Efficient Storage: Balancing Energy and Increasing Density. Hydrogen 2024, 5, 293–311. [Google Scholar] [CrossRef]
  54. Caponi, R.; Vizza, D.; Bassano, C.; Del Zotto, L.; Bocci, E. Dynamic Comparative Assessment of Long-Term Simulation Strategies for an Off-Grid PV–AEM Electrolyzer System. Energies 2025, 18, 4209. [Google Scholar] [CrossRef]
  55. Röck, M.; Martin, R.; Hausberger, S. JEC Tank-to-Wheels Report v5: Heavy Duty Vehicles; European Commission: Brussel, Belgium, 2020. [CrossRef]
  56. Basma, H.; Rodríguez, F. Fuel cell electric tractor-trailers: Technology overview and fuel economy. In International Council on Clean Transportation Working Paper; International Council on Clean Transportation: Washington, DC, USA, 2022; Volume Working Paper 23. [Google Scholar]
  57. Hjelkrem, O.A.; Arnesen, P.; Bø, T.A.; Sondell, R.S. Estimation of tank-to-wheel efficiency functions based on type approval data. Appl. Energy 2020, 276, 115463. [Google Scholar] [CrossRef]
  58. European Commission. Weekly Oil Bulletin. Available online: https://energy.ec.europa.eu/data-and-analysis/weekly-oil-bulletin_en?utm_source=chatgpt.com (accessed on 3 September 2025).
  59. Penev, M.; Gilbert, A.; Rustagi, N.; Kee, J.; Koleva, M.; Chung, M. Capital Structure for Techno-Economic Analysis of Hydrogen Projects; National Renewable Energy Laboratory (NREL): Golden, CO, USA, 2024. Available online: https://www.nrel.gov/docs/fy24osti/90103.pdf (accessed on 3 September 2025).
Figure 1. Hydrogen production and refueling station scheme.
Hydrogen 06 00098 g001
Figure 2. Daily hydrogen demand profile for a bus fleet, developed on the basis of the distribution reported in [40].
Hydrogen 06 00098 g002
Figure 4. L C O H f l e e t as a function of electrolyzer capacity, showing the absolute minimum determined by the GA in red.
Hydrogen 06 00098 g004
Figure 5. PV generation profile for an 11 MWp plant, compared with the electricity demand of 4 MW electrolyzers.
Hydrogen 06 00098 g005
Figure 6. Weekly hydrogen excess with respect to the fuel cell bus fleet demand.
Hydrogen 06 00098 g006
Figure 7. Hourly stored-hydrogen profile over the study year, highlighting seasonal behavior.
Hydrogen 06 00098 g007
Figure 8. Breakdown of the capital investment costs for the optimal configuration that provides the minimum LCOH.
Hydrogen 06 00098 g008
Table 1. Techno-economic parameters for solar PV investigated in this study.
RE
Supply
CAPEX (€/kW)
[42]
OPEX (€/kW/Year)
[42]
Lifetime (Year)
[31]
Parameter Settings
[42,43]
Solar PV7002% total CAPEX20single-axis tracking, system loss 10%, PV degradation 0.3% after first year
Table 2. Techno-economic parameters for BESS investigated in this study.
ParametersUnitValueRef.
C-rate-2[44]
CAPEX€/kWh140[45]
OPEX€/kWh/year2% CAPEX[46]
REPLEX€/kWh50% CAPEX[46]
Lifetimeyears10[46]
Table 3. Techno-economic parameters for PEM electrolyzer system investigated in this study.
ParametersUnitValueRef.
Specific energy consumptionkWh/Nm3 (5–30%)
kWh/Nm3 (30–60%)
kWh/Nm3 (60–100%)
4.9
5.5
4.8
[48]
Dynamic working load range% of rated power5–100%[46]
CAPEX€/kW1200[49]
OPEX€/kW/year3% CAPEX[46]
REPLEX€/kW45% CAPEX[42]
Lifetime of the stackhours80,000[50]
Table 4. Techno-economic parameters for the compressed hydrogen storage system investigated in this study.
ParametersUnitValueRef.
Storage pressurebar500[51]
CAPEX€/kg900[51]
OPEX€/year0.5% CAPEX[51]
Lifetimeyears20[52]
Table 5. Techno-economic parameters for the compression system analyzed in this study.
ParametersUnitValueRef.
Suction/final pressionbar30/500[51]
Intercooling temperatureK288[51]
Compressor efficiency%80[31]
Energy consumption averagekWh/kgH21.35[53]
CAPEX€/kg43,872·(Wc)0.5861[51]
OPEX€/year3% CAPEX[31]
Lifetimeyears20[21]
Table 6. Techno-economic results for the optimal configuration defined by the genetic algorithm.
ParametersUnitResults
PV nominal powerMWp11
Electrolyzer nominal powerMW4
Battery capacity MWh7
Storage capacitykg2900
Total H2 production kg/year251,607
Total H2 excess kg/year69,107
CAPEXM€16.72
CAPEXa€/year1,458,519.58
OPEX €/year330,258.38
REPLEXM€4.51
REPLEXa€/year219,783.76
L C O H f l e e t €/kg11.00
LCOH€/kg7.98
Disclaimer/Publisher’s Note: The statements, opinions and data contained in all publications are solely those of the individual author(s) and contributor(s) and not of MDPI and/or the editor(s). MDPI and/or the editor(s) disclaim responsibility for any injury to people or property resulting from any ideas, methods, instructions or products referred to in the content.