Abstract
With the global expansion of hydrogen infrastructure, the safe and efficient transportation of hydrogen is becoming more important. In this study, several technical factors, including material degradation, pressure variations, and monitoring effectiveness, that influence hydrogen transportation using pipelines are examined using system dynamics. The results show that hydrogen embrittlement, which is the result of microstructural trapping and limited diffusion in certain steels, can have a profound effect on pipeline integrity. Material incompatibility and pressure fluctuations deepen fatigue damage and leakage risk. Moreover, pipeline monitoring inefficiency, combined with hydrogen’s high flammability and diffusivity, can raise serious safety issues. An 80% decrease in monitoring efficiency will result in a 52% reduction in the total hydrogen provided to the end users. On the other hand, technical risks such as pressure fluctuations and material weakening from hydrogen embrittlement also affect overall system performance. It is essential to understand that real-time detection using hydrogen monitoring is particularly important and will lower the risk of leakage. It is crucial to know where hydrogen is lost and how it impacts transport efficiency. The model offers practical insights for developing stronger and more reliable hydrogen transport systems, thereby supporting the transition to a low-carbon energy future.
1. Introduction
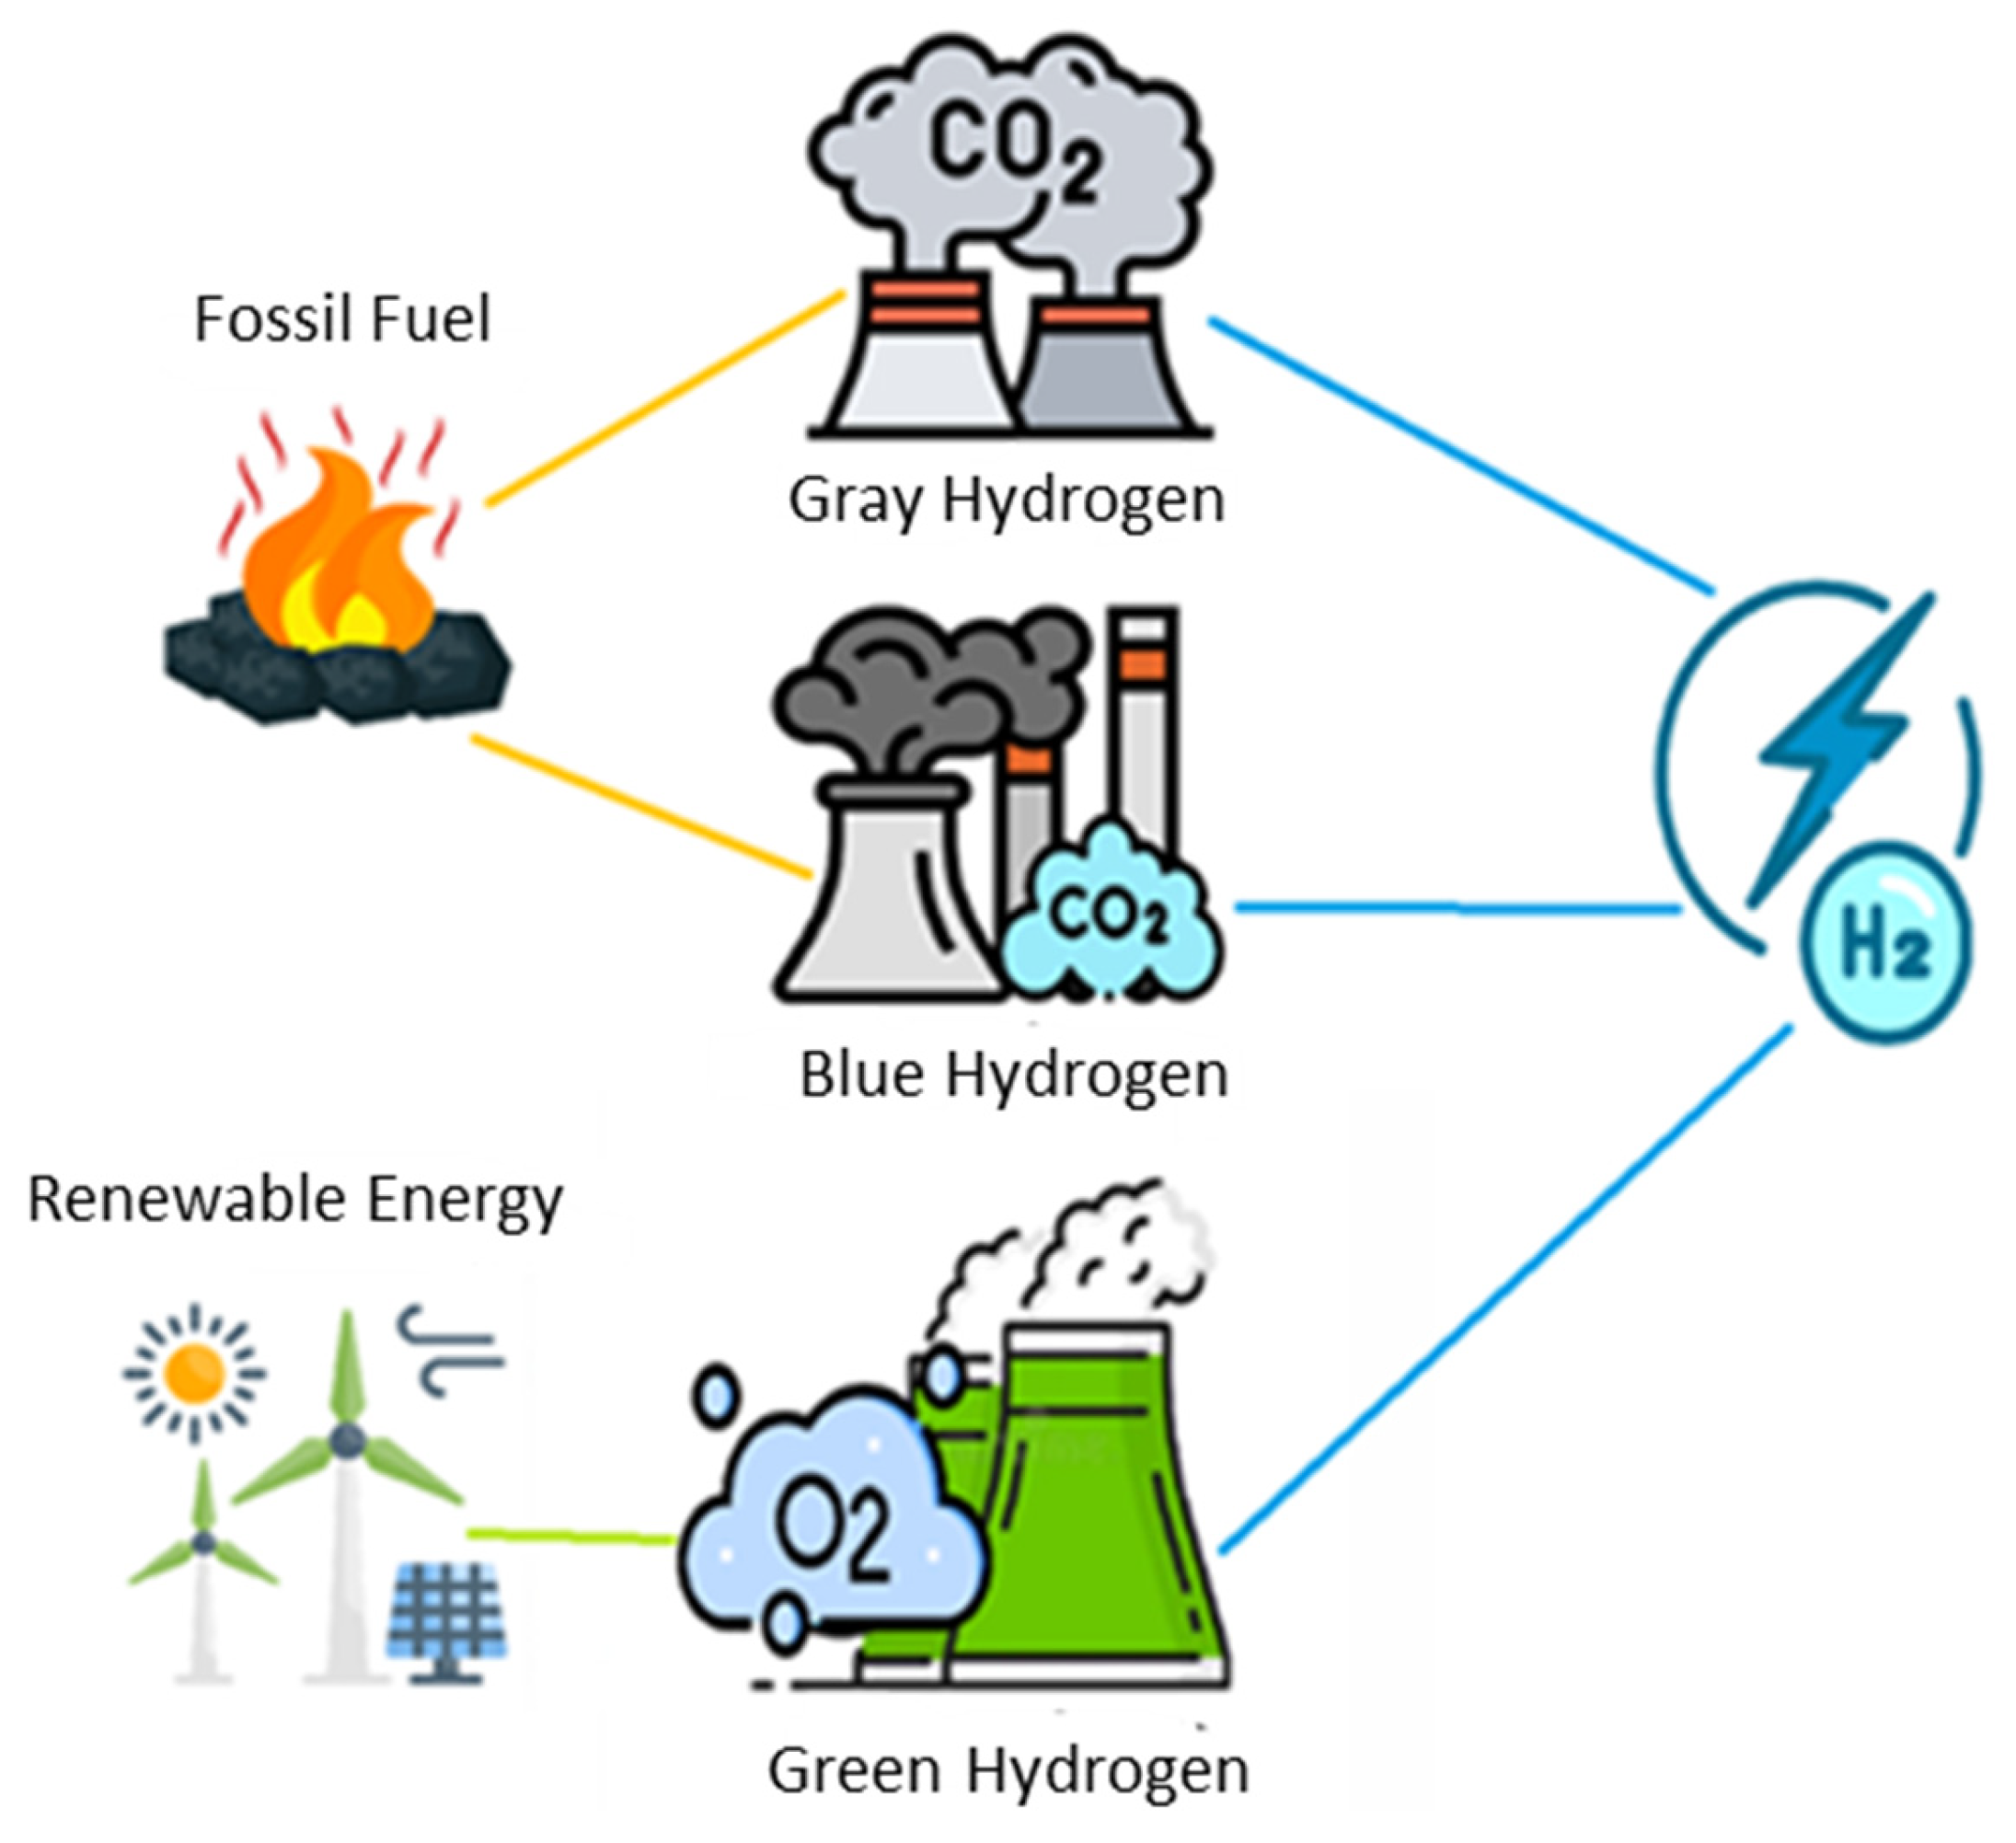
Hydrogen, as an important global factor to help with the path toward net zero emissions, serves as a sustainable energy source with the capacity to reduce carbon emissions in key sectors such as electricity, transportation, and industry. With its contribution to energy storage, grid stability, and decarbonization, hydrogen has gained attention as a significant element in the shift toward sustainable and renewable energy systems [1]. Hydrogen is a chemical element that is the most plentiful in our world, lightweight, and produces only water when used as fuel. It can be used as an alternative to fossil fuels due to its ease of storage and transportation [2]. There are various ways of producing hydrogen, which are designated as grey, blue, or green labels based on how it is generated and the type of energy used in its production process. Green hydrogen from electrolysis accounts for only about 4% of production; therefore, grey hydrogen is not considered low-carbon [3]. The distinct types of hydrogen fuel classifications are illustrated in Figure 1.
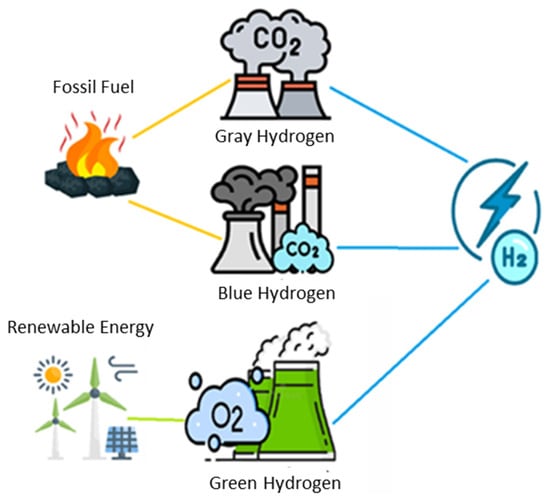
Figure 1.
Hydrogen fuel classifications.
The following sections examine various techniques employed in hydrogen production [4].
Grey hydrogen is produced from fossil fuels, such as natural gas, without capturing the carbon emissions released during the process. It is the most commonly available and widely used form of hydrogen today.
Blue hydrogen is created through the same method as grey hydrogen, but with carbon capture and storage technologies applied to reduce emissions.
Green hydrogen is considered the cleanest and most sustainable option, produced using renewable energy sources such as wind or solar power.
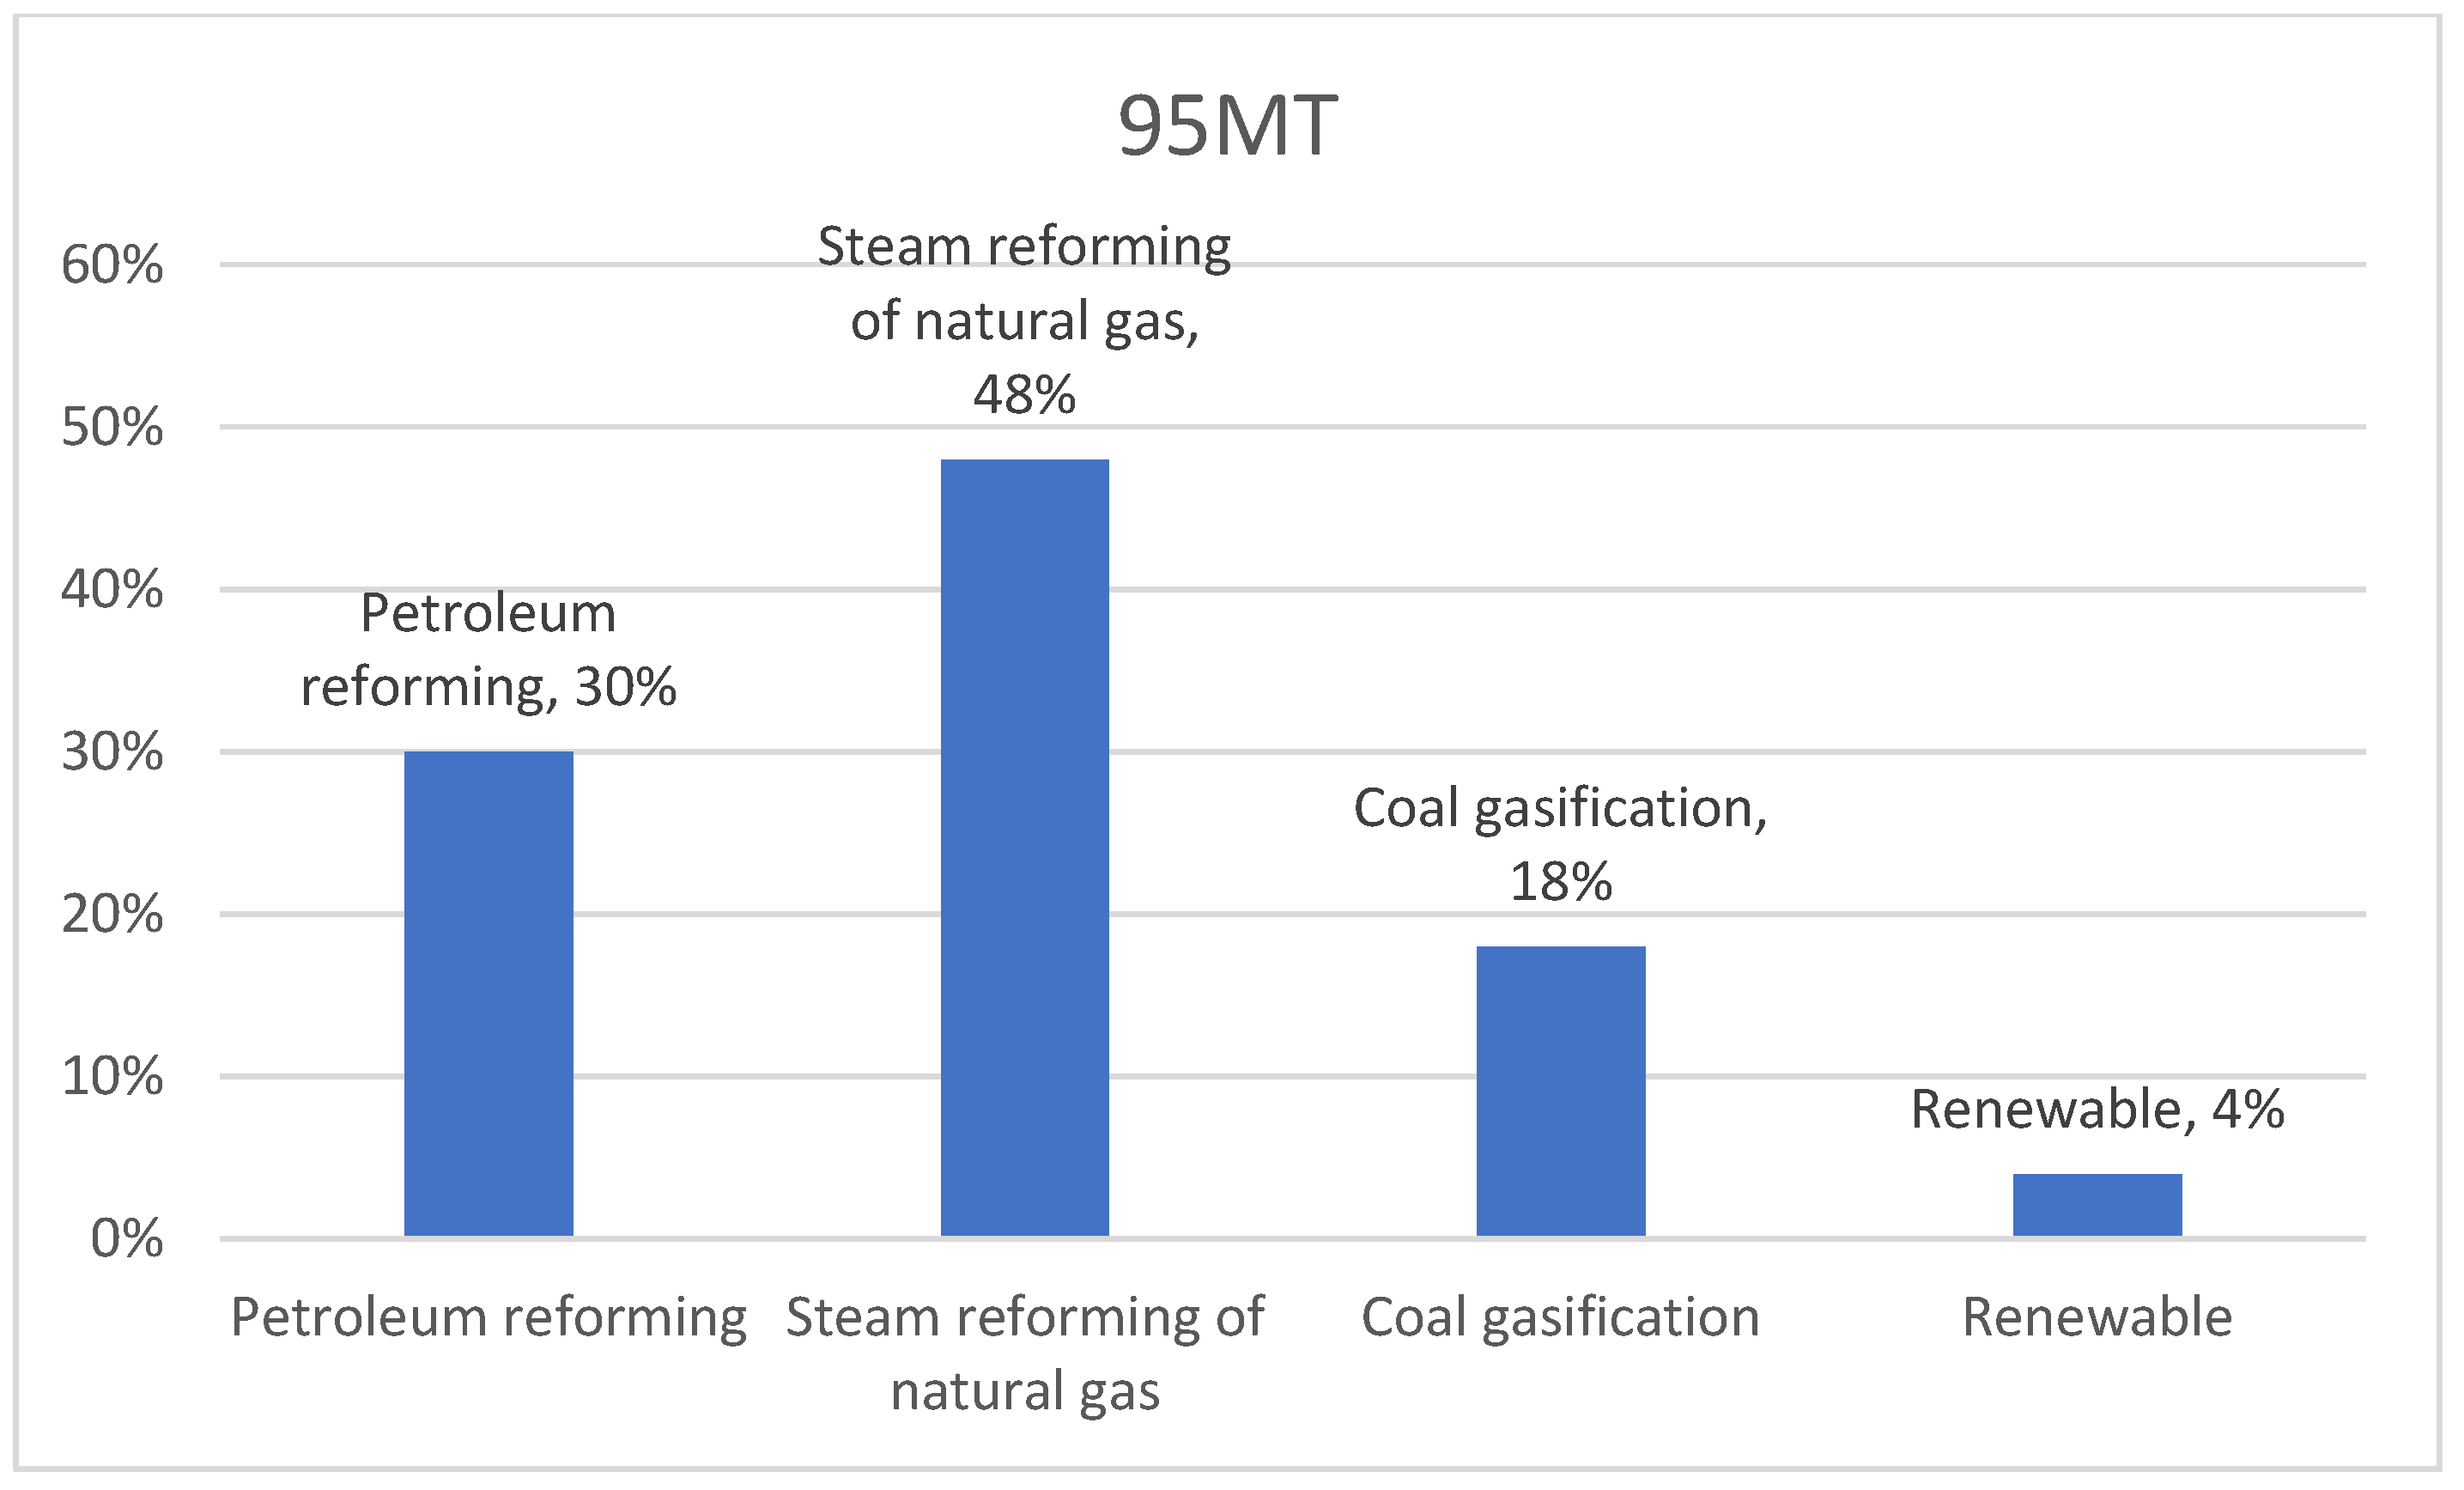
Hydrogen production is primarily dominated by non-renewable methods, including steam reforming of natural gas (48%), petroleum reforming (30%), and coal gasification (18%). In contrast, renewable sources such as water electrolysis contribute only about 4% of the global hydrogen supply, as shown in Figure 2 [3]. However, if all announced projects proceed, low-emission hydrogen production could increase to 49 million tonnes per year by 2030. Meanwhile, installed water electrolyser capacity hit 1.4 GW by the end of 2023 [5].
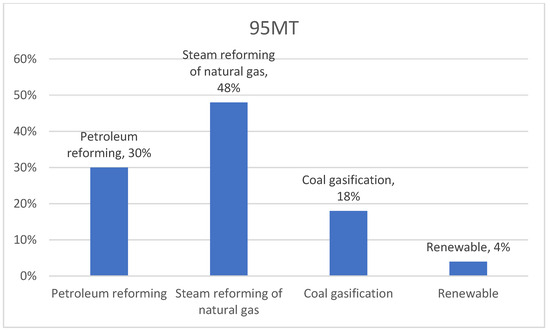
Figure 2.
Global Hydrogen Production by Source Type drawn by author and based on data from [3].
Hydrogen is currently delivered either through pipelines or by road using cryogenic liquid tankers and high-pressure gas trailers. Pipeline transport is typically used in areas with consistently high and long-term demand. When a natural gas pipeline is converted for hydrogen use, it can retain about 80–90% of its original energy transport capacity under the same operating conditions. Utilizing existing pipelines to transport gaseous hydrogen provides a cost-effective means of transporting large quantities [6]. However, the high upfront investment required for building new pipelines remains a significant obstacle to expanding hydrogen delivery infrastructure.
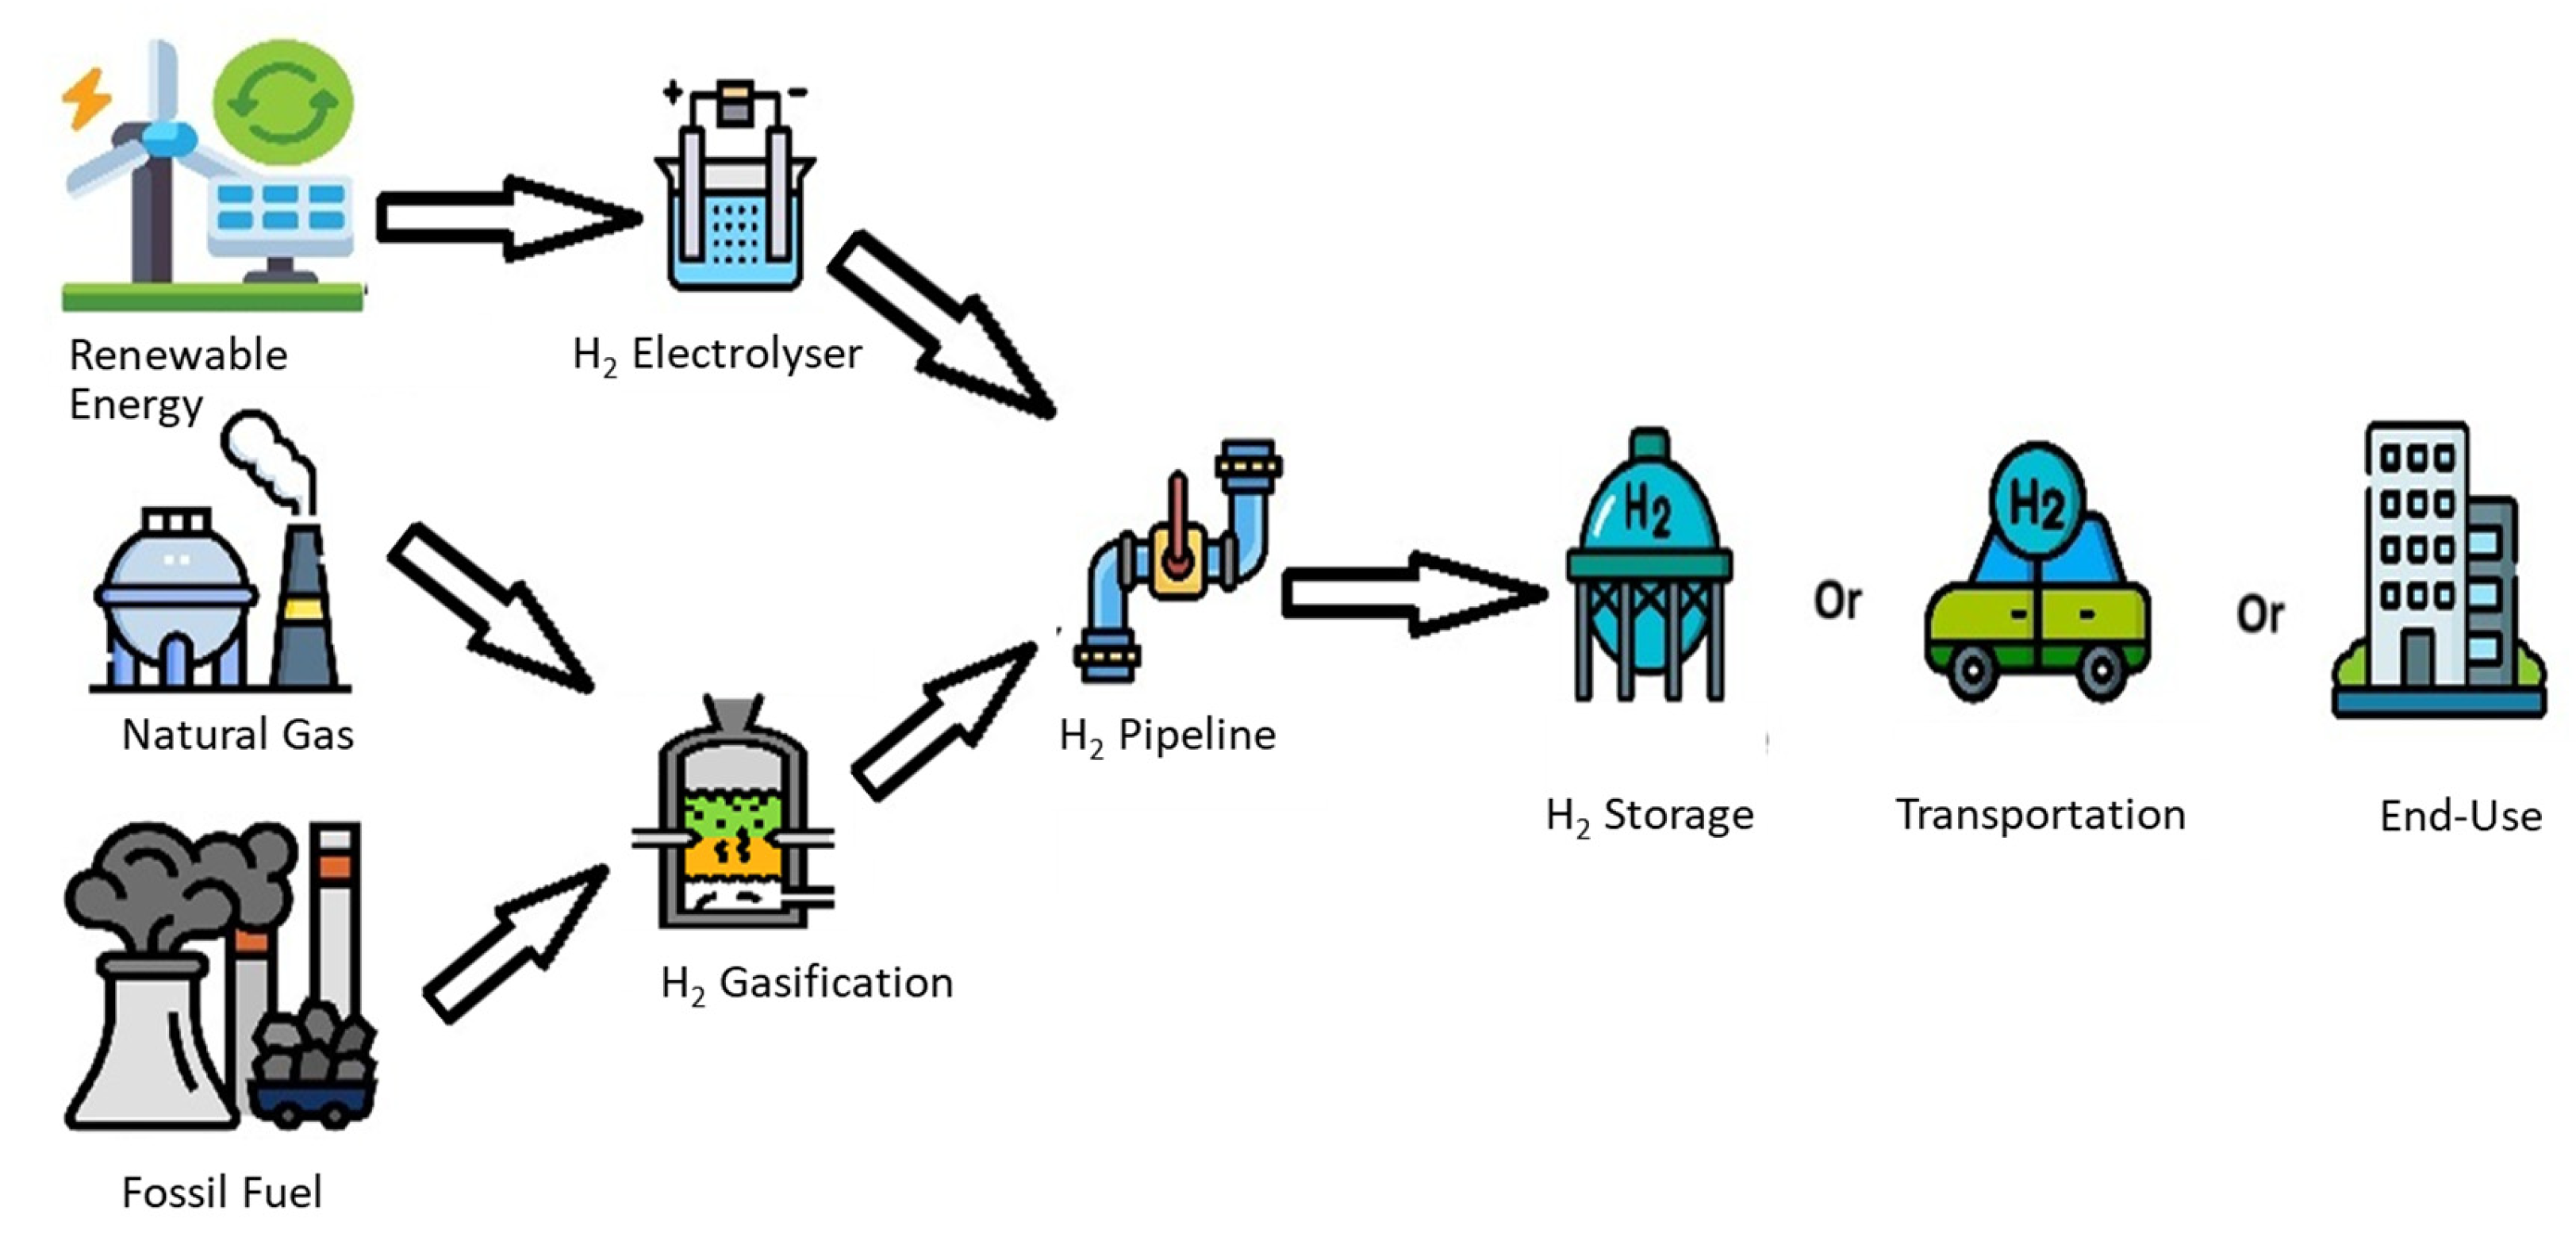
Currently, around 99% of hydrogen is produced using fossil fuels, where 76% is from natural gas and 23% from coal. Only a small fraction comes from biomass and water electrolysis [7]. Figure 3 shows the hydrogen production process. The figure shows that after hydrogen production, the gas will be transported for consumption using pipelines. Pipeline transportation provides a continuous flow, reducing the need for large storage facilities.
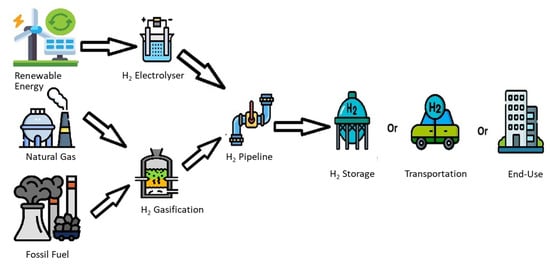
Figure 3.
Hydrogen Production Process drawn by the author.
In this article, the system dynamics method is employed to examine the potential risks associated with hydrogen transportation through pipelines. System dynamics’ ability to track how system behaviour changes over time is what makes system dynamics in hydrogen transportation risk assessment important and profitable. It differs from traditional methods, such as Quantitative Risk Assessment (QRA), which only provide a linear view of risk based on historical data. System dynamics handles the transportation system as a dynamic structure. It is helpful to understand how different parts of the system interact and how time delays and feedback loops can impact safety. This approach provides a more realistic and comprehensive picture of how technical failures evolve and how they can be managed more effectively to achieve the desired long-term outcomes.
2. Risk Review
The widespread use of hydrogen faces a range of technical and market-related challenges that must be considered. This section reviews past studies that have examined the risks associated with hydrogen pipelines. Table 1 highlights a range of research efforts focused on identifying and evaluating various hazards linked to hydrogen transport infrastructure.

Table 1.
Examples of hydrogen transportation risk review papers.
Safety Strategies for Transport
Risk management focuses on preventing accidents and protecting the environment and people by adhering to industry standards and regulations. Hydrogen transportation begins by transporting hydrogen from production facilities to the end user as a sustainable and clean energy source. Utilizing natural gas infrastructure is an efficient method for transmitting fluid, and the gas systems can serve as a model. The hydrogen networks, designed for high-pressure gas flow, range in diameter from approximately 0.15 to 1.42 m and can operate at pressures above 49.3 bar [23]. Nowadays, the majority of the global hydrogen pipeline network spans are in the United States and Europe, with a total length of approximately 4700 km [24].
Hydrogen in a gas, liquid, or combined with carriers like ammonia or liquid organic hydrogen carrier (LOHC) state is moved using pipelines, trucks, and ships. [25]. Choosing the proper transport method is vital to the hydrogen economy, with options including pipelines, natural gas blending, and cryogenic tankers [26]. Due to its extremely low density, hydrogen behaves differently from other gases during pipeline transport, often causing noticeable disruptions in the flow dynamics. These disturbances can affect pressure stability, flow rate, and overall system efficiency, making it essential to carefully model and manage hydrogen flow in pipeline networks [27].
Hydrogen pipelines often use mid-strength steel, as higher-strength steels are more prone to hydrogen embrittlement, where hydrogen weakens the material, potentially leading to premature failure. Since hydrogen is highly flammable, such failures pose serious safety risks [28]. At the same time, hydrogen offers clear environmental advantages; however, its distinct characteristics also present safety concerns. Its invisibility, lack of smell, and high flammability make leak detection and ignition prevention challenges. Pressurized storage increases the risk of explosion if mishandled, and its tendency to weaken metals, known as hydrogen embrittlement, adds another layer of risk to its use [29].
Despite decades of experience and ongoing advancements in hydrogen pipeline systems, several challenges persist. The complexities surrounding pipeline use involve multiple critical issues:
- Exposure to hydrogen gas can cause embrittlement in a wide range of metallic materials. Materials such as steels, stainless steels, and nickel-based alloys are more prone to this type of failure. There are several ways in which hydrogen embrittlement in pipelines can appear, including hydrogen-induced cracking, hydrogen blistering, and degradation of mechanical properties [8].
- When a metal cracks because it is under stress and exposed to a corrosive atmosphere all at once, Stress corrosion cracking (SCC) happens. Outside forces or the metal shape can cause this stress [30].
- Hydrogen-Assisted Cracking (HAC) is a popular form of collapse that includes various forms of hydrogen-related material failure, such as delayed fractures, decreased ductility, sub-critical crack growth, and fatigue-induced cracking.
- ○
- When the steel cracks without external stress being exerted, it is called Hydrogen-Induced Cracking (HIC), which is a specific type of hydrogen-assisted failure. A high concentration of hydrogen leads to hydrogen atoms penetrating the structure, causing failure over time [31].
- ○
- When the steel is under constant stress in a sulfide atmosphere, the metal failure is called Sulfide stress cracking (SSC), which is a type of hydrogen-assisted cracking. The steel cracks are caused by hydrogen that builds up on the metal’s surface and enters the steel. This is caused by sulfide ions preventing hydrogen atoms from combining to form molecules.
- ○
- Stress-oriented hydrogen-induced cracking (SOHIC) occurs when hydrogen-induced cracks form along the stress direction due to hydrogen embrittlement. This also increases dislocation and deforms the ferrite structure.
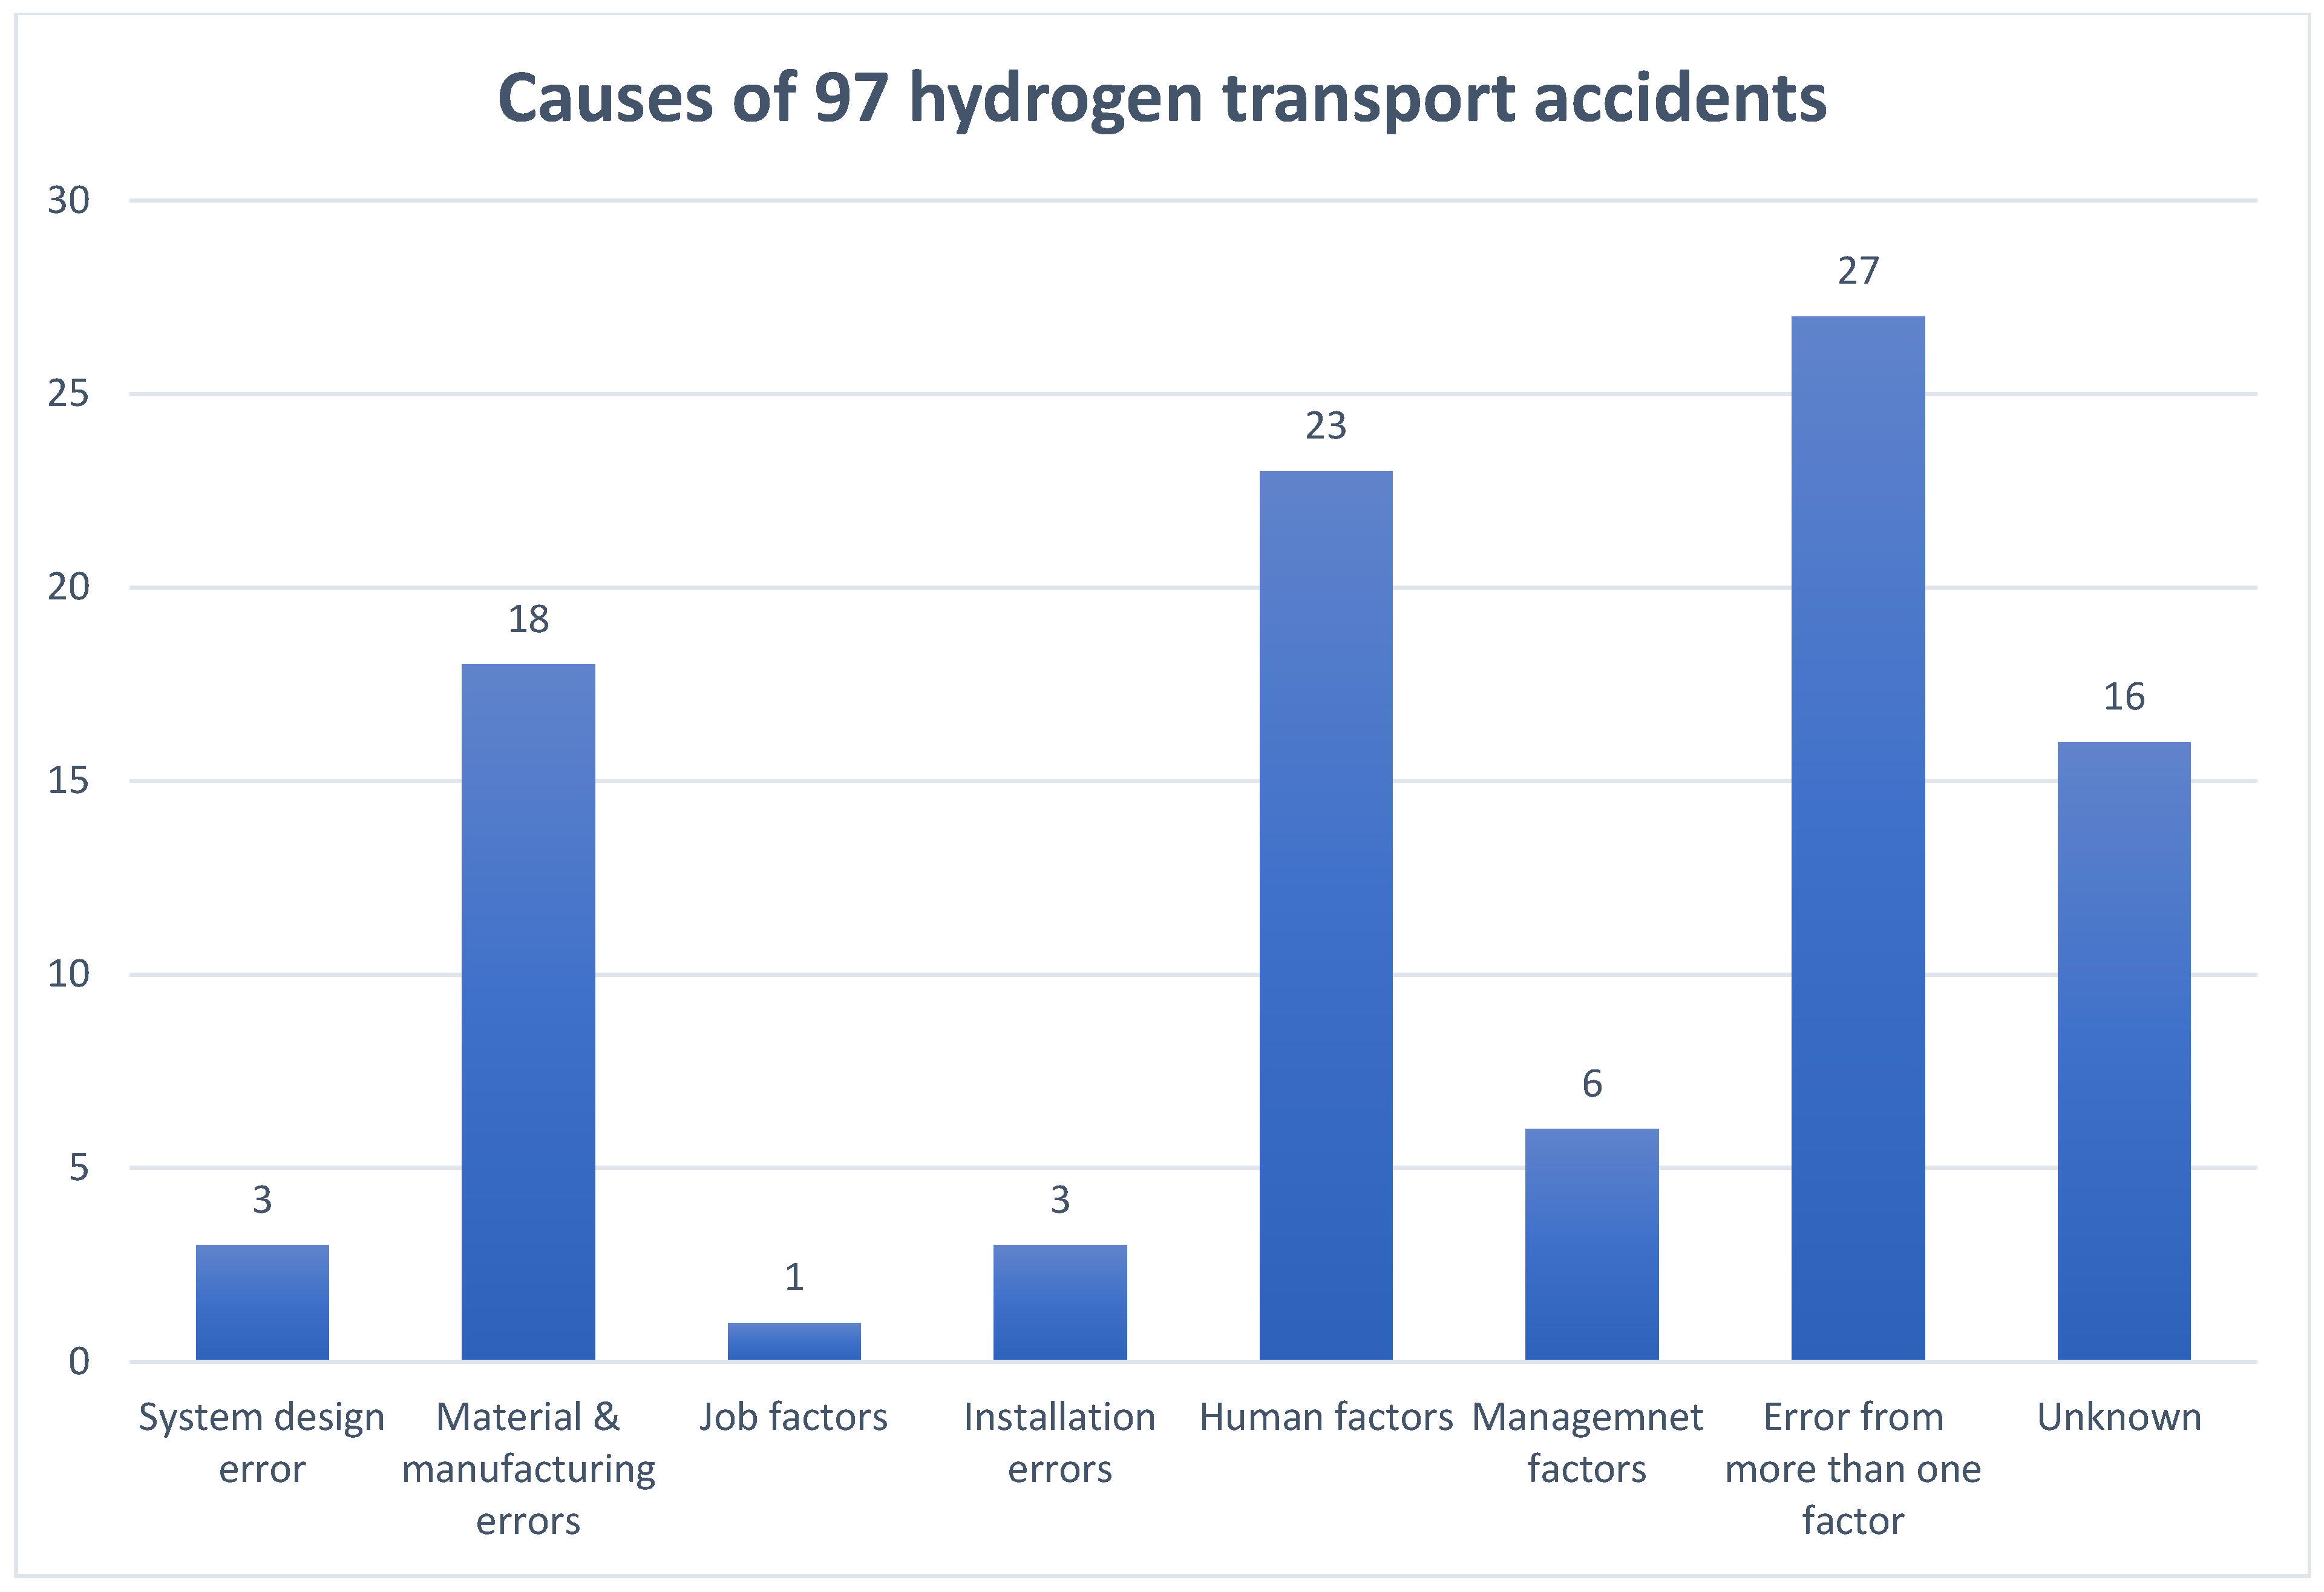
Transporting and supplying hydrogen is key to a clean energy future, but safety risks must be carefully managed to support its safe use. The IEA states that pipelines are the most cost-effective method for transporting hydrogen over distances of up to 1500 km. For longer distances, using ammonia or LOHC is more cost-effective. Liquid hydrogen, transported under high pressure and low temperatures, allows for efficient bulk transport due to its reduced volume. Using existing pipelines to carry hydrogen-blended natural gas requires careful attention to material compatibility and optimal blending ratios. It is also crucial to assess safety risks, including leaks, buildup, fire, or explosion, and to review integrity practices and applicable standards. The Hydrogen Incident and Accidents Database documents 97 events linked to hydrogen transport, 72 of which involved trucks. Pipeline distribution was involved in 16 incidents, making up 17% of all reported cases. [32]. In some cases, a single factor, such as a design flaw, caused the accident, while 27 incidents involved multiple causes. For 16 of the 97 accidents, the cause remains unknown, as shown in Figure 4. Out of 97 accidents, fire was the most frequent result, reported in 30 cases. Hydrogen leaks without ignition occurred in 28 cases, while 20 incidents led to explosions. Additionally, 18 were near misses and 1 was a false alarm [32].
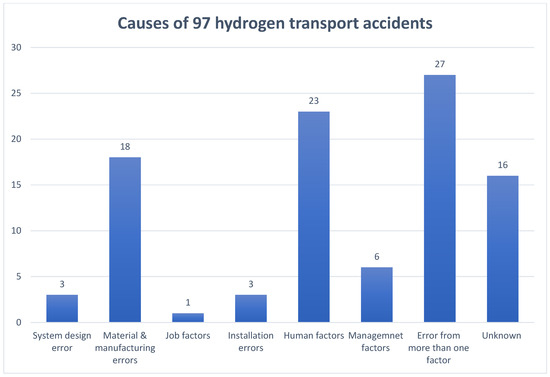
Figure 4.
Causes of 97 hydrogen transport accidents based on data from [32].
3. Methods
As hydrogen transport expands globally, significant improvements in storage and transportation technologies for both gaseous and liquid hydrogen are expected in the coming years. These innovations are expected to enhance safety and efficiency, thereby driving the shift toward cleaner, low-carbon energy systems [33].
This study employs a system dynamics (SD) approach to model the hydrogen transportation process, including key factors that affect its overall efficiency. System dynamics enables the simulation of how various elements interact over time, offering a better understanding of the system’s behavior. It is beneficial for identifying feedback loops, delays, and interdependencies that influence the hydrogen transport network, ultimately supporting smarter decisions and more effective strategies.
The method involves a step-by-step process:
- Defining the problem and system boundaries
- Identifying key variables and their roles (stocks and flows)
- Building causal loop and stock-flow diagrams
- Formulating equations and setting parameters
- Running simulations to explore different scenarios
- Refining the model and sharing results with stakeholders
The first step before developing the model is to define the problem extent. This will help address the problem range, focusing on how technical risks, such as pressure variations, hydrogen embrittlement, and monitoring efficiency, affect hydrogen loss and delivery in a hydrogen pipeline system. Important key variables are identified through a combination of literature review and expert consultation. Causal loop diagrams are then created to represent the interrelationships and feedback among these factors, which were subsequently translated into a stock-and-flow model to show accumulations and dynamic changes within the system. The model is then built, and relevant equations are given to the variables. The model is simulated using Vensim PLE software(PLE version). The model in this case assumes hydrogen loss results only from pipeline failures due to the chosen technical risk factors. It does not include external environmental effects. The simulation covered 100 weeks with a time step of a fraction of a week. Sensitivity analyses are conducted by varying one risk factor (variable) at a time to assess its sole impact on system results.
Hydrogen is valued for its clean combustion, high energy density, and versatility. While it is not naturally available in its pure form, it can be produced from renewable or non-renewable sources and is easily stored and transported via pipelines or electricity grids. Its ability to be reused after converting to water, along with its favorable cost-to-energy ratio, makes it a strong candidate for sustainable energy [34]. There are a few facilities that use their own generated hydrogen as a clean energy vector for electric equipment or heat production. For example, at Amazon’s Fulfillment Center in Aurora, Colorado, the compressed hydrogen generated through electrolysis is used as fuel for the site’s forklift trucks after being stored [35]. Additionally, the Denso Hirose Plant in Toyota, Japan, has been utilizing hydrogen produced on-site to supply energy for its prototype production processes [36].
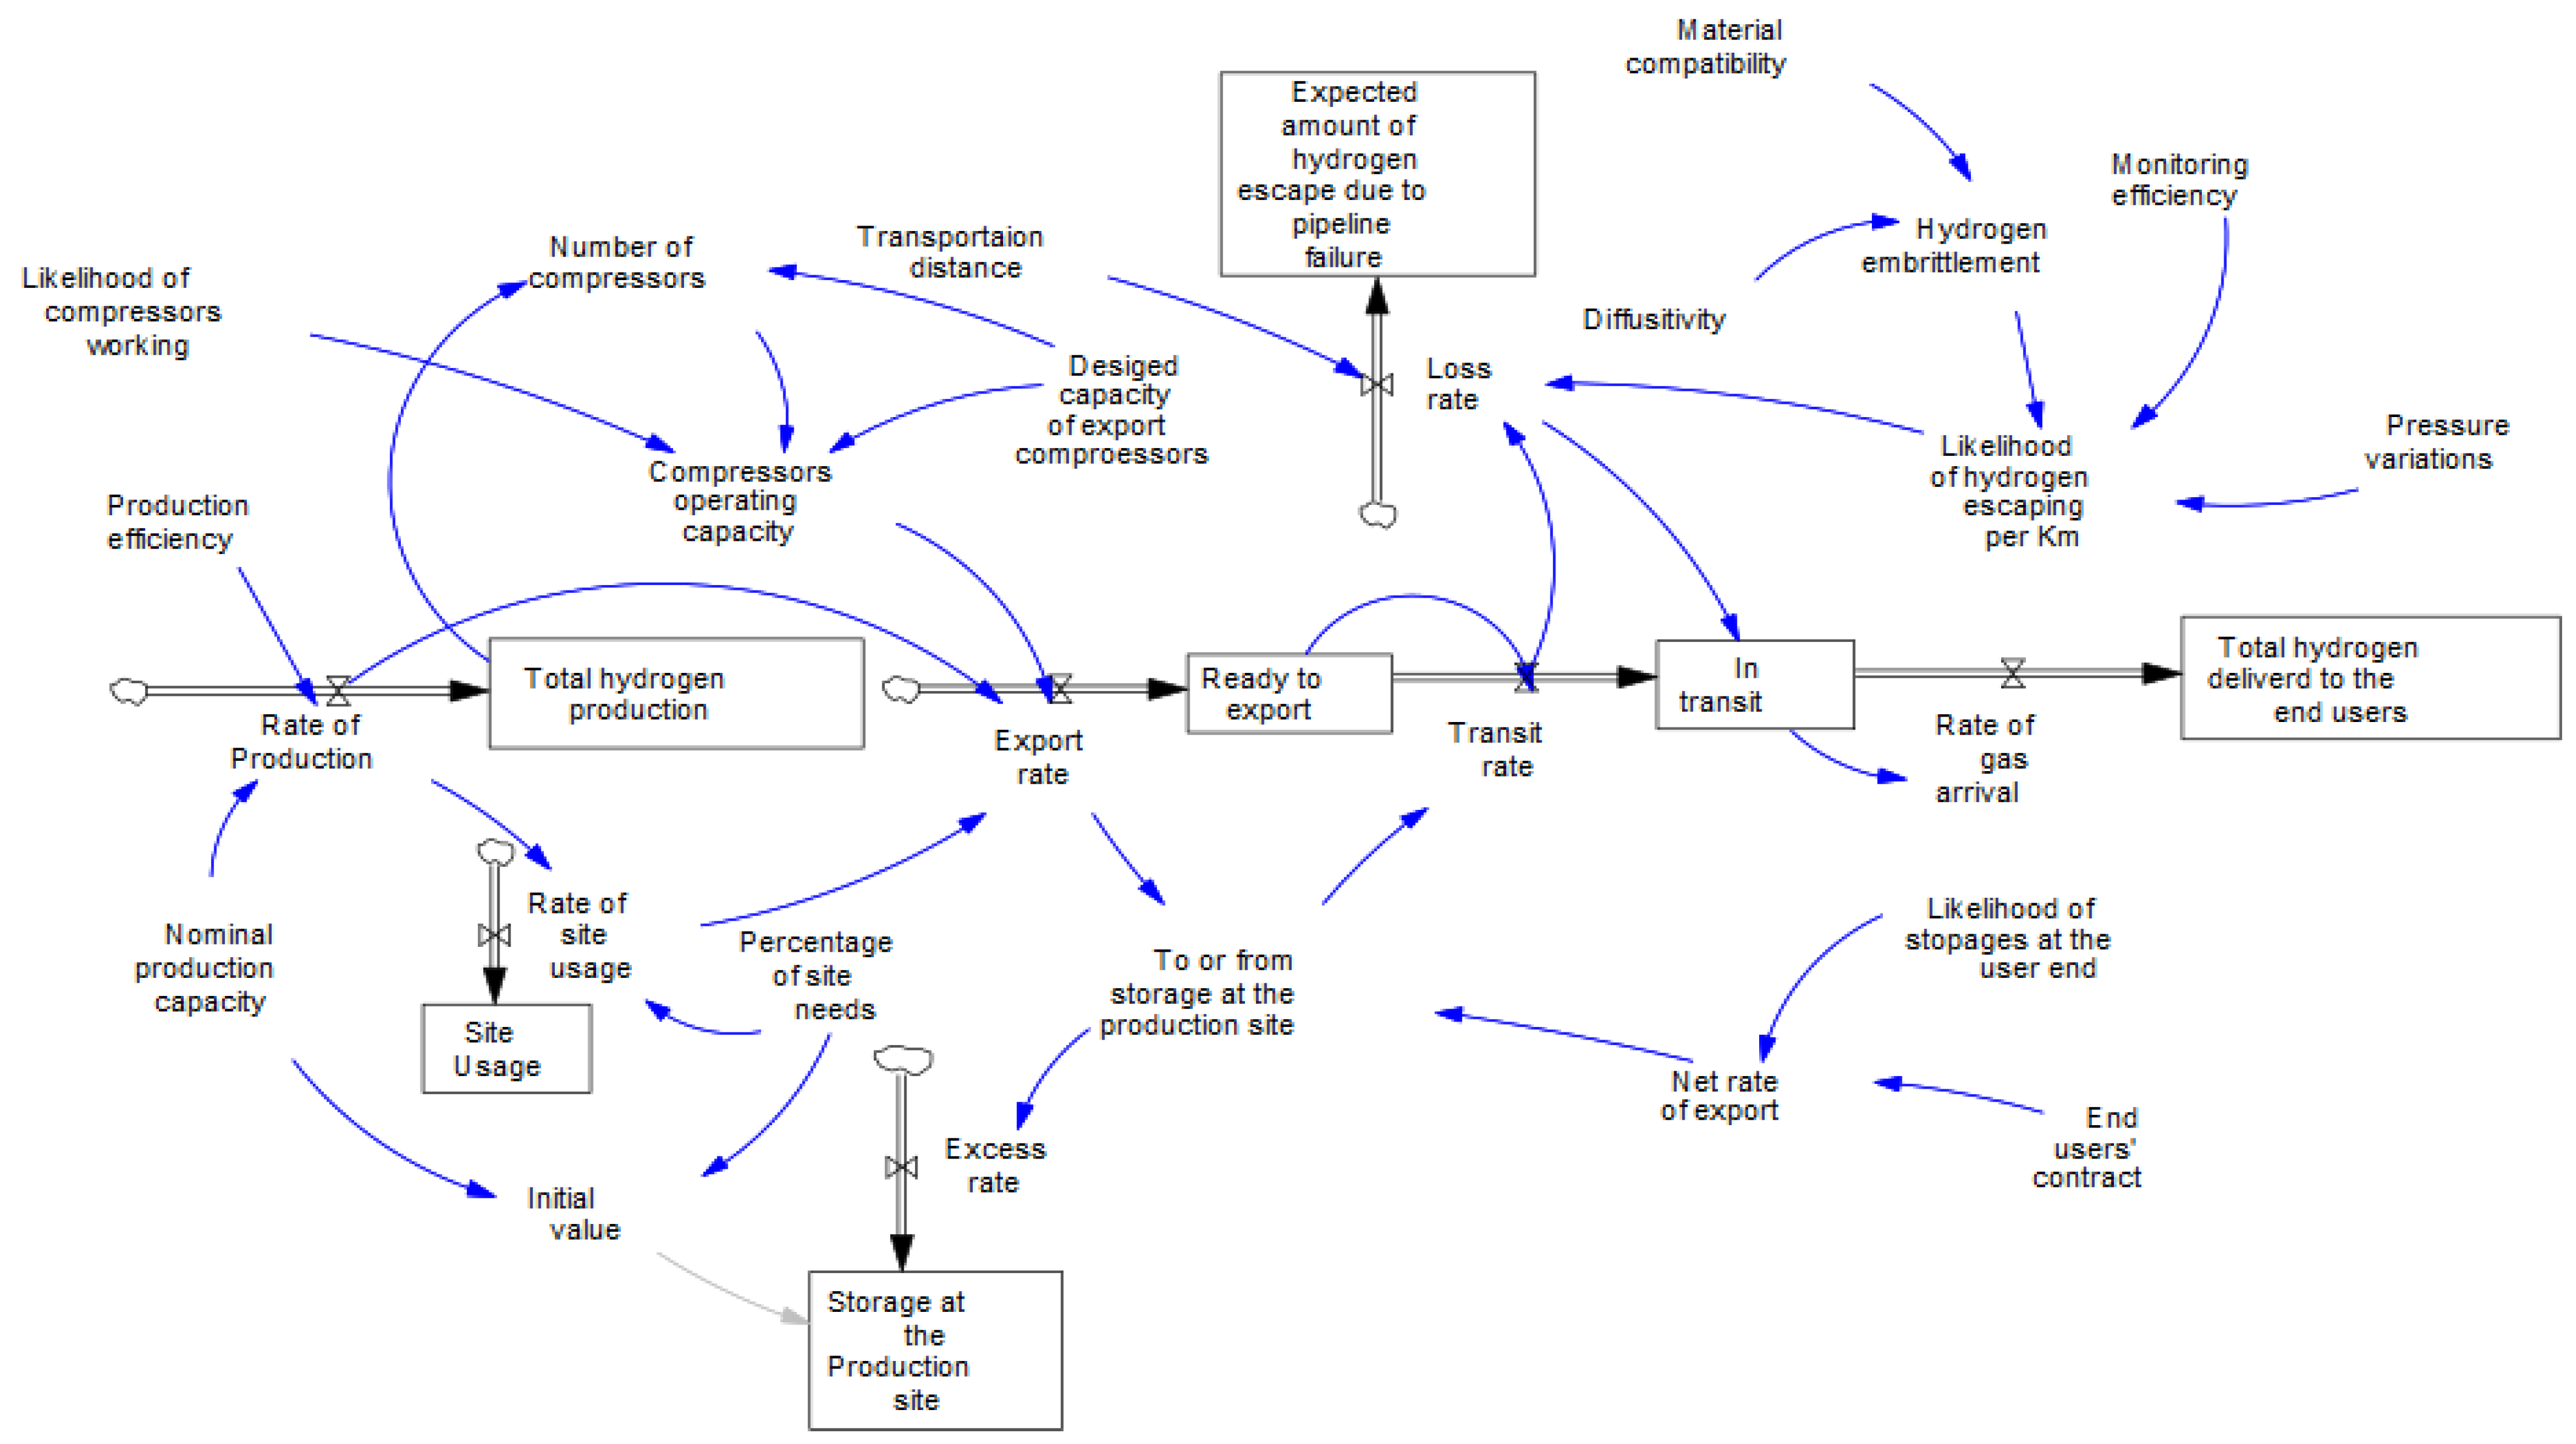
The goal of this study is to assess potential losses in hydrogen pipelines using system dynamics. This method facilitates understanding of pipeline loss mechanisms and enables evaluation of strategies to improve the system’s performance. The detailed model and simulation outcomes are illustrated in Figure 5. The model is validated using both expert input and available data. Since detailed data on hydrogen transport incidents is limited, experts helped define key parameters and system behavior. Where data was available, like incident rates or failure probabilities, it was used to adjust and test the model. This combined approach helped make the model both realistic and reliable. More information on the equations and values used for auxiliary variables and constant variables are provided in Appendix Table A1, Table A2 and Table A3.
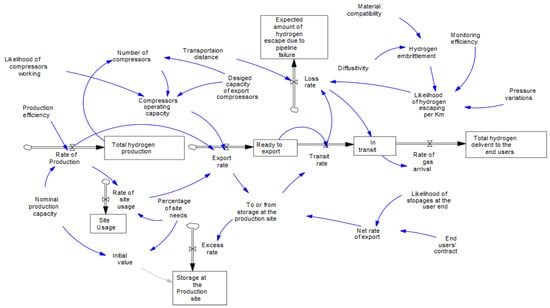
Figure 5.
System dynamics model of the transportation system and the factors influencing leakage rates.
Transporting hydrogen involves various risks. These risks include:
- Hydrogen Embrittlement
Hydrogen embrittlement occurs when hydrogen atoms enter the metal, causing it to weaken. The hydrogen will gradually spread through the metal, lowering the structure’s strength due to its high concentration. It typically gathers in areas with high internal stress. This causes the metal’s strength to decrease, making it more susceptible to failure under pressure [37].
- Fire and Explosion
When hydrogen leaks, it can be highly flammable and can ignite easily, increasing the risk of fires or explosions. With poorly maintained pipelines and tanks, transporting it under high pressure adds to its safety issues [16].
- High Diffusivity
Hydrogen entering the metal structure has become a key industrial concern. Hydrogen entering the steel due to its small size will cause a reduction in strength and failure. Its diffusion is affected by factors like grain size, dislocations, and material composition [38].
- Material Compatibility
It is essential to choose materials that are compatible with the surrounding environmental conditions for hydrogen transport. The primary focus will be on hydrogen embrittlement. It is a process where hydrogen penetrates the metal, reducing its strength, flexibility, and resistance to cracking [39].
- High Operating Pressure
High operating pressure accelerates the diffusion of hydrogen into the metal structure, which can also lead to hydrogen embrittlement and a decrease in the metal’s strength over time. This increase in vulnerability poses a significant challenge for the safe design and operation of hydrogen transport systems [9].
4. Results
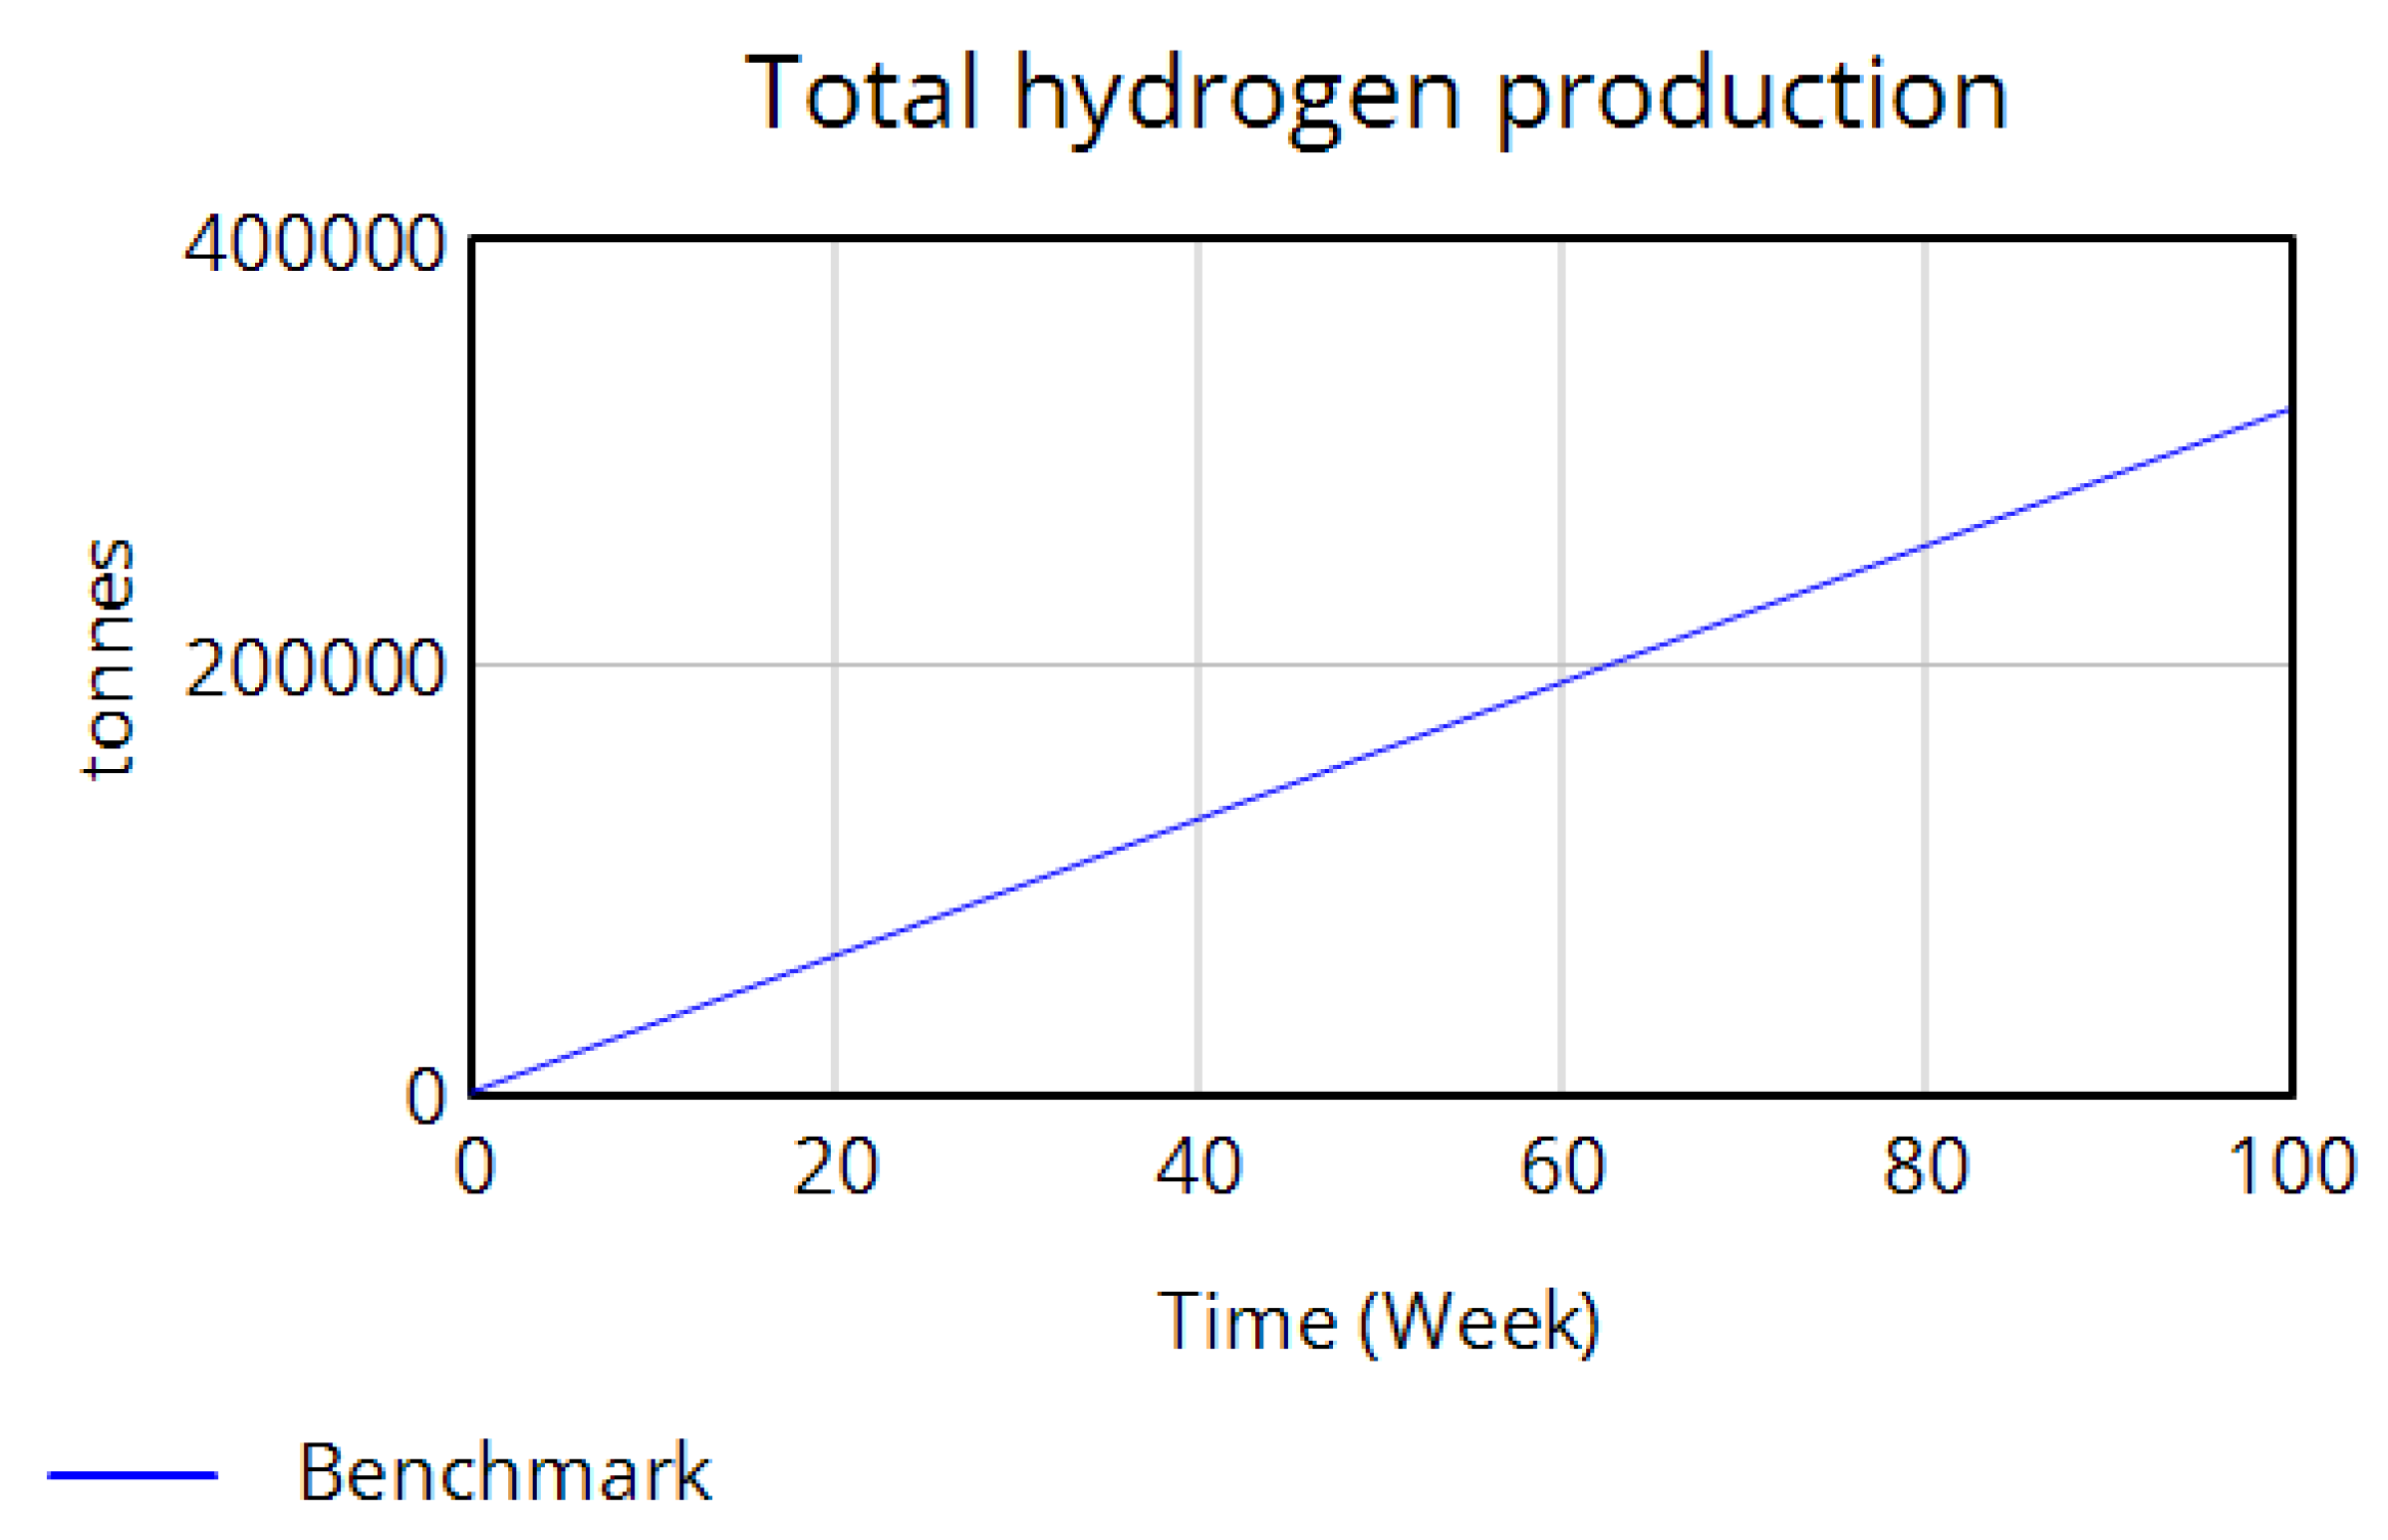
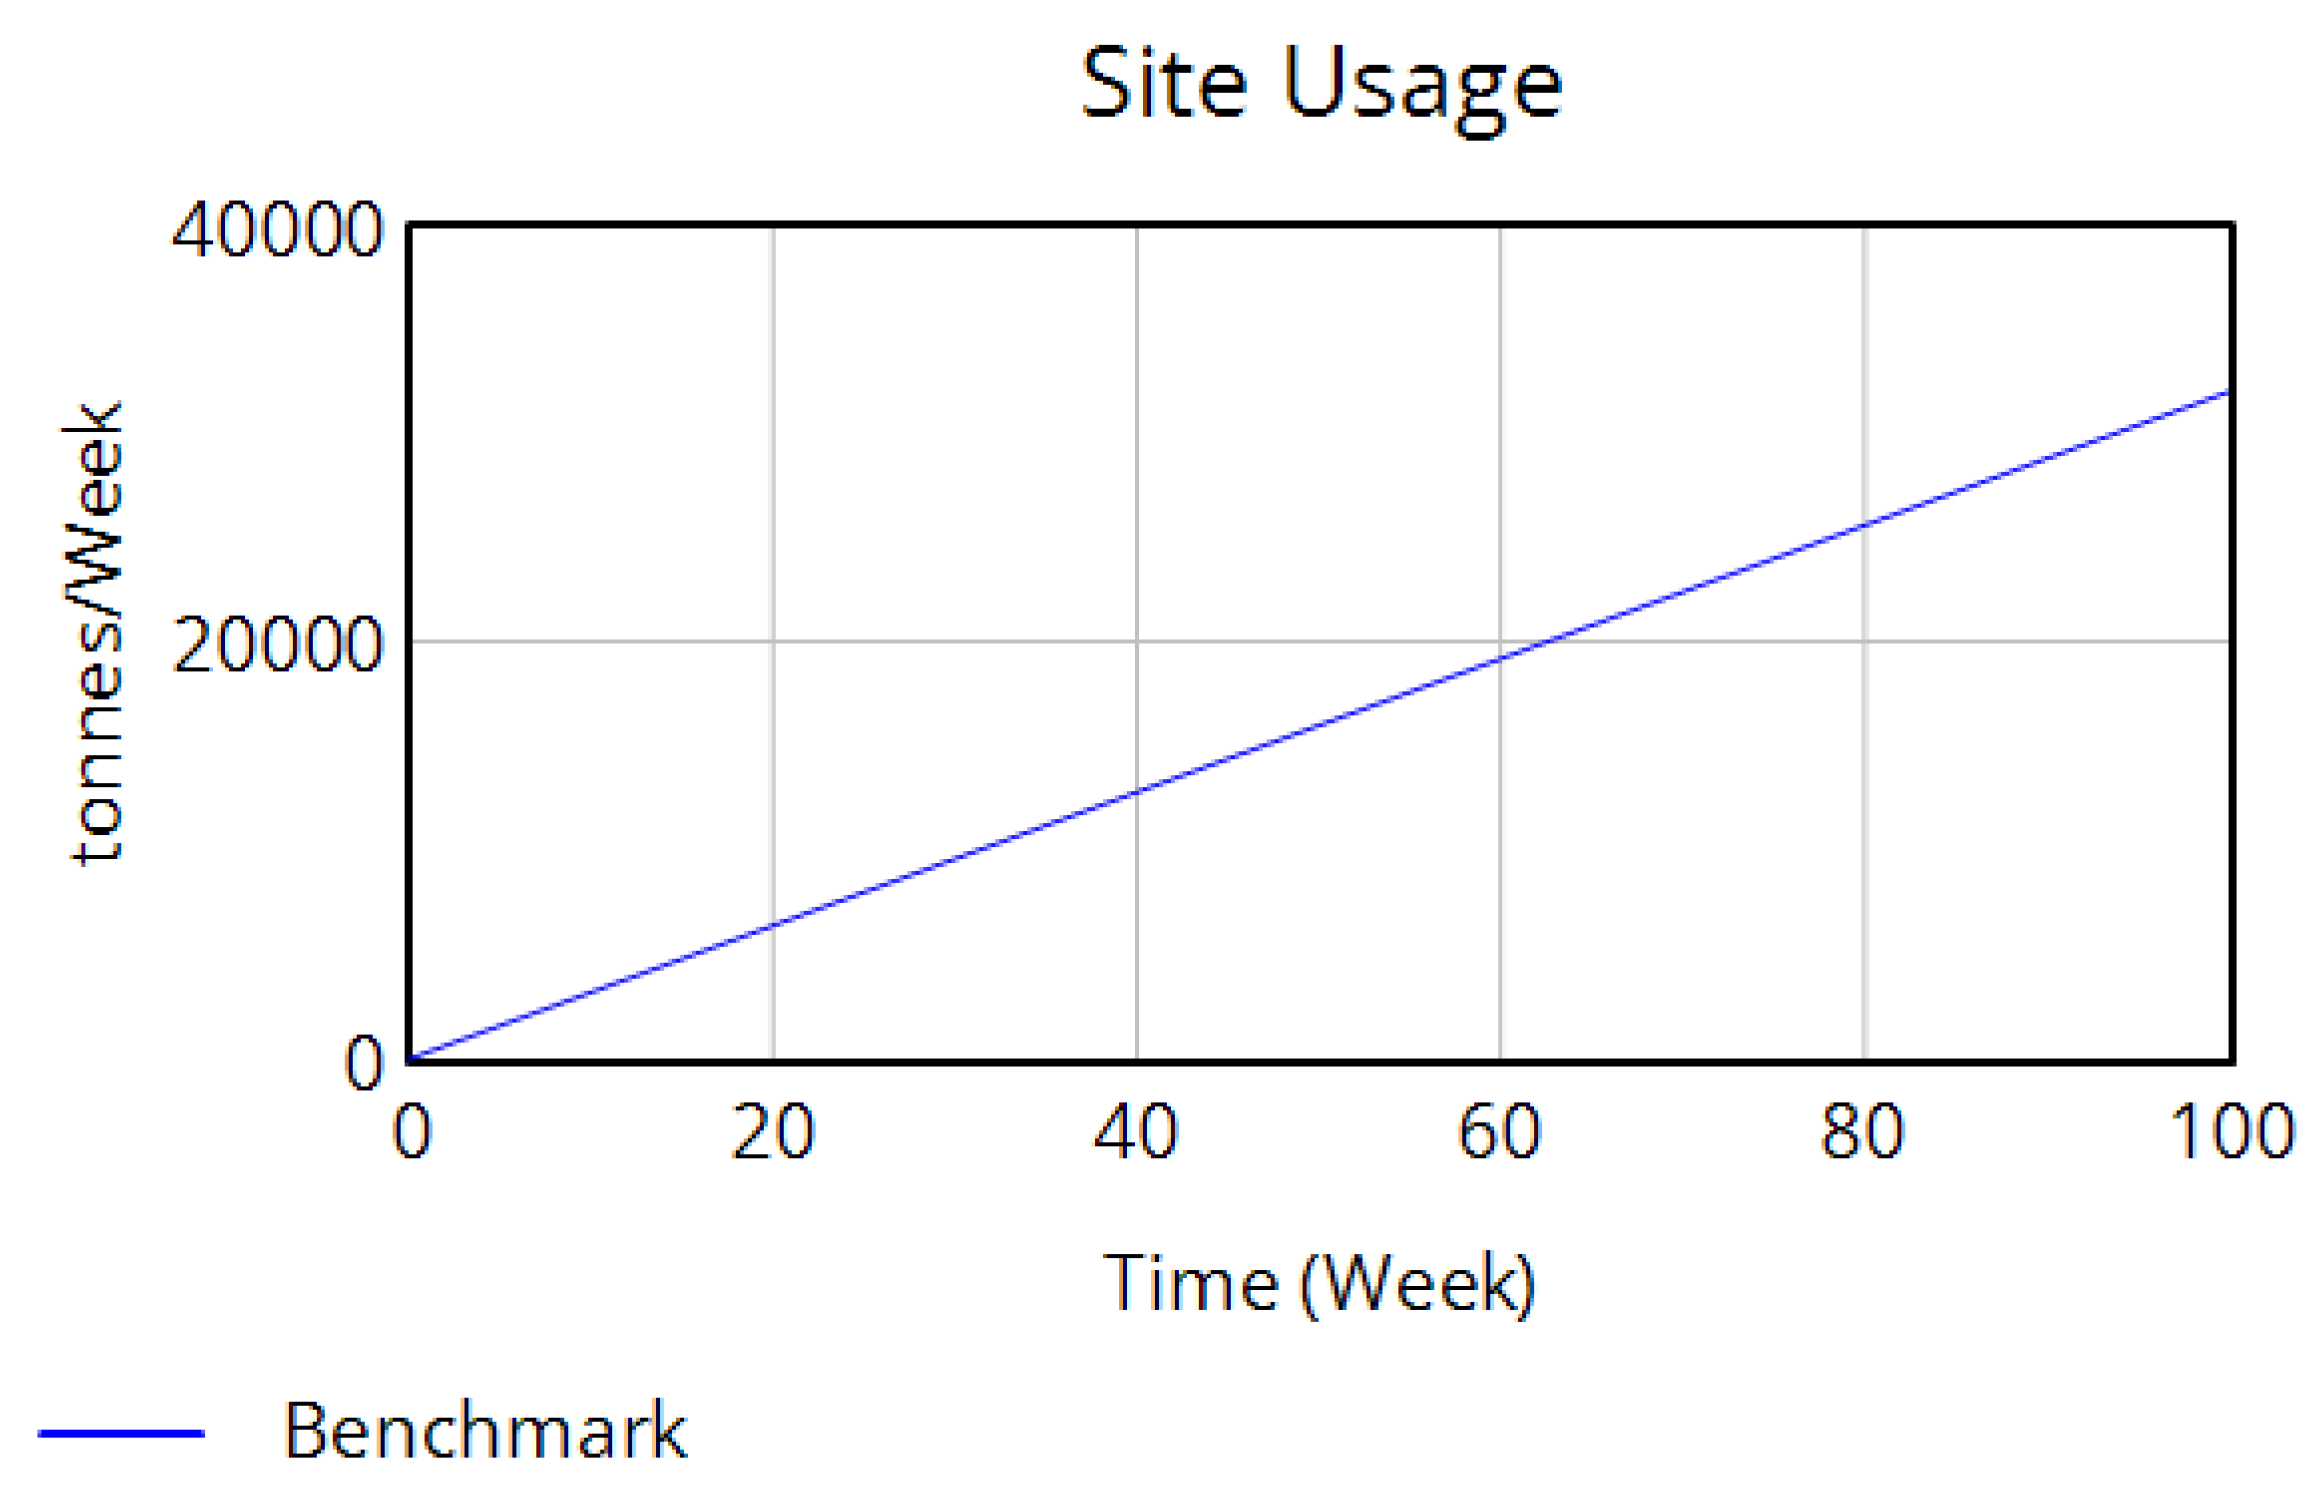
In the model, the amount of hydrogen generated through gasification is set as a constant value, which is affected by the chosen production method and the efficiency of earlier processing stages. The flow of generated hydrogen determines how much will be used internally by the facility and how much will be stored for transportation to end users. Over 100 weeks, the model simulates hydrogen losses and the transfer rate from the production site to consumers. It also tracks the cumulative hydrogen loss due to pipeline failures. Key factors, including the number of compressors, hydrogen embrittlement, pressure fluctuations, and monitoring effectiveness, are considered, with failure rates calculated per kilometer to estimate total pipeline failures across the entire transport distance. A large-scale gasification plant with a 200 MW hydrogen output can produce significant amounts of hydrogen for industrial use or power generation [40]. Located in Saudi Arabia, the NEOM Green Hydrogen Project is set to become the world’s largest commercial hydrogen facility powered solely by renewable energy. Scheduled to begin operations in 2026, it will generate 600 tonnes of green hydrogen per day using electrolysis technology [41]. The system in the model is built to produce 4000 tonnes of hydrogen per week under standard operating conditions. The designed capacity of hydrogen compressors is set at 100 tonnes/week. The cumulative amount of hydrogen transferred to storage, and the cumulative amount of hydrogen used for internal uses are shown in Figure 6 and Figure 7, respectively.
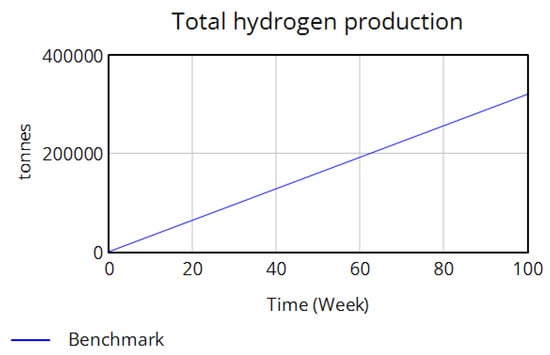
Figure 6.
Amount of hydrogen ready to export in 100 months.
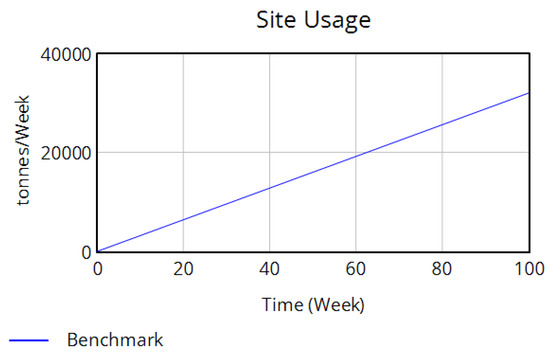
Figure 7.
Amount of hydrogen transported for internal use in 100 months.
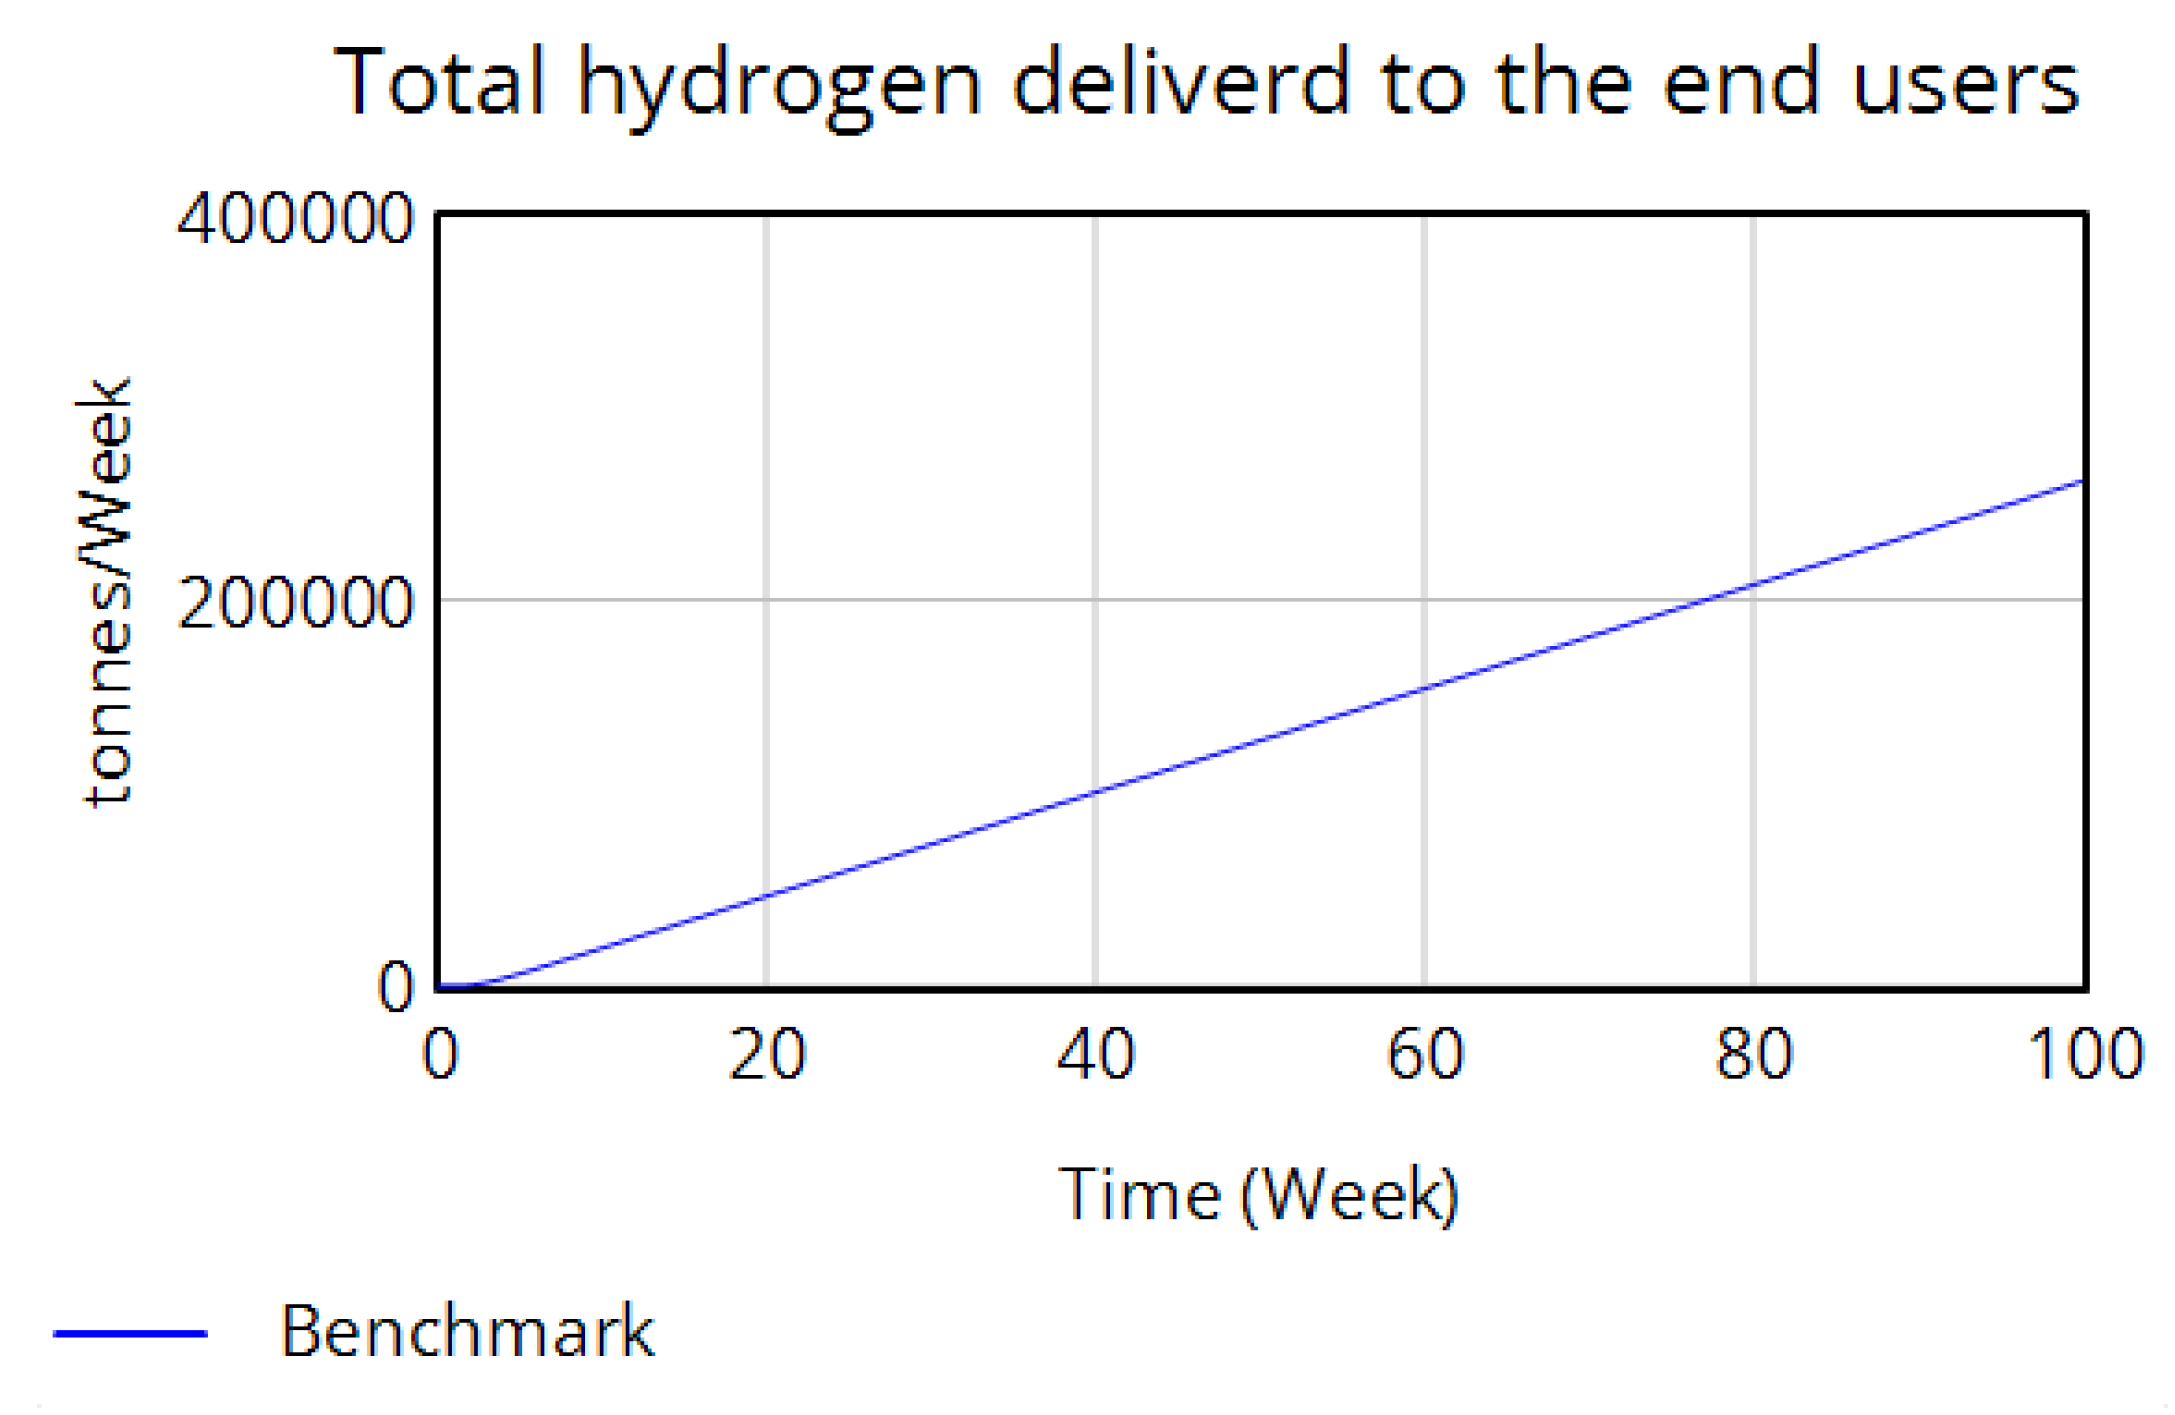
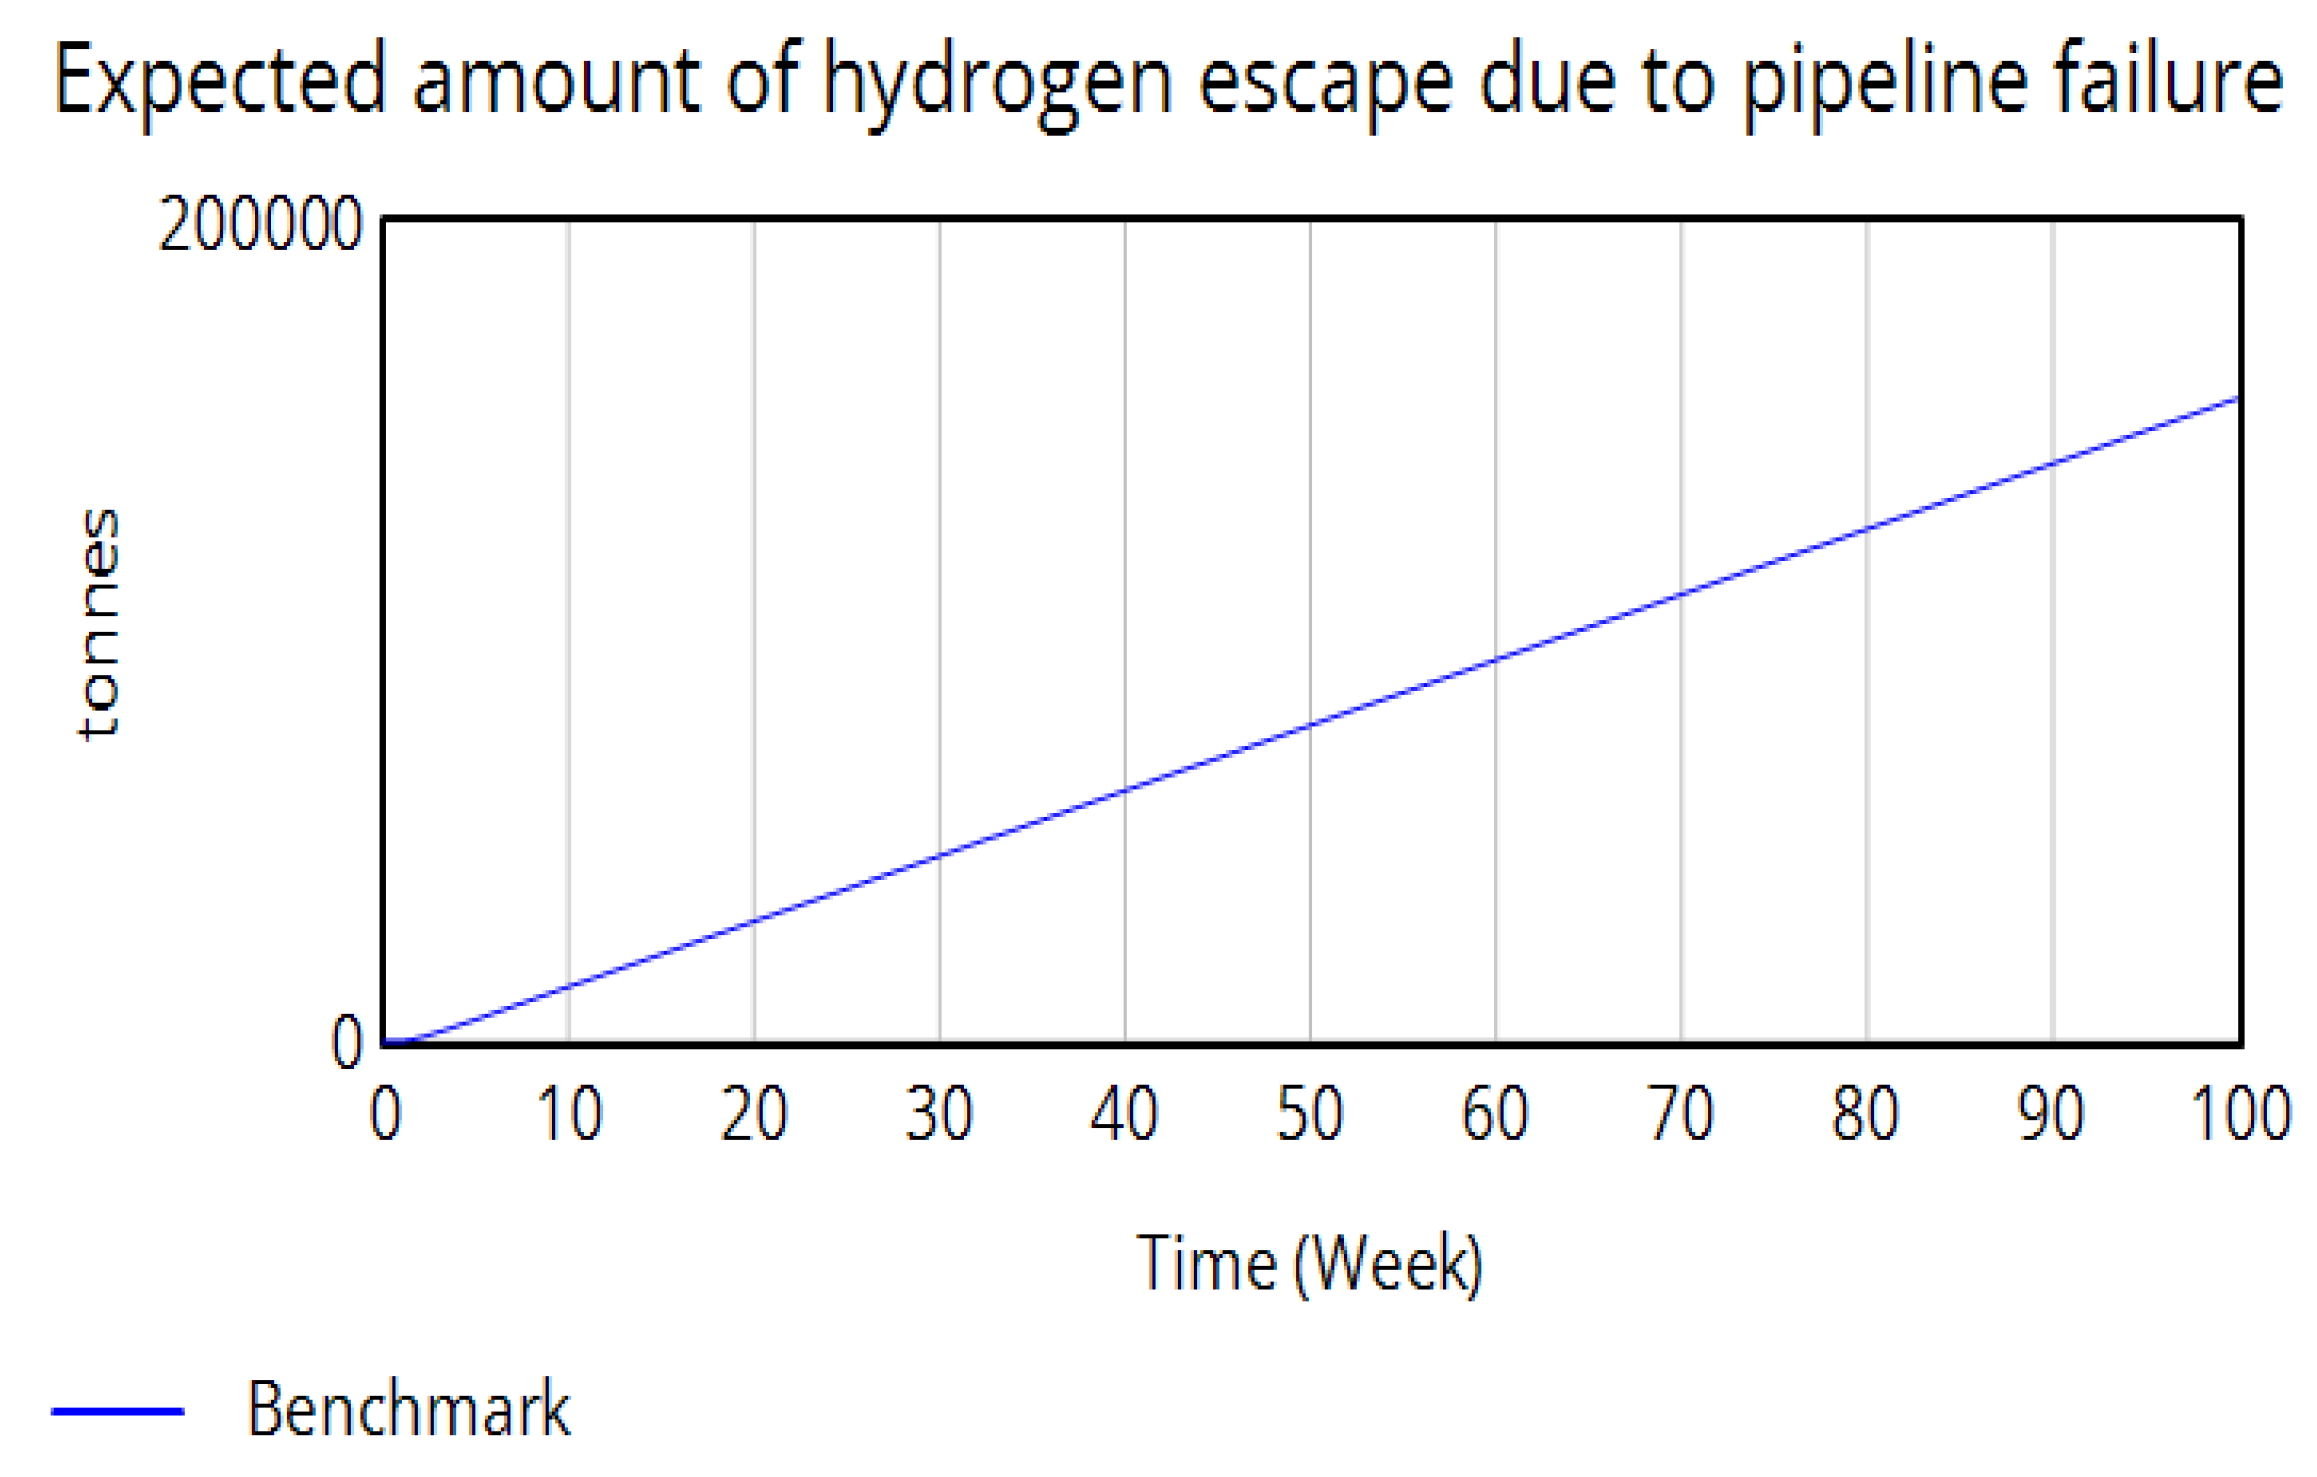
The model calculates the total hydrogen transported by subtracting the transportation rate from the rate of gas arrival, where the amount of hydrogen loss during transportation influences this calculation. Total hydrogen delivered to the end users and hydrogen leaks from pipeline failure are also shown in Figure 8 and Figure 9.
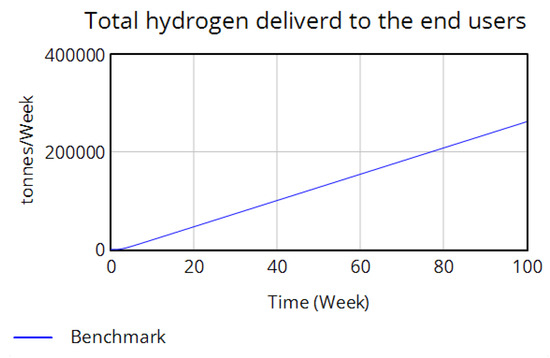
Figure 8.
Total amount of hydrogen delivered to end-users over 100 months.
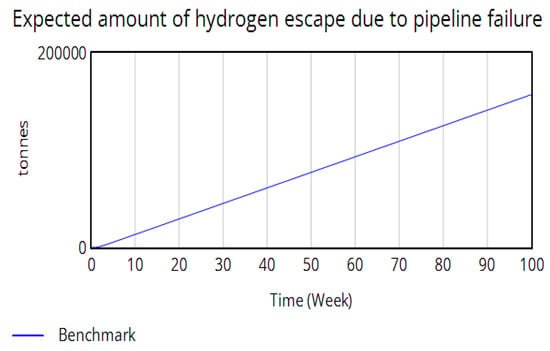
Figure 9.
The total amount of fugitive gas due to pipeline failure in 100 months.
Scenario Analysis
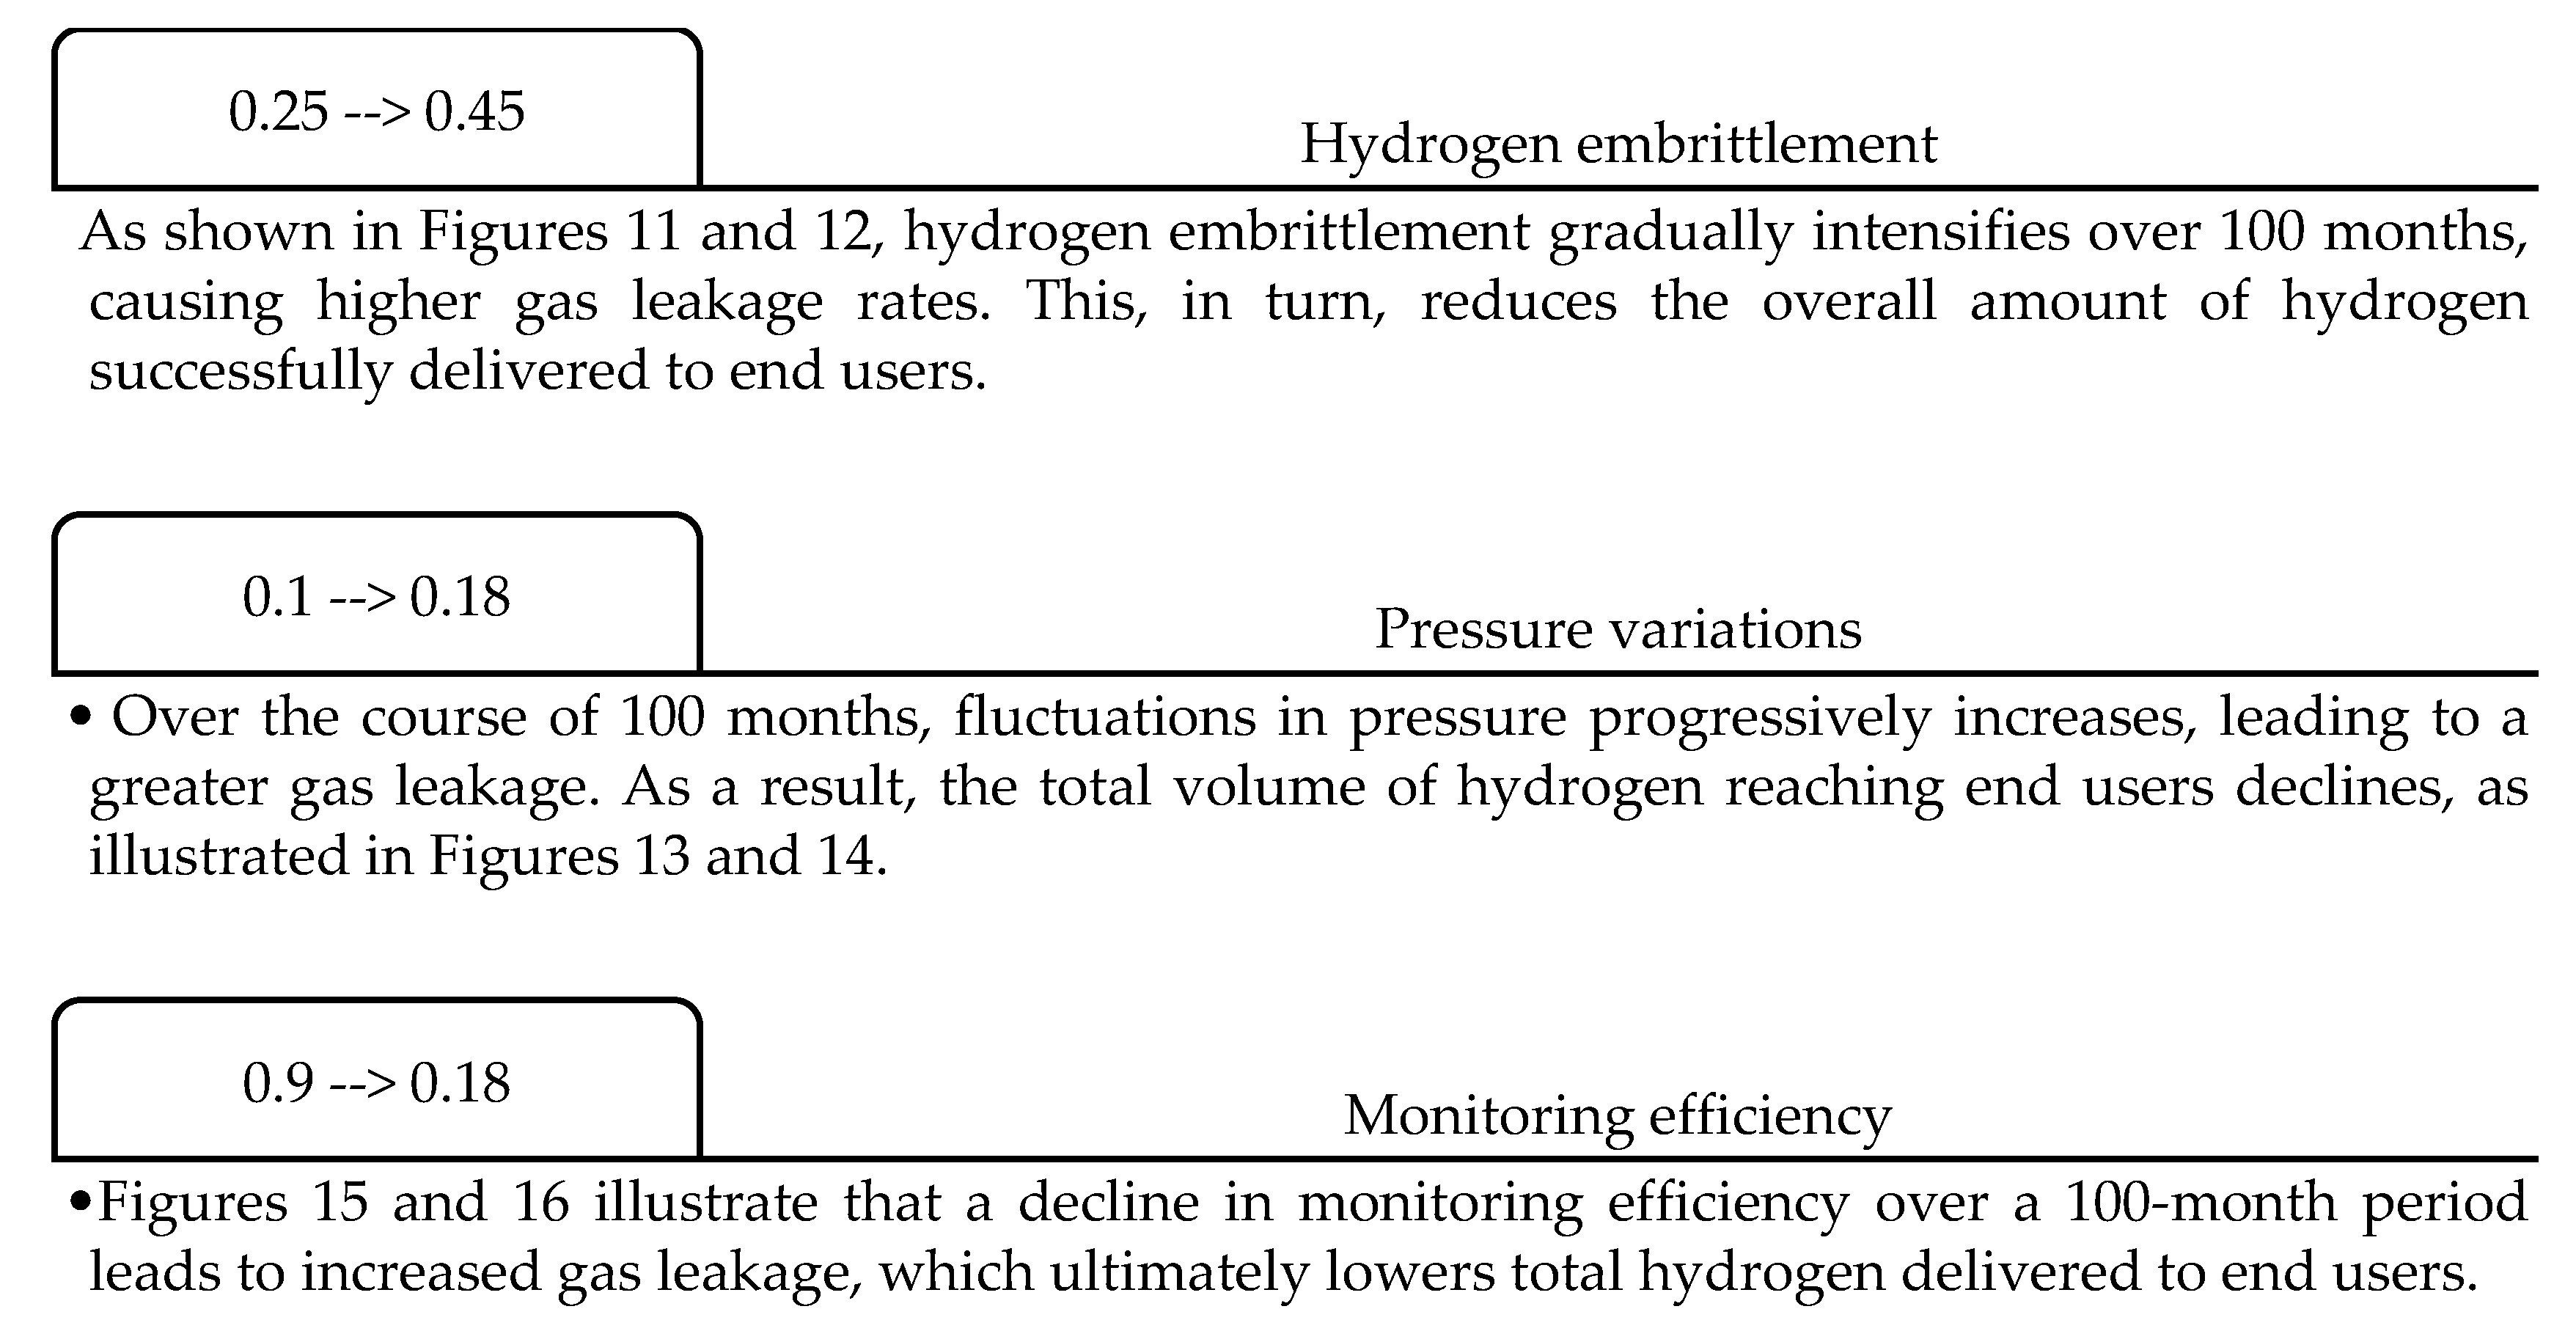
Three separate scenarios were developed to examine how different factors affect both the volume of hydrogen successfully delivered to end users and the amount lost due to pipeline failures. The purpose of this analysis, as illustrated in Figure 10, is to evaluate the impact of these variables on hydrogen pipeline performance over 100 weeks. All three variables are dimensionless (normalized) parameters, varying between 0 and 1. This is useful for comparing the variables on the same scale. It helps with easy understanding and stability in the model. Appendix A provides a detailed description of the scaling of constants used.
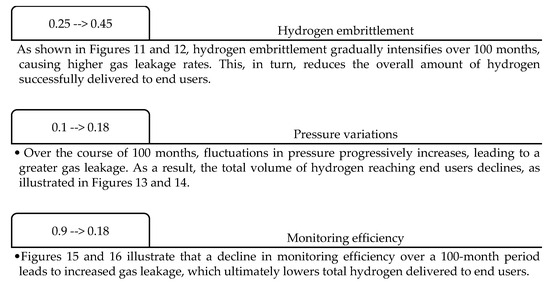
Figure 10.
Scenarios are designed to assess how various factors affect the volume of hydrogen injected and the amount of hydrogen leaked in the event of a pipeline failure.
Each scenario provides insights into the technical elements that influence hydrogen transport efficiency and pipeline integrity. By simulating various operational conditions, the study identifies critical parameters that shape delivery outcomes and leakage risks, thereby supporting more effective strategies for enhancing system reliability and environmental protection.
In the analysis, the benchmark scenario serves as a reference or baseline against which other scenarios are compared. It acts as a standard for evaluating the effects of different variables, strategies, or interventions within the system. Comprehensive descriptions of these scenarios, along with the corresponding graphs of the gas quantity, are available in Figure 11, Figure 12, Figure 13, Figure 14, Figure 15 and Figure 16.
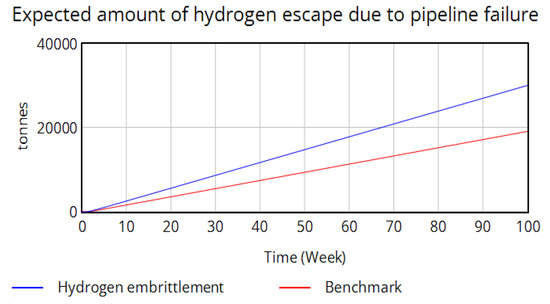
Figure 11.
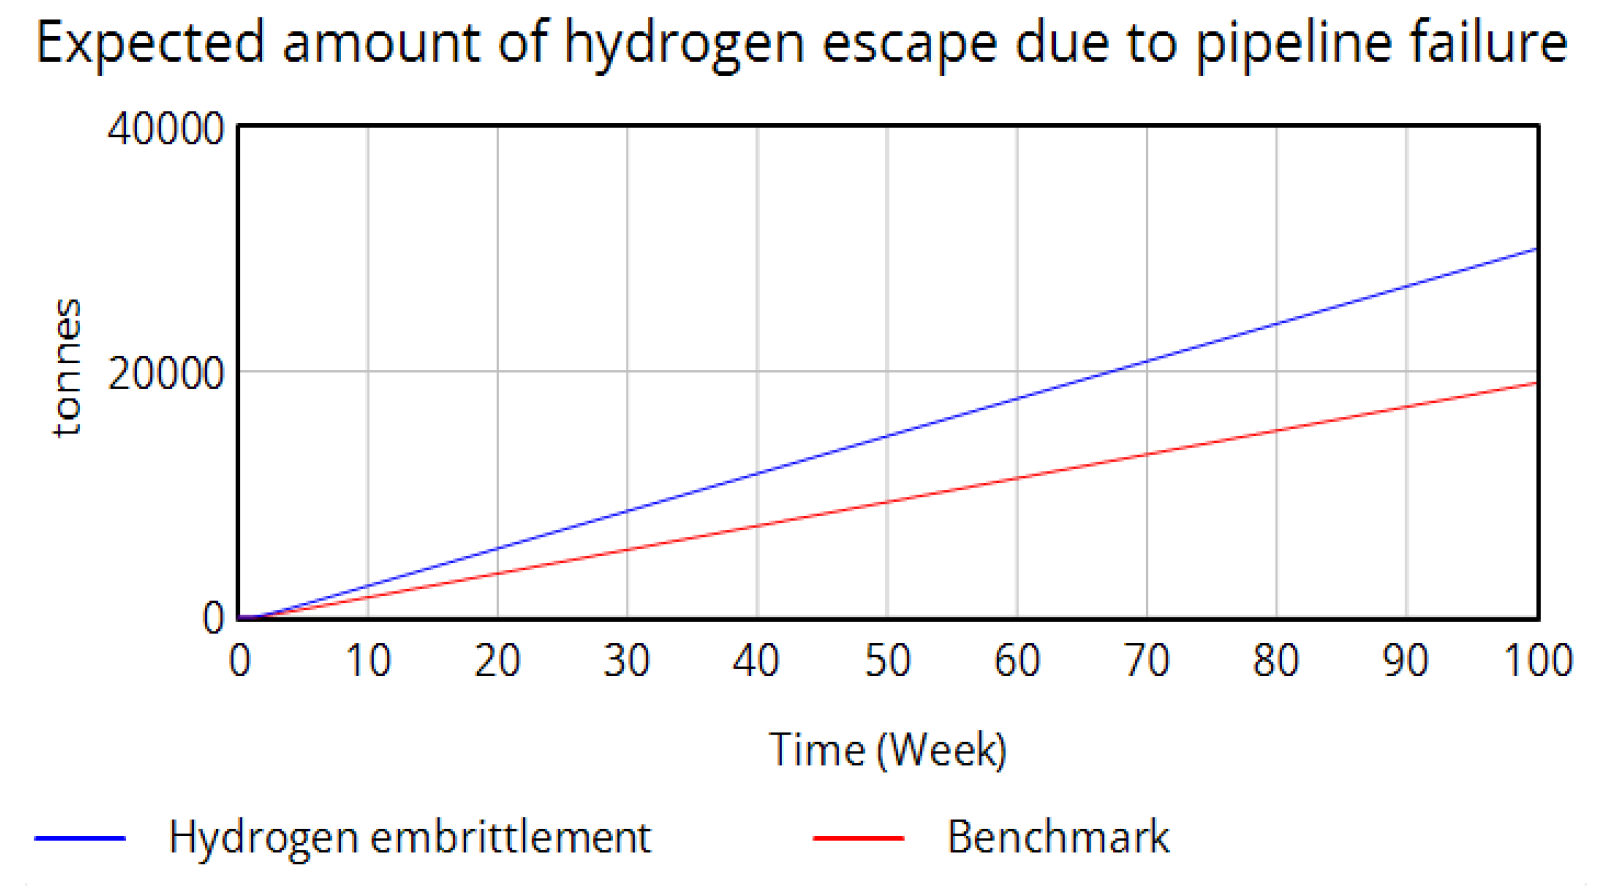
Effect of an increase in hydrogen embrittlement on the amount of hydrogen escape due to pipeline failure.
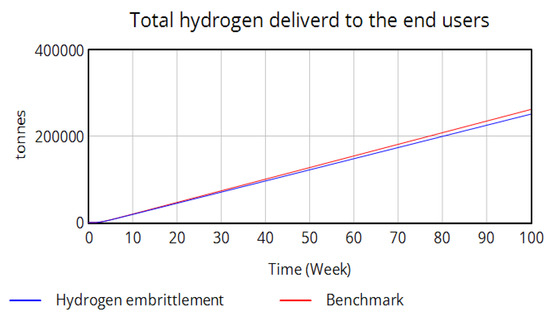
Figure 12.
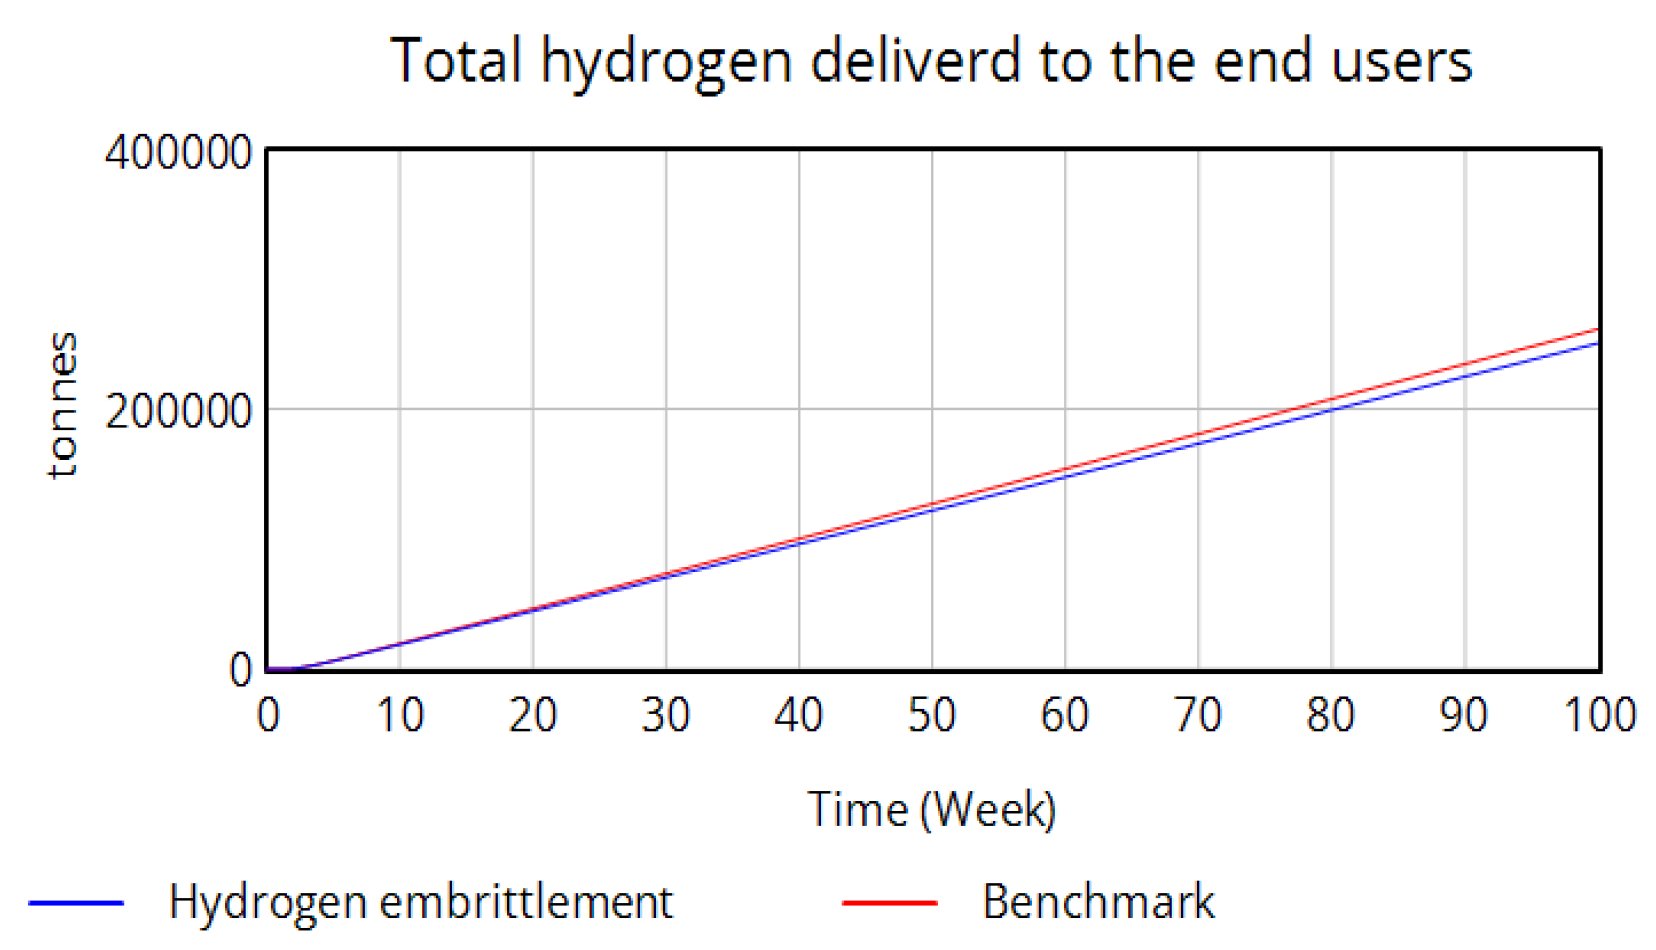
Effect of an increase in the hydrogen embrittlement level on the total hydrogen delivered to the end user.
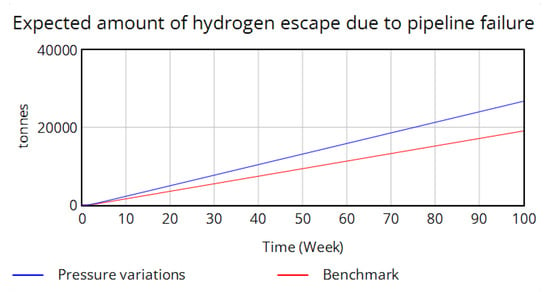
Figure 13.
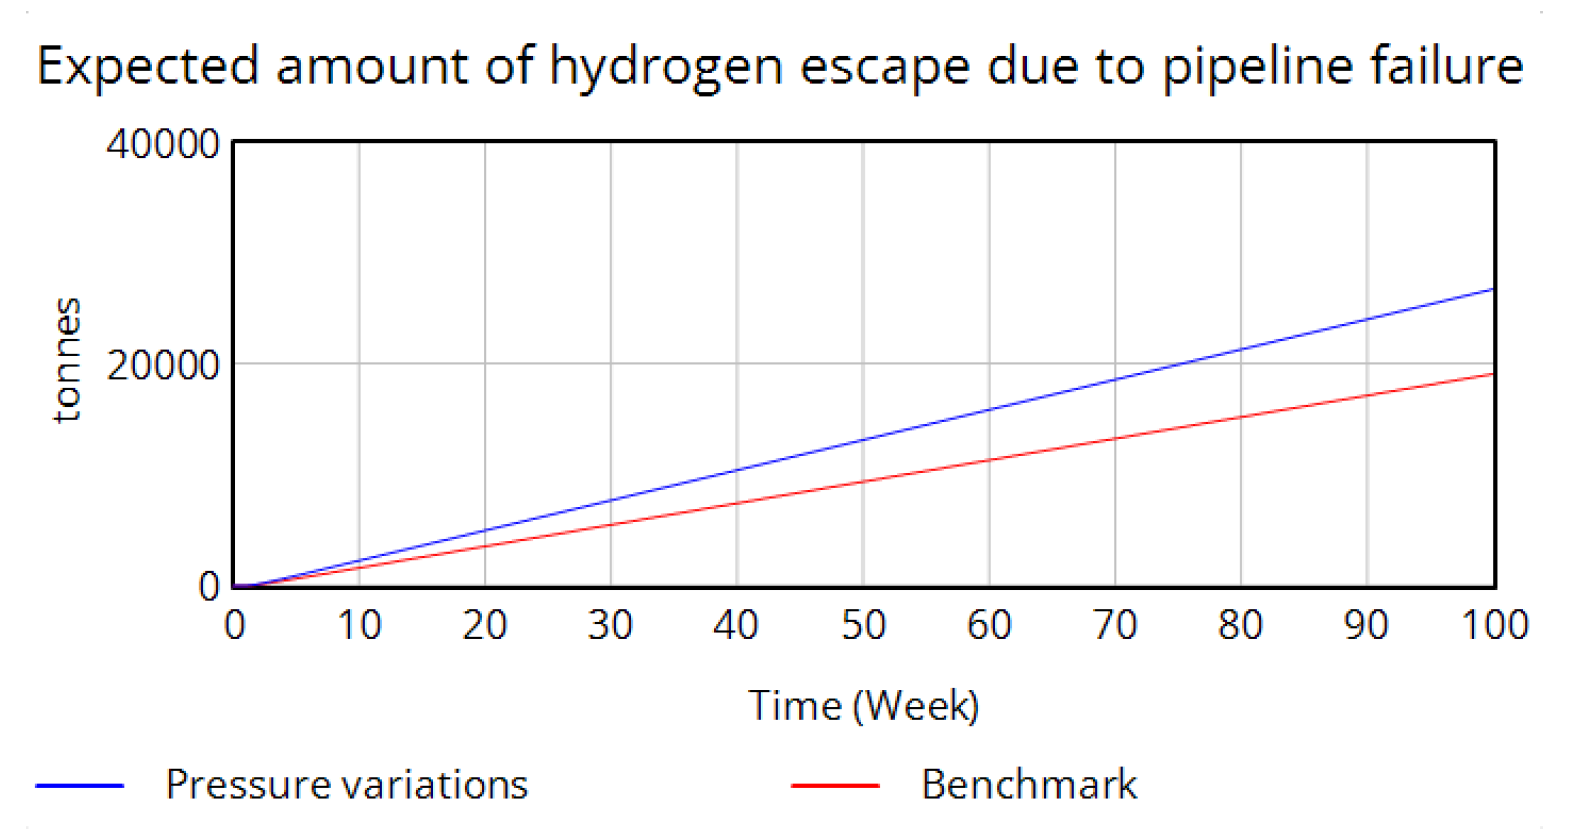
Effect of an increase in pressure variations on the amount of hydrogen escape due to pipeline failure.
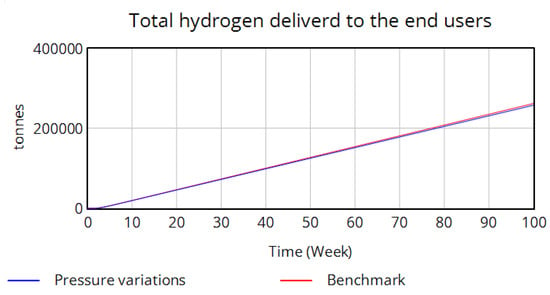
Figure 14.
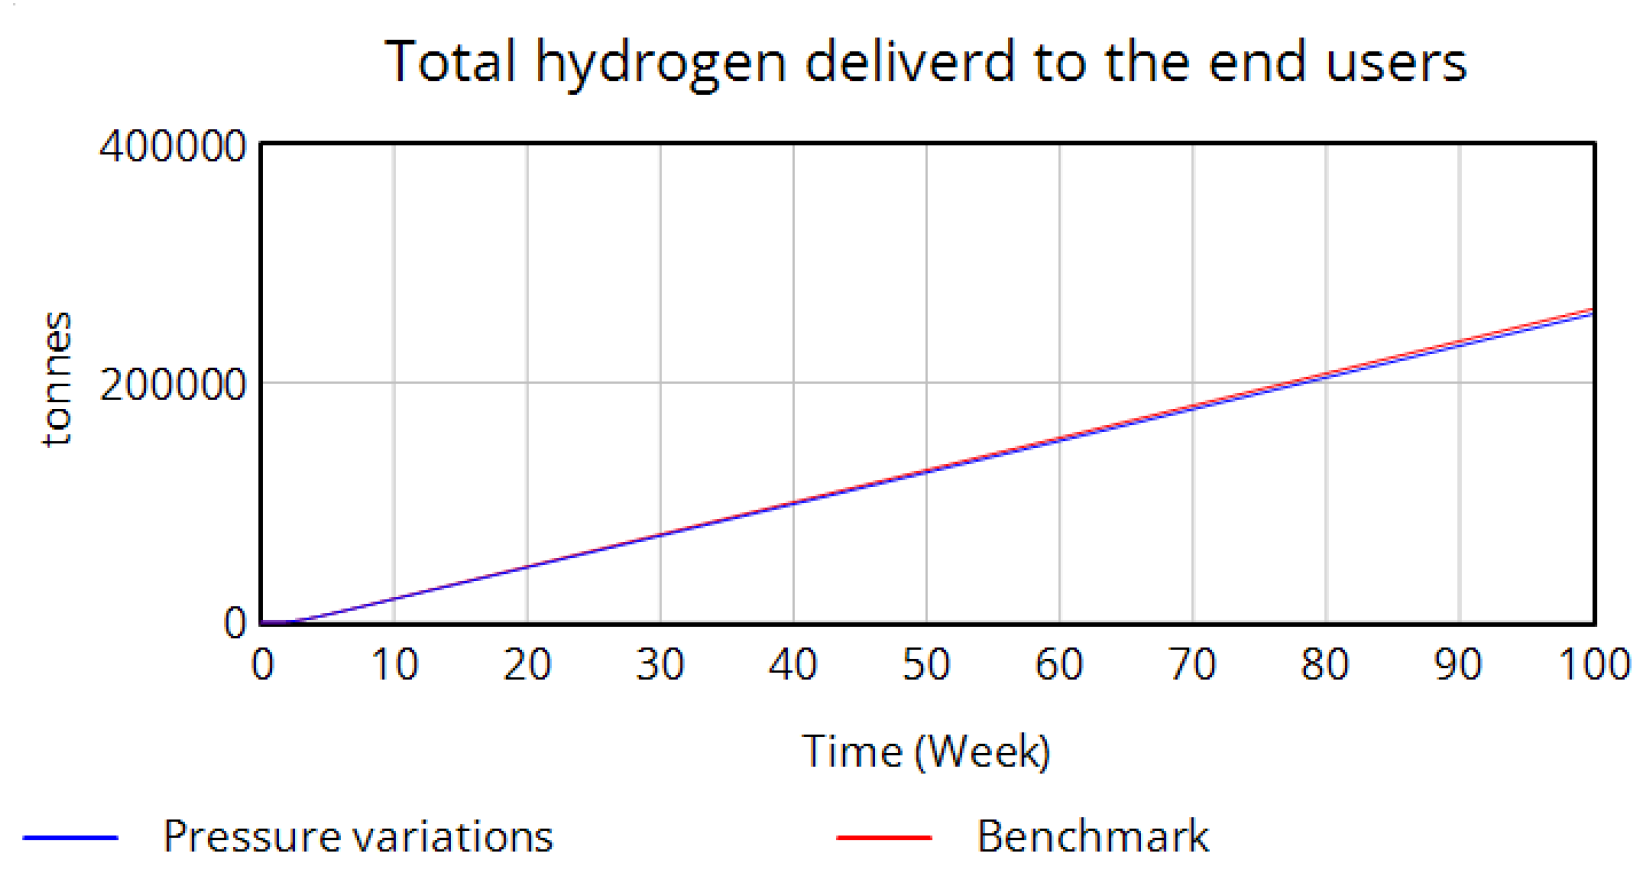
Effect of an increase in pressure variations on total hydrogen delivered to the end user.
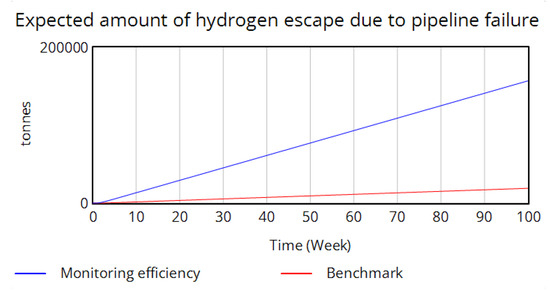
Figure 15.
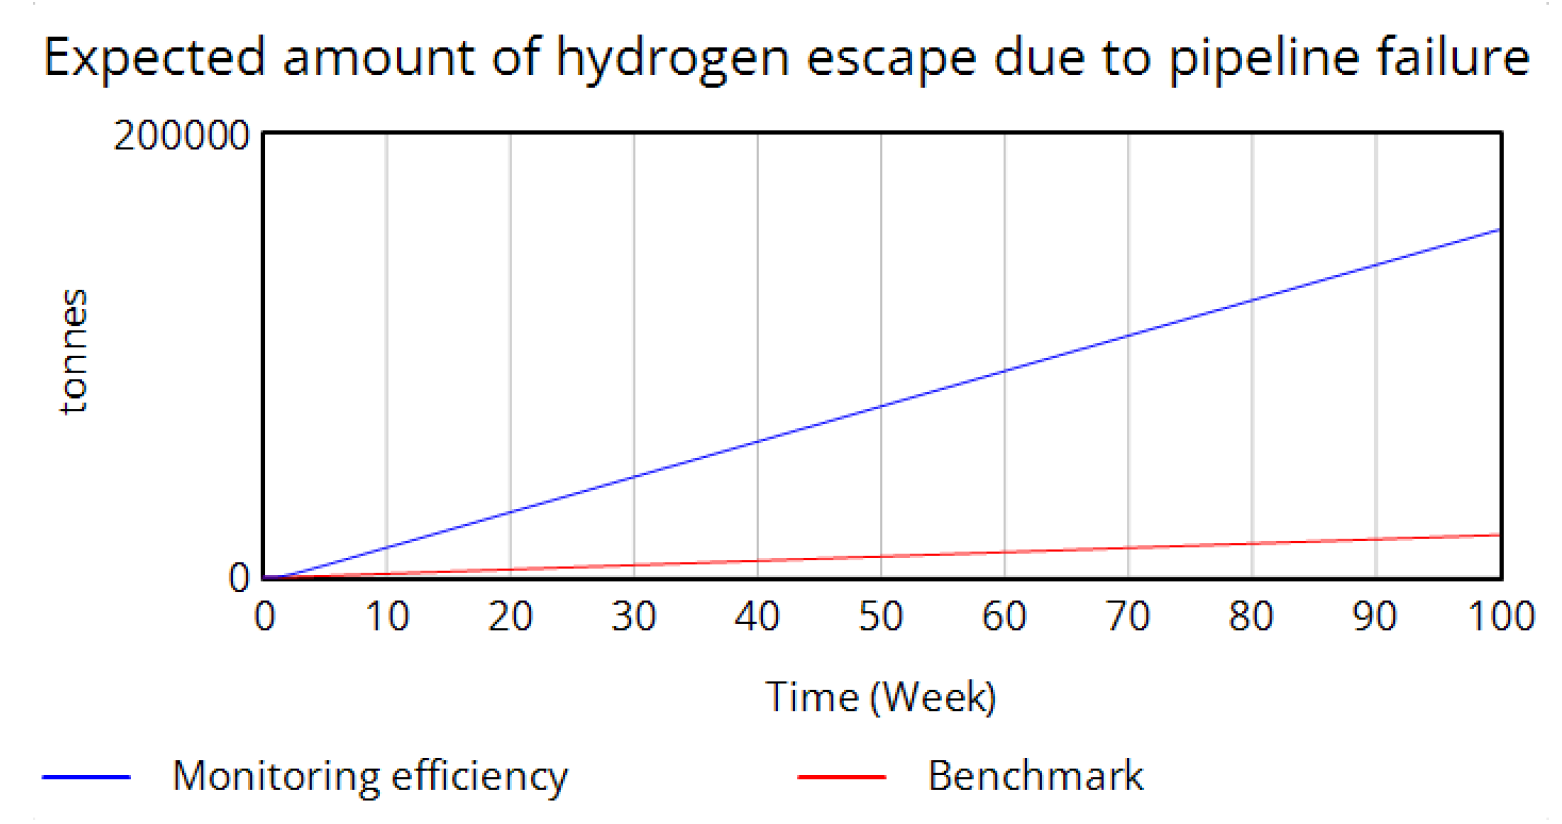
Effect of a decrease in monitoring efficiency on the amount of hydrogen escape due to pipeline failure.
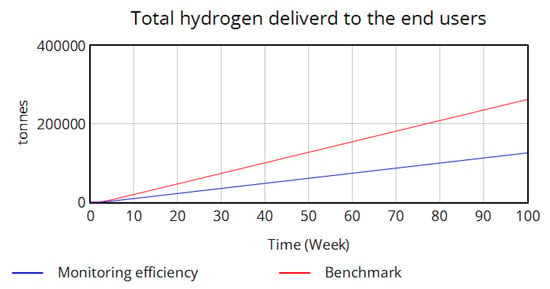
Figure 16.
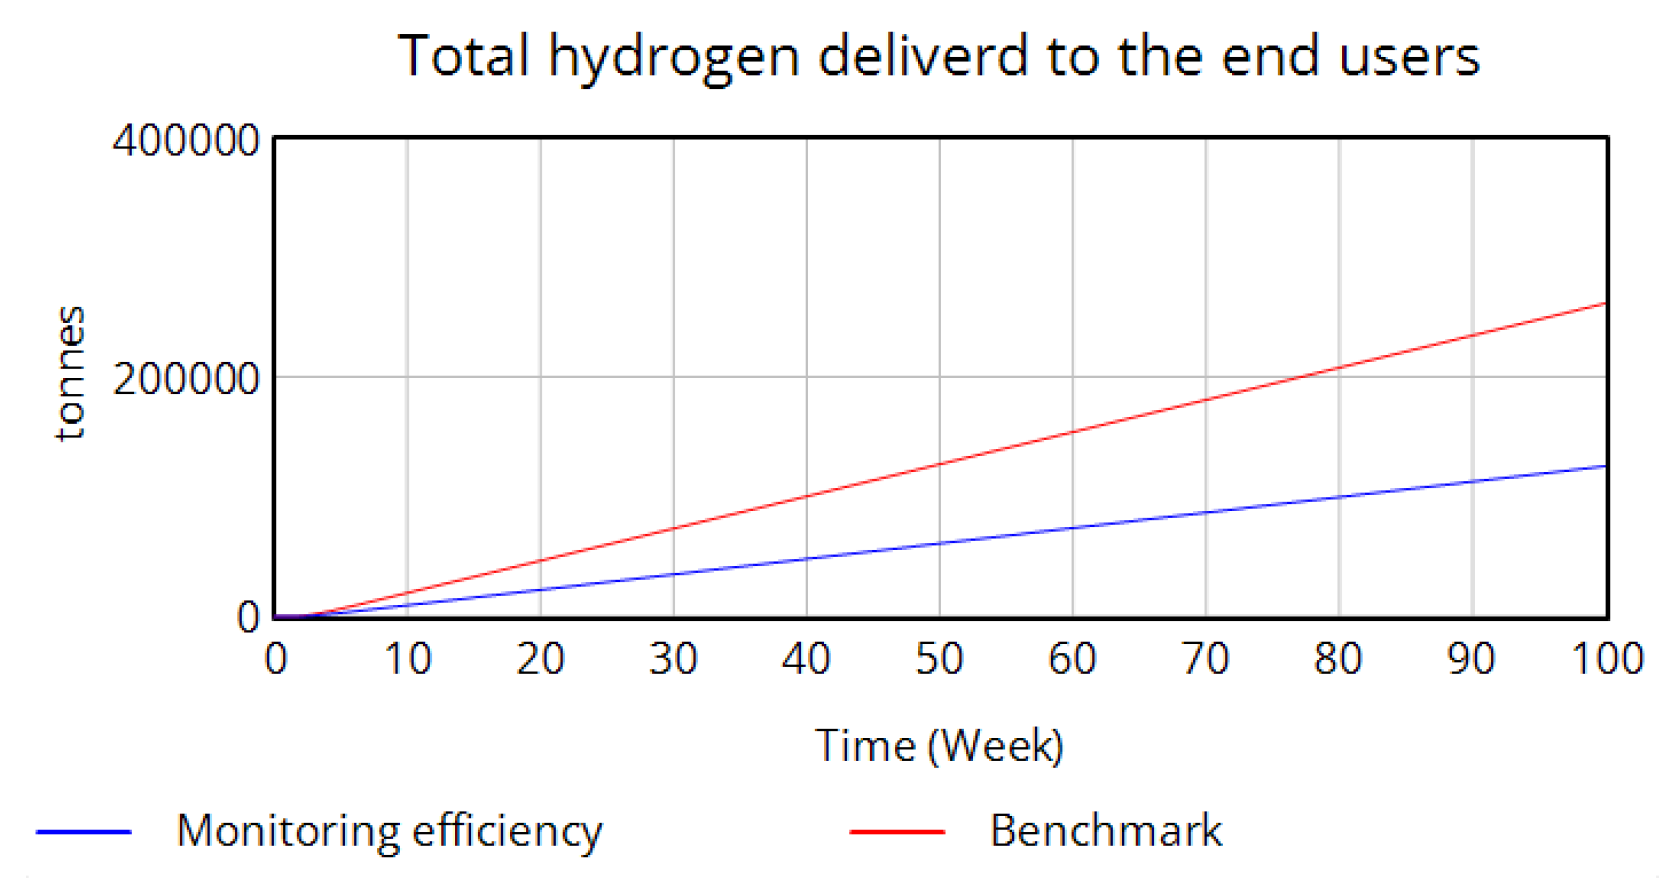
Effect of a decrease in monitoring efficiency on total hydrogen delivered to the end user.
Equation (1) shows the likelihood of hydrogen escaping per Km.
(Pressure Variations + Hydrogen Embrittlement) × (1 − Monitoring Efficiency)
This helps to estimate the unmitigated risk of a hydrogen pipeline. Pressure variations and hydrogen embrittlement combine to form the total technical risk. Monitoring efficiency shows how much of this risk can be detected or prevented. Subtracting it from 1 yields the remaining share of risk, and multiplying by it provides the undetected risk level.
Over 100 weeks, a sensitivity analysis reveals that an 80% increase in hydrogen embrittlement can lead to a 37% rise in predicted hydrogen loss from pipeline failures and a 4% reduction in total hydrogen delivery to end-users (Figure 11 and Figure 12). Similarly, an 80% increase in pressure fluctuations raises expected hydrogen loss by 24% and decreases delivered hydrogen by 1.8% (Figure 13 and Figure 14). In contrast, an 80% drop in monitoring efficiency has a significantly greater impact, resulting in a 72.2% increase in predicted hydrogen loss and a 52% reduction in total delivery to end users (Figure 15 and Figure 16).
Previous research indicates that hydrogen embrittlement typically occurs due to the accumulation of hydrogen at microstructural defects, such as dislocations and grain boundaries. These localized concentrations of hydrogen weaken the metal’s structure, making it more prone to cracking under stress. Moreover, a high density of hydrogen trapping sites within the material significantly slows down hydrogen diffusion by capturing hydrogen atoms before they can move freely through the lattice. This decrease in the diffusion coefficient changes how hydrogen spreads through the steel. This will increase the risk of hydrogen embrittlement over time. Steels with a higher content of martensite phases tend to trap more hydrogen atoms compared to those composed mainly of other phases like ferrite or pearlite. Accumulation of hydrogen in some parts of the structure causes the metal to be prone to hydrogen embrittlement. This is the result of a higher content of martensite phase, which exhibits lower hydrogen diffusion rates [42]. Figure 11 and Figure 12 illustrate that higher material diffusivity and lower material compatibility lead to greater vulnerability to hydrogen embrittlement. This results in less hydrogen being successfully delivered to end users, while more is lost through leakage into the atmosphere.
Pressure variations reduce the strength of steel, which also causes cyclic loading in hydrogen pipelines. Hydrogen decreases the verge of the stress intensity factor, which causes fatigue cracks to grow, even under lower stress levels. Combinations of frequent stress and high-pressure hydrogen increase the failure rate of steel. The crack growth rate is influenced by factors such as hydrogen pressure, steel composition, microstructure, and load frequency. This highlights the importance of carefully designing pipelines and enhancing the monitoring of failures caused by hydrogen-induced fatigue [14]. Figure 13 and Figure 14 demonstrate that greater variations in pressure reduce the amount of hydrogen reaching end users and increase the amount of hydrogen lost to the atmosphere.
Advanced safety systems can aid in the early detection of leakage due to hydrogen’s wide flammability range and low ignition energy. Leak detection methods are composed of two main types: external and internal. External systems utilize tools such as fiber optics or infrared imaging to monitor the pipeline’s surface. These methods often have high costs and are difficult to apply to existing pipelines. Internal systems depend on sensors that monitor pressure, flow, or temperature changes inside the pipeline [43]. Technologies such as fiber-optic sensors enable continuous real-time monitoring, allowing for faster detection and response to potential leaks. These methods enhance the overall safety of pipeline systems [44]. Figure 15 and Figure 16 illustrate that a reduction in monitoring efficiency will lead to increased hydrogen leakage and a decrease in the amount of hydrogen delivered to the end user, respectively.
5. Conclusions
Hydrogen, one of the clean energy vectors, needs safe and efficient transportation to ensure its continuous global utilization. In this article, system dynamics is employed to model the key technical challenges that may impact the hydrogen pipeline transportation system. The study focuses on hydrogen losses resulting from material degradation, pressure variations, and the efficiency of leak detection. The paper demonstrates that pipeline integrity can be significantly affected by hydrogen embrittlement, which is primarily influenced by two factors in the model: microstructural trapping and diffusion rates in steel. The total amount of hydrogen reaching the end users and the amount of hydrogen leakage are highly dependent on material integrity, which increases the metal’s vulnerability. The risk of leakage and the successful delivery of hydrogen are also influenced by pressure variations and cyclic loading, which can result in fatigue in the metal. Additionally, the high flammability and diffusivity of hydrogen pose serious safety issues. The paper emphasizes the importance of monitoring efficiency to facilitate real-time detection and reduce the risk of leakage. In general, to improve the overall safety performance of the hydrogen transportation system, the model shows that managing and recognizing technical risks is crucial. By identifying where and how hydrogen losses occur in hydrogen transportation infrastructure, the safety system can be improved, which facilitates the broader utilization of hydrogen as a clean energy carrier.
This model enables regulators to understand how various risks affect hydrogen safety and delivery. This allows experts to prioritize spending on monitoring and maintenance to keep the system dependable. Regulators can utilize it to develop reliable rules that address key safety concerns. Because the model illustrates how conditions evolve, it can also simulate different changes before implementing them. This also helps with making better decisions. In future studies, it is necessary to clearly define additional components to enhance transparency and provide a more specific technical foundation for each variable. Sensitivity analysis over 100 weeks reveals that an 80% increase in embrittlement results in a 37% increase in hydrogen loss and a 4% decrease in delivery, while an 80% rise in pressure fluctuations leads to a 24% increase in loss and a 1.8% reduction in delivery. In comparison, an 80% drop in monitoring efficiency has the most significant impact, resulting in a 722% increase in loss and a 52% decline in delivery.
The model can be enhanced by integrating it with agent-based models to represent human actions more effectively. It can be combined with environmental and cost assessments to provide a more complete view. This can also help with more sustainable and effective management of hydrogen transport.
Author Contributions
Validation, S.Y. and H.B.; writing—original draft preparation, M.S.; writing—review and editing, S.Y.; supervision, S.Y. and H.B.; All authors have read and agreed to the published version of the manuscript.
Funding
This research received no external funding.
Data Availability Statement
No new data were created or analyzed in this study. Data sharing does not apply to this article.
Conflicts of Interest
The authors declare no conflicts of interest.
Abbreviations
The following abbreviations are used in this manuscript:
| H2 | Hydrogen |
| HAC | Hydrogen Assisted Cracking |
| HIC | Hydrogen Induced Cracking |
| LOHC | Liquid Organic Hydrogen Carrier |
| QRA | Quantitative Risk Assessment |
| SCC | Stress Corrosion Cracking |
| SD | System Dynamics |
| SOHIC | Stress-Oriented Cracking |
| SSC | Sulphide Stress Cracking |
Appendix A
Reference Case
Decision attribute quality is often judged by qualitative, subjective criteria described in natural language, making precise scoring difficult. Linguistic variables—terms like ‘bad’, ‘fair’, or ‘excellent’—are used instead of numbers, resulting in imprecise, fuzzy values. Experts rate these variables based on a chosen system, which is then converted into numerical data for final evaluation and analysis.
Once the qualitative variables of performance were quantified, the subsequent step involved defining the relationships among these variables. The relationships, effects, and interdependencies had previously been identified in the causal loop diagram. At this stage, expert input was used to establish quantitative relationships between the variables. Table A1 presents the numerical values derived from expert opinions.

Table A1.
Variables, their linguistic definitions, and numerical values.
Table A1.
Variables, their linguistic definitions, and numerical values.
| Variable | Description | Linguistic Definition | Numeric Value | Reference Case |
|---|---|---|---|---|
| Hydrogen embrittlement | It happens when hydrogen diffuses into the metal’s composition. This weakens the material and decreases its ductility, ultimately leading to structural failure. | Negligible | 0.0 → 0.25 | 0.25 |
| Minor | 0.26 → 0.50 | |||
| Moderate | 0.51 → 0.75 | |||
| Severe | 0.76 → 1.0 | |||
| Pressure variations | Fluctuation in gas pressure affects flow efficiency, the risk of material fatigue, and hydrogen embrittlement. | Negligible | 0.0 → 0.25 | 0.1 |
| Minor | 0.26 → 0.50 | |||
| Moderate | 0.51 → 0.75 | |||
| Sever | 0.76 → 1.0 | |||
| Monitoring efficiency | How effectively does the system detect, measure, and track hydrogen leaks? | Negligible | 0.0 → 0.25 | 0.9 |
| Minor | 0.26 → 0.50 | |||
| Moderate | 0.51 → 0.75 | |||
| Sever | 0.76 → 1.0 |
While this study’s model appears quantitative, it is based on subjective data. Table A1 assigns numerical values to variable strengths using expert consensus, averaging their assessments expressed numerically.
A 1 to 100, 1 to 5, or 1 to 10 scale, which is often used in market surveys and social studies, allows for statistical analysis with ordinal numbers. This approach does not invalidate results but highlights their limitations. Socio-technical systems combine human and mechanical elements, adding complexity and unpredictability through the human factor. Crew composition can change annually, and human inconsistency makes it hard to assess individual contributions to safety. Instead, system dynamics considers collective behavior through aggregation and averaging.
It is worth noting that the transmission subsystem is subordinate to the production and storage/usage subsystems. The contribution of human elements to safety would primarily propagate from them to the transmission subsystem.
Appendix B
Appendix B.1. VENSIM Input
Auxiliary Variables
FINAL TIME = 100 weeks. The final time for the simulation.
INITIAL TIME = 0 weeks. The initial time for the simulation.
TIME STEP = 0.03125
Stocks, Flows, and Variables

Table A2.
Vensim model auxiliary variables.
Table A2.
Vensim model auxiliary variables.
| Name | Units | Equation | Description |
|---|---|---|---|
| Compressors operating capacity | tonnes/week | Likelihood of compressors working × Designed capacity of export compressors × Number of compressors | The total effective capacity of export compressors is calculated by multiplying their likelihood of working, the designed capacity of each unit, and the total number of compressors. |
| Excess rate | tonnes/week | To or from storage at the production site | The excess rate is the amount of product moved into or out of storage at the production site. |
| Expected amount of hydrogen escape due to pipeline failure | tonnes | =INTEG (Loss rate) Initial = 0 | integrating (adding up over time) the loss rate, starting from an initial value of zero. |
| Export rate | tonnes/week | =IF THEN ELSE (Rate of Production ≥ Compressors operating capacity, Compressors operating capacity, Rate of Production) − Rate of site usage | The export rate is the smaller of the production rate or the compressors’ operating capacity, minus the amount of hydrogen used at the site. |
| Hydrogen embrittlement | Dmnl | =Material compatibility + Diffusivity | Hydrogen embrittlement is estimated by combining the material’s compatibility with hydrogen and the rate at which hydrogen diffuses into it. |
| In transit | tonnes | =INTEG (Transit rate − Rate of gas arrival − Loss rate) Initial = 0 | The hydrogen “in transit” is calculated by adding up the difference between the transit rate, the rate at which gas arrives, and any losses, starting from zero. |
| Initial value | tonnes/week | Initial value = Nominal production capacity × (1 − Percentage of site needs) | Represents the impact of training as well as the availability of safety devices. |
| Likelihood of hydrogen escaping per Km | Tonnes/week/Km | =(Pressure variations + Hydrogen embrittlement) × (1 − Monitoring efficiency) | The chance of hydrogen leaking per kilometer is calculated by adding the effects of pressure changes and hydrogen embrittlement, then adjusting for the effectiveness of the monitoring system. |
| Loss rate | tonnes/week | =Transit rate × Transportation distance × Likelihood of hydrogen escaping per Km/52 | The amount of hydrogen loss during transportation is calculated by multiplying the amount of hydrogen being moved by the distance it travels and the probability of leakage per kilometer, and then dividing by 52 to convert the yearly loss into a weekly amount. |
| Net rate of export | tonnes/week | =End users’ contract × (1 − Likelihood of stoppages at the user end) | The actual hydrogen export rate is calculated by adjusting the contracted supply to account for the probability of stoppages at the end-user’s site. |
| Number of compressors | Dmnl | =Total hydrogen production/Designed capacity of export compressors | The rate of gas arrival is equal to the amount of gas currently in transit. |
| Rate of gas arrival | tonnes/week | =In transit | The change in employees’ attitude regarding the importance of safety. |
| Rate of production | tonnes/week | =Nominal production capacity × Production efficiency | The rate of production is the multiplication of the maximum possible output by the actual efficiency of the production process. |
| Rate of site usage | tonnes/week | =Rate of Production × Percentage of site needs | The rate of site usage is the portion of the production rate that meets the site’s specific needs. |
| Ready for export | tonnes | =INTEG (Export rate − Transit rate) Initial = 0 | The accumulated quantity available for export starts from zero. |
| Site usage | tonnes | =INTEG (Rate of site usage) Initial = 0 | Total amount of hydrogen used at the site, starting from zero. |
| Storage at the Production site | tonnes | =INTEG (Excess rate) Initial = Initial value | The accumulated excess production over time, starting from the initial storage value. |
| To or from storage at the production site | tonnes/week | =IF THEN ELSE(Export rate < Net rate of export, 0, Export rate) | The flow to or from storage at the production site is set to zero if the export rate is less than the net export rate; otherwise, it equals the export rate. |
| Total hydrogen delivered to the end users | tonnes | =INTEG (Rate of gas arrival) Initial = 0 | The total hydrogen delivered to end users is the cumulative amount received, starting from zero. |
| Total hydrogen production | tonnes | =INTEG (Rate of Production) Initial = 0 | Total hydrogen production is the accumulated output over time, starting from zero. |
| Transit rate | tonnes/week | =Ready to export + To or from storage at the production site | The transit rate is the sum of the amount ready to export per week and the flow to or from storage at the production site |
Appendix B.2. Fixed Values
These are inputs provided by the user, and the numbers shown in this table represent a single scenario, which is the benchmark in this case.

Table A3.
Vensim model constant variables.
Table A3.
Vensim model constant variables.
| Name | Value | |
|---|---|---|
| Designed capacity of export compressors | =100 | Varies between 1 and 100. 100 is the maximum capacity. |
| Diffusivity | =0.1 | A fraction between 0 and 1. |
| Efficiency in engaging with the public | =0.5 | Time required for improvement to take hold in years. |
| End users’ contract | =20,000 | End users have an agreement to receive 20,000 tonnes of hydrogen each week. |
| The likelihood of compressors working | =0.98 | A fraction between 0 and 1. |
| Likelihood of stoppages at the user end | =0.001 | A fraction between 0 and 1. |
| Material compatibility | =0.15 | A fraction between 0 and 1. |
| Monitoring Efficiency | =0.9 | A fraction between 0 and 1. |
| Nominal production capacity | =4000 | It is the maximum amount of hydrogen the facility is designed to produce under normal operating conditions. |
| Percentage of the site needs | =0.1 | A fraction between 0 and 1. |
| Pressure variations | =0.1 | A fraction between 0 and 1. |
| Production efficiency | =0.8 | A fraction between 0 and 1. |
| Transportation distance | =100 | Total pipeline distance |
References
- Bhandari, R.; Adhikari, N. A comprehensive review on the role of hydrogen in renewable energy systems. Int. J. Hydrogen Energy 2024, 82, 923–951. [Google Scholar] [CrossRef]
- Reda, B.; Elzamar, A.A.; AlFazzani, S.; Ezzat, S.M. Green Hydrogen as a Source of Renewable Energy: A Step Towards Sustainability, An Overview. Environ. Dev. Sustain. 2024, 1–21. [Google Scholar] [CrossRef]
- Akyüz, E.S.; Telli, E.; Farsak, M. Hydrogen generation electrolyzers: Paving the way for sustainable energy. Int. J. Hydrogen Energy 2024, 81, 1338–1362. [Google Scholar] [CrossRef]
- Taneja, S.; Jain, A.; Bhadoriya, Y. Green hydrogen as a clean energy resource and its applications as an engine fuel. Eng. Proc. 2024, 59, 159. [Google Scholar] [CrossRef]
- IEA. Global Hydrogen Review 2024; International Energy Agency: Paris, France, 2024. [Google Scholar]
- Hren, R.; Vujanović, A.; Van Fan, Y.; Klemeš, J.J.; Krajnc, D.; Čuček, L. Hydrogen production, storage and Transport for Renewable Energy and Chemicals: An environmental footprint assessment. Renew. Sustain. Energy Rev. 2023, 173, 113113. [Google Scholar] [CrossRef]
- Elaouzy, Y.; El Fadar, A. Water-energy-carbon-cost nexus in hydrogen production, storage, transportation and Utilization. Int. J. Hydrogen Energy 2024, 53, 1190–1209. [Google Scholar] [CrossRef]
- Li, J.; Song, F.; Zhang, X. A review of hazards and risks to pipeline operations during the transportation of hydrogen energy and hydrogen-mixed natural gas. Sci. Technol. Energy Transit. 2024, 79, 9. [Google Scholar] [CrossRef]
- Yang, R.; Schell, C.A.; Rayasam, D.; Groth, K.M. Hydrogen impact on transmission pipeline risk: Probabilistic analysis of failure causes. Reliab. Eng. Syst. Saf. 2025, 257, 110825. [Google Scholar] [CrossRef]
- Raj, A.; Larsson, I.A.S.; Ljung, A.-L.; Forslund, T.; Andersson, R.; Sundström, J.; Lundström, T.S. Evaluating hydrogen gas transport in pipelines: Current state of numerical and experimental methodologies. Int. J. Hydrogen Energy 2024, 67, 136–149. [Google Scholar] [CrossRef]
- Tian, X.; Pei, J. Study progress on the pipeline transportation safety of hydrogen-blended natural gas. Heliyon 2023, 9, e21454. [Google Scholar] [CrossRef]
- Yang, K.; Zhao, Z.; Zhang, A.; Yang, W.; Li, Q.; Zeng, S.; Peng, G. Risk modelling of hydrogen-enriched natural gas on pipelines and gas-electric coupled systems. IET Energy Syst. Integr. 2023, 6, 253–267. [Google Scholar] [CrossRef]
- Alssalehin, E.; Holborn, P.; Pilidis, P. Assessment of hydrogen storage and pipelines for hydrogen farm. Energies 2025, 18, 1167. [Google Scholar] [CrossRef]
- Giannini, L.; Razavi, N.; Alvaro, A.; Paltrinieri, N. Embrittlement, degradation, and loss prevention of Hydrogen Pipelines. MRS Bull. 2024, 49, 464–477. [Google Scholar] [CrossRef]
- Amer, M.O.; Hoseyni, S.M.; Cordiner, J. Fuelling the future with safe hydrogen transportation through natural gas pipelines: A quantitative risk assessment approach. Trans. Indian Natl. Acad. Eng. 2024, 9, 763–781. [Google Scholar] [CrossRef]
- Calabrese, M.; Portarapillo, M.; Di Nardo, A.; Venezia, V.; Turco, M.; Luciani, G.; Di Benedetto, A. Hydrogen Safety Challenges: A Comprehensive Review on production, storage, transport, Utilization, and CFD-based consequence and risk assessment. Energies 2024, 17, 1350. [Google Scholar] [CrossRef]
- Martin, P.; Ocko, I.B.; Esquivel-Elizondo, S.; Kupers, R.; Cebon, D.; Baxter, T.; Hamburg, S.P. A review of challenges with using the natural gas system for hydrogen. Energy Sci. Eng. 2024, 12, 3995–4009. [Google Scholar] [CrossRef]
- Shourideh, M.; Yasseri, S.; Bahai, H. Influence of Safety Culture on Safety Outcomes of a Hydrogen–CCS Plant. Gases 2025, 5, 2. [Google Scholar] [CrossRef]
- Li, C.; Zhang, L.; Ou, Z.; Ma, J. Using system dynamics to evaluate the impact of subsidy policies on Green Hydrogen industry in China. Energy Policy 2022, 165, 112981. [Google Scholar] [CrossRef]
- Ma, T.; Ji, J.; Chen, M. Study on the hydrogen demand in China based on system dynamics model. Int. J. Hydrogen Energy 2010, 35, 3114–3119. [Google Scholar] [CrossRef]
- Dueñas Santana, J.A.; Di Benedetto, A.; González Gómez, O.; Salzano, E. Towards sustainable hydrogen production: An integrated approach for sustainability, complexity, and systems thinking in the energy sector. J. Clean. Prod. 2024, 449, 141751. [Google Scholar] [CrossRef]
- Jacob, R.A.; Zhang, J. Modeling and control of nuclear–renewable integrated energy systems: Dynamic system model for green electricity and hydrogen production. J. Renew. Sustain. Energy 2023, 15, 046302. [Google Scholar] [CrossRef]
- Muhammed, N.S.; Gbadamosi, A.O.; Epelle, E.I.; Abdulrasheed, A.A.; Haq, B.; Patil, S.; Al-Shehri, D.; Kamal, M.S. Hydrogen production, transportation, utilization, and storage: Recent advances towards Sustainable Energy. J. Energy Storage 2023, 73, 109207. [Google Scholar] [CrossRef]
- Liu, M. Extended design philosophy of Hydrogen Transport Pipelines. J. Pipeline Sci. Eng. 2025, 5, 100228. [Google Scholar] [CrossRef]
- Spatolisano, E.; Restelli, F.; Pellegrini, L.A.; Cattaneo, S.; de Angelis, A.R.; Lainati, A.; Roccaro, E. Liquefied hydrogen, ammonia and liquid organic hydrogen carriers for harbour-to-harbour hydrogen transport: A sensitivity study. Int. J. Hydrogen Energy 2024, 80, 1424–1431. [Google Scholar] [CrossRef]
- Dauletbay, A. Transportation of hydrogen: Hydrogen usage. In Hydrogen Technologies—Advances, Insights, and Applications; IntechOpen: London, UK, 2024. [Google Scholar] [CrossRef]
- Fang, Q.; He, T.; Chen, L.; Pang, J. Research on the flow characteristics of injecting hydrogen into natural gas pipelines and its impact on energy metering. Int. J. Hydrogen Energy 2024, 82, 150–161. [Google Scholar] [CrossRef]
- Li, H.; Niu, R.; Li, W.; Lu, H.; Cairney, J.; Chen, Y.-S. Hydrogen in pipeline steels: Recent advances in characterization and embrittlement mitigation. J. Nat. Gas Sci. Eng. 2022, 105, 104709. [Google Scholar] [CrossRef]
- Bohacikova, V.; Pérez, S.R. Hydrogen Incidents: Lessons Learnt. Gexcon AS—Fire & Explosion Consultants. Available online: https://www.gexcon.com/blog/lessons-learnt-from-hydrogen-incidents/ (accessed on 29 May 2024).
- Nogara, J.; Zarrouk, S.J. Corrosion in geothermal environment: Part 1: Fluids and their impact. Renew. Sustain. Energy Rev. 2018, 82, 1333–1346. [Google Scholar] [CrossRef]
- Pourazizi, R.; Mohtadi-Bonab, M.A.; Szpunar, J.A. Investigation of different failure modes in oil and Natural Gas Pipeline Steels. Eng. Fail. Anal. 2020, 109, 104400. [Google Scholar] [CrossRef]
- Tunç, M.; Solmaz, R. Occupational Health and safety assessment of hydrogen transport by trucks. Int. J. Hydrogen Energy 2025, 144, 851–859. [Google Scholar] [CrossRef]
- Hossain Bhuiyan, M.M.; Siddique, Z. Hydrogen as an alternative fuel: A comprehensive review of challenges and opportunities in production, storage, and Transportation. Int. J. Hydrogen Energy 2025, 102, 1026–1044. [Google Scholar] [CrossRef]
- Sharma, S.; Agarwal, S.; Jain, A. Significance of hydrogen as economic and Environmentally Friendly Fuel. Energies 2021, 14, 7389. [Google Scholar] [CrossRef]
- Plug Power Inc. Plug Power Completes First Installation of Electrolyzer at Amazon Fulfillment Center. 2023. Available online: https://www.ir.plugpower.com/press-releases/news-details/2023/Plug-Power-Completes-First-Installation-of-Electrolyzer-at-Amazon-Fulfillment-Center/default.aspx (accessed on 20 April 2025).
- Denso. Denso to Begin SOEC Demonstration at Hirose Plant to Produce and Use Green Hydrogen for Manufacturing: Newsroom: News: Denso Global Website. Newsroom—News—DENSO Global Website. 2023. Available online: https://www.denso.com/global/en/news/newsroom/2023/20230627-g01/ (accessed on 18 April 2025).
- Campari, A.; Ustolin, F.; Alvaro, A.; Paltrinieri, N. A review on hydrogen embrittlement and risk-based inspection of Hydrogen Technologies. Int. J. Hydrogen Energy 2023, 48, 35316–35346. [Google Scholar] [CrossRef]
- Mohtadi-Bonab, M.A.; Masoumi, M. Different aspects of hydrogen diffusion behavior in Pipeline Steel. J. Mater. Res. Technol. 2023, 24, 4762–4783. [Google Scholar] [CrossRef]
- Kim, M.-S.; Chun, K.W. A comprehensive review on material compatibility and safety standards for liquid hydrogen cargo and fuel containment systems in marine applications. J. Mar. Sci. Eng. 2023, 11, 1927. [Google Scholar] [CrossRef]
- IEA Bioenergy. Biomass Gasification for Hydrogen Production. 2025. Available online: https://www.ieabioenergy.com/blog/publications/biomass-gasification-for-hydrogen-production/ (accessed on 22 April 2025).
- Neom. NEOM Green Hydrogen Company Completes Financial Close at a Total Investment Value of USD 8.4 Billion in the World’s Largest Carbon-Free Green Hydrogen Plant. 2023. Available online: https://www.neom.com/en-us/newsroom/neom-green-hydrogen-investment (accessed on 22 April 2025).
- Wang, Z.; Liu, J.; Huang, F.; Bi, Y.; Zhang, S. Hydrogen diffusion and its effect on hydrogen embrittlement in DP steels with different martensite content. Front. Mater. 2020, 7, 620000. [Google Scholar] [CrossRef]
- Cristello, J.; Dang, Z.; Hugo, R.; Park, S.S. Artificial intelligence-based leak detection in blended hydrogen and natural gas pipelines. Int. J. Hydrogen Energy 2024, 91, 744–764. [Google Scholar] [CrossRef]
- Khaing, M.M.; Yin, S. Lifecycle management of hydrogen pipelines: Design, maintenance, and rehabilitation strategies for Canada’s Clean Energy Transition. Energies 2025, 18, 240. [Google Scholar] [CrossRef]
Disclaimer/Publisher’s Note: The statements, opinions and data contained in all publications are solely those of the individual author(s) and contributor(s) and not of MDPI and/or the editor(s). MDPI and/or the editor(s) disclaim responsibility for any injury to people or property resulting from any ideas, methods, instructions or products referred to in the content. |
© 2025 by the authors. Licensee MDPI, Basel, Switzerland. This article is an open access article distributed under the terms and conditions of the Creative Commons Attribution (CC BY) license (https://creativecommons.org/licenses/by/4.0/).

