Abstract
Algeria’s transition toward sustainable energy requires the exploitation of its abundant solar and wind resources for green hydrogen production. This study assesses the techno-economic feasibility of an off-grid PV/wind hybrid system integrated with a hydrogen subsystem (electrolyzer, fuel cell, and hydrogen storage) to supply both electricity and hydrogen to decentralized sites in Algeria. Using HOMER Pro, five representative Algerian regions were analyzed, accounting for variations in solar irradiation, wind speed, and groundwater availability. A deferrable water-extraction and treatment load was incorporated to model the water requirements of the electrolyzer. In addition, a comprehensive sensitivity analysis was conducted on solar irradiation, wind speed, and the capital costs of PV panels and wind turbines to capture the effects of renewable resource and investment cost fluctuations. The results indicate significant regional variation, with the levelized cost of energy (LCOE) ranging from 0.514 to 0.868 $/kWh, the levelized cost of hydrogen (LCOH) between 8.31 and 12.4 $/kg, and the net present cost (NPC) between 10.28 M$ and 17.7 M$, demonstrating that all cost metrics are highly sensitive to these variations.
1. Introduction
Global energy demand has grown considerably in recent decades, largely as a result of population growth and the increasing needs of the industrial, residential, and transport sectors [1]. By 2040, global electricity consumption is expected to rise by about 57% compared to 2020 [2]. Despite efforts to curb emissions, fossil fuels such as natural gas, coal, and petroleum continue to dominate energy consumption. Between 2015 and 2020, their share decreased slightly by 2.8% after the Paris Agreement, yet they still accounted for 83.1% of global energy use in 2020 [1]. This heavy reliance on fossil fuels contributes directly to greenhouse gas emissions, rising global temperatures, and environmental pollution, creating increasingly complex challenges for sustainable development. Addressing these issues has elevated the need to adopt clean, renewable energy sources as a global priority.
Renewable energy technologies offer environmentally friendly, sustainable, and promising alternatives to conventional fuels [3]. In fact, their utilization has increased significantly in recent years. This growth reflects international commitments, particularly those outlined in the Paris Agreement, to reduce greenhouse gas emissions and mitigate climate change. Among the different renewable resources, solar and wind power have attracted the greatest attention due to their abundance, vast technical potential, and decreasing costs [4]. However, both are inherently intermittent, as electricity generation depends on the availability of sunlight and wind. This intermittency presents challenges for system stability and reliability, particularly in off-grid or decentralized contexts.
Hybrid renewable energy systems (HRESs) address the intermittency of renewables by combining complementary sources such as photovoltaic (PV) and wind power, ensuring a more stable supply [5]. In these systems, solar and wind can offset each other’s fluctuations, with PV panels and wind turbines being the most common technologies. To enhance reliability, storage is essential, with hydrogen increasingly considered a key energy carrier for supporting intermittent resources.
Hydrogen presents major advantages over conventional fuels, including a high energy density of 119.93 MJ/kg, more than twice that of diesel (42.5 MJ/kg) and natural gas (50 MJ/kg) [6]. When used in fuel cells, it reacts with oxygen to produce electricity and only water vapor, without carbon emissions [7,8]. It can also be stored for long periods without degradation [9], offering flexibility to balance variable renewable supply and demand. Since hydrogen does not occur naturally, it must be produced [10]. Water electrolysis, a leading method, splits water into hydrogen and oxygen using electricity but is highly energy intensive [11]. Using surplus renewable energy to power electrolyzers enables the production of “green hydrogen,” preventing waste and providing a clean, storable fuel [12].
Algeria, Africa’s largest country, illustrates these challenges and opportunities. Its electricity demand rose from 75.5 TWh in 2021 to 85.7 TWh in 2023 [13], met largely by natural gas. To diversify, the government launched the National Renewable Energy Program, targeting 22,000 MW of renewable capacity by 2030, mainly solar and wind [14], and in 2023 adopted a National Hydrogen Strategy aiming at 40 TWh annual production by 2040, with 30 TWh for export and 10 TWh for domestic use [15].
Several studies have explored the integration of hydrogen in hybrid energy systems. Al-Sharafi et al. [16] examined solar and wind resources in Saudi Arabia and international sites, showing that replacing conventional battery banks with hydrogen-based storage (electrolyzer, fuel cell, and tank) can improve efficiency. Their analysis revealed that the most cost-effective system was in Yanbu, achieving a minimum levelized cost of energy (LCOE) of 0.609 $/kWh. Similarly, Turkdogan [17] developed a household-scale system integrating electricity and hydrogen loads, with results indicating a competitive energy cost of 0.685 $/kWh and a hydrogen production cost of 6.85 $/kg. In a larger-scale study, Hussam et al. [18] assessed configurations at the Shagaya Renewable Power Plant, concluding that grid-connected systems were the most economical, achieving an LCOE of 0.539 $/kWh and a levelized cost of hydrogen (LCOH) of 6.85 $/kg, while off-grid setups were limited by high capital requirements.
Other researchers compared different hybrid configurations for hydrogen production. Okonkwo et al. [19] highlighted the viability of PV/wind/FC/battery systems for refueling stations in Oman, achieving a net present cost (NPC) of 529,361$, an LCOE of 0.0158 $/kWh, and an LCOH of 0.401 $/kg. In India, Basu et al. [20] showed that combining PV and wind power with hydrogen storage outperformed single-source systems, with the PV/wind/hydrogen option achieving the lowest LCOE of 0.3387 $/kWh. Likewise, Salameh et al. [21] emphasized the importance of system choice in meeting both electrical and industrial hydrogen demands in Neom City, Saudi Arabia, where the PV/generator/battery system achieved an LCOE of 0.4 $/kWh and an LCOH of 21 $/kg.
Beyond household and city-level applications, studies have also explored industrial and transport applications. Di Micco et al. [22] assessed a multi-energy system integrating biogas, wind, and hydrogen for industrial applications and refueling stations, demonstrating that co-production strategies substantially reduced costs, with the LCOE ranging from 0.048 to 0.054 $/kWh and the LCOH from 3.14 to 3.49 $/kg. In Egypt, Al-Orabi et al. [23] confirmed that wind energy, particularly along the Suez Gulf, offers the lowest costs, with the LCOE between 0.308 and 0.353 $/kWh and the LCOH between 3.73 and 4.13 $/kg. Meanwhile, Alcantara et al. [24] evaluated a wind-powered hydrogen system for a bus fleet in Brazil, reporting favorable economic performance with a net present value of 19–22 M$, a payback period of 1–4 years, and an LCOH ranging from 25 to 56 $/MWh. On the residential scale, Ali et al. [25] showed that integrating PV power with hydrogen storage provides a more cost-effective alternative to conventional batteries and diesel generators, as the PV-integrated system demonstrated superior reliability and economic benefits despite higher upfront costs.
Recent years have witnessed growing interest in Algeria’s potential for green hydrogen, supported by HRES. Messaoudi et al. [26] analyzed wind-based hydrogen production using an alkaline electrolyzer with a Vestas-90 turbine, estimating an annual potential of 1.093 Gt under ideal conditions, with the LCOH varying between 1.51 $/kg and 15.37 $/kg. Douak and Settou [27] optimized a PV/wind/FC hybrid system for an off-grid household in Adrar, where the hybrid configuration achieved the lowest total annual cost compared to PV/FC and wind/FC setups, underscoring the economic advantage of hybridization. Expanding to large-scale projects, Tiar et al. [28] identified that 43.55% of Algeria is appropriate for hydrogen facilities, with Djanet emerging as the most promising site for a 100 MW PV/hydrogen plant, achieving an affordable LCOH of 1.96–4.85 $/kg, determined through techno-economic sensitivity analysis. Finally, Haffaf et al. [29] compared eight Algerian sites, finding that Tindouf offered the lowest LCOH of 2.999 $/kg alongside an annual hydrogen production of 11,267 kg, with wind power dominating the energy mix.
Overall, the literature shows that integrating hydrogen into hybrid renewable energy systems (HRESs) improves both technical reliability and economic performance, though outcomes remain highly site-specific. Most prior studies, however, focused on a single location or limited number of sites and overlooked the crucial aspect of water consumption in electrolysis.
This study presents a novel multi-regional techno-economic framework to evaluate off-grid PV/wind–hydrogen systems across five representative Algerian regions. The framework incorporates renewable resource variability through a sensitivity analysis on solar irradiation and wind speed, covering a wide range of resource fluctuations. It also introduces a deferrable water-extraction and treatment subsystem within HOMER Pro to account for the energy required to prepare water for electrolysis, a research gap that has not been adequately addressed in previous studies. Since HOMER Pro does not directly simulate water management, this subsystem is modeled as a deferrable load operating during surplus renewable generation, ensuring realistic coupling between hydrogen production and water availability.
Additionally, the study extends the sensitivity analysis to PV and wind turbine capital costs to examine cost–performance trade-offs and their influence on system feasibility and hydrogen cost. The combined spatial, hydrological, and economic assessment forms the main contribution of this work, offering practical insights for Algeria’s National Hydrogen Strategy and for developing reliable off-grid PV/wind–hydrogen systems in similar arid regions. Table 1 shows the comparison between the present study and previous works from the literature.

Table 1.
Comparison of the present study with previous works from literature.
2. Materials and Methods
2.1. System Description
The HRES examined in this paper is designed to address the electricity and hydrogen needs across decentralized sites in Algeria. This includes evaluating its technical and economic feasibility throughout various regions. The proposed system integrates PV and wind energy resources, in addition to a hydrogen-based energy storage system (Electrolyzer, Fuel Cell, Hydrogen Tank), in order to ensure a reliable and continuous power supply. Hydrogen offers several key advantages, including high energy density and long-term storage, and it is environmentally friendly. Unlike batteries, hydrogen enables seasonal energy storage without significant performance degradation, which makes it notably well-suited for remote off-grid applications; when surplus renewable energy is available, the electrolyzer operates to convert excess electricity into hydrogen, while the fuel cell and hydrogen tank serve as backup sources during periods of low generation, which ensures reliable system performance under varying resource and load conditions. A schematic diagram of the overall system is presented in Figure 1.
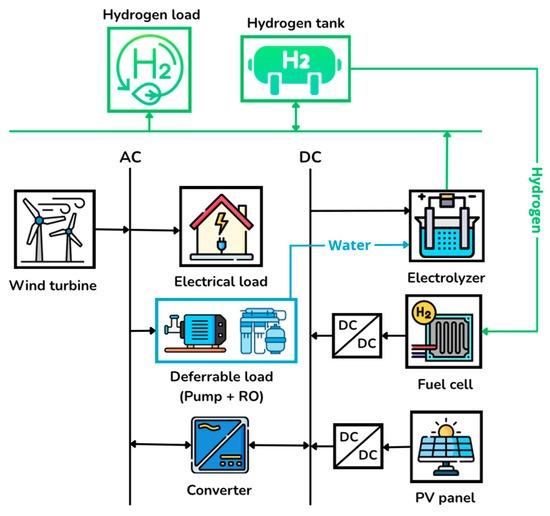
Figure 1.
Schematic diagram of the system.
2.2. Data and Resources
Algeria has great solar potential thanks to its position in the global sunbelt; it receives between 2650 and 3900 h of sunlight annually. In fact, the solar energy available in the Algerian Sahara alone could theoretically satisfy the total energy demand of the European Union, where the solar energy potential of Algeria is estimated at approximately 169,440 TWh per year for solar thermal and over 13.9 TWh per year for photovoltaics [30]. Figure 2 illustrates the distribution of solar potential across the Algerian territory.
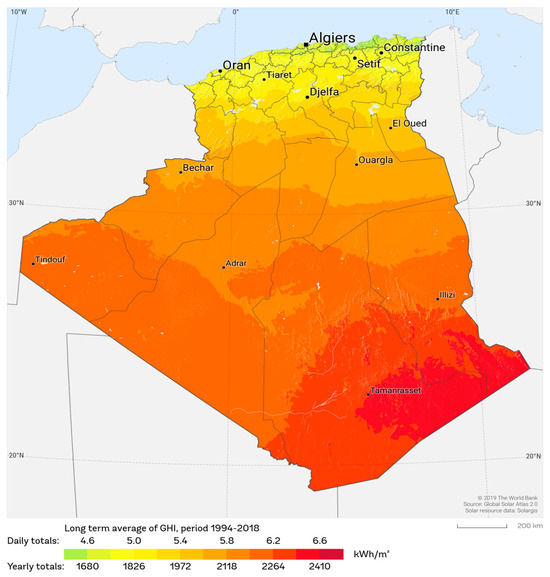
Figure 2.
Global Horizontal Irradiance (GHI) distribution across Algeria [31]. Source: Solar resource map © 2021 Solargis (CC BY-SA 4.0), https://solargis.com (accessed on 28 June 2025).
In terms of wind energy potential, Algeria demonstrates promising conditions, particularly at elevations exceeding 50 m, where wind speeds surpass 5.0 m/s in most places. In certain regions, notably in the southern desert, coastal areas, and highland zones, wind speeds may reach up to 8 m/s. Long-term meteorological data suggest that approximately 50% of the national territory benefits from favorable wind regimes suitable for energy generation [30]. Figure 3 presents the spatial distribution of wind potential across the Algerian territory.
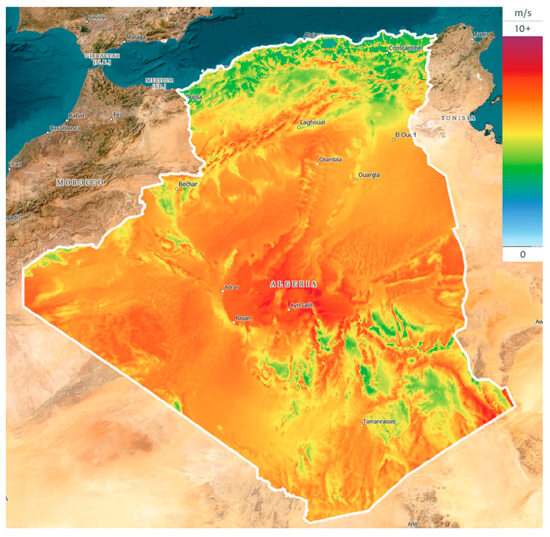
Figure 3.
Wind speed distribution at 50 m elevation across Algeria [32]. Source: Global Wind Atlas Technical University of Denmark (DTU), licensed under CC BY 4.0, https://globalwindatlas.info/en/ (accessed on 28 June 2025).
With regard to green hydrogen production via water electrolysis, Algeria’s considerable groundwater availability offers a strategic advantage, particularly in the southern region, which is underlain by extensive fossil aquifers, which store vast quantities of non-renewable groundwater. The combined water resources of the two principal aquifers in the Algerian Sahara, namely the Complex Terminal and the Continental Interlayer, can supply up to 40,000 billion cubic meters annually [33], whereas northern regions primarily depend on renewable groundwater sources. Figure 4 shows the distribution of groundwater across Algeria.
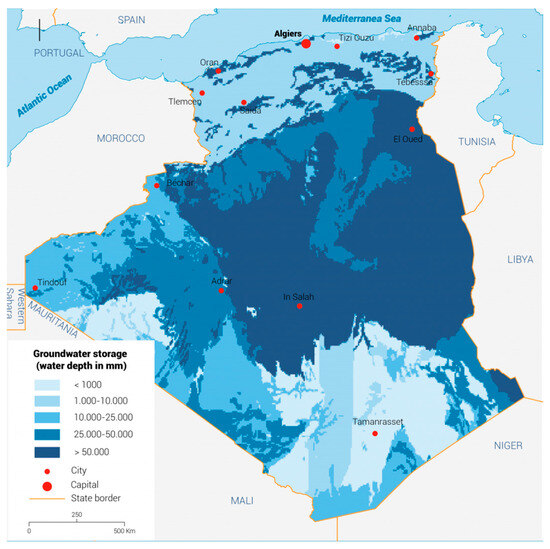
Figure 4.
Groundwater storage distribution across Algeria (source: Fanack Water [33], used with permission) (accessed on 28 June 2025).
To ensure accurate system assessment, the Algerian map was divided into five studied regions based on three key parameters: solar irradiance, wind speed, and groundwater availability. Region 1 is characterized by low solar irradiance, moderate wind potential, and limited groundwater resources. Region 2 shows gradual improvements in both solar and wind resources, along with slightly higher groundwater availability compared to Region 1. Region 3 is distinguished by exceptionally high wind potential, moderate solar irradiation, and considerable groundwater availability. Region 4 combines high solar irradiation with favorable wind conditions and moderate groundwater availability. Finally, Region 5 exhibits the highest solar irradiation across all regions, variable wind potential, and limited groundwater resources. A techno-economic optimization study was then conducted for each region. Initially, the system was simulated without the deferrable load to estimate the annual hydrogen demand for each region. From a theoretical standpoint, generating 1 kg of hydrogen using electrolysis necessitates around 9 kg of purified water [34]. The annual water requirement was calculated for each region accounting water losses from purification. Subsequently, the average daily energy requirements for groundwater extraction and reverse osmosis were estimated based on average groundwater depths in each region from reference [35] and the corresponding daily water demand for each region. Then, all were included in the deferrable load. Figure 5 shows the studied regions.
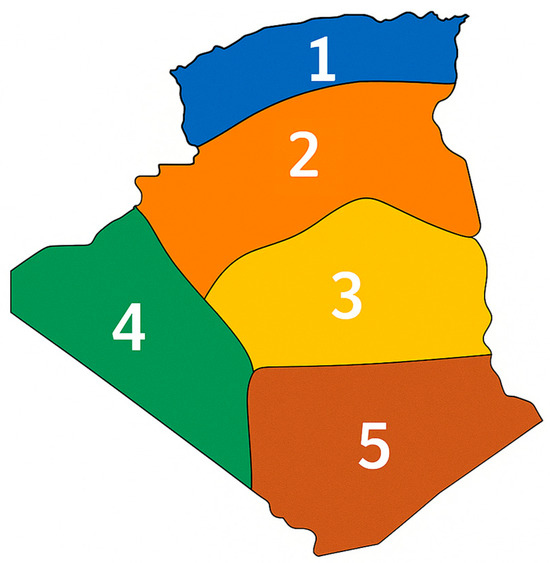
Figure 5.
Illustration of the five studied regions considered in the work.
2.3. Electricity, Hydrogen, and Water Requirements
Three distinct load profiles were developed to comprehensively represent the system’s multifaceted energy demands. The first profile related to the electrical load, reflecting the baseline energy consumption required to support general system operations. The electrical load profile was generated based on typical rural microgrid consumption patterns available in HOMER Pro and adjusted to reflect regional microgrid electricity consumption in Algeria. This representation ensures realistic coupling between renewable generation and demand. The estimated electrical load is presented in Figure 6.
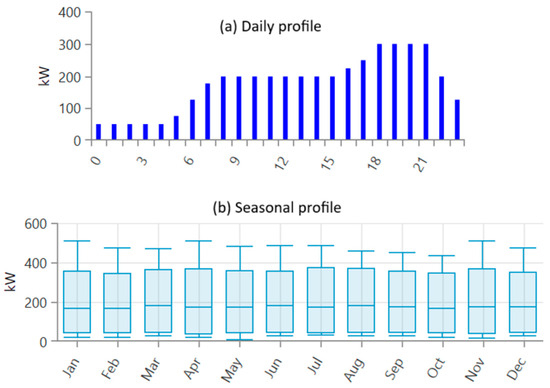
Figure 6.
Electrical requirements of the system: (a) daily profile; (b) seasonal profile.
The second profile addresses the hydrogen load, which was defined based on projected daily hydrogen production rates in each region, according to region-specific groundwater availability, under the assumption that areas with greater water resources can sustain higher hydrogen production capacities; the hydrogen daily needs are depicted in Table 2.

Table 2.
Daily hydrogen demand.
The associated water demand accounts for the energy required to extract and purify groundwater through reverse osmosis, based on [36]; RO consumes between 3 and 6 kWh per cubic meter of groundwater treated and results in around 15 to 25% of water loss during the purification process. The energy needed for groundwater pumping is calculated using Equation .
where is the energy required for groundwater extraction, stands for water density, is the gravity, volume of water needed, and denotes for pump’s efficiency. Table 3 summarizes the parameters utilized in calculating the energy requirements for both groundwater pumping and purification.

Table 3.
Parameters used in the deferrable load.
The water subsystem, which includes groundwater extraction (pumping) and treatment (purification) for electrolyzer supply, was modeled in HOMER Pro as a deferrable electrical load. This allows the process to be scheduled according to renewable energy availability, operating during high-generation periods and deferred during low-generation periods, thus improving the utilization of intermittent renewable resources.
2.4. Sensitivity Analysis
Sensitivity analysis was performed in order to evaluate the impact of variations in key renewable energy resources on system performance across Algeria. The analysis concentrates on two primary parameters: solar irradiation and wind speed, represented by their scaled annual average values. For each region, the minimum and maximum observed values were used to define the range of variation. In addition, the sensitivity analysis was expanded to assess the influence of PV and wind turbine capital costs on overall system design. Table 4 outlines the parameters applied in the sensitivity analysis.

Table 4.
Input parameters for sensitivity analysis.
2.5. System Components
Technical and economic parameters for each component were derived from the peer-reviewed literature to ensure that the selected values reflect realistic operating conditions and currently available technologies [18,19,22]. These values were adjusted to match Algerian climatic and market conditions, providing a realistic representation of system performance, and capital and replacement costs were assumed to be identical.
2.5.1. PV Panels
PV panels are typically composed of multiple photovoltaic cells interconnected in series or parallel configurations and serve to convert solar energy into electrical energy. The output power of the PV panel can be presented in Equation .
where stands for the incident solar irradiation on the PV panel, while denotes the incident solar irradiation under standard test conditions, stands for the rated capacity of the panel, and is the derating factor accounting for system losses. refers to the PV cell temperature, while represents the reference cell temperature under standard conditions. The term is the temperature coefficient of power. The technical and economical parameters of the PV panels are shown in Table 5.

Table 5.
Technical and economical parameters of the PV panel.
2.5.2. Wind Turbine
A wind turbine converts wind energy into mechanical energy through the rotation of the turbine blades, which drive the rotor. The mechanical energy from the rotating blades is then transformed into electrical energy by a generator. The electrical power generated from a wind turbine is determined using a characteristic curve delivered by the manufacturers. This curve relates wind speed at a given hub height to the corresponding power output [16,18]. The correlation between the wind speed and the hub height is outlined in Equation .
represents the wind speed at the hub height named , where is the wind speed value at a given height reference called and stands for the ground surface friction coefficient. The output power of the wind turbine is given by utilizing curve fitting techniques on the wind turbine’s characteristic curve using Equation .
where represents the power generated by the wind turbine at a given wind speed at the hub height, and stand for the wind turbine’s cut-in and cut-out speeds, respectively, and and represent intermediate wind speed values applied to refine the curve fitting. The technical and economical parameters of the wind turbine are shown in Table 6.

Table 6.
Technical and economical parameters of the wind turbine.
2.5.3. Electrolyzer
An electrolyzer serves to produce hydrogen through the electrolysis of water, where water molecules are decomposed into hydrogen and oxygen gases using electricity, as represented Equation .
There are three primary types of electrolyzers named: alkaline electrolyzers, proton exchange membrane (PEM) electrolyzers, and solid oxide electrolysis cells (SOECs). For this study, a PEM electrolyzer has been selected due to its high efficiency and its adaptability with renewable energy sources. The technical and economical parameters of the electrolyzer are shown in Table 7.

Table 7.
Technical and economical parameters of the electrolyzer.
2.5.4. Fuel Cell
A PEM fuel cell has been selected for the system, as it is an electrochemical device designed to convert the chemical energy of a fuel (hydrogen in our case) into electricity. It operates in reverse compared to the electrolyzer: hydrogen and oxygen are combined to produce water as the byproduct while generating electricity. This process can be expressed using Equation .
In this work, both the electrolyzer and the fuel cell are represented by fixed conversion efficiencies corresponding to nominal operating conditions. This simplified modeling approach is appropriate for system-level techno-economic assessments but does not account for nonlinear polarization behavior or long-term degradation. The technical and economical parameters of the fuel cell are depicted in Table 8.

Table 8.
Technical and economical parameters of the fuel cell.
2.5.5. Hydrogen Tank
A hydrogen storage tank has been integrated to store the generated hydrogen during periods of solar and wind energy surplus; some of the stored hydrogen can then be utilized in times of energy demand by feeding it into a fuel cell to generate electricity. The technical and economical parameters of the hydrogen tank are illustrated in Table 9.

Table 9.
Technical and economical parameters of the hydrogen tank.
2.5.6. Converter
The converter transforms direct current (DC) into alternating current (AC) and the reverse. It also plays a crucial role in rectifying excess energy generated, ensuring that surplus power can be effectively managed. The converter power consumption can be written using Equation
is the output power of the converter, represents the required load, and is the converter efficiency. The converter capacity can be given by Equation
where denotes the rated capacity of the converter and represents the peak load. The technical and economical parameters of the converter are presented in Table 10.

Table 10.
Technical and economical parameters of the converter.
2.6. Techno-Economic Optimization Analysis
Techno-economic optimization aims to determine the most cost-effective configuration of a system that meets energy demand while minimizing overall costs. It involves simulating different system setups and calculating key economic indicators including net present cost (NPC), levelized cost of energy (LCOE), and levelized cost of hydrogen (LCOH) to compare their performance, in order to select the design that best balances technical reliability with lowest cost. In this study, HOMER Pro version 3.14.2 performs the optimization by following a structured approach as shown in Figure 7, evaluating various combinations to identify the most suitable system design.
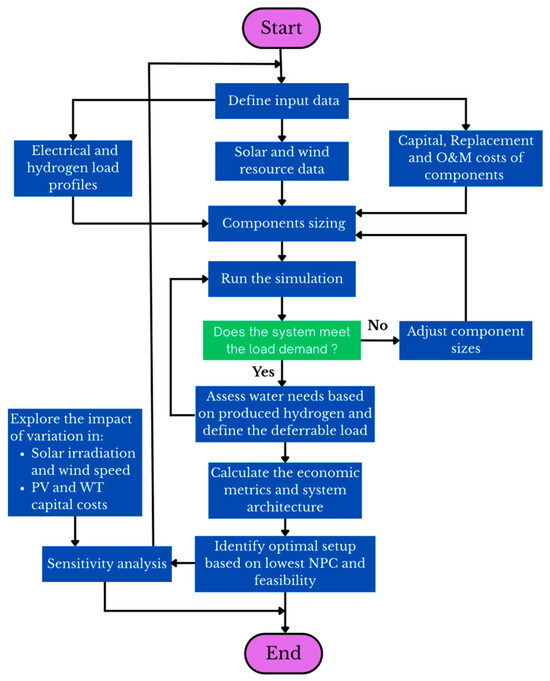
Figure 7.
Flowchart showing the optimization methodology of the system.
Net present cost (NPC) refers to the overall cost of the system over its operational lifetime, encompassing capital costs, replacement costs, and maintenance costs. It is a critical metric in HOMER Pro for evaluating system feasibility and optimization. A lower NPC indicates a more cost-effective system design. HOMER Pro calculates the NPC through Equation
where denotes the total annual cost, which can be calculated using Equation
where , , and are the capital, replacement, and operating and maintenance costs, respectively, while represents the salvage value. stands for the capital recovery factor, it is expressed by Equation
where
stands for the annual interest rate and represents for the system’s lifetime, is the nominal interest rate and represents the inflation rate.
Levelized cost of energy (LCOE) stands for the average cost per kWh of utilizable electrical energy delivered from the system throughout its lifetime. It can be given using Equation
is the total served electrical load during the year. It can be expressed as the sum of the AC primary load served, DC primary load served, and deferable load served during the year, expressed by , , and , respectively, in addition to the energy sold to the grid annually, given as . The total electrical load can be calculated using Equation
Levelized cost of hydrogen (LCOH) represents the average cost of producing one kilogram of hydrogen throughout the system’s lifetime. It encompasses all costs related to hydrogen production from the electrolyzer. The LCOH can be calculated using Expression
where is the total amount of hydrogen produced.
3. Results and Discussion
3.1. Techno-Economic Optimization Results
The following section presents the key findings from the techno-economic optimization study of the system. Table 11 summarizes the results, detailing the optimal sizing of system components including the PV panels, wind turbine, electrolyzer, fuel cell, hydrogen tank, and converter across the five studied regions. The optimization outcomes reveal that component sizing is significantly affected by the spatial variability of solar and wind resources and hydrogen demand. Regions with favorable solar irradiation tend to prefer larger PV systems, while improvements in wind conditions are reflected in the increased integration of wind turbines while minimizing the PV system size in global system configurations. The sizes of the electrolyzer and fuel cell remain relatively consistent across the regions, while hydrogen tank size varies based on two main factors: higher hydrogen demand in the region or insufficient solar and wind resources to meet electricity needs, meaning that more hydrogen is needed to supply the fuel cell, resulting larger storage capacity requirements. The converter size also varies depending on the system architecture and the balance between AC and DC, which affects the amount of power that needs to be converted.

Table 11.
Optimal system sizing across the five regions.
Figure 8 illustrates the annual electricity generation by source—photovoltaic, wind turbine, and fuel cell—across the five studied regions. Region 1 relies primarily on PV power due to limited wind availability, which increases dependence on the fuel cell to meet electricity demand. In Region 2, a more balanced contribution from PV and wind energy minimizes the need for energy storage, thereby reducing reliance on the fuel cell. Region 3 benefits from favorable wind conditions, with PV and wind energy contributing almost equally, resulting in the lowest fuel cell utilization among all regions. Similarly, Region 4 exhibits a balanced mix of PV and wind energy, leading to moderate fuel cell use. Moreover, the annual electricity production in this region is lower, owing to the considerable renewable energy potential and relatively low hydrogen demand. Region 5 tends to be similar to Region 1: the dominance of PV energy and limited wind potential necessitate a greater contribution of the fuel cell in maintaining energy supply. However, the higher solar potential in this region contributes to a reduction in overall electricity production compared to Region 1.
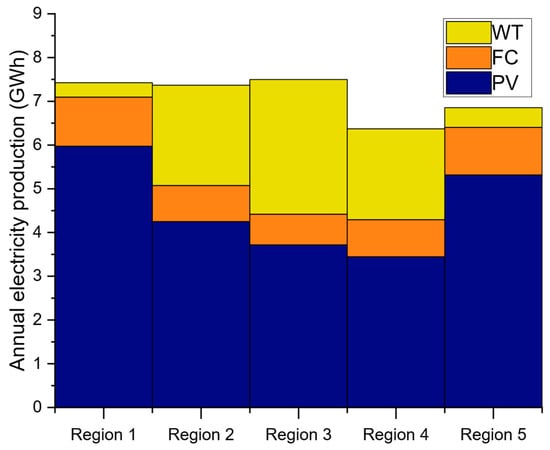
Figure 8.
Annual electricity output by source in each region.
The selection of system components is also influenced by economic considerations; despite the fact that wind turbines offer higher efficiency in regions with favorable wind conditions, their higher capital cost compared to PV panels presents a notable constraint on overall system architecture. Figure 9 illustrates the distribution of the NPC of system components across the five studied regions. In Region 1, PV panels dominate the NPC due to their large installed capacity, which compensates for the region’s low wind potential. Consequently, the NPC contribution from wind turbines is minimal due to their limited deployment. In contrast, Region 2 shifts toward wind energy, with a significant increase in wind turbine capacity resulting in the highest wind turbine NPC among all regions, while that of PV panels decreases due to reduced capacity. Region 3 has high wind potential, moderate solar irradiation, and considerable groundwater availability, which is reflected in a larger wind turbine capacity resulting in an increase in its NPC relative to PV power, along with an increase in the hydrogen tank NPC due to higher hydrogen demand. Similarly, Region 4 exhibits a well-balanced system with moderate PV and wind capacities, leading to relatively stable and lower NPCs for most components. Region 5 returns to a PV-dominated setup with minimal wind turbine sizing, which reduces its NPC. The electrolyzer NPC tends to increase with higher PV NPC values, while it decreases with increasing wind turbine NPC, reflecting the system’s reliance on hydrogen storage. The fuel cell cost remains relatively consistent across all regions due to its nearly uniform sizing. However, a slight decrease is observed in Region 3 due to reduced storage requirements, while an increase is noted in Region 5 as a result of higher storage needs, whereas the NPCs of the hydrogen tank and converter vary proportionally according to the system’s storage and conversion demands.
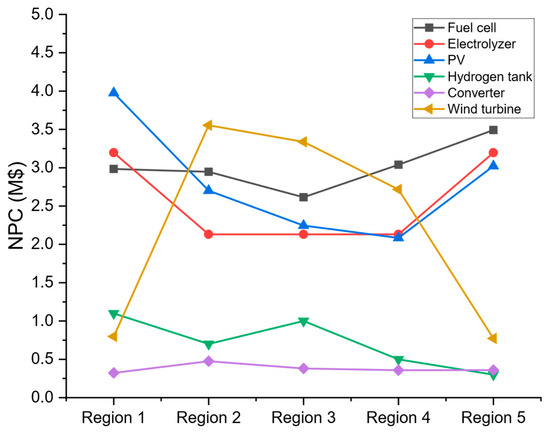
Figure 9.
Comparative NPCs across the five studied regions.
Figure 10 shows the annual hydrogen production alongside groundwater consumption across the five studied regions. As groundwater serves to feed the electrolyzer, its consumption directly correlates with hydrogen production. Within the system, hydrogen is utilized as am energy storage medium as well as a source of green hydrogen dedicated to domestic applications. Region 1 has the lowest hydrogen demand but records the highest hydrogen production. This is primarily due to limited solar and wind resources in this region, which necessitate increased hydrogen generation for energy storage to ensure a stable electricity supply. Region 5 is also characterized by low wind potential and low hydrogen demand, but unlike Region 1 it benefits from significant solar potential, which allows it to meet most of its energy needs through PV generation, reducing reliance on hydrogen storage. In contrast, Region 2 benefits from better solar and wind resources than Region 1, resulting in reduced reliance on hydrogen storage, which reflects the lower hydrogen production and small tank size. Region 3 has the highest hydrogen demand, supported by significant groundwater availability, which enables higher hydrogen production to meet both storage and domestic needs. Region 4 shows the lowest hydrogen production levels due to favorable renewable resources and low hydrogen demand.
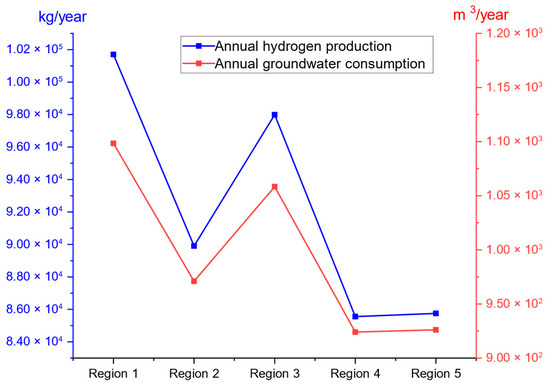
Figure 10.
Comparison of hydrogen production and groundwater consumption across regions.
Figure 11 exhibits the variation in the economic indicators NPC, LCOE, and LCOH across the five studied regions. Region 1 shows relatively high NPC and LCOE values, mainly due to the large PV capacity required to compensate the limited solar and wind resources, while the LCOH stays moderate since hydrogen is produced in high amounts to support electricity supply, even though the demand is low. In Region 2, the highest values for all three metrics are recorded, which is due to the increased wind turbine capacity, leading to a higher NPC and LCOE, while low hydrogen production results in an elevated LCOH, whereas Region 3 shows more balanced values across all metrics, due to favorable solar resources, strong wind potential, and high hydrogen demand, which contribute to a moderate NPC and LCOE. Meanwhile, the increase in hydrogen production reduces the LCOH. Region 4 achieves the lowest NPC and LCOE, benefiting from favorable solar and wind resources and reduced hydrogen requirements, whereas LCOH shows slight increase due to low hydrogen production. Finally, Region 5 exhibits the lowest LCOH, attributed to minimal hydrogen demand and high solar potential, which reduces the need for energy storage and results in lower values of the NPC and LCOE.
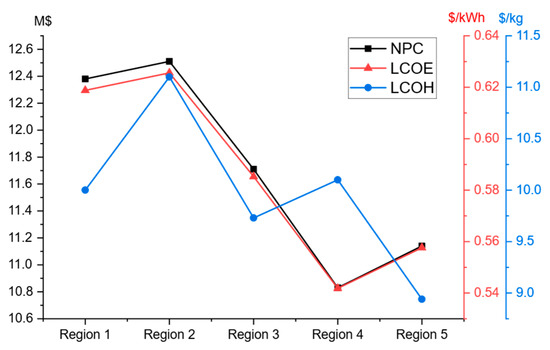
Figure 11.
NPC, LCOE, and LCOH comparison by region.
3.2. Sensitivity Analysis Results
3.2.1. Influence of Solar and Wind Resources
This section presents a sensitivity analysis aiming to examine the influence of fluctuations in solar irradiation and wind speed on several system parameters. The primary focus is on the sizing of photovoltaic and wind turbine capacities across five studied regions. The analysis considers four scenarios for each region, reflecting different combinations of scaled annual averages of solar irradiation and wind speed. Figure 12 illustrates the influence of these parameters on the total PV/wind system size and the contribution of each energy source.
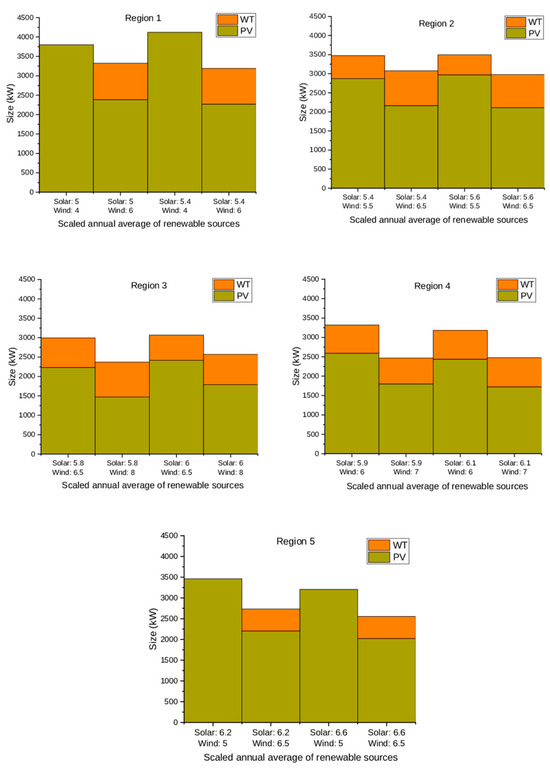
Figure 12.
PV and WT sizing across five studied regions under varying solar irradiation (kWh/m2), and wind speed (m/s).
In Region 1, the increase in wind speed results in greater wind turbine (WT) capacity and a corresponding reduction in PV size, leading to a decrease in the overall system size. Under conditions of low wind availability, the system relies entirely on PV resources, whereas increases in both solar and wind resources lead to the lowest observed system size. Region 2 displays less pronounced variation in system size across the different cases. WT is present in all scenarios, with incremental increases in its capacity correlating with higher wind speeds, and overall, system size exhibits small changes. In Region 3, improvements in wind speed significantly increase WT capacity. In scenario 2 WT capacity nearly matches that of PV, and the total system size shows a significant reduction. Region 4 is similar to Region 3: enhanced wind resources contribute to increased WT sizing and a reduction in overall system capacity. For instance, the total system size in scenario 2 is lower than the PV capacity alone in scenario 1, confirming the beneficial impact of wind resource improvement on system design. Region 5 exhibits patterns similar to Region 1 but with generally higher solar irradiation, and the system relies more heavily on PV power, particularly in scenarios 2 and 4.
In order to investigate how the system performs economically under varying resource conditions, NPC, LCOE, and LCOH were analyzed across different levels of solar irradiation and wind speed. Figure 13 and Figure 14 illustrate the variation in NPC and LCOE, respectively, across the five studied regions. Both indicators show a similar trend, with the highest values occurring under scenarios with low solar and wind resources. This is primarily due to the increased system sizing required to ensure supply reliability, which raises capital costs and overall NPC. At the same time, lower renewable availability limits electricity generation, leading to higher LCOEs as the cost is distributed over a smaller output. As solar irradiation improves, both the NPC and LCOE tend to decline slightly, and changes in wind speed show a more noticeable impact. In regions such as Region 3, which possess the highest wind potential, increases in wind speed result in more pronounced reductions in both the NPC and LCOE.
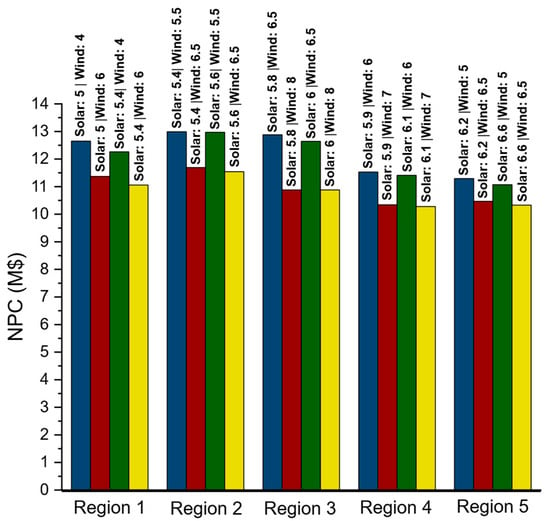
Figure 13.
NPC variation across the five studied regions under different solar irradiation (kWh/m2), and wind speed (m/s).
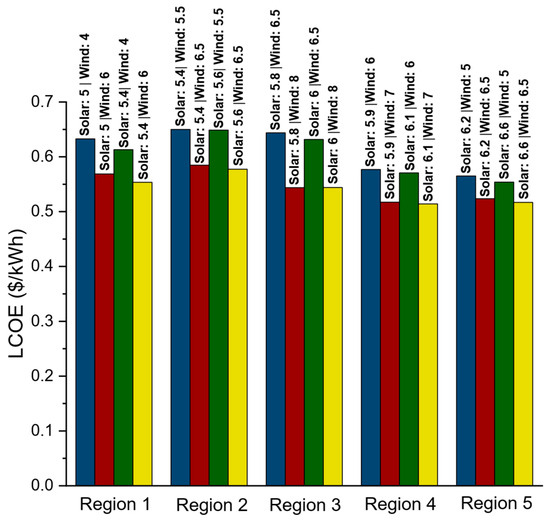
Figure 14.
LCOE variation across the five studied regions under different solar irradiation (kWh/m2) and wind speed (m/s).
Unlike the NPC and LCOE, the LCOH exhibits distinct behavior, as shown in Figure 15, which presents its variation across the five studied regions. In Regions 1 and 5, increasing reliance on wind energy leads to a noticeable rise in the LCOH, primarily due to the low wind potential and high capital cost of wind turbines, which constrain the cost-effectiveness of wind power. Region 1, which has moderate solar resources, shows a remarkable increase in LCOH as wind input increases. In contrast, Region 5 demonstrates lower LCOH values compared to Region 1, attributed to its higher solar irradiation. The greater solar availability in Region 5 reduces reliance on energy storage, resulting in the lowest LCOH values among all regions. Region 2 has slightly better wind conditions than Regions 1 and 5 and exhibits less variation in the LCOH, suggesting a more balanced contribution from both wind and solar resources. Conversely, Regions 3 and 4 display a declining trend in LCOH with increasing wind potential. This trend is particularly evident in Region 3, where the LCOH decreases consistently as both solar irradiation and wind speed rise, reaching its smallest value when both resources are at their highest levels, reflecting the strong wind potential in this region. Region 4 shows a similar pattern with respect to wind, where the LCOH continues to increase with higher solar irradiation.
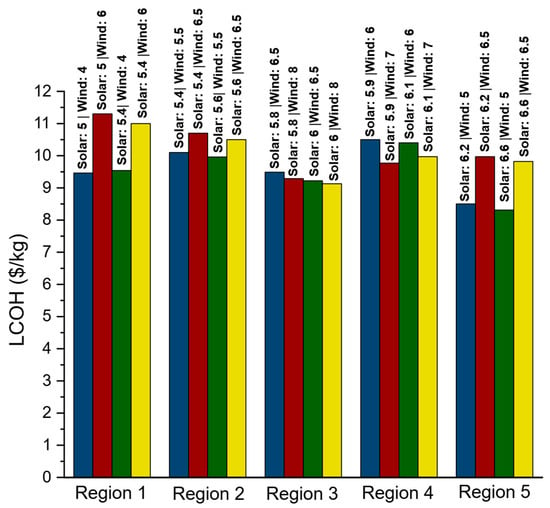
Figure 15.
LCOH variation across the five studied regions under different solar irradiation (kWh/m2) and wind speed (m/s).
Annual electricity and hydrogen production are also significantly affected by variations in resource availability, primarily due to the need to meet energy demand through PV panels and WTs, as well as to support hydrogen production for energy storage requirements. Figure 16 presents contour plots illustrating the impact of solar irradiation and wind speed on annual electricity production across the five studied regions. In Regions 1, 2, and 3, electricity generation increases with increasing solar irradiation. However, the influence of wind speed varies across these regions. The highest production levels are consistently observed in the bottom-right corner of the plots, corresponding to elevated solar irradiation and low wind speeds. In Region 1, the electricity production remains relatively stable when both resources increase. At higher wind speed values, the contour lines become almost flatter, indicating that further increases in solar irradiation yield negligible increases in electricity generation, which is likely due to system sizing, whereby higher wind speeds lead to a gradual reduction in system size, resulting a decrease in total electricity output. In Region 2, the contour patterns at low solar irradiation levels are comparable to those observed in Region 1. However, beyond a certain threshold the lines slope downward, reflecting a reduction in electricity generation. The threshold tends to shift toward lower solar irradiation values with increasing wind speed. In Region 3, electricity production displays a more uniform pattern. At low levels of solar irradiation and wind speed, the contour lines resemble those in Regions 1 and 2. However, unlike these regions, the generation remains stable as both resources increase, with no decline at higher wind speeds. Instead, a slight increase is observed due to the favorable wind potential in the region. Regions 4 and 5 exhibit distinct patterns, with maximum annual electricity production consistently located along the lower portion of the contour plots, tending toward the left, where both solar irradiation and wind speed show minimum values. In Region 4, electricity production initially decreases with increasing solar irradiation, but it begins to rise beyond a certain threshold, which shifts toward lower levels of solar irradiation as wind speed increases. Region 5 demonstrates the most uniform behavior among all regions, with electricity production consistently declining as solar irradiation and wind speed increase. This trend is primarily attributed to the high levels of solar irradiation, which reduce the need for energy storage, in addition to the low hydrogen demand and the relatively small electrolyzer size, which further limit electricity needs.
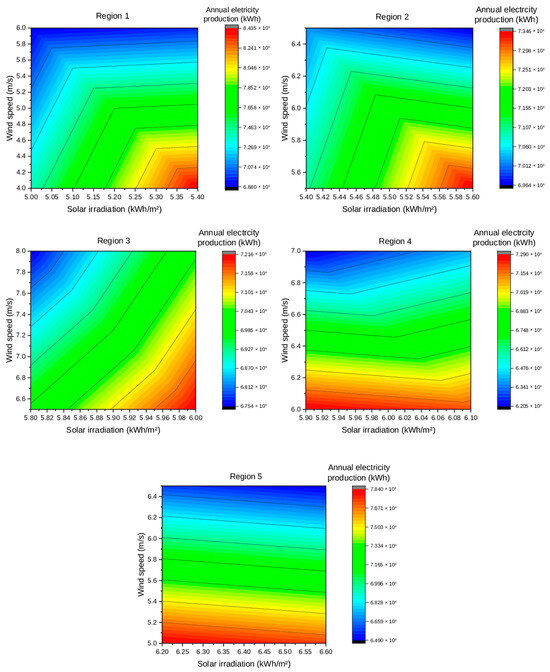
Figure 16.
Variation in annual electricity production with increasing renewable resource availability.
Figure 17 illustrates the influence of solar irradiation and wind speed on annual hydrogen generation across five studied regions. In Region 1, hydrogen output reduces as both solar irradiation and wind speed increase, and the maximum hydrogen production can be found in the bottom-left corner of the contour plot, corresponding to low resource availability and higher energy storage requirements. Beyond a certain point, hydrogen production stabilizes, even with further increase in solar irradiation; that point shifts toward lower solar values as wind speed increases. Regions 2 and 3 exhibit almost similar profiles, with peak hydrogen production occurring in the bottom-right corner of the contour plots. In Region 2, a modest increase in hydrogen output is observed with rising solar irradiation, while as wind speed increases the production tends to stabilize, particularly at higher wind values, where hydrogen output remains nearly constant despite variations in solar irradiation. In Region 3, the contour lines gradually decrease from the top-left to the bottom-right, indicating that hydrogen production increases with rising solar irradiation but decreases uniformly with higher wind speeds. When both solar irradiation and wind speed increase simultaneously, the production remains relatively stable. Regions 4 and 5 exhibit the highest hydrogen production along the bottom of the contour plot. In Region 4, hydrogen production remains relatively stable at low wind speeds, with minimal response to changes in solar irradiation. As wind speed increases, a turning point emerges where hydrogen production begins to decline. This point gradually shifts to lower irradiation values as wind speed continues to rise. Region 5 exhibits a gradual decrease in hydrogen production from the top to the bottom, forming the most uniform pattern among all regions, with hydrogen production remaining relatively constant, showing slight increase with increasing solar irradiation and decreasing linearly as wind speed increases.
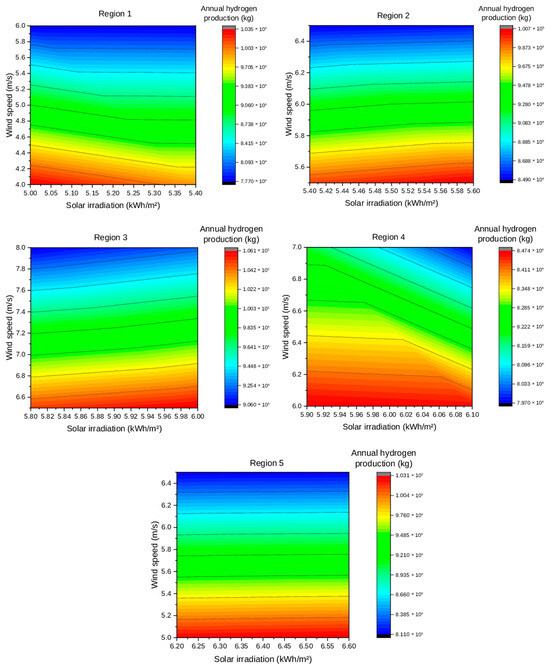
Figure 17.
Variation in annual hydrogen production with increasing renewable resource availability.
3.2.2. Influence of PV and WT Capital Costs
In this section, the impact of PV and WT capital costs on various system outputs is examined, including annual electricity and hydrogen production, PV and WT sizing, and the economic metrics NPC, LCOE, and LCOH. Region 3 was selected as the case study owing to its favorable solar and wind conditions, in addition to its adequate water availability. For this purpose, a sensitivity analysis was performed on the capital costs of PV panels and WTs by applying three multiplying factors (mf): 0.5, 1, and 1.5, representing a 50% decrease, baseline value, and a 50% increase, respectively. Figure 18 illustrates the variation in annual electricity and hydrogen production under different combinations of PV and WT capital costs, using the multiplying factors. In the first three columns, PV costs are reduced by 50% (mf = 0.5), resulting in the highest levels of electricity and hydrogen production overall. The first column, where WT’s multiplying factor is taken as 0.5, exhibits a balanced contribution from PV panels and WTs, and relatively low hydrogen output. When WT cost is increased to its baseline (mf = 1), electricity production increases due to higher PV output, and hydrogen production rises slightly. At the highest WT cost (mf = 1.5), WT contribution drops sharply, PV production remains nearly unchanged, and hydrogen output increases significantly, alongside greater electricity generation from FC, reflecting more reliance on stored hydrogen. In the next set, where PV cost is at baseline (mf = 1), the lowest WT cost (mf = 0.5) causes an increase in WT electricity and a drop in hydrogen production as storage needs reduce. When WT cost rises, PV output increases further, boosting total electricity and hydrogen generation. At the highest WT cost, electricity generation declines while hydrogen output rises notably. The final three columns correspond to the highest PV cost (mf = 1.5). In the first column when both PV and WT costs are equal (1500 kW/$), WT dominates the electricity production while PV’s contribution drops significantly and hydrogen output shows low values. At baseline WT cost, PV and WT contribute similarly, but hydrogen production drops further. Finally, when both PV and WT costs have mf = 1.5 PV, generation increases slightly, WT declines, and hydrogen production increases sharply, implying greater storage use when wind energy declines.
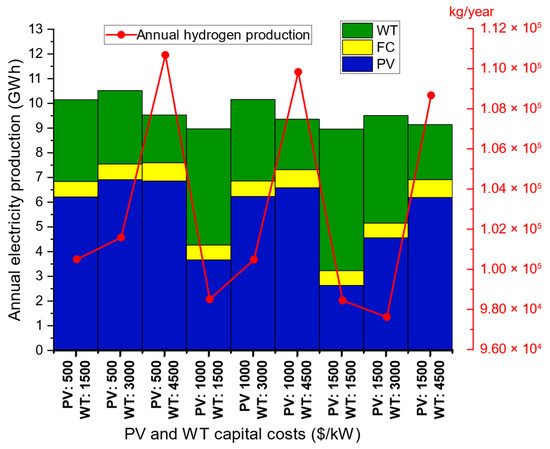
Figure 18.
Variation in annual electricity and hydrogen production with capital cost increasing in Region 3.
System sizing is highly influenced by the capital costs of key components, particularly PV and WT, as they are responsible for delivering energy to the overall system. Figure 19 illustrates how PV system size varies with changes in PV and WT capital costs. The contour plot reveals that the largest PV capacities are observed in the top-left region, where PV costs are low and WT costs are relatively high. This reflects a clear preference for PV deployment when it becomes the more economically attractive option. As PV capital cost increases, the corresponding PV sizing steadily declines, reaching minimum values in the bottom-right region, where WT becomes more cost-competitive. Notably, when WT capital cost exceed the baseline value and PV capital cost remain under its baseline, the PV sizing remains relatively stable, showing limited sensitivity to further increases in WT capital cost.
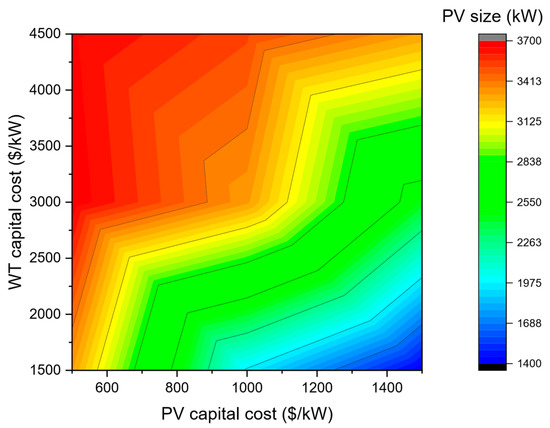
Figure 19.
Variation in PV size with PV and WT capital costs.
Figure 20 shows how WT system size responds to variations in PV and WT capital costs. The contour plot indicates that the highest WT capacities are concentrated in the bottom-left region, where WT costs are low and PV costs are high. In contrast to the distribution in PV sizing, the area of maximum WT deployment is more localized. As WT costs rise, WT capacity progressively decreases, reaching its lowest values approximately around mf = 1.5. In this area, changes in PV cost have minimal influence on WT sizing.
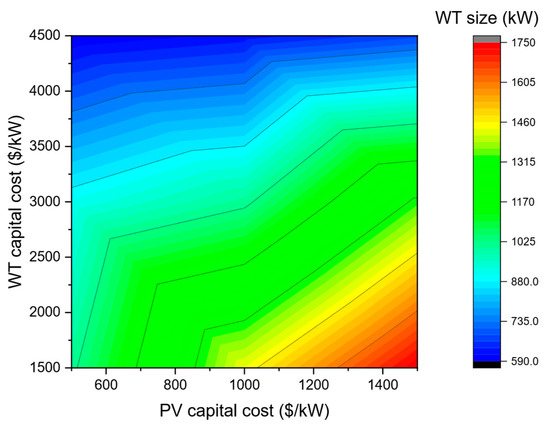
Figure 20.
Variation in WT size with PV and WT capital costs.
Economic metrics such as NPC, LCOE, and LCOH respond sensitively to changes in PV and WT capital costs. Figure 21 and Figure 22 present contour plots of NPC and LCOE, respectively, as functions of PV and WT capital costs. Both plots exhibit similar contour patterns, with cost values increasing gradually from the bottom-left to the top-right corners, indicating that the lowest NPC and LCOE values are achieved when both PV and WT capital costs are at their minimum (mf~0.5), whereas the highest cost values occur when both costs reach their maximum (mf~1.5).
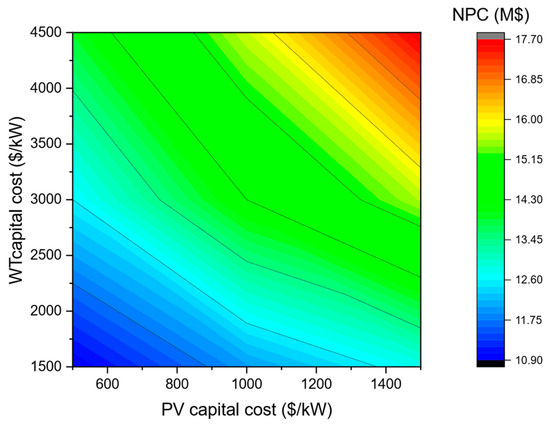
Figure 21.
Variation in NPC with PV and WT capital costs.
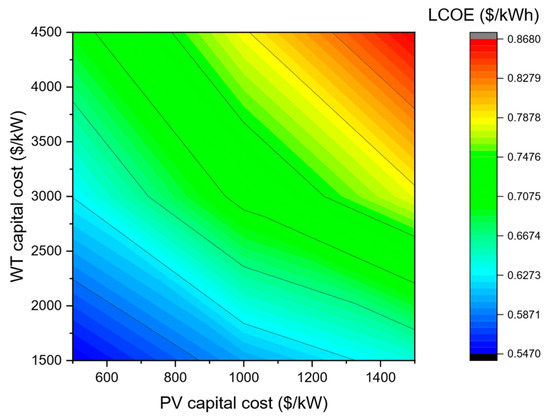
Figure 22.
Variation in LCOE with PV and WT capital costs.
Unlike the NPC and LCOE, the LCOH exhibits a distinct contour pattern, which is exhibited in Figure 23, where the highest values are concentrated in the upper-right area, beyond the baseline WT cost and at the maximum PV cost (mf~1.5). This reflects that when the PV capital cost approaches its upper values, the LCOH becomes insensitive to further increases in WT cost. Conversely, the minimal LCOH values emerge in the bottom-left corner, where both PV and WT capital costs remain at their minimum values.
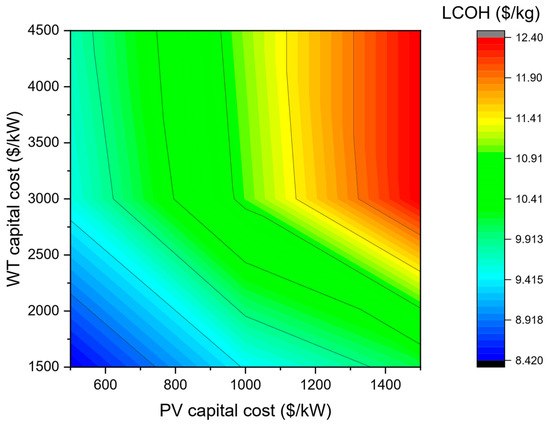
Figure 23.
Variation in LCOH with PV and WT capital costs.
4. Conclusions
This study presented a comprehensive techno-economic feasibility assessment of off-grid hybrid PV/wind–hydrogen systems designed to supply electricity and hydrogen to decentralized sites in Algeria. Using HOMER Pro, five representative regions were analyzed based on their renewable resource potential and groundwater availability. The proposed system combined PV panels and wind turbines with a hydrogen subsystem comprising an electrolyzer, hydrogen storage tank, and fuel cell. In addition, a deferrable load representing groundwater extraction and purification was incorporated to reflect the water requirements of local hydrogen production.
The optimization results indicated that the levelized cost of energy (LCOE) ranged from 0.514 to 0.868 $/kWh, while the levelized cost of hydrogen (LCOH) varied between 8.31 and 12.4 $/kg, and the net present cost (NPC) ranged from 10.28 M$ to 17.7 M$, depending on regional renewable resource profiles and costs. The sensitivity analysis conducted on renewable resources and the capital costs of PV and wind turbines demonstrated a strong influence of these parameters on the cost metrics, highlighting their high variability.
Across the studied regions, variations in climate and renewable resource availability led to distinct differences in system sizing, hydrogen production, and economic performance. Regions with higher solar potential favored PV-based generation, while wind-dominant areas achieved reduced hydrogen storage needs and lower LCOE. These findings emphasize the importance of regional resource assessment in designing cost-effective and resilient hybrid energy systems.
Overall, the results demonstrate that hybrid PV/wind–hydrogen systems are technically and economically viable for decentralized energy supply in Algeria. The study’s novelty lies in its multi-regional framework, which simultaneously integrates renewable resource variability, groundwater availability, and deferrable water-extraction and purification loads within HOMER Pro simulations, an aspect that has not been addressed in previous works.
Future work will focus on extending the analysis by incorporating component degradation, system lifetime, and load variation effects, in order to enhance the reliability and practical applicability of the proposed system.
Author Contributions
Conceptualization, A.B., N.L. and M.A.; methodology, A.B., N.L. and M.A.; software, A.B.; validation, A.B., M.A., D.C. and N.L.; formal analysis, A.B., N.L. and M.A.; investigation, A.B.; resources, M.A.; data curation, A.B.; writing—original draft preparation, A.B., N.L. and M.A.; writing—review and editing, A.B., N.L. and M.A.; visualization, M.A., D.C. and N.L.; supervision, M.A. and N.L.; project administration, M.A. and N.L. All authors have read and agreed to the published version of the manuscript.
Funding
This research received no external funding.
Data Availability Statement
The original contributions presented in this study are included in the article. Further inquiries can be directed to the corresponding author.
Conflicts of Interest
The authors declare no conflict of interest.
Abbreviations
The following abbreviations are used in this manuscript:
| HRES | Hybrid Renewable Energy Systems |
| PV | Photovoltaic |
| WT | Wind Turbine |
| FC | Fuel Cell |
| PEM | Proton Exchange Membrane |
| SOEC | Solid Oxide Electrolysis Cell |
| GHI | Global Horizontal Irradiance |
| RO | Reverse Osmosis |
| O&M | Operation and Maintenance |
| GIS | Geographic Information System |
| AC | Alternating Current |
| DC | Direct Current |
| STC | Standard Test Conditions |
| NPC | Net Present Cost |
| LCOE | Levelized Cost of Energy |
| LCOH | Levelized Cost of Hydrogen |
| CRF | Capital Recovery Factor |
| mf | Multiplying factor |
References
- Holechek, J.L.; Geli, H.M.E.; Sawalhah, M.N.; Valdez, R. A global assessment: Can renewable energy replace fossil fuels by 2050? Sustainability 2022, 14, 4792. [Google Scholar] [CrossRef]
- Ahmad, T.; Zhang, D. A critical review of comparative global historical energy consumption and future demand: The story told so far. Energy Rep. 2020, 6, 1973–1991. [Google Scholar] [CrossRef]
- Al-Sharafi, A.; Ahmadullah, A.B.; Hassan, G.; Al-Qahtani, H.; Abubakar, A.A.; Yilbas, B.S. Influence of environmental dust accumulation on the performance and economics of solar energy systems: A comprehensive review. Clean. Energy Syst. 2024, 8, 100125. [Google Scholar] [CrossRef]
- Wheatley, M.C. Advancements in Renewable Energy Technologies: A Decade in Review. Science 2024, 1, 100013. [Google Scholar] [CrossRef]
- Vikas, K.; Nema, S.; Baredar, P. Solar–wind hybrid renewable energy system: A review. Renew. Sustain. Energy Rev. 2016, 58, 23–33. [Google Scholar] [CrossRef]
- Hairuddin, A.A.; Yusaf, T.; Wandel, A.P. A review of hydrogen and natural gas addition in diesel HCCI engines. Renew. Sustain. Energy Rev. 2014, 32, 739–761. [Google Scholar] [CrossRef]
- Xiao, W.; Cui, J.; Pan, H.; Zhao, H.; Yang, S.; Xue, Z.; Fu, Y.; Xu, Y. A Study on the Influence of Oxy-Hydrogen Gas Flame on the Combustion Stability of Coal Powder and Nitrogen Oxide Emissions. Processes 2024, 12, 1777. [Google Scholar] [CrossRef]
- Wang, X.R.; Ma, Y.; Gao, J.; Li, T.; Jiang, G.Z.; Sun, Z.Y. Review on water management methods for proton exchange membrane fuel cells. Int. J. Hydrogen Energy 2021, 46, 12206–12229. [Google Scholar] [CrossRef]
- Cevahir, T.; Çil, M.A. A study on hydrogen, the clean energy of the future: Hydrogen storage methods. J. Energy Storage 2021, 40, 102676. [Google Scholar] [CrossRef]
- Alessandro, F. Green Hydrogen and the Energy Transition: Hopes, Challenges, and Realistic Opportunities. Hydrogen 2025, 6, 28. [Google Scholar] [CrossRef]
- Seoyeon, C.; Noh, W.; Lee, I. Hybrid systems design for blue and green hydrogen co-production: Integration of autothermal reforming with solid oxide electrolysis. Energy Convers. Manag. 2024, 300, 117969. [Google Scholar]
- Amela, A.; Sayer, M.; Haas, R. The economics and the environmental benignity of different colors of hydrogen. Int. J. Hydrogen Energy 2022, 47, 24136–24154. [Google Scholar] [CrossRef]
- CountryEconomy. Electricity Consumption in Algeria. Available online: https://countryeconomy.com/energy-and-environment/electricity-consumption/algeria (accessed on 28 June 2025).
- Ministère de l’Énergie et des Mines. Énergies Nouvelles, Renouvelables et Maîtrise de L’énergie. Available online: https://www.energy.gov.dz/?rubrique=energies-nouvelles-renouvelables-et-maitrise-de-lrenergie#:~:text=A%20travers%20ce%20programme%20d,de%202021%2C%20le%20solaire%20thermique (accessed on 28 June 2025).
- Ministère de l’Énergie et des Mines. Stratégie Nationale de Développement de L’hydrogène en Algérie. Available online: https://www.energy.gov.dz/?article=stratgie-nationale-de-dveloppement-de-l-hydrogne-en-algrie-4 (accessed on 28 June 2025).
- Al-Sharafi, A.; Ahmet, Z.; Ayar, S.T.; Yilbas, B.S. Techno-economic analysis and optimization of solar and wind energy systems for power generation and hydrogen production in Saudi Arabia. Renew. Sustain. Energy Rev. 2017, 69, 33–49. [Google Scholar] [CrossRef]
- Sunay, T. Design and optimization of a solely renewable based hybrid energy system for residential electrical load and fuel cell electric vehicle. Eng. Sci. Technol. Int. J. 2021, 24, 397–404. [Google Scholar] [CrossRef]
- Hussam, W.K.; Abdul-Niby, M.; Abdul-Niby, M. Techno-economic analysis and optimization of hydrogen production from renewable hybrid energy systems: Shagaya renewable power plant-Kuwait. Int. J. Hydrogen Energy 2024, 58, 56–68. [Google Scholar] [CrossRef]
- Okonkwo, P.C.; Islam, M.S.; Taura, U.H.; Barhoumi, E.M.; Mansir, I.B.; Das, B.K.; Sulaiman, M.M.B.A.; Agyekum, E.B.; Bahadur, I. A techno-economic analysis of renewable hybrid energy systems for hydrogen production at refueling stations. Int. J. Hydrogen Energy 2024, 78, 68–82. [Google Scholar] [CrossRef]
- Basu, S.; John, A.; Kumar, A. Design and feasibility analysis of hydrogen based hybrid energy system: A case study. Int. J. Hydrogen Energy 2021, 46, 34574–34586. [Google Scholar] [CrossRef]
- Salameh, T.; Sayed, E.T.; Abdelkareem, M.A.; Olabi, A.G.; Rezk, H. Optimal selection and management of hybrid renewable energy System: Neom city as a case study. Energy Convers. Manag. 2021, 244, 114434. [Google Scholar] [CrossRef]
- Di Micco, S.; Romano, F.; Jannelli, E.; Perna, A.; Minutillo, M. Techno-economic analysis of a multi-energy system for the co-production of green hydrogen, renewable electricity and heat. Int. J. Hydrogen Energy 2023, 48, 31457–31467. [Google Scholar] [CrossRef]
- Ahmed, M.A.-O.; Osman, M.G.; Sedhom, B.E. Evaluation of green hydrogen production using solar, wind, and hybrid technologies under various technical and financial scenarios for multi-sites in Egypt. Int. J. Hydrogen Energy 2023, 48, 38535–38556. [Google Scholar]
- Alcantara, M.L.; Santana, J.C.C.; Nascimento, C.A.O.; Ribeiro, C.O. Application of levelized and environmental cost accounting techniques to demonstrate the feasibility of green hydrogen-powered buses in Brazil. Hydrogen 2025, 6, 10. [Google Scholar] [CrossRef]
- Ali, D.; Stewart, C.; Qadir, K.; Jalisi, I. Design and Optimal Sizing of a Hydrogen Uninterruptable Power Supply (UPS) System for Addressing Residential Power Cutoffs. Hydrogen 2025, 6, 3. [Google Scholar] [CrossRef]
- Djilali, M.; Settou, N.; Allouhi, A. Geographical, technical, economic, and environmental potential for wind to hydrogen production in Algeria: GIS-based approach. Int. J. Hydrogen Energy 2024, 50, 142–160. [Google Scholar]
- Mohamed, D.; Settou, N. Techno-economical optimization of pv/wind/fuel cell hybrid system in adrar region (algeria). Int. J. Sustain. Dev. Plan. 2021, 16, 175–180. [Google Scholar]
- Tiar, B.; Fadlallah, S.O.; Serradj, D.E.B.; Graham, P.; Aagela, H. Navigating Algeria towards a sustainable green hydrogen future to empower North Africa and Europe’s clean hydrogen transition. Int. J. Hydrogen Energy 2024, 61, 783–802. [Google Scholar] [CrossRef]
- Aziz, H.; Lakdja, F. Mega-scale solar-wind complementarity assessment for large-scale hydrogen production and storage (H2PS) in Algeria: A techno-economic analysis. Int. J. Hydrogen Energy 2024, 86, 985–1009. [Google Scholar]
- Boudghene, S.A.; Khiat, Z.; Flazi, S.; Kitamura, Y. A review on the renewable energy development in Algeria: Current perspective, energy scenario and sustainability issues. Renew. Sustain. Energy Rev. 2012, 16, 4445–4460. [Google Scholar] [CrossRef]
- Solargis. Solar Resource Maps & GIS Data for Algeria. Available online: https://solargis.com/resources/free-maps-and-gis-data?locality=algeria (accessed on 28 June 2025).
- Global Wind Atlas. Algeria. Available online: https://globalwindatlas.info/fr/area/Algeria (accessed on 28 June 2025).
- Fanack Water. Water Resources in Algeria. 2019. Available online: https://water.fanack.com/algeria/water-resources/ (accessed on 28 June 2025).
- Mostafa, E.-S. Hydrogen production by water electrolysis technologies: A review. Results Eng. 2023, 20, 101426. [Google Scholar] [CrossRef]
- British Geological Survey (BGS). Download Digital Groundwater Maps of Africa (Africa Groundwater Atlas). Available online: https://www2.bgs.ac.uk/groundwater/international/africangroundwater/mapsDownload.html (accessed on 28 June 2025).
- Simoes, S.G.; Catarino, J.; Picado, A.; Lopes, T.F.; di Berardino, S.; Amorim, F.; Gírio, F.; Rangel, C.M.; de Leão, T.P. Water availability and water usage solutions for electrolysis in hydrogen production. J. Clean. Prod. 2021, 315, 128124. [Google Scholar] [CrossRef]
Disclaimer/Publisher’s Note: The statements, opinions and data contained in all publications are solely those of the individual author(s) and contributor(s) and not of MDPI and/or the editor(s). MDPI and/or the editor(s) disclaim responsibility for any injury to people or property resulting from any ideas, methods, instructions or products referred to in the content. |
© 2025 by the authors. Licensee MDPI, Basel, Switzerland. This article is an open access article distributed under the terms and conditions of the Creative Commons Attribution (CC BY) license (https://creativecommons.org/licenses/by/4.0/).