Article

Membrane-Based Hydrogen Production: A Techno-Economic Evaluation of Cost and Feasibility

by
Dk Nur Hayati Amali Pg Haji Omar Ali
,
Hazwani Suhaimi
* and
Pg Emeroylariffion Abas
*
Faculty of Integrated Technologies, Universiti Brunei Darussalam, Jalan Tungku Link, Gadong BE1410, Brunei
*
Authors to whom correspondence should be addressed.
Hydrogen 2025, 6(1), 9; https://doi.org/10.3390/hydrogen6010009
Submission received: 3 January 2025 / Revised: 20 January 2025 / Accepted: 6 February 2025 / Published: 8 February 2025

Abstract

:
As the global shift toward a low-carbon economy accelerates, hydrogen is emerging as a crucial energy source. Among conventional methods for hydrogen production, steam methane reforming (SMR), commonly paired with pressure swing adsorption (PSA) for hydrogen purification, stands out due to its established infrastructure and technological maturity. This comprehensive techno-economic analysis focuses on membrane-based hydrogen production, evaluating four configurations, namely SMR, SMR with PSA, SMR with a palladium membrane, and SMR with a ceramic–carbonate membrane coupled with a carbon capture system (CCS). The life cycle cost (LCC) of each configuration was assessed by analyzing key factors, including production rate, hydrogen pricing, equipment costs, and maintenance expenses. Sensitivity analysis was also conducted to identify major cost drivers influencing the LCC, providing insights into the economic and operational feasibility of each configuration. The analysis reveals that SMR with PSA has the lowest LCC and is significantly more cost-efficient than configurations involving the palladium and ceramic–carbonate membranes. SMR with a ceramic–carbonate membrane coupled with CCS also demonstrates the most sensitive to energy variations due to its extensive infrastructure and energy requirement. Sensitivity analysis confirms that SMR with PSA consistently provides the greatest cost efficiency under varying conditions. These findings underscore the critical balance between cost efficiency and environmental considerations in adopting membrane-based hydrogen production technologies.

1. Introduction

The world has relied on burning fossil fuels—coal, oil, and natural gas—as primary energy sources to feed its demand for energy across different sectors, including the transportation [1] and power generation sectors [2], for centuries. However, escalating concerns over climate change, global warming, and air pollution have prompted a global transition toward cleaner and renewable energy sources. Hydrogen has emerged as a key candidate in this shift due to its non-polluting, renewable, and environmentally safe qualities [3]. Hydrogen provides an ideal zero-carbon energy solution due to its high energy density and its potential to support future energy systems [4]. As illustrated in Figure 1a, global hydrogen consumption is expected to rise significantly by 2050, driven by its adoption in industries such as transportation, power generation, and refining. Furthermore, Figure 1b highlights the growing demand for green hydrogen—produced using renewable energy with no greenhouse gas emissions—and blue hydrogen—incorporating carbon capture technologies to reduce emissions. In contrast, the reliance on gray hydrogen, produced from fossil fuels without emission control, is expected to decline due to its significant carbon footprint. This shift reflects the global commitment to achieving a more sustainable and low-carbon energy future.
Indeed, hydrogen plays a pivotal role in advancing several United Nations Sustainable Development Goals (SDGs) [7,8]. Its contributions are particularly notable in promoting affordable and clean energy (SDG 7), supporting industry, innovation, and infrastructure development (SDG 9), driving climate action (SDG 13), and encouraging responsible consumption and production (SDG 12). These contributions underscore the potential of hydrogen as a crucial element in achieving a sustainable and low-carbon future.
There are several methods used for hydrogen production, including SMR, electrolysis, and biomass gasification. SMR, involving natural gas or reforming processes without capturing the carbon dioxide emissions generated during production and hence producing “gray hydrogen”, remains the most widely adopted hydrogen production method, accounting for over 70% of total hydrogen production [9]. While SMR is considered the most economical production method, it is associated with significant carbon dioxide emissions, which contribute to global warming [10]. Hydrogen purification in SMR is typically achieved using pressure swing adsorption (PSA), a process that separates hydrogen from other impurities to yield higher-purity hydrogen suitable for industrial applications. To overcome the environmental challenges of SMR, the integration of membrane-based processes with SMR has emerged as a promising solution. This approach allows for the selective separation of hydrogen at high purity and offers the added benefit of reduced greenhouse gas emissions when combined with carbon capture systems [11]. The incorporation of carbon capture and storage transforms the hydrogen into “blue hydrogen”. Blue hydrogen is expected to remain a cornerstone of the energy transition, as industries increasingly promote hydrogen as a safe next-generation fuel for powering vehicles, heating homes, and generating electricity [6].
Membranes act as selective barriers, enabling specific molecules like hydrogen to pass through while blocking other gasses, such as carbon monoxide and carbon dioxide. This unique property allows for hydrogen with higher purity, making membranes a valuable tool in the overall hydrogen production system. Unlike conventional methods such as PSA, which rely on pressure cycling to separate gasses, membrane technologies provide continuous separation, offering a simpler and more energy-efficient alternative. Moreover, the use of membranes also improves the overall efficiency of hydrogen production processes. By integrating membranes into their processes, industries can enhance hydrogen purification and improve productivity. This indirectly improves the overall efficiency of the downstream carbon capture system (CCS) as well as reducing emissions, thereby aligning with the global shift toward cleaner energy technologies.
This study focuses on two advanced membranes, namely palladium membranes (PMs) and ceramic–carbonate membranes (CCMs) due to their superior performances under high-temperature conditions typical of SMR. PMs are highly selective for hydrogen and capable of producing ultra-pure hydrogen, enhancing both the economic and environmental efficiency of SMR. CCMs, on the other hand, are particularly suitable for processes involving contaminants such as sulfur or carbon dioxide. Constructed from materials like cobalt and nickel molybdates, these membranes provide high thermal stability and resistance to poisoning, making them suitable for challenging operation conditions. This study evaluates the integration of CCMs with a carbon capture system (CCS) in a single SMR design, comparing this configuration against SMR with PMs and conventional methods to provide a comprehensive assessment of their technical and economic performance.
A techno-economic analysis (TEA) was conducted to evaluate the economic viability and technical performance of the selected membrane technologies, comparing them with conventional methods such as SMR and SMR with PSA. The findings from this study are expected to provide critical insights into the economic implications of integrating membranes, enabling industries and policymakers to make informed decisions on efficiency improvements and sustainability investments. In summary, this study explores the TEA of four hydrogen production systems, namely SMR, SMR with PSA, SMR with PM, and SMR with CCM coupled with CCS.

2. Methods

2.1. Overview of Steam Methane Reforming with Pressure Swing Adsorption

SMR is one of the most widely used methods for hydrogen production and is therefore used as a benchmark for this study. The process involves heating methane with steam from natural gas, typically in the presence of a catalyst, to produce a mixture of carbon monoxide and hydrogen. This hydrogen can be utilized in organic synthesis and as a clean fuel source [9]. Figure 2 illustrates the simplified block flow diagram of a typical SMR process.
The process begins with natural gas, primarily methane, which is preheated before being introduced into the reforming reactor to optimize the reforming reaction. This reaction occurs at a relatively high temperature, ranging from 700 to 1000 °C, where methane reacts with steam to produce hydrogen and carbon monoxide.
C H 4 + H 2 O C O + 3 H 2
As an endothermic reaction, it requires energy and takes place within catalyst-filled tubes housed in a furnace. The catalyst commonly consists of 25–40% nickel oxide deposited on a low-silica refractory base [12]. In this study, a Ru-Ni/Al2O3 catalyst is used for the SMR reaction, while a Cu/Fe3O4-Cr2O3 catalyst is employed for the water–gas shift (WGS) reaction [13].
The high temperature facilitates the cracking of methane, producing hydrogen and carbon monoxide. Consequently, the reforming reactor generates a combination of flue gas and syngas. The flue gas, primarily composed of carbon dioxide with trace components, is directed to the carbon dioxide capture module. Meanwhile, syngas, a mixture of hydrogen, carbon monoxide, and residual methane, undergoes further processing. The captured carbon dioxide is then compressed and transported via pipelines or trucks to designated storage sites. From there, the carbon dioxide is sequestered in geological formations, such as depleted oil and gas reservoirs, to prevent its release into the atmosphere [14]. In theory, carbon sequestration in SMR plants helps mitigate greenhouse gas emissions. However, for the purpose of this study, CCS was incorporated into only one configuration, SMR with a ceramic–carbonate membrane coupled with a carbon capture system, to facilitate a direct comparison between systems.
Carbon monoxide in the syngas can undergo further reactions with steam in the reversible WGS reaction as follows:
C O + H 2 O C O 2 + H 2
This reaction is typically conducted at lower temperatures, ranging from 200 °C to 400 °C [15], and it converts carbon monoxide and water into additional hydrogen [16], thereby increasing the yield of hydrogen even further. The resulting syngas consists of hydrogen, carbon dioxide, methane, minimal levels of carbon monoxide, and water vapor. In the syngas purification unit, hydrogen is separated and purified from the other components.
A typical SMR plant utilizes PSA for this purpose, ensuring the production of high-purity hydrogen suitable for industrial applications. PSA operates by selectively capturing contaminants such as carbon dioxide, carbon monoxide, methane, and water vapor from the syngas stream through the use of solid materials under high-pressure conditions. Common adsorbents include activated carbon and zeolites [17]. Essentially, impurities are removed during the adsorption phase [18] and are released during desorption, leaving behind hydrogen with a purity of up to 99% [19]. The purified hydrogen is then compressed and stored for transportation or industrial applications.
The integration of SMR with PSA remains the least expensive method for large-scale hydrogen production. However, it has a significant disadvantage—high carbon dioxide emissions. Benchmark studies [20] have estimated that SMR produces approximately one mole of carbon dioxide for every mole of hydrogen. This indicates that using SMR without incorporating CCS technologies significantly contributes to the increase in greenhouse gas emissions.

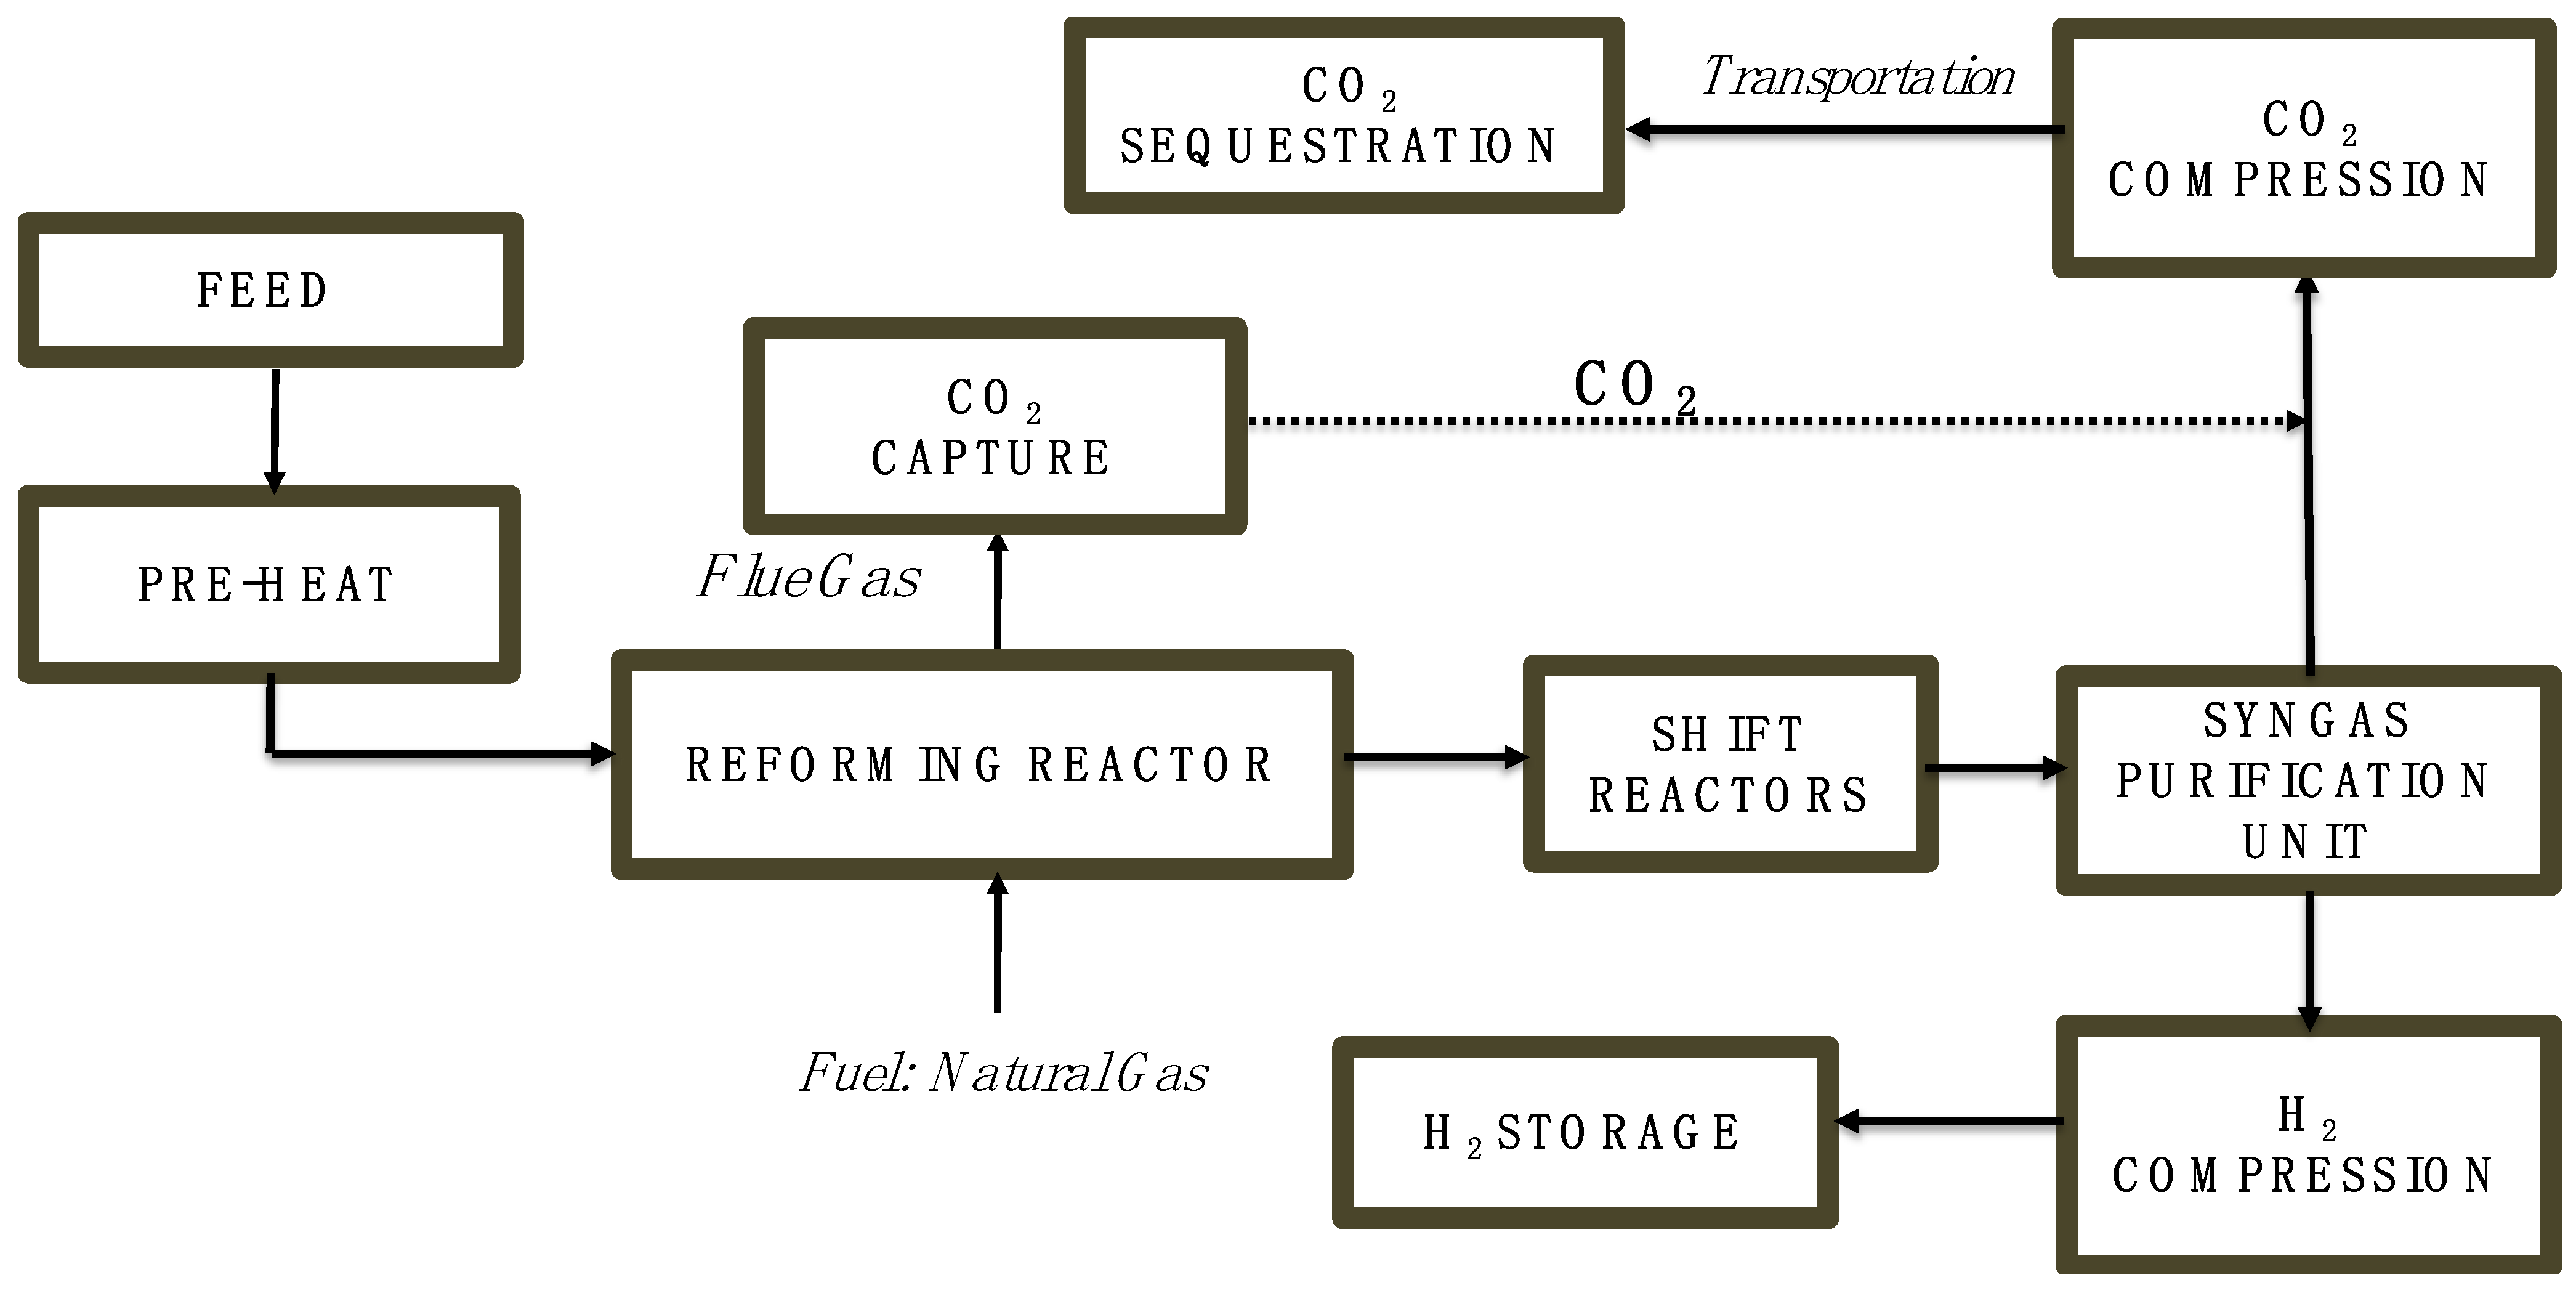
2.2. Overview of Steam Methane Reforming with Palladium Membrane and Ceramic–Carbonate Membrane Coupled with Carbon Capture System

An additional membrane reactor is used to perform both hydrogen separation and carbon dioxide capture functions. Unlike conventional membrane technologies, where the membrane coating is integrated into traditional reactors like the SMR or WGS reactors, the configuration in this study features an independent reactor dedicated solely to the membrane process. This approach is commonly employed in large-scale hydrogen plants because it allows for better control over the separation function of the membrane, enabling the optimization of process conditions to produce higher quantities of hydrogen with greater purity.
The membrane reactor functions by allowing only hydrogen to penetrate through the membrane material, which could be made of materials like palladium or ceramic–carbonate, while blocking the passage of other gasses such as carbon monoxide and carbon dioxide. Positioned downstream of the SMR and WGS reactors, the membrane reactor operates on the reformate gas mixture, effectively isolating high-purity hydrogen and capturing carbon dioxide. This configuration allows the SMR and WGS reactors to function at their optimal performance levels while avoiding the complications that arise when integrating membrane technology into one or both reactors at an industrial scale. The captured carbon dioxide can then be directed to a carbon dioxide capture unit for storage or utilization, while the high-purity hydrogen is collected for use in industries or other applications.
The chemical stability of palladium membranes is a key advantage, as the material does not degrade easily when exposed to chemicals. However, over time, they may suffer from embrittlement due to exposure to sulfur or carbon monoxide [21]. This study focuses on palladium membranes, considering their higher selectivity and efficiency for hydrogen separation. These membranes are especially well-suited for integration with SMR, as they do not require significant downstream hydrogen purification and are able to improve hydrogen production rates. Although palladium membranes are more expensive due to the high cost of the palladium metal, their effectiveness and ability to produce high-purity hydrogen make them an essential technology in modern hydrogen systems [22].
On the other hand, ceramic–carbonate membranes exhibit high stability and are resistant to contaminants, such as sulfur-containing compounds, which are commonly present in hydrogen production processes. Due to their ability to withstand very high temperatures, ceramic–carbonate membranes can be integrated with high-temperature hydrogen production techniques, including SMR [23]. A significant advantage of these membranes over palladium membranes is their resistance to poisoning by sulfur and other impurities, making them a more robust option in certain industrial applications [24]. The ceramic–carbonate membrane is integrated into a conventional SMR and coupled with CCS to allow for the effective separation of hydrogen while simultaneously capturing and storing carbon dioxide. Collectively, this enhances both the hydrogen production process and its environmental sustainability.

2.3. Techno-Economic Analysis

A modified life cycle cost ( L C C ) is employed to evaluate the total cost of ownership for hydrogen production systems considered in this study, including SMR, SMR with PSA, SMR with a palladium membrane, and SMR with a ceramic–carbonate membrane coupled with a carbon capture system, encompassing the phases of construction and operation only [25,26] and aligning with the methodology in reference [27], which similarly considers these phases only. It does not extend to decommissioning or end-of-life phases to maintain the focus on economic feasibility during the active lifetime of the systems, with these phases playing the most crucial role in determining feasibility and cost-effectiveness. Additionally, the absence of reliable data on residual values, especially with the newer technologies, prevents the inclusion of speculative estimates that could make the analysis less robust. By focusing solely on the active lifetime of the systems, the study provides a clear and targeted comparison of the different systems.
The modified L C C model incorporates six key cost parameters, namely capital cost ( C C ) , operating cost ( O C ) , maintenance cost ( M C ) , feedstock cost ( F C ) , selling price credits ( S P ) of hydrogen, and by-product credits ( B P ) . The general equation for calculating the L C C , adapted from [27], is given as follows:
L C C = C C + O C + M C + F C S P B P
The time value of money is accounted for through a discounting process by discounting costs and benefits occurring at various points in time into their present value. This is achieved by applying an appropriate discount interest rate that reflects changes in the value of money over a specified period. Using this approach, with i referring to the different years throughout the plant lifetime, n , together with r as the discount interest rate, the present value model for evaluating life cycle costs is formulated as follows [27]:
L C C = C C + i = 1 n O C i + M C i + F C i 1 + r i i = 1 n S P i 1 + r i i = 1 n B P i 1 + r i
This modified LCC approach deviates from traditional life cycle cost analysis by incorporating revenue streams, such as the selling price credits from hydrogen and by-product credits, to reflect the real-world economic dynamics of hydrogen production systems. Traditional LCC focuses solely on cost components, ensuring that only positive LCC values are calculated, as the method does not account for revenue streams that offset costs.
Our methodology builds on traditional LCC principles by integrating revenue streams and discounted values [27], bridging the gap between cost analysis and broader economic assessments, such as cost–benefit analysis (CBA). This extension is particularly relevant for hydrogen production systems, where revenues from hydrogen sales and by-products can be reliably quantified and play a significant role in offsetting the life cycle cost structure. By adapting the traditional LCC to include these factors, the study provides a comprehensive and realistic evaluation of the economic performance of hydrogen production systems.
In the modified LCC approach, a negative LCC value occurs when revenues exceed costs, indicating net profitability. While this outcome is mathematically correct, it deviates from the traditional LCC, where only costs are considered and such negative values do not occur. To ensure clarity and consistency, the results have been adjusted so that positive LCC values now represent profitability. This adjustment does not affect the underlying findings but provides a more intuitive understanding of the results, thus avoiding potential confusion for readers.

2.3.1. Capital Cost

The capital cost ( C C ) encompasses the expenses incurred in acquiring and establishing a plant for operation, including costs for land, building construction, equipment, installation, and related expenditures. In this study, it is assumed that the plant will be constructed over a span of two years. Therefore, only the capital expenditures for this two-year period are considered.

2.3.2. Operating Cost

Operating costs ( O C ) refer to the expenditures required to maintain plant operations over its lifetime. These costs include the feedstock needed for the process, primarily methane (CH4). Catalyst costs are also a significant component, involving Ru–Ni/Al2O3 for the steam reformer and Cu/Fe3O4-Cr2O3 for the WGS reactor. Additionally, the costs of adsorbents, such as silica gel, activated carbon, and zeolites, are taken into account. Utilities are also considered, including water consumption, electricity usage, and fuel for the reformer furnace, steam consumption, and overall energy requirements.
Furthermore, labor costs are calculated based on the local wage data from Brunei [28] by incorporating wages for skilled labor, unskilled/semi-skilled labor, management, and administrative staff with the consideration of adding other costs such as overtime and benefits. These labor costs were kept consistent across the configurations, ensuring a fair basis for comparison. Insurance costs, on the other hand, were uniformly assumed to be 1% of the total capital expenditure across the configurations. This assumption aligns with values reported in other research studies [29,30].
Logistics costs were estimated based on the scale of the production and informed by a range of percentages identified in the literature [31], taking upper and lower bounds for expected logistics costs and adopting these ranges to account for variability. The same methodology was applied across the configurations to maintain consistency in the comparative analysis.

2.3.3. Maintenance Cost

The maintenance cost ( M C ) includes the cost of maintenance labor, which can be comparable to the operating labor cost, as well as the materials required for plant maintenance, such as equipment spares. The calculation considers routine, preventive, and corrective maintenance costs. For chemical plants, annual maintenance costs are generally high, typically ranging from 5% to 15% of the installed capital costs [32]. In this study, the maintenance cost is assumed to be 15% of the capital expenditure.

2.3.4. Selling Price Credit

The selling price credit ( S P ) in this study refers to the revenue generated from the sale of hydrogen, the primary product of the production process. Hydrogen prices vary depending on the production method and the associated technologies. The selling price for gray hydrogen is approximately USD 6 per kilogram, while blue hydrogen is valued at around USD 8 per kilogram, as detailed in reference [33]. Gray hydrogen, produced through conventional methods without efficient carbon capture processes, is relatively cheaper and has predominantly been sold at this price point. In contrast, blue hydrogen, which incorporates CCS to mitigate carbon dioxide emissions, incurs higher production costs—around USD 8 per kilogram—due to the expense of CCS technology. Although blue hydrogen is slightly more expensive than gray hydrogen, it is cleaner and thus more environmentally favorable. SP is an essential component of LCC analysis, offsetting the total life cycle costs.

2.3.5. By-Product Credit

In addition to hydrogen, the production process also generates valuable secondary by-products, particularly carbon dioxide (CO2) and carbon monoxide (CO), both of which hold significant market value due to their potential industrial applications. The by-product credit ( B P ) refers to the revenue generated from the sale of these by-products, which helps to offset overall life cycle costs in the LCC analysis.
The selling price of carbon dioxide has been estimated at USD 25 per kilogram [34]. This value reflects both the cost and potential market demand for pure concentrated carbon dioxide in industries such as food processing, chemical processing, and enhanced oil recovery. Similarly, the selling price of carbon monoxide, another valuable by-product, has been calculated at USD 720.25 per ton [35]. This estimate considers its industrial application, including its use as a feedstock in chemical synthesis, and incorporates factors such as material costs, purity levels, and transportation expenses. These by-product credits contribute significantly to the revenue streams and are used to offset the total life cycle costs.
The pricing benchmarks of different hydrogen and by-products, summarized in Table 1, are critical for accurately evaluating the economic viability of the various hydrogen production pathways in this study.

2.4. Sensitivity Analysis

In this study, a comprehensive sensitivity analysis was performed to evaluate the influence of key economic and operational parameters on the LCC of different hydrogen production configurations. The analysis examined variations in production rate, hydrogen price, feedstock cost increases, water costs, power costs, maintenance expenses, capital expenditure subsidies, and discount rates for each LCC configuration.
This approach allowed for an in-depth exploration of how changes in these parameters affected the overall economic viability of each hydrogen production method. Parameters were varied within their reasonable ranges. This ensured a meaningful comparison of the sensitivity of the different integrations to market conditions and operational factors.
For the SMR with a ceramic–carbonate membrane coupled with a CCS configuration, an additional sensitivity analysis was conducted to evaluate the impact of carbon monoxide and carbon dioxide sales prices on the LCC. Specifically, the selling prices of carbon monoxide and carbon dioxide, which are both generated as by-products, were varied to assess their influence on the LCC. By considering fluctuations in these prices, the analysis highlighted the economic advantages of integrating CCS and utilizing by-product steams for additional revenue generation.
In cases where specific literature data were unavailable, standard industry practices and rough estimates were utilized to define parameter ranges. For example, parameters such as annual maintenance costs, capital cost subsidies, and others without directly cited data were assumed to be a typical percentage of capital cost, such as 15%. This approach allowed for the sensitivity analysis to account for the inherent variability of these factors and their impact on the LCC. By adopting standard estimates, the analysis ensured that fluctuations in these parameters were realistically represented, even in the absence of specific numerical data from the literature.

3. Results

3.1. Data Requirement

The economic feasibility of the four hydrogen production configurations was evaluated by analyzing the LCC for each configuration. A discount interest rate r of 5% was applied, and the plant’s operational lifetime n was assumed to be 20 years. Important parameters utilized in the calculation are given in Table 2, with the selling prices of the different types of hydrogen, carbon dioxide, and carbon monoxide previously presented in Table 1.

3.2. Cost Breakdown of Each Configurations

The comparison of capital and operational expenses across the four hydrogen production configurations—SMR, SMR with PSA, SMR with a palladium membrane, and SMR with a ceramic–carbonate membrane coupled with a CCS—reveals significant variations in costs, as illustrated in Figure 3. Among the configurations, SMR with a ceramic–carbonate membrane coupled with a CCS has the highest capital cost, amounting to USD 2,504,565,620. This is followed by SMR with a palladium membrane at USD 1,409,131,487, SMR with PSA at USD 478,653,550, and SMR, which requires the lowest capital cost of USD 473,976,803. The lower capital cost of SMR with PSA reflects the cost-effectiveness of integrating PSA technology, which simplifies the purification process and reduces the need for additional equipment compared to conventional SMR systems.
On the operational side, catalyst costs are relatively uniform across all configurations, ranging from USD 117,974 to USD 127,645. This indicates that catalyst costs are not significantly influenced by the degree of integration, as the same catalytic materials are used regardless of configuration.
Naturally, the costs associated with membranes or adsorbents vary significantly. SMR alone does not incur membrane or adsorbent costs, while SMR with PSA has a relatively low membrane cost of USD 13,372,050. In contrast, SMR with a palladium membrane involves a substantially higher membrane cost of USD 2,202,164,650, reflecting the high price of palladium material. Similarly, SMR with a ceramic–carbonate membrane coupled with a CCS incurs significant membrane costs of USD 1,111,256,622. These values highlight the significant impact of advanced membrane technologies, driven by material costs.
The feedstock price remains constant at USD 4,272,325 across all configurations, as the natural gas requirements for the SMR process do not vary significantly between configurations. However, other operating costs exhibit significant differences. SMR with a ceramic–carbonate membrane coupled with a CCS has the highest operating cost at USD 6,997,723,110, nearly 400% higher than SMR with a cost of USD 1,623,139,120 and SMR with PSA, at USD 1,623,089,781. SMR with a palladium membrane shows a slight increase in operating costs, reaching USD 3,189,115,371. These variations are primarily attributed to the energy demands of integrating advanced membrane and CCS technologies.
In contrast, maintenance costs are relatively consistent across most configurations, with SMR, SMR with a palladium membrane, and SMR with a ceramic–carbonate membrane coupled with a CCS each incurring costs of USD 286,063,394. SMR with PSA, however, has a notably higher maintenance cost at USD 288,838,756, reflecting the reliance of PSA systems on more dynamic and cyclic operations compared to configurations with advanced membrane technologies.
This cost breakdown underscores the trade-offs between the different cost components, efficiency, and environmental factors for each configuration. Advanced membrane technologies such as a palladium membrane and ceramic–carbonate membranes offer significant benefits in purity and emissions reduction but have an associated higher cost, particularly in terms of capital and operating costs.

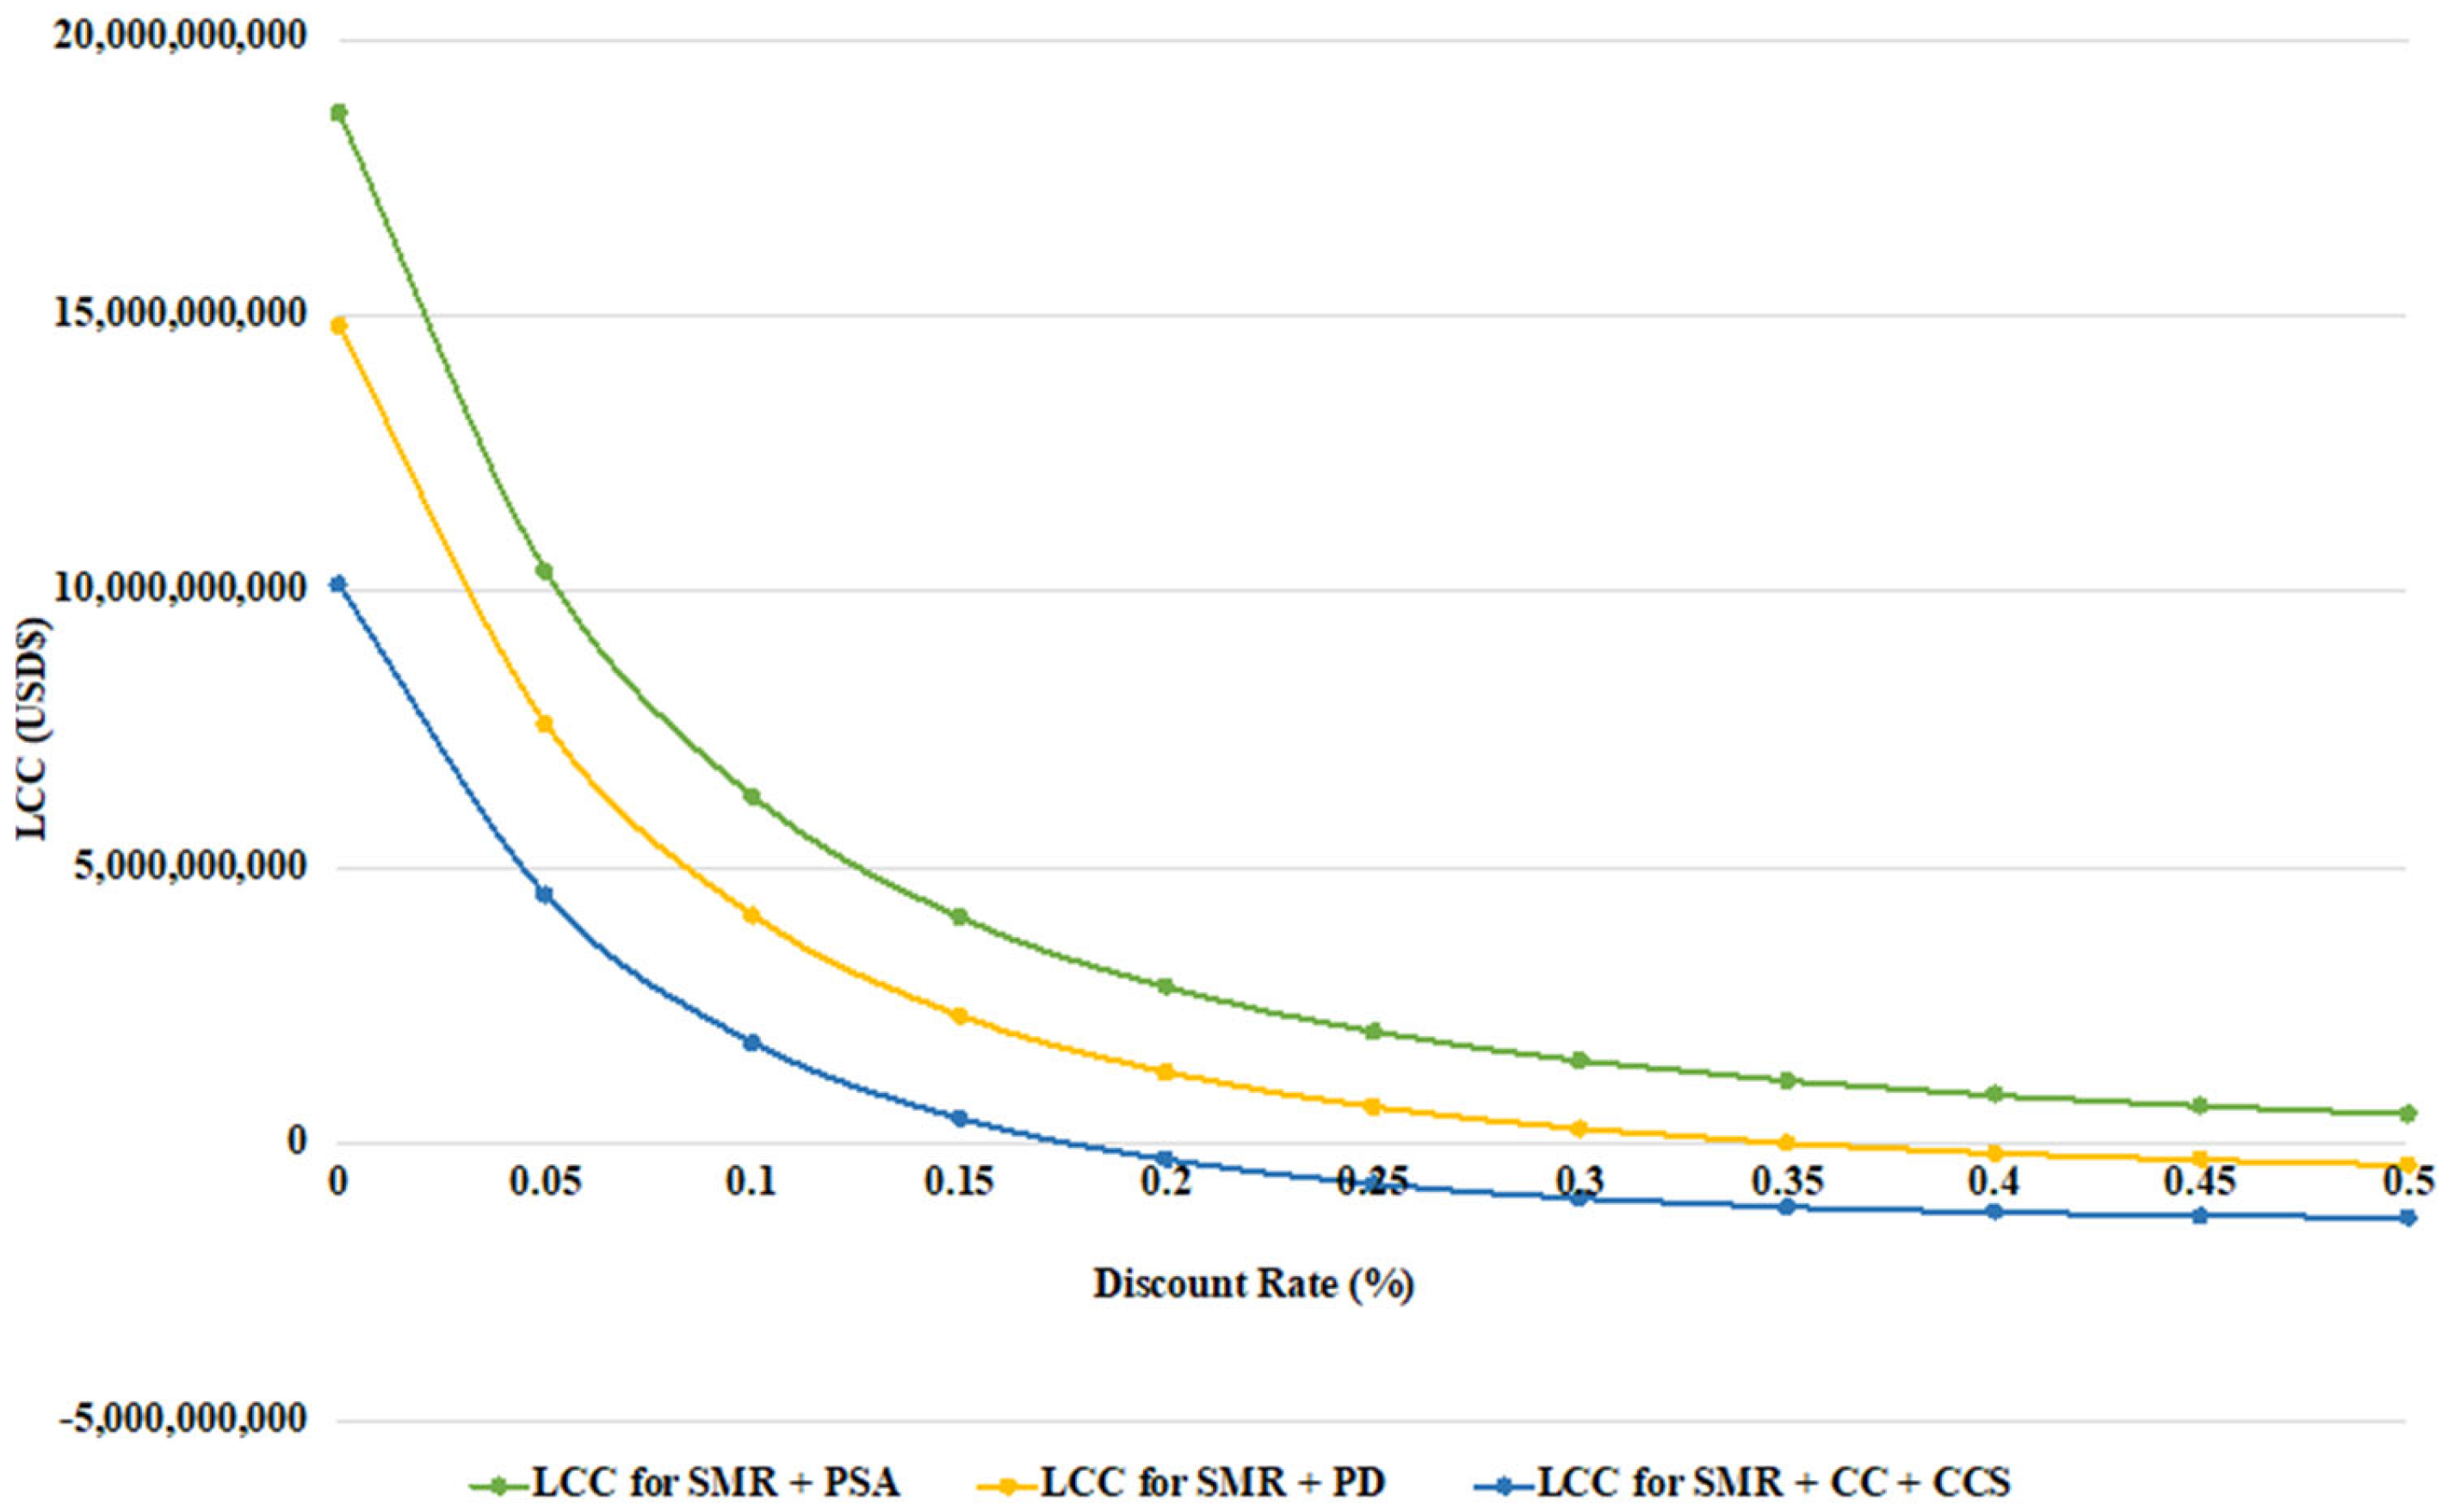
3.3. Life Cycle Cost Distribution

Table 3 provides an overview of the life cycle cost for the four hydrogen production configurations, namely SMR, SMR with PSA, SMR with a palladium membrane, and SMR with a ceramic–carbonate membrane coupled with a CCS. A more positive LCC value indicates a net profit over the lifetime of the system. These data form the basis for the bar chart in Figure 4, which visually represents the LCC distribution across the four systems.
The LCC analysis serves as an essential tool during the initial stages of project planning, offering insights into the total investment and operational costs for each configuration. This analysis assists in assessing costs, comparing between different configurations, and determining the most economically viable option. While these estimates are based on approximations and assumptions, making them inherently imprecise, they serve as valuable indicators for identifying areas requiring further focus and LCC optimization within a discounted cash flow framework.
The initial LCC analysis of the four hydrogen production scenarios—SMR, SMR with PSA, SMR with a palladium membrane, and SMR with a ceramic–carbonate membrane coupled with a CCS—reveals significant differences in the total estimated costs over the entire service life. Among these configurations, SMR with PSA demonstrates the highest LCC at USD 10,368,118,145, confirming it as the most cost-effective option. SMR with PSA benefits from reduced capital and operating costs, which contribute to its overall economic viability. Similarly, SMR has an LCC of USD 9,357,430,509, confirming its feasibility as a cost-efficient hydrogen production method, despite the integration of PSA providing additional benefits. Its higher LCC values indicate that these configurations are more cost-effective for hydrogen production due to their simpler technologies, which result in reduced capital and operating costs.
As anticipated, the SMR with a palladium membrane configuration reports a lower LCC of USD 7,748,502,947. While the inclusion of a palladium membrane enhances hydrogen purity, providing an advantage over SMR and SMR with PSA to produce hydrogen with higher purity, the associated higher capital and operating costs result in less favorable economic performance. This configuration may still be suitable in scenarios where high-purity hydrogen is critical, such as in fuel cell technologies or pharmaceutical applications, but its lower LCC makes it less competitive for general hydrogen production.
From an economic perspective, the SMR with a ceramic–carbonate membrane coupled with a CCS configuration has the lowest LCC at USD 4,503,887,881, making it the least feasible option among the four scenarios. The lowered LCC is due to the high capital and operational costs associated with implementing CCS technology, which is both complex and energy intensive. While this configuration offers notable environmental benefits through carbon capture and potential revenue from carbon dioxide sales, these advantages are insufficient to offset the significantly higher costs.

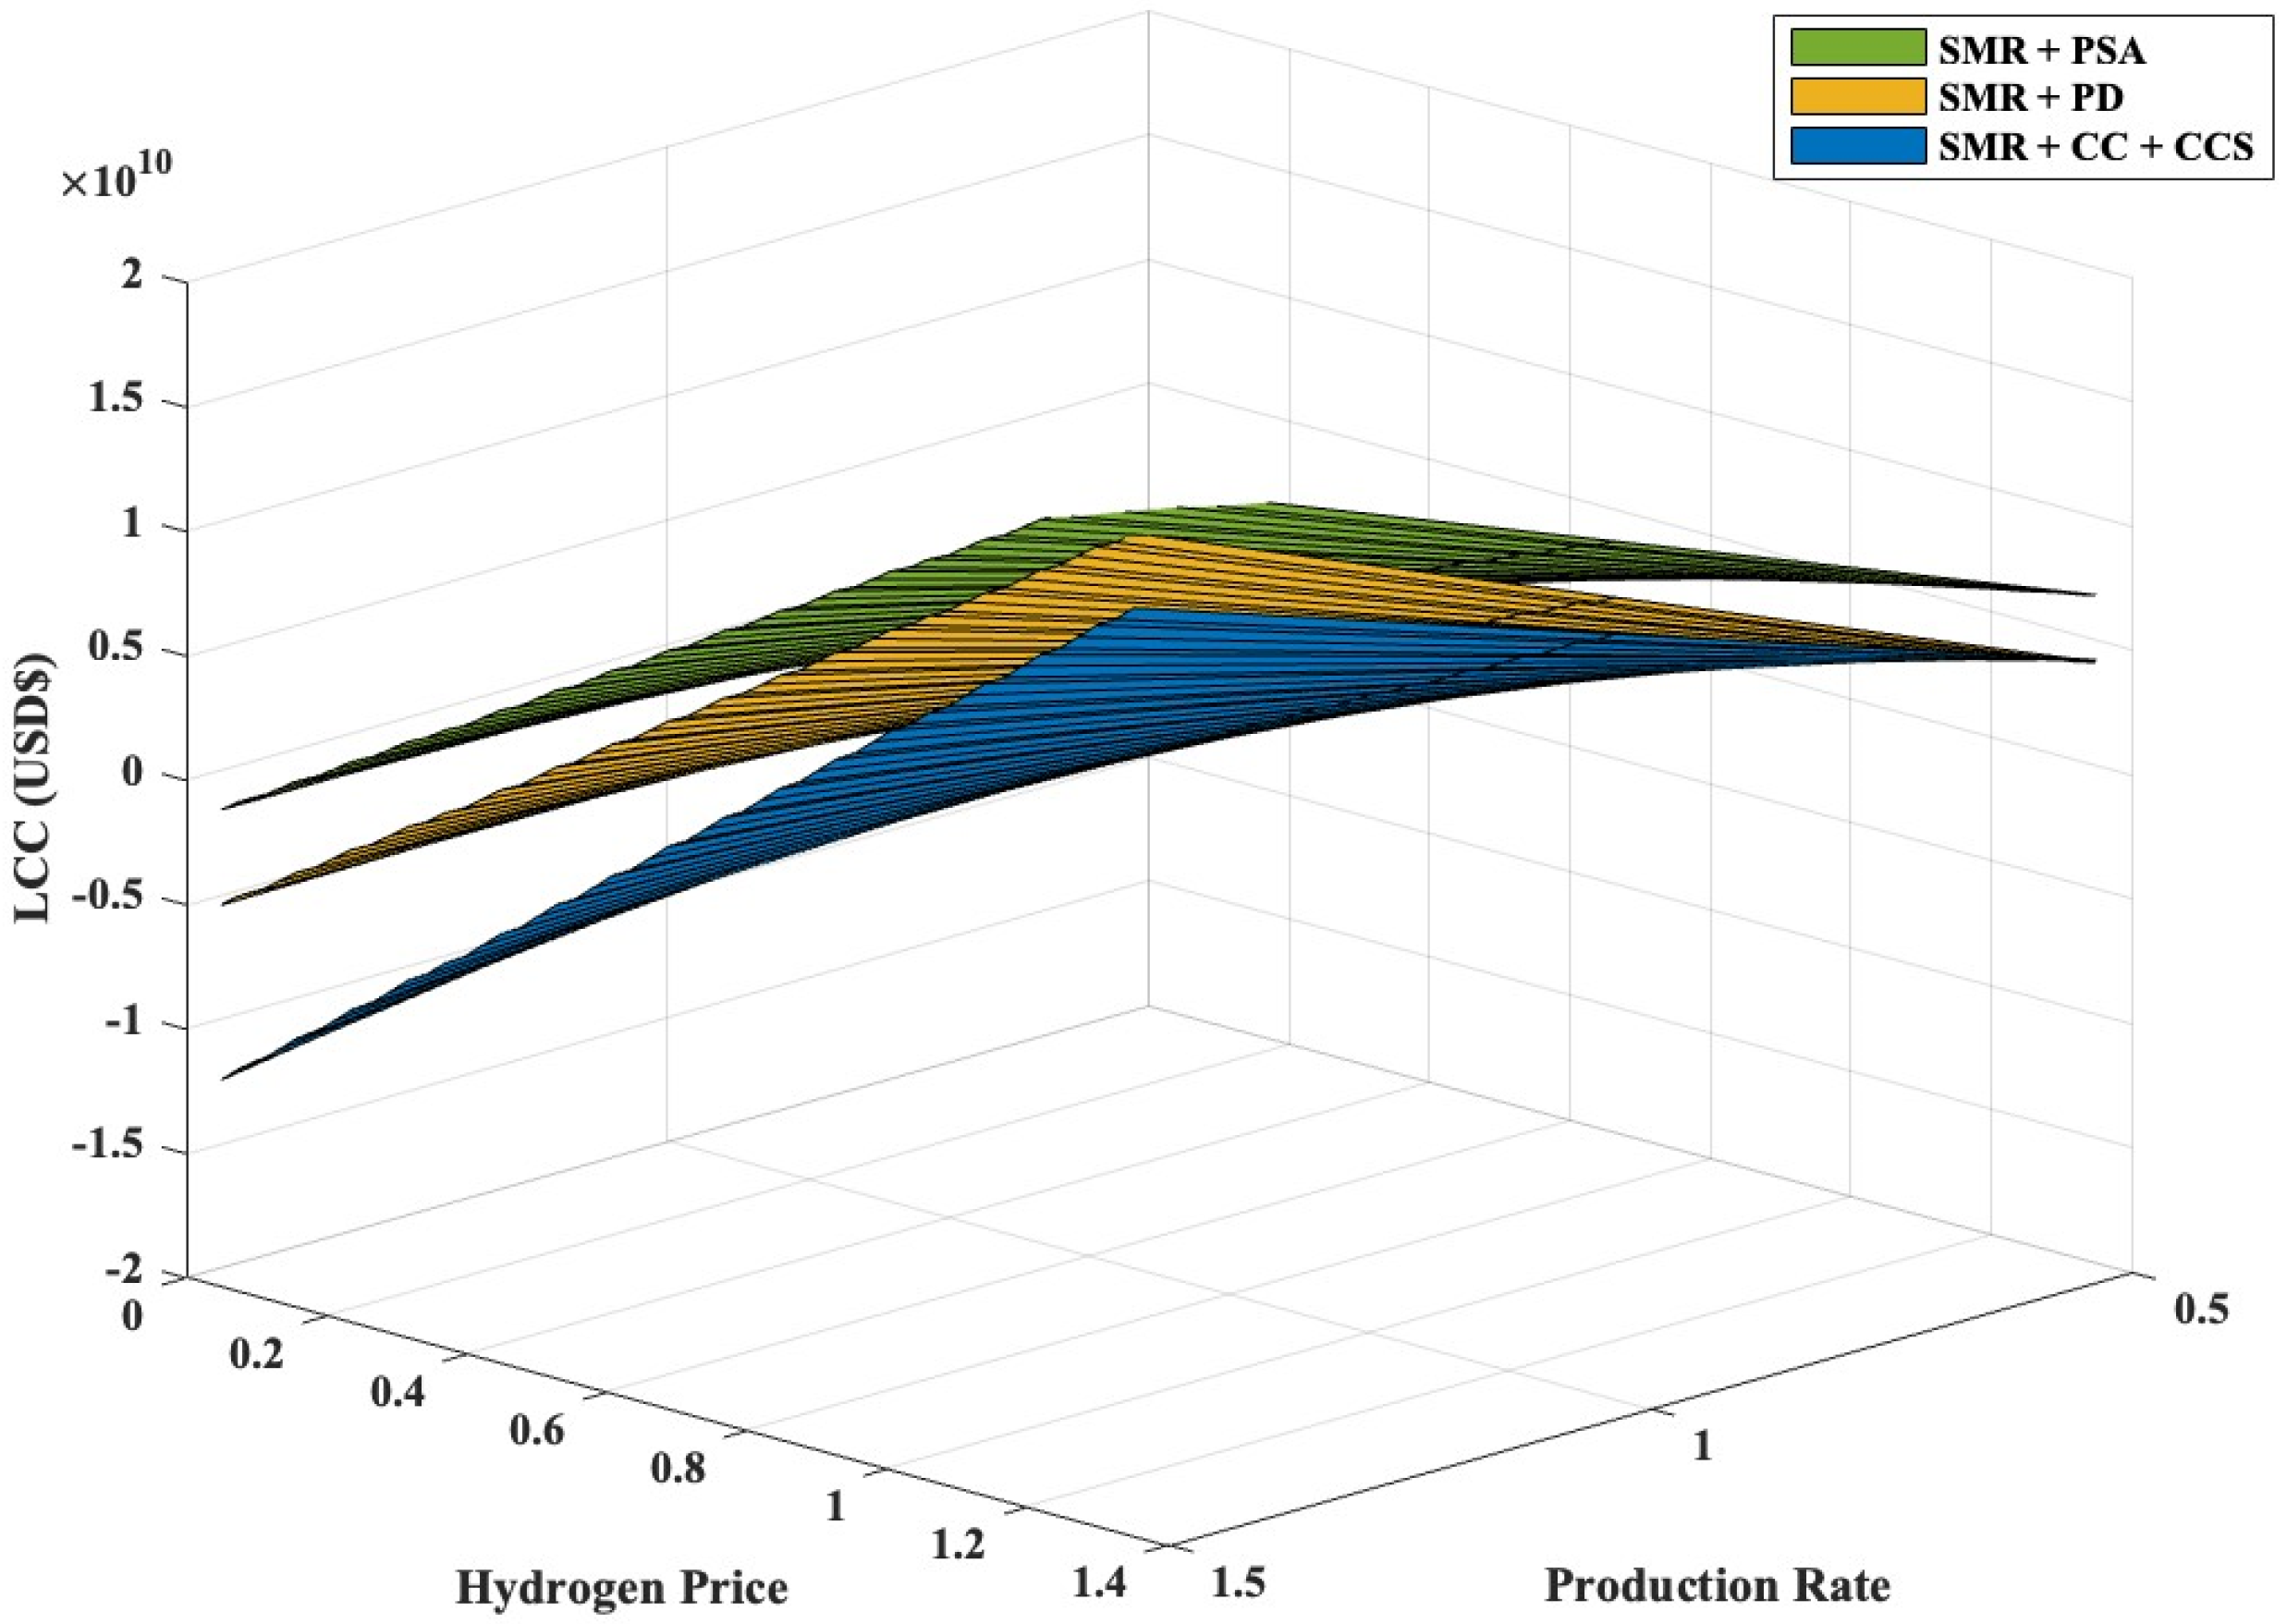
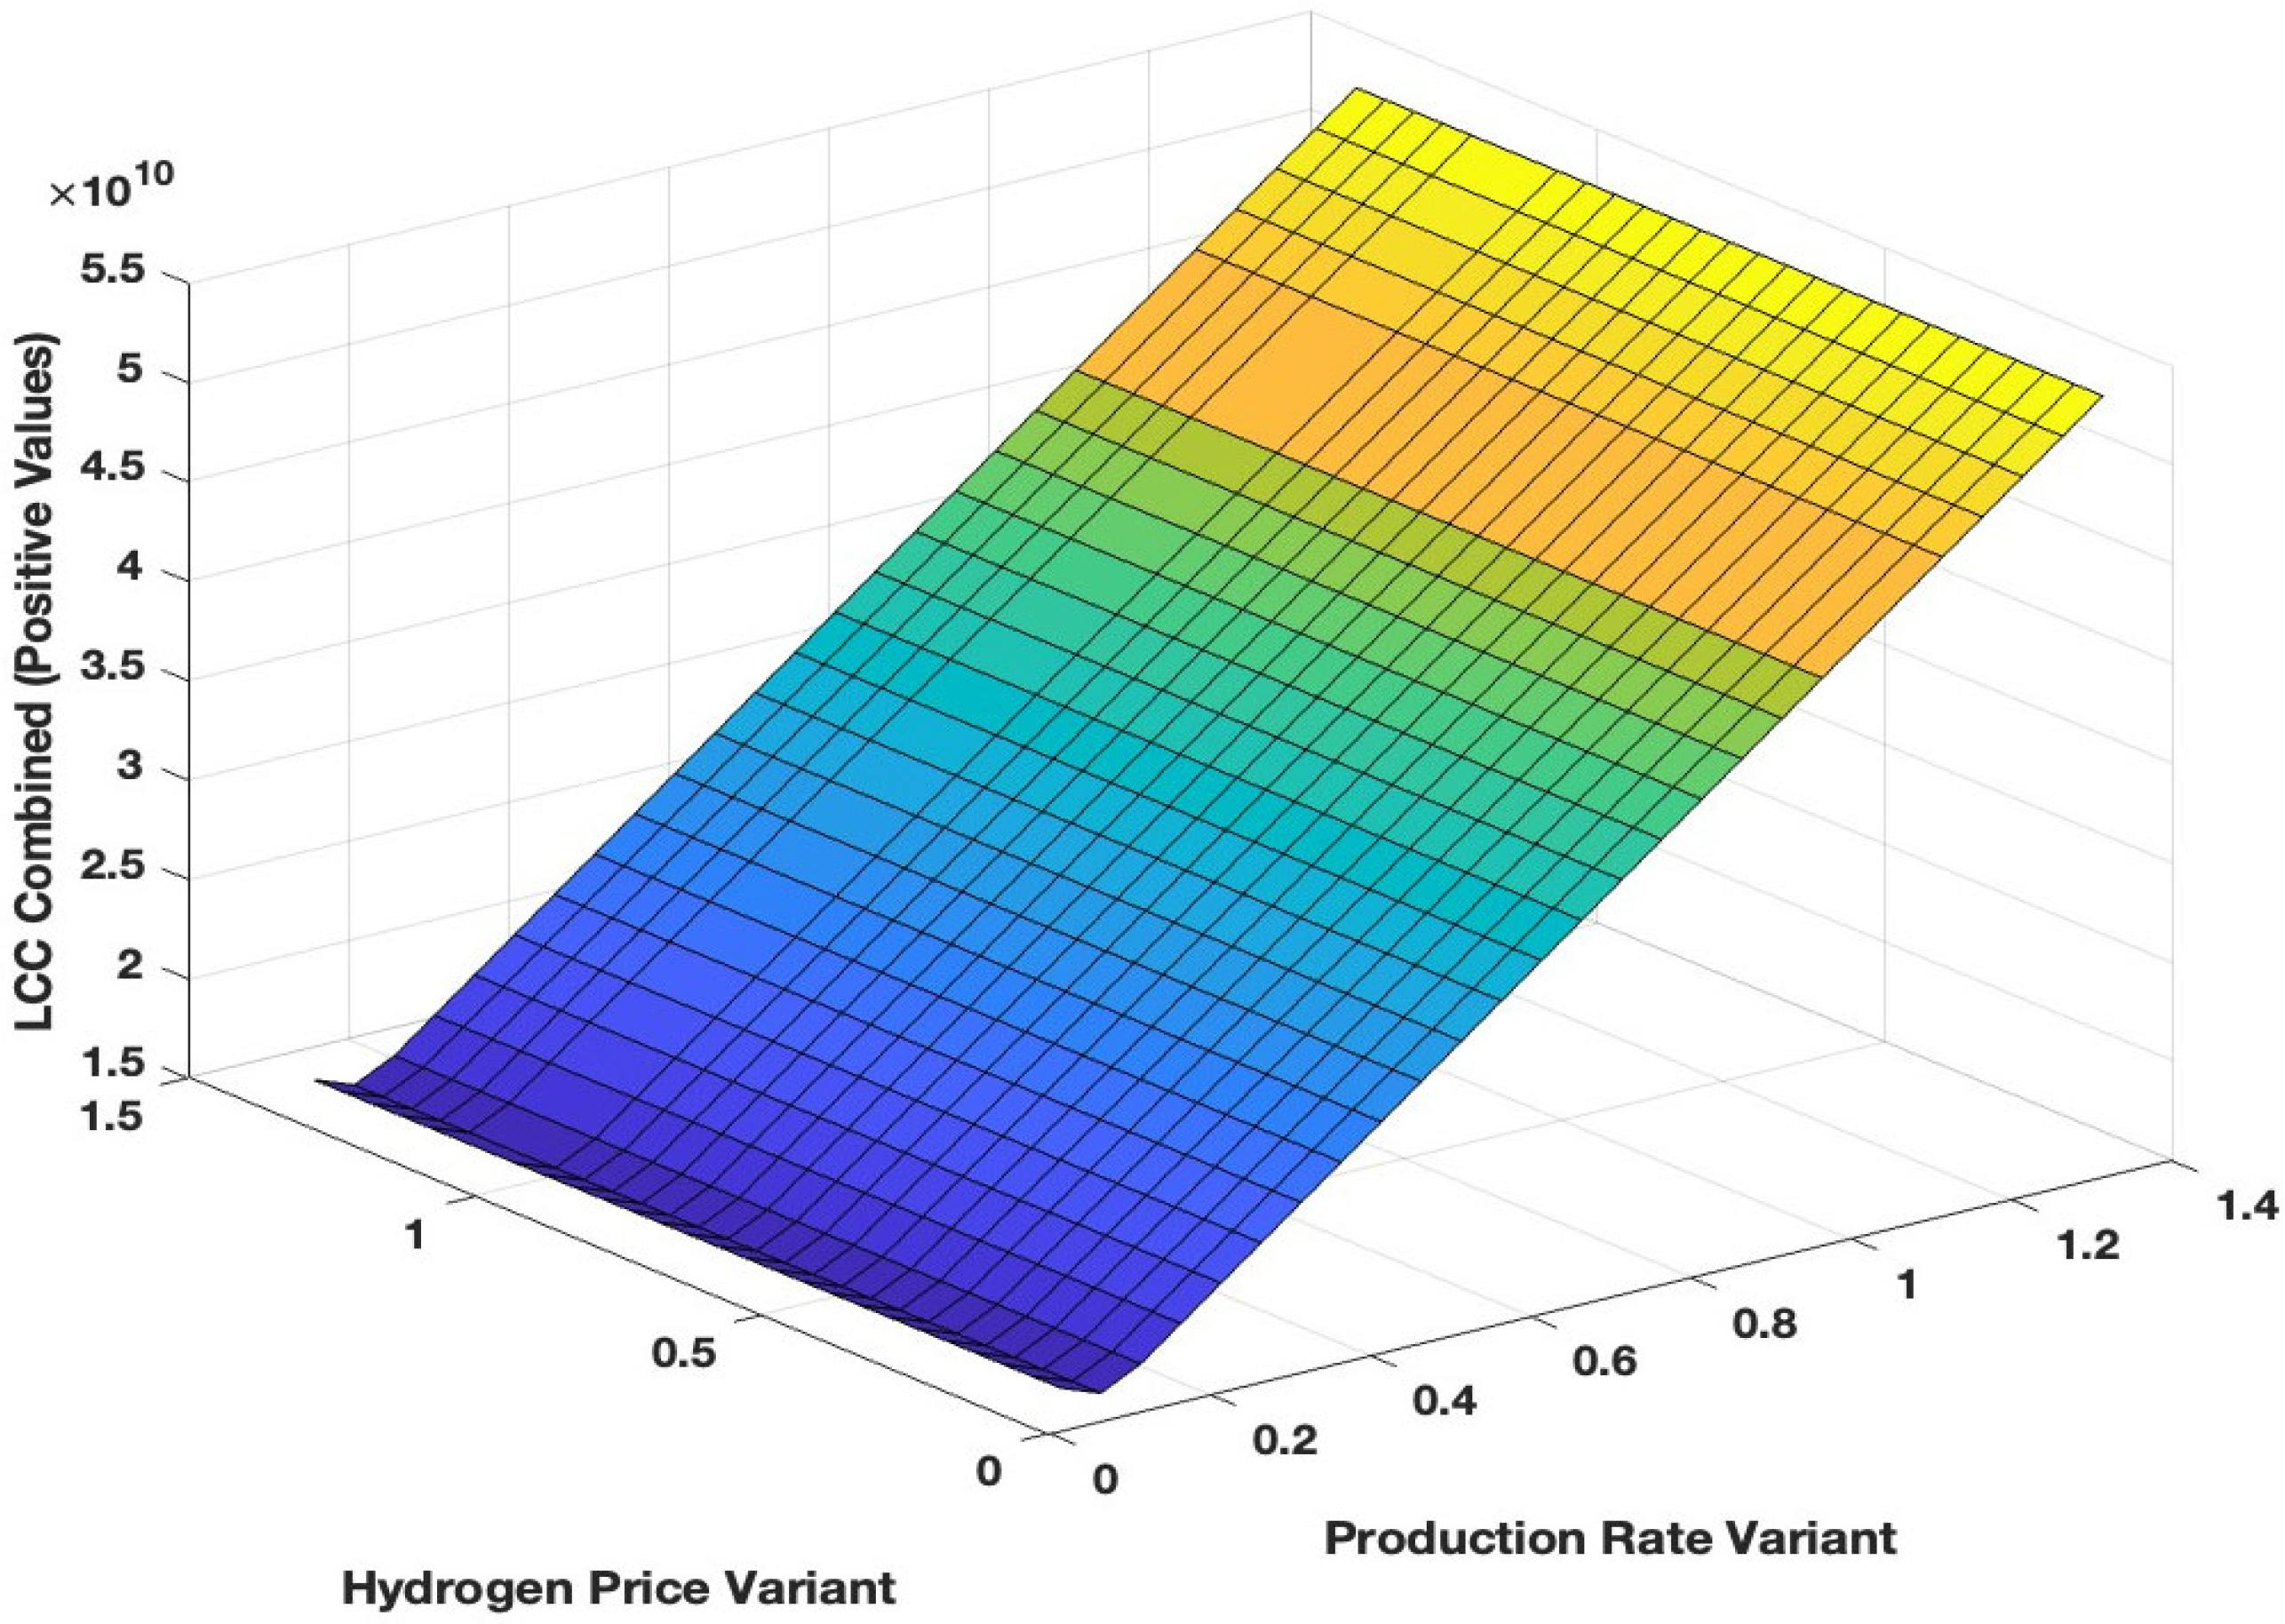
3.4. Sensitivity Analysis on Different Key Parameters

Figure 5 illustrates the relationship between the LCC and energy consumption across three configurations, namely SMR with PSA, SMR with a palladium membrane, and SMR with a ceramic–carbonate membrane coupled with a CCS. Energy consumption varies in this analysis to evaluate the sensitivity of each configuration to changes in operational energy demand, simulating real-world conditions where energy requirements fluctuate due to load variations, changes in equipment efficiency, and feedstock composition. This analysis identifies the sensitivity of the different configurations to varying energy consumption, thereby offering insights into the robustness and viability of each configuration under real-world dynamic operating conditions.
The analysis reveals that the LCC of each configuration increases as energy consumption decreases, with SMR with PSA consistently demonstrating the most favorable LCC. Specifically, SMR with PSA maintains its cost advantage, ranging from USD 10,365,923,588 at an energy consumption level of 1.35× to USD 10,367,549,186 at 0.35× default energy values. This stability highlights SMR with PSA as the most cost-effective design in terms of LCC, even as energy consumption varies. Its lower energy consumption rate further reinforces its economic advantage.
Conversely, SMR with a palladium membrane exhibits a steeper LCC profile, starting at USD 7,712,625,380 at an energy consumption level of 1.35× and rising to USD 9,278,601,630 when energy consumption decreases to 0.35× default energy values. This trend suggests that while the palladium membrane improves hydrogen purity, it incurs higher life cycle costs and is more sensitive to changes in energy consumption. The increased LCC with reduced energy usage highlights the energy-intensive nature of the membrane system, suggesting higher operational and maintenance costs associated with palladium membrane technology. This dependency on energy underscores the trade-off between hydrogen purity and economic feasibility.
The SMR with a ceramic–carbonate membrane coupled with a CCS configuration exhibits the highest LCC across all energy levels, ranging from USD 3,805,777,576 at an energy consumption level of 1.35× to USD 8,828,753,267 at 0.35× default energy values, indicating low cost-effectiveness. The further increase in LCC as energy consumption decreases underscores the high costs associated with the CCS. This is primarily due to the energy-intensive methods required for capturing, compressing, and storing carbon dioxide, which significantly drive up both operational and life cycle costs. Despite its environmental advantages, its high energy demands make it less economically viable for now.
Sensitivity analysis reveals that the LCC of the SMR configuration is primarily influenced by three key variables, namely production rate, hydrogen price, and feedstock price. Table 4 and the tornado chart in Figure 6 present the results of the sensitivity analysis conducted specifically for the SMR configuration. The table provides a breakdown of the low, base, and high scenarios for each key parameter, identifying parameters which have the most significant impact on the economic performance and operational feasibility of the system. This highlights potential areas of concern or opportunity in varying market and operational conditions.
The production rate has the most significant effect on LCC, with a 30 percent fluctuation in production rate, resulting in the LCC fluctuating between a low of USD 6.29 million and a high of USD 1.24 billion. This indicates that changes in production volume in any period, whether an increase or decrease, would have a significant impact on the total costs. A lower production rate can lead to a reduction in LCC, mainly by a reduction in selling price despite the simultaneous reduction in operational expenses. However, a higher production rate results in higher overall LCCs due to issues related to economies of scale and utilization rates.
The second most sensitive factor is the hydrogen price, where a 15% fluctuation results in an LCC range from USD 7.6 million (lowest) to USD 1.11 billion (highest). An increase in the cost of hydrogen boosts revenues, which in turn increases the LCC, while a lower hydrogen price leads to a lower LCC. This illustrates the impact of market-driven cost control on hydrogen pricing. Finally, feedstock price variation is the least sensitive of all the independent variables, with the LCC ranging from USD 8.52 million to USD 1.41 billion with a 40% change. However, feedstock prices have a lesser impact on the LCC compared to the production rate or hydrogen price. In other words, the economic feasibility of SMR is more dependent on the production rate and hydrogen prices. This analysis highlights the importance of controlling the production rate and securing favorable hydrogen prices to ensure efficient hydrogen production using the SMR process.
The 3D surface plot in Figure 7 illustrates the sensitivity analysis of LCC fluctuations across three configurations, namely SMR with PSA, SMR with a palladium membrane, and SMR with a ceramic–carbonate membrane coupled with a CCS, in response to the key parameters—hydrogen price and production rate. The LCC varies based on these parameters across the configurations, with the SMR with PSA configuration showing the highest LCC compared to SMR with a palladium membrane and SMR with a ceramic–carbonate membrane coupled with a CCS. This indicates that SMR with PSA is the most cost-effective option when considering the impact of hydrogen price and production rate on the LCC.
From Figure 7, it is observed that as the production rate increases, the LCC increases for all configurations. For example, when the production rate is 1.0 of the default production rates and the hydrogen price is 0.85 of the assumed hydrogen price, the LCC for SMR with PSA is USD 8.6 billion, while the LCC for SMR with a palladium membrane is USD 5.83 billion, and for SMR with a ceramic–carbonate membrane coupled with a CCS, it is USD 3.33 billion. Conversely, when the production rate decreases to 0.5 while keeping the hydrogen price at 0.85, the LCC values decrease significantly across all configurations, reaching USD 3.9 billion for SMR with PSA, USD 953 million for SMR with a palladium membrane, and USD 518 million for SMR with a ceramic–carbonate membrane coupled with a CCS. This highlights that a higher production rate contributes to a higher LCC and greater cost efficiency across all configurations.
The price of hydrogen also plays a significant role in LCC fluctuations. For instance, at a production rate of 1.0 and a hydrogen price of 1.25, the LCC for SMR with PSA increases to a value of USD 13.4 billion, as shown in Figure 7. In comparison, the SMR with a palladium membrane and SMR with a ceramic–carbonate membrane coupled with CCS configurations result in lower LCCs of USD 11.1 billion and USD 9.38 billion, respectively, under the same conditions. This suggests that the economic viability of the SMR with PSA configuration is likely to be more sustainable, as it consistently maintains a higher LCC. At a production rate of 1.0 and hydrogen selling price at its default level, the LCCs are USD 10.5 billion for SMR with PSA, USD 7.9 billion for SMR with a palladium membrane, and USD 5.7 billion for SMR with a ceramic–carbonate membrane coupled with a CCS. This again highlights the fact that SMR with a ceramic–carbonate membrane coupled with a CCS has the lowest LCC due to its complexity in infrastructure. In scenarios where the hydrogen price drops to 40% with the plant maintaining a 100% production rate, the plant would still remain somewhat profitable with LCCs of USD 6 billion, USD 3 billion, and a lower LCC of USD 73 million for SMR with PSA, SMR with a palladium membrane, and SMR with a ceramic–carbonate membrane coupled with a carbon capture system, respectively.
In the case of a turndown operation or a planned maintenance operation in a chemical plant where the production rate is reduced to a 50% rate and a coincidental dip in the hydrogen market, causing the hydrogen selling price to drop by 50%, the profitability of both membrane technologies would deteriorate profoundly. However, even under these conditions, SMR with PSA would still retail the highest LCC at USD 1.8 billion, while SMR with a palladium membrane and SMR with a ceramic–carbonate membrane coupled with a CCS would show negative LCCs of USD -1.3 billion and USD -2 billion, respectively, denoting a profound loss. This analysis shows the relative stability of SMR with PSA to both production rate and hydrogen price.
In general, the SMR with a ceramic–carbonate membrane coupled with a CCS configuration exhibits the highest LCC across all benchmarks for the examined production rates and hydrogen prices, demonstrating that this configuration is the costliest due to the expenses associated with carbon capture. However, the study reveals that the SMR with PSA configuration is the most economically viable in a variety of scenarios, owing to its lower capital and operational costs, especially at higher production rates or elevated hydrogen prices. These findings emphasize that the economic efficiency of each configuration is primarily influenced by both the production rate and hydrogen price.
The 3D surface plot in Figure 8 focuses solely on the SMR configuration, providing an opportunity to analyze how this integration reacts to variability in both production rate and hydrogen price. Since SMR is commonly used as the reference configuration in this hydrogen production analysis across various integrations, presenting it separately after the general comparison between the other three configurations helps to further support the initial analysis and offers a clearer understanding of its behavior in response to changes in key parameters.
Figure 8 illustrates the interaction between the production rate and LCC as a function of hydrogen price. The x-axis represents the production rate, ranging from 0 to 1.35, which corresponds to scaled production rate percentages. The y-axis represents the hydrogen price, also varying from 0 to 1.35, indicating different price scenarios. The z-axis shows the LCC values, with the total relative LCC summed across all alternatives. The color gradient, ranging from blue to yellow, represents increasing LCC values, where lower combined LCC values are depicted in the blue areas, indicating a low-cost scenario. The yellow areas indicate a higher LCC, reflecting higher costs associated with these configurations.
Upon examining the gradient of the surface plot, it is evident that the LCC is more sensitive to changes in production rate than to hydrogen price. This is shown by the sharper increase in the steepness of the surface along the x-axis, which represents the production rate. In contrast, the impact of hydrogen price on the LCC is less pronounced, as the slope is less steep compared to the production rate. When both the production rate is close to 0 and the hydrogen price is low, the total LCC is significantly lower. This indicates that reducing both the production rate and the hydrogen price contributes to lower costs, highlighting the importance of balancing these two factors to optimize economic efficiency.
This analysis highlights that production rate is important in determining the cost efficiency of SMR, with the hydrogen price exerting secondary but still notable influence. These findings emphasize the importance of production optimization (controllable by the company investing in hydrogen production) and hydrogen prices (market-determined by can be determined by policymakers) in enhancing the techno-economic feasibility of SMR for large-scale production.
Due to limited data on the precise quantitative measurements of equipment and maintenance costs for each hydrogen production configuration from the available literature, general approximations were applied. For example, maintenance costs were estimated at 15% of capital cost. To address the uncertainty associated with these assumptions, a sensitivity analysis on equipment and maintenance costs was conducted. This analysis aimed to evaluate the potential implications of these approximations and provide a more informed understanding of their impact on the overall economic assessment.
This sensitivity analysis enabled the evaluation of how variations in assumed equipment and maintenance costs influence the total LCC for the selected configurations. The study first assessed the extent to which variability in equipment and maintenance costs contributed to the total LCC. These findings were then compared to the effects of other key parameters, such as the current and future production rates and hydrogen prices. If the analysis reveals no significant differences in LCC due to changes in equipment and maintenance cost assumptions, it will indicate that the preliminary cost feasibility analysis is robust and not overly sensitive to such uncertainties. This reinforces the reliability of the initial economic assessments despite the approximations used for these specific cost components.
A comparison of the LCC profiles for equipment and maintenance costs across the integrations of SMR with PSA, SMR with a palladium membrane, and SMR with a ceramic–carbonate membrane coupled with a CCS reveals significant disparities, as shown in Figure 9. Consistent with previous observations, the SMR with PSA integration consistently demonstrates the highest predicted LCC among the configurations, maintaining values below USD 10.7 billion in most scenarios involving equipment and maintenance cost variations.
For instance, at lower equipment and maintenance costs (0.5 for both), the LCC for SMR with PSA is approximately USD 10.7 billion, which is slightly better than SMR with a palladium membrane and SMR with a ceramic–carbonate membrane coupled with a CCS, with LCC values of about USD 8.5 billion and USD 5.2 billion, respectively. These results clearly indicate that SMR with PSA remains the most advantageous option, regardless of periodic changes in equipment and maintenance costs, further affirming its economic feasibility and resilience.
Conversely, the SMR with a ceramic–carbonate membrane coupled with a CCS configuration, despite being designed as a low-carbon option, results in the lowest LCC due to the substantial costs associated with carbon capture and storage. As equipment and maintenance costs increase—especially when technical parameters are scaled up to 1.5—the LCC for SMR with a ceramic–carbonate membrane coupled with a CCS rises to USD 3.9 billion, remaining significantly lower than that of the other configurations. This diminished cost reflects the economic burden of carbon capture, with the sensitivity analysis highlighting the impact of capture equipment and maintenance costs on the overall feasibility of this configuration.
Regarding the SMR with a palladium membrane configuration, the LCC occupies an intermediate position. Its costs are higher than SMR with PSA but remain lower than SMR with a ceramic–carbonate membrane coupled with a CCS, even with elevated equipment and maintenance values. For example, at an equipment and maintenance cost level of 1.0, SMR with a palladium membrane’s LCC is approximately USD 7.8 billion, slightly lower than SMR with PSA but significantly higher than SMR with a ceramic–carbonate membrane coupled with a CCS. This trend suggests that while SMR with a palladium membrane incurs additional costs due to its advanced technology, it remains more cost-effective than SMR with a ceramic–carbonate membrane coupled with a CCS, particularly under conditions involving high maintenance expenses.
The plot of discount rate against the LCC in Figure 10 highlights the significant sensitivity of all configurations to discount rate fluctuations between 0% and 0.5%. The configurations—SMR with PSA, SMR with a palladium membrane, and SMR with a ceramic–carbonate membrane coupled with a CCS —exhibit distinct cost patterns as the discount rate increases.
The LCC values of SMR with PSA are the highest among all configurations, particularly at lower discount rates, with an LCC of approximately USD 18.7 billion at a 0% discount rate. This significant growth in LCC at lower discount rates underscores the sensitivity of SMR with PSA to economic signals. If subsidies or favorable financial mechanisms, such as low-cost credit or government funding, effectively reduce the discount rate, the LCC for SMR with PSA would remain comparatively high. This scenario further highlights the economic feasibility of SMR with PSA under such conditions, making it a strong candidate for policy support in hydrogen production initiatives.
SMR with a palladium membrane also demonstrates notably high LCC values at low discount rates but remains relatively more expensive than SMR with PSA. At a 0% discount rate, the LCC for SMR with a palladium membrane is approximately USD 14.8 billion and decreases sharply as the discount rate rises. This steep gradient indicates that SMR with a palladium membrane is particularly sensitive to interest rate changes, contrasting with the greater stability of SMR with PSA. While cost reductions via subsidies that lower the discount rate could enhance the economic feasibility of SMR with a palladium membrane, this configuration is unlikely to match the cost-effectiveness of SMR with PSA without additional support measures. Operational or capital cost subsidies could further narrow this gap, highlighting the need for targeted financial incentives to make SMR with a palladium membrane a more competitive option.
In contrast, the SMR with a ceramic–carbonate membrane coupled with a CCS configuration exhibits the lowest LCC across all discount rate scenarios, starting at approximately USD 10.1 billion at a 0% discount rate and progressively decreasing to near-negative levels as the discount rate rises. This trend highlights the economic challenge posed by this configuration, with steep LCC decreases at higher discount rates underscoring its high-cost sensitivity. The steep early dip in the LCC suggests that SMR with a ceramic–carbonate membrane coupled with a CCS is economically unsustainable, even with discount rate subsidies. Additional financial support, such as direct capital cost or operational subsidies, would be necessary to offset the substantial costs associated with carbon capture and storage, emphasizing the economic burden of deploying this environmentally focused configuration.
Overall, the current analysis suggests that SMR with PSA is the most favorable configuration for discount rate subsidies, as it maintains the highest LCC across all discount rate scenarios and remains highly cost-efficient even with further rate reductions. Subsidies targeting the discount rate could significantly enhance the economic appeal of this configuration, making it a prime candidate for policy-driven financial incentives. While discount rate subsidies could also benefit the SMR with a palladium membrane configuration, its sensitivity to rate increases poses a challenge, limiting its competitiveness compared to SMR with PSA. In the case of SMR with a ceramic–carbonate membrane coupled with a CCS, discount rate subsidies alone are unlikely to achieve economic feasibility due to its low baseline LCC. This configuration would require substantial additional support, such as capital cost or operational subsidies, to offset the significant costs of carbon capture and storage, highlighting the need for broader financial strategies to make it a viable option.

4. Discussion

4.1. Economic Comparison

The cost breakdown for different hydrogen production configurations, including SMR, SMR with PSA, SMR with a palladium membrane, and SMR with a ceramic–carbonate membrane coupled with a CCS, reveals significant variations in both capital and operational expenses. Notably, the SMR with a ceramic–carbonate membrane coupled with a CCS configuration demonstrates the highest capital cost, amounting to USD 2,504,565,620 followed by SMR with a palladium membrane, amounting to USD 1,409,131,487. This substantial cost is primarily attributed to the inclusion of palladium membranes, which are expensive and require intricate system designs. This observation aligns with the findings in [22,38], in which it was noted that integrating palladium membranes into production systems significantly increases capital expenditures due to the high cost of palladium and the complexity of the associated infrastructure. In contrast, the SMR with PSA configuration exhibits the lowest capital cost, amounting to USD 478,653,550. This is attributed to the cost-effectiveness and efficiency of PSA technology in hydrogen separation processes. This finding is further supported by reference [17], which highlighted the economic advantages of PSA systems in hydrogen production.
The cost analysis of various configurations highlights notable differences in the expenses associated with membranes and adsorbents. The SMR with a palladium membrane design has a total cost of USD 2,202,164,650, while the SMR with a ceramic–carbonate membrane coupled with a CCS configuration costs USD 1,111,256,622. These high costs are primarily due to the expensive palladium membranes and the advanced materials required for carbon capture systems. As emphasized in [21,39], although palladium-based membranes offer high hydrogen permeance and an excellent separation factor, their inclusion significantly increases system costs. Conversely, the SMR with PSA configuration demonstrates a much lower membrane cost of USD 13,372,050, underscoring the economic efficiency of PSA technology in hydrogen purification.
The operational cost analysis reveals that the SMR with a ceramic–carbonate membrane coupled with a CCS configuration incurs a significantly higher expense of USD 6,997,723,110, surpassing all other configurations. This elevated cost is primarily driven by the additional energy requirements and maintenance demands associated with CCSs. The findings align with the advanced studies in references [9,40], which highlight the substantial economic impacts of integrating carbon dioxide capture technologies, emphasizing their high associated expenses.
A simplified assessment of the LCC for hydrogen production across different configurations—SMR, SMR with PSA, SMR with a palladium membrane, and SMR with a ceramic–carbonate membrane coupled with a CCS—reveals substantial variations in economic efficiency. Among these, the SMR with PSA configuration emerges as the most cost-effective, with the highest LCC at USD 10,368,118,145. This finding aligns with observations made in reference [17], which highlighted PSA technology as more cost-efficient than other hydrogen purification processes, primarily due to its lower capital and operating costs.
The base SMR configuration shows a comparable fan curve with an LCC of USD 9,357,430,509, making it a viable option, though slightly less cost-effective than the SMR with PSA configuration. On the other hand, the SMR with a palladium membrane configuration incurs a lower LCC of USD 7,748,502,947. This decrease is primarily attributed to the high costs associated with palladium membranes and their supporting systems, as noted in [16], in which it is highlighted that integrating palladium membranes significantly raises the capital costs of hydrogen production systems. Among the evaluated configurations, the SMR with a ceramic–carbonate membrane coupled with a CCS design has the least favorable LCC of USD 4,503,887,881, marking it as the most expensive option. This is consistent with findings in references [35,41], which discussed the economic challenges of implementing carbon capture and storage technologies, including substantial upfront investments and operational complexities. While configurations like SMR with a palladium membrane and SMR with a ceramic–carbonate membrane coupled with a CCS offer advantages in terms of increasing hydrogen purity and reducing emissions, their lower LCCs limit their financial viability. Based on the analysis, the SMR with PSA configuration stands out as the most cost-efficient option, offering a balance between economic feasibility and hydrogen production efficiency.

4.2. Feasibility Comparison

The energy consumption versus LCC graph in the Section 3 illustrates the relationship between LCC and energy consumption for three hydrogen production configurations, namely SMR with PSA, SMR with a palladium membrane, and SMR with a ceramic–carbonate membrane coupled with a CCS. Each configuration exhibits a distinct pattern in LCC sensitivity to fluctuations in energy consumption, reflecting the unique economic and operational characteristics of each technology. This analysis underscores how energy demands influence overall costs, providing insights into the cost-effectiveness and operational efficiency of the respective configurations.
The LCC trend for the SMR with PSA configuration remains nearly flat as energy consumption increases, indicating its resilience and efficiency in terms of energy use. This stability in LCC demonstrates that SMR with PSA operates with high energy efficiency and maintains lower operational costs relative to its energy demands. Consequently, this configuration is particularly financially viable for applications where minimizing energy costs is critical, such as facilities managing large volumes of gasses. The flat trend also highlights that fluctuations in energy consumption have minimal impact on overall costs, reinforcing the reliability of SMR with PSA for cost-effective hydrogen production, particularly in scenarios where environmental factors are less critical. As noted in [42,43], PSA technology is versatile and widely applicable in various large-scale industrial contexts, including hydrogen production. PSA systems can be engineered with multiple adsorption columns to ensure uninterrupted hydrogen collection, enhancing total output and improving production efficiency.
Another limitation, as highlighted in reference [43], is that PSA systems exhibit lower efficiency in carbon dioxide capture when integrated with SMR. While PSA is highly effective for hydrogen purification, its ability to separate carbon dioxide remains inadequate, which poses challenges in reducing emissions during hydrogen production. Addressing this limitation often requires integrating additional carbon dioxide capture technologies, such as amine-based systems or membrane separations. However, these supplementary methods introduce added complexity and significantly increase overall costs, thereby impacting the economic feasibility of the process.
The LCC for the SMR with a palladium membrane configuration shows a moderate decrease as energy consumption rises, making it more sensitive to energy consumption changes than SMR with PSA. However, it still provides a relatively stable cost structure. The use of palladium membranes in this configuration ensures high hydrogen purity, though it necessitates additional energy to maintain optimal operating conditions such as temperature and pressure, as noted in references [44,45]. These operational energy demands drive up costs incrementally, leading to a gradual dip in the LCC. Despite this, SMR with a palladium membrane offers a reasonable balance between energy efficiency and product purity, making it a viable option for applications that demand high-purity hydrogen. However, the profitability of this configuration may fluctuate under varying energy conditions, particularly in comparison to the more energy-resilient SMR with PSA option. This suggests that while SMR with a palladium membrane is suitable for specialized uses, its economic stability is more sensitive to energy price volatility.
As energy consumption increases, the LCC of the SMR with a ceramic–carbonate membrane coupled with a CCS configuration drops dramatically, reflecting its strong sensitivity to energy demand. The additional energy required for carbon dioxide capture, compression, and storage significantly impacts the overall cost. As energy consumption grows, the cost of energy becomes the primary driver of the decreasing LCC, presenting a major financial barrier to the widespread adoption of SMR with a ceramic–carbonate membrane coupled with a CCS, particularly in regions with high or limited energy availability. However, despite its lower LCC, the SMR with a ceramic–carbonate membrane coupled with a CCS configuration offers substantial environmental benefits, notably in terms of achieving significant carbon dioxide emission reductions, as emphasized in reference [46]. For organizations with stringent emission reduction targets or those located in regions with strict environmental regulations, the environmental advantages of SMR with a ceramic–carbonate membrane coupled with a CCS may justify the higher costs associated with its implementation.
The graph clearly shows that at the microeconomic level, there are abundant economic opportunities but also notable environmental challenges. Among the configurations, SMR with PSA is optimized for the lowest amperage and, consequently, exhibits the least sensitivity to energy costs, making it the most cost-effective option when energy use is the primary concern [10]. On the other hand, SMR with a palladium membrane offers a relatively stable LCC with high hydrogen purity, making it suitable for applications where purity is a priority, though its costs are more sensitive to energy fluctuations compared to SMR with PSA. Of the three configurations, SMR with a ceramic–carbonate membrane coupled with a CCS is the most environmentally friendly, offering significant carbon dioxide reduction benefits. However, it has the lowest LCC due to its high energy consumption. Therefore, this configuration is most feasible in settings where emission reductions are heavily incentivized or subsidized [47].

4.3. Environmental Impact

From an economic perspective, the SMR with a ceramic–carbonate membrane coupled with a CCS configuration significantly differs from SMR with PSA and SMR with a palladium membrane in terms of LCC. The high sensitivity of SMR with a ceramic–carbonate membrane coupled with a CCS to fluctuations in other cost structures, such as energy costs and discount rates, introduces greater financial risk. This sensitivity is reflected in the significant fluctuations in the LCC dependence on the discount rate, making SMR with a ceramic–carbonate membrane coupled with a CCS the most unpredictable configuration from an economic standpoint. The variability in its costs underscores the financial uncertainty associated with this option, particularly in regions where energy prices or discount rates are volatile.
Despite being costlier than the other configurations and highly sensitive to economic indicators, SMR with a ceramic–carbonate membrane coupled with a CCS offers significant environmental benefits, particularly in terms of reducing carbon dioxide emissions. This makes it a more attractive option when environmental considerations outweigh financial constraints. Palladium-based and ceramic–carbonate membrane reactors, as critiqued in [11,47], facilitate high carbon dioxide capture rates and substantially reduce the global warming potential (GWP) of the produced hydrogen. According to [48], although carbon dioxide capture may exacerbate other environmental impacts, such as ozone depletion potential, the overall reduction in GWP suggests that SMR with a ceramic–carbonate membrane coupled with a CCS is the more sustainable option for long-term hydrogen production.
For applications or regions with stringent environmental standards, high carbon prices, or carbon credit systems, the SMR with a ceramic–carbonate membrane coupled with a CCS configuration, despite its higher initial and operational costs, can be more sustainable in the long run, as it effectively mitigates greenhouse gas emissions. This aligns with the understanding that investments in carbon dioxide capture technologies, while costly, are essential for reducing carbon emissions, particularly in contexts where such reductions are encouraged or required. The higher costs of SMR with a ceramic–carbonate membrane coupled with a CCS can be justified by the long-term environmental benefits and potential financial incentives tied to emission reduction targets.

5. Conclusions

Hydrogen production plays a pivotal role in the global energy transition by providing a cleaner alternative to traditional but polluting fossil fuels. Among the various hydrogen production methods, steam methane reforming (SMR) is one of the most widely adopted and matured technologies, with established infrastructure and proven technology. However, the environmental challenges associated with emissions from SMR necessitate the industry to look into hydrogen purification and carbon capture technologies. Subsequently, this study provided a comprehensive techno-economic assessment of membrane-based hydrogen production, comparing four configurations, namely SMR, SMR with PSA, SMR with a palladium membrane, and SMR with a ceramic–carbonate membrane coupled with a CCS. The primary goal was to evaluate the cost and feasibility of membrane-integrated hydrogen production by analyzing LCC outcomes, conducting sensitivity analysis, and assessing the environmental impact of each configuration. The findings highlight the strengths and weaknesses of each configuration, particularly in terms of cost efficiency and their environmental effects. This analysis provides valuable insights into the appropriate utilization of each system, depending on the specific operational priorities and goals.
The results of this study indicate that SMR with PSA is the most cost-effective option among the three configurations, with the lowest LCC of USD 10,368,118,145 and the lowest capital cost of USD 655,755,363. In comparison, SMR with a palladium membrane and SMR with a ceramic–carbonate membrane coupled with a CCS have significantly higher capital costs of USD 1,930,510,137 and USD 3,431,254,899, respectively. This disparity is primarily attributed to the inherently higher cost associated with membrane technologies. While the higher cost of these membranes contributes to increasing capital, operation, and maintenance costs, it is important to note that the integration of these membranes also brings about additional benefits, including improved hydrogen purification and the facilitation of downstream carbon capture and storage. However, these benefits come at the expense of lower LCC values of SMR with a palladium membrane and SMR with a ceramic–carbonate membrane coupled with a CCS relative to SMR with PSA. These findings highlight the trade-off between cost-effectiveness and technological advancement when utilizing palladium and ceramic–carbonate membranes. Future work will explore the efficiency improvements on configurations utilizing both palladium and ceramic–carbonate membranes, thereby investigating how these configurations could be made more environmentally and economically competitive at the same time.
In terms of sensitivity to energy consumption, SMR with ceramic–carbonate membrane coupled with a CCS exhibits the largest variation in LCC, ranging from USD 3,805,777,576 at an energy consumption level of 1.35 to USD 8,828,753,267 at 0.35. Sensitivity analysis further validates the cost-efficiency of SMR with PSA across variations in production rates and hydrogen prices. At a production rate of 1.0 and a hydrogen price of 0.85, the LCC of SMR with PSA stands at USD 8.6 billion. Under the same conditions, the LCCs for SMR with a palladium membrane and SMR with a ceramic–carbonate membrane coupled with a CCS are significantly higher, at USD 5.83 billion and USD 3.33 billion, respectively.
Furthermore, equipment and maintenance costs significantly impact the LCC, especially for SMR with a ceramic–carbonate membrane coupled with a CCS. When the technical parameters were scaled up to 1.5, the LCC for SMR with a ceramic–carbonate membrane coupled with a CCS increased to USD 3.9 billion, remaining lower than that of other systems. The discount rate also played a crucial role, with higher rates amplifying cost disparities between the technologies, benefiting SMR with PSA due to its lower capital investment and operating expenses. These findings highlight that while SMR with PSA offers superior economic prospects and lower energy expenses, the cost challenges associated with SMR with a palladium membrane and SMR with a ceramic–carbonate membrane coupled with a CCS are primarily driven by high membrane costs, equipment and maintenance expenses, and their dependence on key operational and economic factors such as production rates and discount rates.
The study results clearly indicate that while SMR with PSA is the most cost-effective configuration with higher system reliability, it offers limited carbon dioxide capture benefits compared to the SMR with a ceramic–carbonate membrane coupled with a CCS option. In contrast, the SMR with a ceramic–carbonate membrane coupled with a CCS configuration, while incurring higher costs and being more sensitive to economic factors, provides the greatest reduction in carbon emissions. Therefore, its application is more suitable in regions where environmental considerations and carbon footprint reduction are prioritized over cost concerns. Meanwhile, the SMR with a palladium membrane option strikes a balance between cost-effectiveness and environmental feasibility, offering a compromise between the two factors.
In general, the assessment highlights the critical compromises between cost efficiency and sustainability in utilizing membranes for hydrogen production. Cost-effective configurations, such as SMR with PSA, are suitable for achieving low production costs, while configurations like SMR with a ceramic–carbonate membrane coupled with a CCS, which are more sensitive to environmental considerations, can help meet carbon reduction goals. Future research could incorporate real-time process simulations, environmental and safety assessment tools, and compare the presented configurations with other hydrogen production methods. This would enable more detailed evaluations of how membrane-based hydrogen production systems can meet both current and future industry demands, as well as comply with evolving regulatory frameworks.

Author Contributions

Conceptualization, H.S. and P.E.A.; methodology, D.N.H.A.P.H.O.A. and P.E.A.; software, D.N.H.A.P.H.O.A. and P.E.A.; validation, D.N.H.A.P.H.O.A., H.S. and P.E.A.; formal analysis, D.N.H.A.P.H.O.A. and P.E.A.; investigation, D.N.H.A.P.H.O.A.; data curation, D.N.H.A.P.H.O.A. and P.E.A.; writing—original draft preparation, D.N.H.A.P.H.O.A., H.S. and P.E.A.; writing—review and editing, D.N.H.A.P.H.O.A., H.S. and P.E.A.; supervision, H.S. and P.E.A.; project administration, H.S. and P.E.A.; funding acquisition, P.E.A. All authors have read and agreed to the published version of the manuscript.

Funding

The APC was funded by Universiti Brunei Darussalam Research grant no. UBD/RSCH/1.3/FICBF(b)/2024/023.

Data Availability Statement

The data presented in this study are openly available in article.

Conflicts of Interest

The authors declare no conflicts of interest.

References

  1. Danial, M.; Azis, F.A.; Abas, P.E. Techno-Economic Analysis and Feasibility Studies of Electric Vehicle Charging Station. World Electr. Veh. J. 2021, 12, 264. [Google Scholar] [CrossRef]
  2. Mahlia, T.M.I.; Lim, J.Y.; Aditya, L.; Riayatsyah, T.M.I.; Abas, A.E.P.; Nasruddin. Methodology for implementing power plant efficiency standards for power generation: Potential emission reduction. Clean Technol. Environ. Policy 2018, 20, 309–327. [Google Scholar] [CrossRef]
  3. Sheta, W.; Abdeltawab, N.M.; Shash, A.Y. Economical study for hydrogen production from seawater using renewable energy in Egypt. Mater. Werkst. 2023, 54, 371–384. [Google Scholar] [CrossRef]
  4. Kamaroddin, M.F.A.; Sabli, N.; Abdullah, T.A.T.; Siajam, S.I.; Abdullah, L.C.; Jalil, A.A.; Ahmad, A. Membrane-Based Electrolysis for Hydrogen Production: A Review. Membranes 2021, 11, 810. [Google Scholar] [CrossRef]
  5. Bauer, C.; Treyer, K.; Antonini, C.; Bergerson, J.; Gazzani, M.; Gencer, E.; Gibbins, J.; Mazzotti, M.; McCoy, S.T.; McKenna, R.; et al. On the climate impacts of blue hydrogen production. chemRxiv 2021. [Google Scholar] [CrossRef]
  6. Zhang, K.; Lau, H.C.; Chen, Z. Using Blue Hydrogen to Decarbonize Heavy Oil and Oil Sands Operations in Canada. ACS Sustain. Chem. Eng. 2022, 10, 10003–10013. [Google Scholar] [CrossRef]
  7. Accelerating SDGs, Diversity, Equity, and Inclusion in Hydrogen. Hydrogen Council. Available online: https://hydrogencouncil.com/en/accelerating-sdgs-diversity-equity-and-inclusion-in-hydrogen/ (accessed on 9 November 2024).
  8. The 17 Goals. Sustainable Development. Available online: https://sdgs.un.org/goals (accessed on 9 November 2024).
  9. Katebah, M.; Al-Rawashdeh, M.; Linke, P. Analysis of hydrogen production costs in Steam-Methane Reforming considering integration with electrolysis and CO2 capture. Clean. Eng. Technol. 2022, 10, 100552. [Google Scholar] [CrossRef]
  10. Oni, A.O.; Anaya, K.; Giwa, T.; Di Lullo, G.; Kumar, A. Comparative assessment of blue hydrogen from steam methane reforming, autothermal reforming, and natural gas decomposition technologies for natural gas-producing regions. Energy Convers. Manag. 2022, 254, 115245. [Google Scholar] [CrossRef]
  11. Liguori, S.; Kian, K.; Buggy, N.; Anzelmo, B.H.; Wilcox, J. Opportunities and challenges of low-carbon hydrogen via metallic membranes. Prog. Energy Combust. Sci. 2020, 80, 100851. [Google Scholar] [CrossRef]
  12. Appari, S.; Janardhanan, V.M.; Bauri, R.; Jayanti, S. Deactivation and regeneration of Ni catalyst during steam reforming of model biogas: An experimental investigation. Int. J. Hydrogen Energy 2014, 39, 297–304. [Google Scholar] [CrossRef]
  13. Tan, R.; Zhuge, K.; Ma, X.; Mou, X.; Ren, M.; Chang, R.; Zhou, Q.; Yan, L.; Lin, R.; Ding, Y. Interfacial effects of Cu/Fe3O4 in water-gas shift reaction: Role of Fe3O4 crystallite sizes. Int. J. Hydrogen Energy 2024, 78, 741–752. [Google Scholar] [CrossRef]
  14. Al Hameli, F.; Belhaj, H.; Al Dhuhoori, M. CO2 Sequestration Overview in Geological Formations: Trapping Mechanisms Matrix Assessment. Energies 2022, 15, 7805. [Google Scholar] [CrossRef]
  15. Chen, F.; Chen, B.; Ma, Z.; Mehana, M. Economic assessment of clean hydrogen production from fossil fuels in the intermountain-west region, USA. Renew. Sustain. Energy Transit. 2024, 5, 100077. [Google Scholar] [CrossRef]
  16. Zang, P.; Tang, J.; Zhang, X.; Cui, L.; Chen, J.; Zhao, P.; Dong, Y. Strategies to improve CaO absorption cycle stability and progress of catalysts in Ca-based DFMs for integrated CO2 capture-conversion: A critical review. J. Environ. Chem. Eng. 2023, 11, 111047. [Google Scholar] [CrossRef]
  17. Burgers, I.; Dehdari, L.; Xiao, P.; Li, K.G.; Goetheer, E.; Webley, P. Techno-economic analysis of PSA separation for hydrogen/natural gas mixtures at hydrogen refuelling stations. Int. J. Hydrogen Energy 2022, 47, 36163–36174. [Google Scholar] [CrossRef]
  18. Soo, X.Y.D.; Lee, J.J.C.; Wu, W.-Y.; Tao, L.; Wang, C.; Zhu, Q.; Bu, J. Advancements in CO2 capture by absorption and adsorption: A comprehensive review. J. CO2 Util. 2024, 81, 102727. [Google Scholar] [CrossRef]
  19. Delgado, J.A.; Águeda, V.I.; Uguina, M.A.; Sotelo, J.L.; Brea, P.; Grande, C.A. Adsorption and diffusion of H2, CO, CH4, and CO2 in BPL activated carbon and 13X zeolite: Evaluation of performance in pressure swing adsorption hydrogen purification by simulation. Ind. Eng. Chem. Res. 2014, 53, 15414–15426. [Google Scholar] [CrossRef]
  20. Song, H.; Liu, Y.; Bian, H.; Shen, M.; Lin, X. Energy, environment, and economic analyses on a novel hydrogen production method by electrified steam methane reforming with renewable energy accommodation. Energy Convers. Manag. 2022, 258, 115513. [Google Scholar] [CrossRef]
  21. Kolor, E.; Usman, M.; Boonyubol, S.; Mikami, K.; Cross, J.S. Advances in Palladium-Based Membrane Research: High-Throughput Techniques and Machine Learning Perspectives. Processes 2024, 12, 2855. [Google Scholar] [CrossRef]
  22. Al-Mufachi, N.A.; Rees, N.V.; Steinberger-Wilkens, R. Hydrogen selective membranes: A review of palladium-based dense metal membranes. Renew. Sustain. Energy Rev. 2015, 47, 540–551. [Google Scholar] [CrossRef]
  23. Bhalani, D.V.; Lim, B. Hydrogen Separation Membranes: A Material Perspective. Molecules 2024, 29, 4676. [Google Scholar] [CrossRef]
  24. Chen, T.; Xu, Y.; Zhang, Y.; Gong, Y.; Zhang, Y.; Lin, J.Y.S. Double-layer ceramic-carbonate hollow fiber membrane with superior mechanical strength for CO2 separation. J. Memb. Sci. 2022, 658, 120701. [Google Scholar] [CrossRef]
  25. Ishimoto, Y.; Wulf, C.; Schonhoff, A.; Kuckshinrichs, W. Life cycle costing approaches of fuel cell and hydrogen systems: A literature review. Int. J. Hydrogen Energy 2024, 54, 361–374. [Google Scholar] [CrossRef]
  26. Khzouz, M.; Gkanas, E.I.; Shao, J.; Sher, F.; Beherskyi, D.; El-Kharouf, A.; Al Qubeissi, M. Life Cycle Costing Analysis: Tools and Applications for Determining Hydrogen Production Cost for Fuel Cell Vehicle Technology. Energies 2020, 13, 3783. [Google Scholar] [CrossRef]
  27. Riayatsyah, T.M.I.; Ong, H.C.; Chong, W.T.; Aditya, L.; Hermansyah, H.; Mahlia, T.M.I. Life Cycle Cost and Sensitivity Analysis of Reutealis trisperma as Non-Edible Feedstock for Future Biodiesel Production. Energies 2017, 10, 877. [Google Scholar] [CrossRef]
  28. Manpower Planning and Employment Council (MPEC) Secretariat Prime Minister’s Office. Majlis Perancangan Ekonomi dan Kewangan (MPEC), Salary Guideline—2023 Edition, Brunei Darussalam: MPEC. 2023. Available online: https://www.mpec.gov.bn/Lists/EmployeePoliciesAndGuidelines/Attachments/8/Salary%20Guideline%20-%202023%20Edition.pdf (accessed on 13 January 2025).
  29. Manufacturing Insurance Costs Explained: A Comprehensive Guide for Manufacturers. Available online: https://allenthomasgroup.com/manufacturing-insurance-costs/ (accessed on 13 January 2025).
  30. Insurance—Chemical Engineering Projects. Available online: https://chemicalprojects.wordpress.com/tag/insurance/ (accessed on 13 January 2025).
  31. Hamilton, S. Must Chemical Companies Outsource Logistics to Save Money; ChemLogix LLC: Blue Bell, PA, USA, 2003. [Google Scholar]
  32. Towler, G.; Sinnott, R. Chemical Engineering Design: Principles, Practice and Economics of Plant and Process Design; Elsevier: Amsterdam, The Netherlands, 2021. [Google Scholar] [CrossRef]
  33. Economics—SGH2 Energy. Available online: https://www.sgh2energy.com/economics (accessed on 9 November 2024).
  34. Synapse Carbon Dioxide Price Forecast. Synapse Energy. Available online: https://www.synapse-energy.com/synapse-carbon-dioxide-price-forecast (accessed on 10 November 2024).
  35. Qiao, Y.; Liu, W.; Guo, R.; Sun, S.; Zhang, S.; Bailey, J.J.; Fang, M.; Wu, C. Techno-economic analysis of integrated carbon capture and utilisation compared with carbon capture and utilisation with syngas production. Fuel 2023, 332, 125972. [Google Scholar] [CrossRef]
  36. Arfan, M.; Eriksson, O.; Wang, Z.; Soam, S. Life cycle assessment and life cycle costing of hydrogen production from biowaste and biomass in Sweden. Energy Convers. Manag. 2023, 291, 117262. [Google Scholar] [CrossRef]
  37. Operating Hours for Plant Capacity—Chemical Plant Design & Operations. Eng-Tips. Available online: https://www.eng-tips.com/threads/operating-hours-for-plant-capacity.389883/ (accessed on 10 November 2024).
  38. Chen, W.H.; Hsu, P.C.; Lin, B.J. Hydrogen permeation dynamics across a palladium membrane in a varying pressure environment. Int. J. Hydrogen Energy 2010, 35, 5410–5418. [Google Scholar] [CrossRef]
  39. Fernandes, F.A.N.; Soares, A.B. Methane steam reforming modeling in a palladium membrane reactor. Fuel 2006, 85, 569–573. [Google Scholar] [CrossRef]
  40. Lee, H.; Lee, B.; Byun, M.; Lim, H. Comparative techno-economic analysis for steam methane reforming in a sorption-enhanced membrane reactor: Simultaneous H2 production and CO2 capture. Chem. Eng. Res. Des. 2021, 171, 383–394. [Google Scholar] [CrossRef]
  41. Xu, G.; Qian, H.; Zhang, Q.; Alsenani, T.R.; Bouzgarrou, S.; Alturise, F. Integration of biomass gasification and O2/H2 separation membranes for H2 production/separation with inherent CO2 capture: Techno-economic evaluation and artificial neural network based multi-objective optimization. Renew. Energy 2024, 224, 120150. [Google Scholar] [CrossRef]
  42. Golmakani, A.; Fatemi, S.; Tamnanloo, J. Investigating PSA, VSA, and TSA methods in SMR unit of refineries for hydrogen production with fuel cell specification. Sep. Purif. Technol. 2017, 176, 73–91. [Google Scholar] [CrossRef]
  43. Shi, W.; Yang, H.; Shen, Y.; Fu, Q.; Zhang, D.; Fu, B. Two-stage PSA/VSA to produce H2 with CO2 capture via steam methane reforming (SMR). Int. J. Hydrogen Energy 2018, 43, 19057–19074. [Google Scholar] [CrossRef]
  44. Al-Rowaili, F.N.; Khaled, M.; Jamal, A.; Zahid, U. Mixed matrix membranes for H2/CO2 gas separation—A critical review. Fuel 2023, 333, 126285. [Google Scholar] [CrossRef]
  45. Palma, V.; Barba, D.; Meloni, E.; Ruocco, C.; Martino, M. Membrane reactors for H2 and energy production. In Current Trends and Future Developments on (Bio-) Membranes: Membrane Systems for Hydrogen Production; Elsevier: Amsterdam, The Netherlands, 2020; pp. 33–56. [Google Scholar] [CrossRef]
  46. Lin, J.Y.S.; Huang, K. High Temperature Ceramic-Carbonate Dual-Phase Membrane Reactor for Pre-Combustion Carbon Dioxide Capture; U.S. Department of Energy, Office of Scientific and Technical Information: Tempe, AZ, USA, 2022.
  47. Wu, H.C.; Rui, Z.; Lin, J.Y.S. Hydrogen production with carbon dioxide capture by dual-phase ceramic-carbonate membrane reactor via steam reforming of methane. J. Memb. Sci. 2020, 598, 117780. [Google Scholar] [CrossRef]
  48. Norton, T.T.; Lin, Y.S. Ceramic–carbonate dual-phase membrane with improved chemical stability for carbon dioxide separation at high temperature. Solid State Ion. 2014, 263, 172–179. [Google Scholar] [CrossRef]
Figure 1. Projected trends in global hydrogen demand across key industries, including transportation, industry, power generation, and refining, by 2050 (a). Projected decline in the demand for gray hydrogen, with a shift toward the adoption of green and blue hydrogen by 2050 (b). (Adapted from [5,6], respectively).
Hydrogen 06 00009 g001
Figure 2. Block flow diagram of the SMR process with carbon sequestration.
Hydrogen 06 00009 g002
Figure 3. Cost breakdown of SMR, SMR with PSA, SMR with a palladium membrane, and SMR with a ceramic–carbonate membrane coupled with a CCS.
Hydrogen 06 00009 g003
Figure 4. Bar chart presentation of LCC for hydrogen production using SMR, SMR with PSA, SMR with a palladium membrane, and SMR with a ceramic–carbonate membrane coupled with a CCS.
Hydrogen 06 00009 g004
Figure 5. Line chart representation of LCC with energy consumption for SMR with PSA, SMR with a palladium membrane, and SMR with a ceramic–carbonate membrane coupled with a CCS.
Hydrogen 06 00009 g005
Figure 6. Tornado chart representation of key parameters in sensitivity analysis.
Hydrogen 06 00009 g006
Figure 7. Effect of varying the hydrogen price and its production rate on the LCC of SMR with PSA, SMR with a palladium membrane, and SMR with a ceramic–carbonate membrane coupled with a CCS.
Hydrogen 06 00009 g007
Figure 8. Effect of varying the hydrogen price and its production rate on the LCC of SMR.
Hydrogen 06 00009 g008
Figure 9. Effect of varying the equipment and maintenance costs on the LCC of SMR with PSA, SMR with a palladium membrane, and SMR with a ceramic–carbonate membrane coupled with a CCS.
Hydrogen 06 00009 g009
Figure 10. Effect of varying the discount rate on the LCC of SMR with PSA, SMR with a palladium membrane, and SMR with a ceramic–carbonate membrane coupled with a CCS.
Hydrogen 06 00009 g010
Table 1. The selling prices of the different types of hydrogen, carbon dioxide, and carbon monoxide.
ParameterValueUnitReference
Gray Hydrogen Price6USD/kg[33]
Green Hydrogen Price8USD/kg[33]
Blue Hydrogen Price8USD/kg[33]
Carbon Dioxide Price25USD/tonne[34]
Carbon Monoxide Price720.25USD/tonne[35]
Table 2. Important parameters used for the techno-economic analysis.
ParameterValueUnitReference
Plant Size/System Capacity (Large Scale)182,500ton/year[9]
Plant Lifetime20year[36]
Plant Operational Hour8103h/year[37]
Hydrogen Production Rate 20,830 or 500kg H2/h ton/day[9]
Hydrogen Production Rate182,500ton/year[9]
Carbon Dioxide Production Rate902,375ton/year[33]
Carbon Monoxide Production Rate42,269ton/year[33]
Table 3. LCC breakdown of each configuration.
SMRSMR with PSASMR with Palladium MembraneSMR with Ceramic–Carbonate Membrane Coupled with CCS
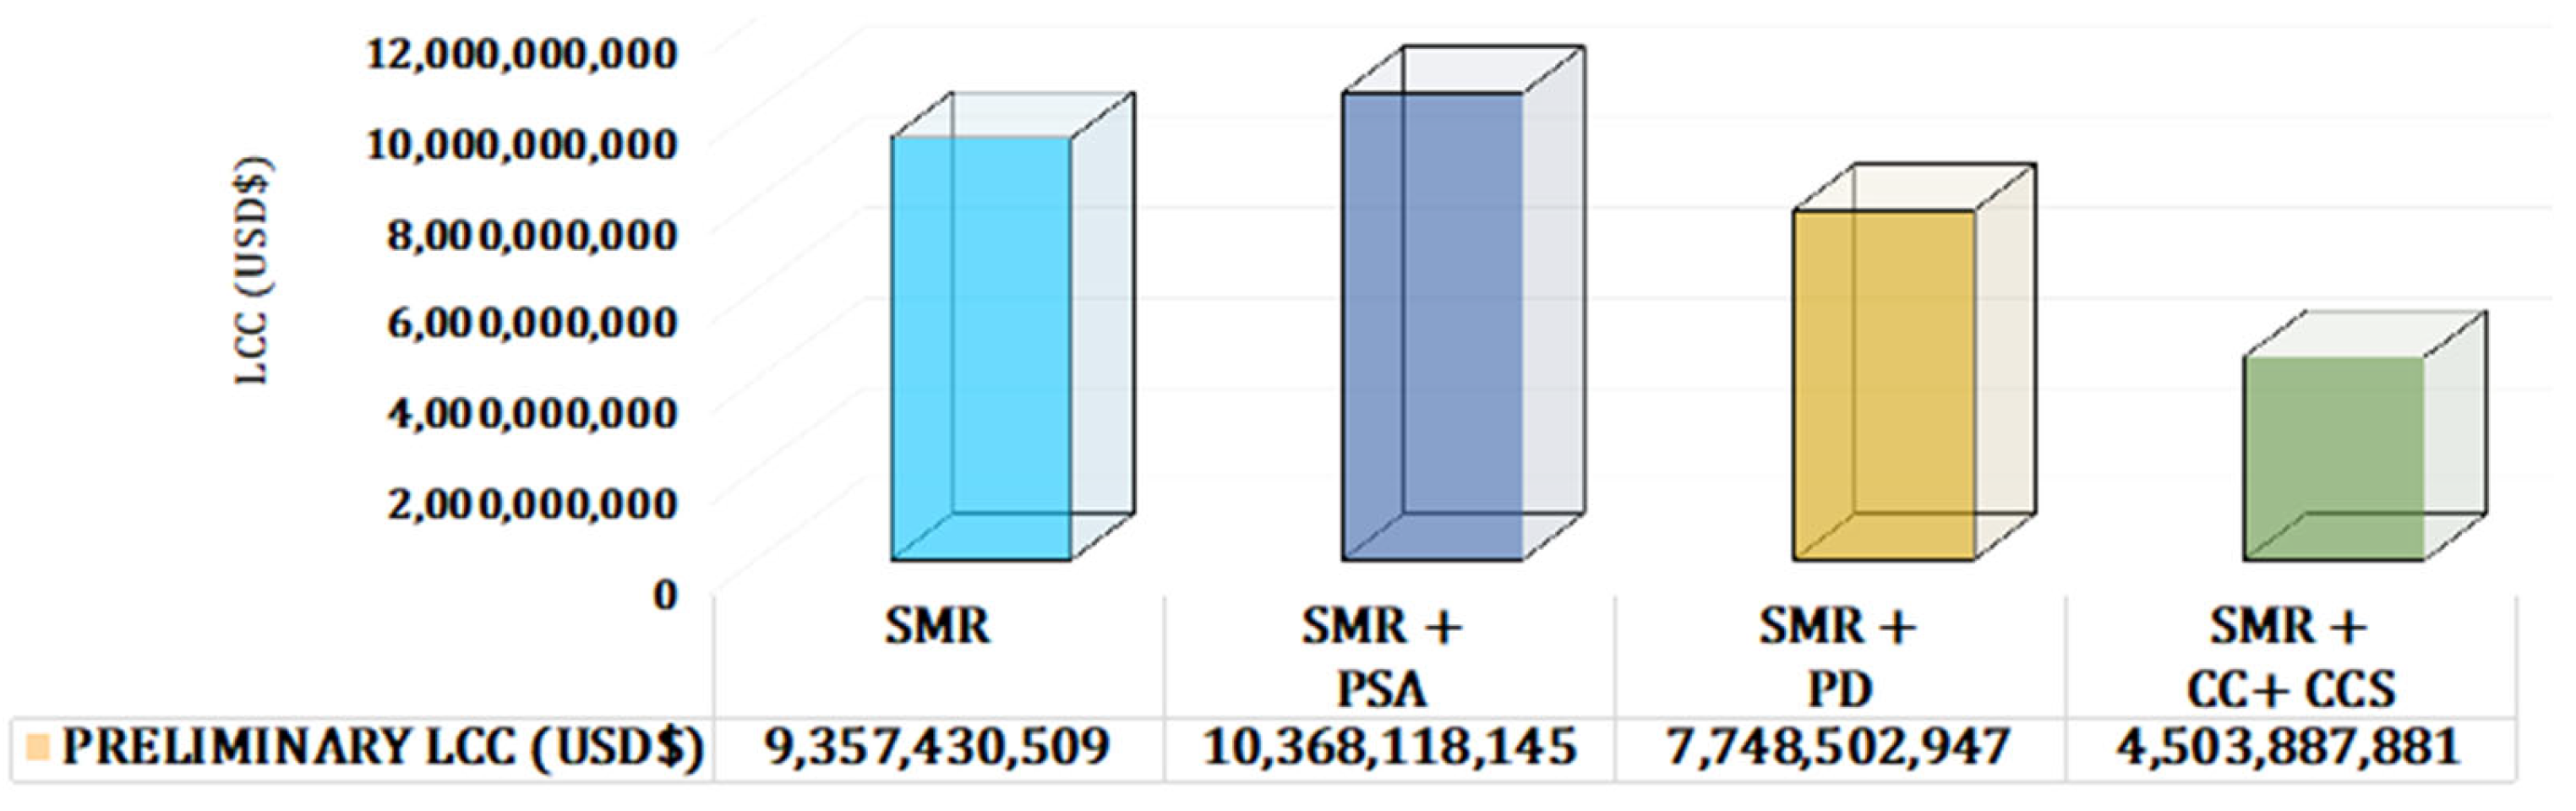
Preliminary LCC (USD)9,357,430,50910,368,118,1457,748,502,9474,503,887,881
Table 4. Sensitivity analysis for SMR.
LCC (USD$)
ParameterLowBaseHigh
Production Rate (+/−30%) 6.29 × 1099.36 × 1091.24 × 1010
Hydrogen Price (+/−15%)7.60 × 1099.36 × 1091.11 × 1010
Feedstock Price (+/−40%) 8.52 × 1099.36 × 1091.41 × 1010
Disclaimer/Publisher’s Note: The statements, opinions and data contained in all publications are solely those of the individual author(s) and contributor(s) and not of MDPI and/or the editor(s). MDPI and/or the editor(s) disclaim responsibility for any injury to people or property resulting from any ideas, methods, instructions or products referred to in the content.

