Article

Integration of Wind Energy and Geological Hydrogen Storage in the Bakken Formation, North Dakota: Assessing the Potential of Depleted Reservoirs for Hydrogen Storage

1
Department of Energy Engineering, University of North Dakota, Grand Forks, ND 58202, USA
2
Department of Petroleum Engineering, University of North Dakota, Grand Forks, ND 58202, USA
*
Authors to whom correspondence should be addressed.
Hydrogen 2024, 5(4), 737-760; https://doi.org/10.3390/hydrogen5040039
Submission received: 20 July 2024 / Revised: 28 August 2024 / Accepted: 15 October 2024 / Published: 17 October 2024

Abstract

:
Geological hydrogen storage, seen as a viable solution for addressing energy demands and mitigating the intermittency of wind power, is gaining recognition. At present, there are no specific studies that estimate hydrogen storage capacity and the potential for wind integration in North Dakota despite the state’s enormous energy resources and capabilities. The study’s key innovation lies in repurposing a region historically associated with oil and gas for sustainable energy storage, thereby addressing the intermittency of wind sources. Moreover, the innovative aspect of this study involves field selection, site screening, characterization, and mathematical modeling to simulate a wind–hydrogen production and geological storage system. A 15 MW wind farm, using real-world data from General Electric wind turbines, is employed to assess storage capacities within the Middle Bakken formation. The study reveals substantial storage potentials in wells W24814, W19693, and W26990, with capacities of 54,000, 33,000, and 22,000 tons, respectively. These capacities translate to energy storage capabilities of 1080, 660, and 440 GWh, with minimum storage durations of 140, 80, and 57 days, respectively, under a 60% system efficiency. By pioneering the integration of wind energy with geological hydrogen storage in a region traditionally dominated by fossil fuel extraction, this research could play a crucial role in advancing North Dakota’s energy transition, providing a blueprint for similar initiatives globally.

1. Introduction

Renewable energy sources like solar and wind power have gained significant attention due to their abundant potential and minimal environmental impact [1,2]. However, the intermittent and variable nature of renewables necessitates effective storage solutions to ensure a stable and reliable energy supply [3,4]. Hydrogen (H2) storage offers a complementary solution, providing high-energy density storage that batteries alone cannot achieve [5]. The global community is increasingly embracing H2 as a sustainable solution to reduce its carbon footprint [6], and various sectors such as transportation, industrial processes, power generation, and residential heating can utilize H2-based economies that align with renewable energy trends. The need for greenhouse gas abatement [7,8], technological advancements [9,10], governmental commitments [11], targets from leading industry actors [12], and various policy frameworks in conjunction with international endeavors are driving this transition [13].
Several methods for H2 generation exist, with steam methane reforming (SMR), electrolysis, and gasification being the main processes globally [10,12]. One of the more readily deployed is SMR, which uses natural gas (blue H2 or gray H2) and electrolysis fueled by renewable energy (green H2). To mitigate challenges associated with H2 generation and foster large-scale deployment of renewable energies, a highly competitive, scalable, safe, and environmentally friendly energy storage solution is indispensable. H2 is positioned as one of the best-suited options [14].
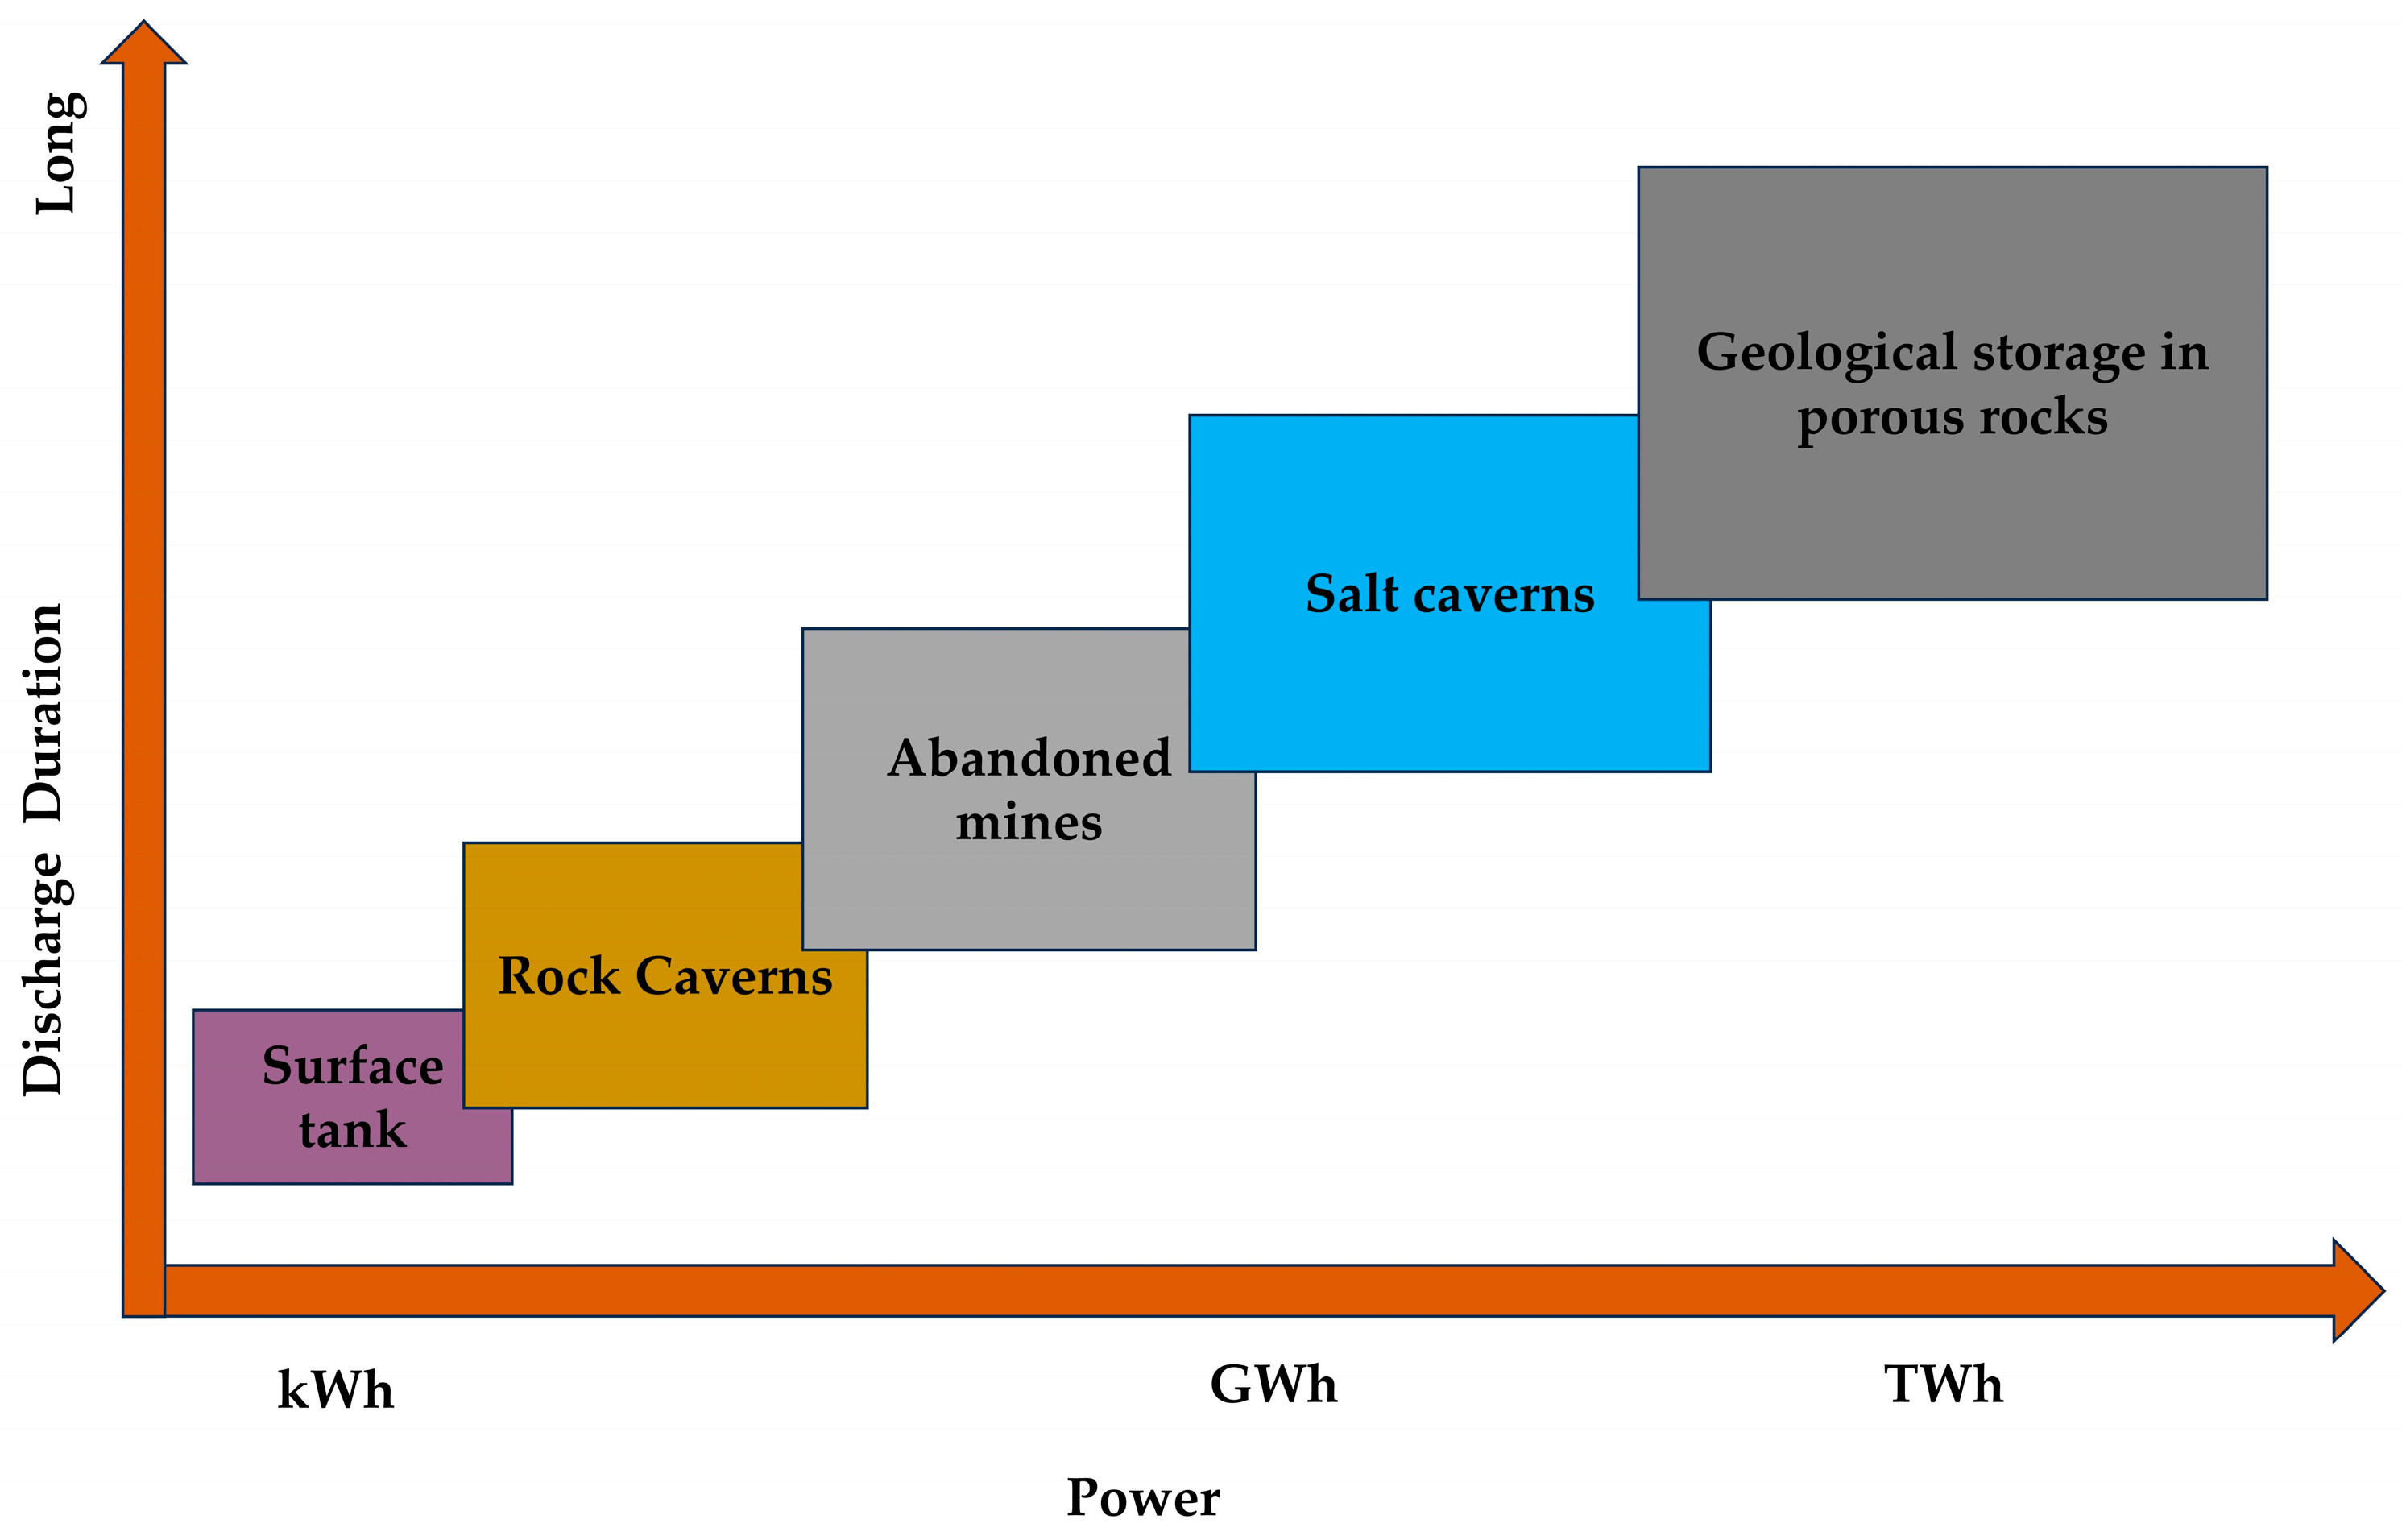
To accommodate the surplus H2 being produced, large-scale H2 storage facilities need to be constructed. Underground hydrogen storage (UHS) has gained significant attention due to its cost-effectiveness, scalability, safety, and extensive storage capacity, often surpassing surface storage methods by orders of magnitude [15,16,17]. Underground reservoirs (Figure 1), such as depleted oil and gas formations, aquifers, and salt caverns, provide substantial storage capacity with minimal environmental impact, making them attractive options for large-scale energy storage (Figure 2) [18,19].
Several UHS projects are now reported to have been successfully operated through an increasingly number of studies (Table 1) [16,20], which is promising for the future use of UHS as a long-duration, large-scale H2 storage technology. It involves selecting suitable geological reservoirs based on physical-chemical properties, reservoir tightness, and geochemical interactions [20]. While it is synonymous with CO2 storage, H2 storage is typically short-term and has different physical-chemical requirements compared to CO2 storage [21].
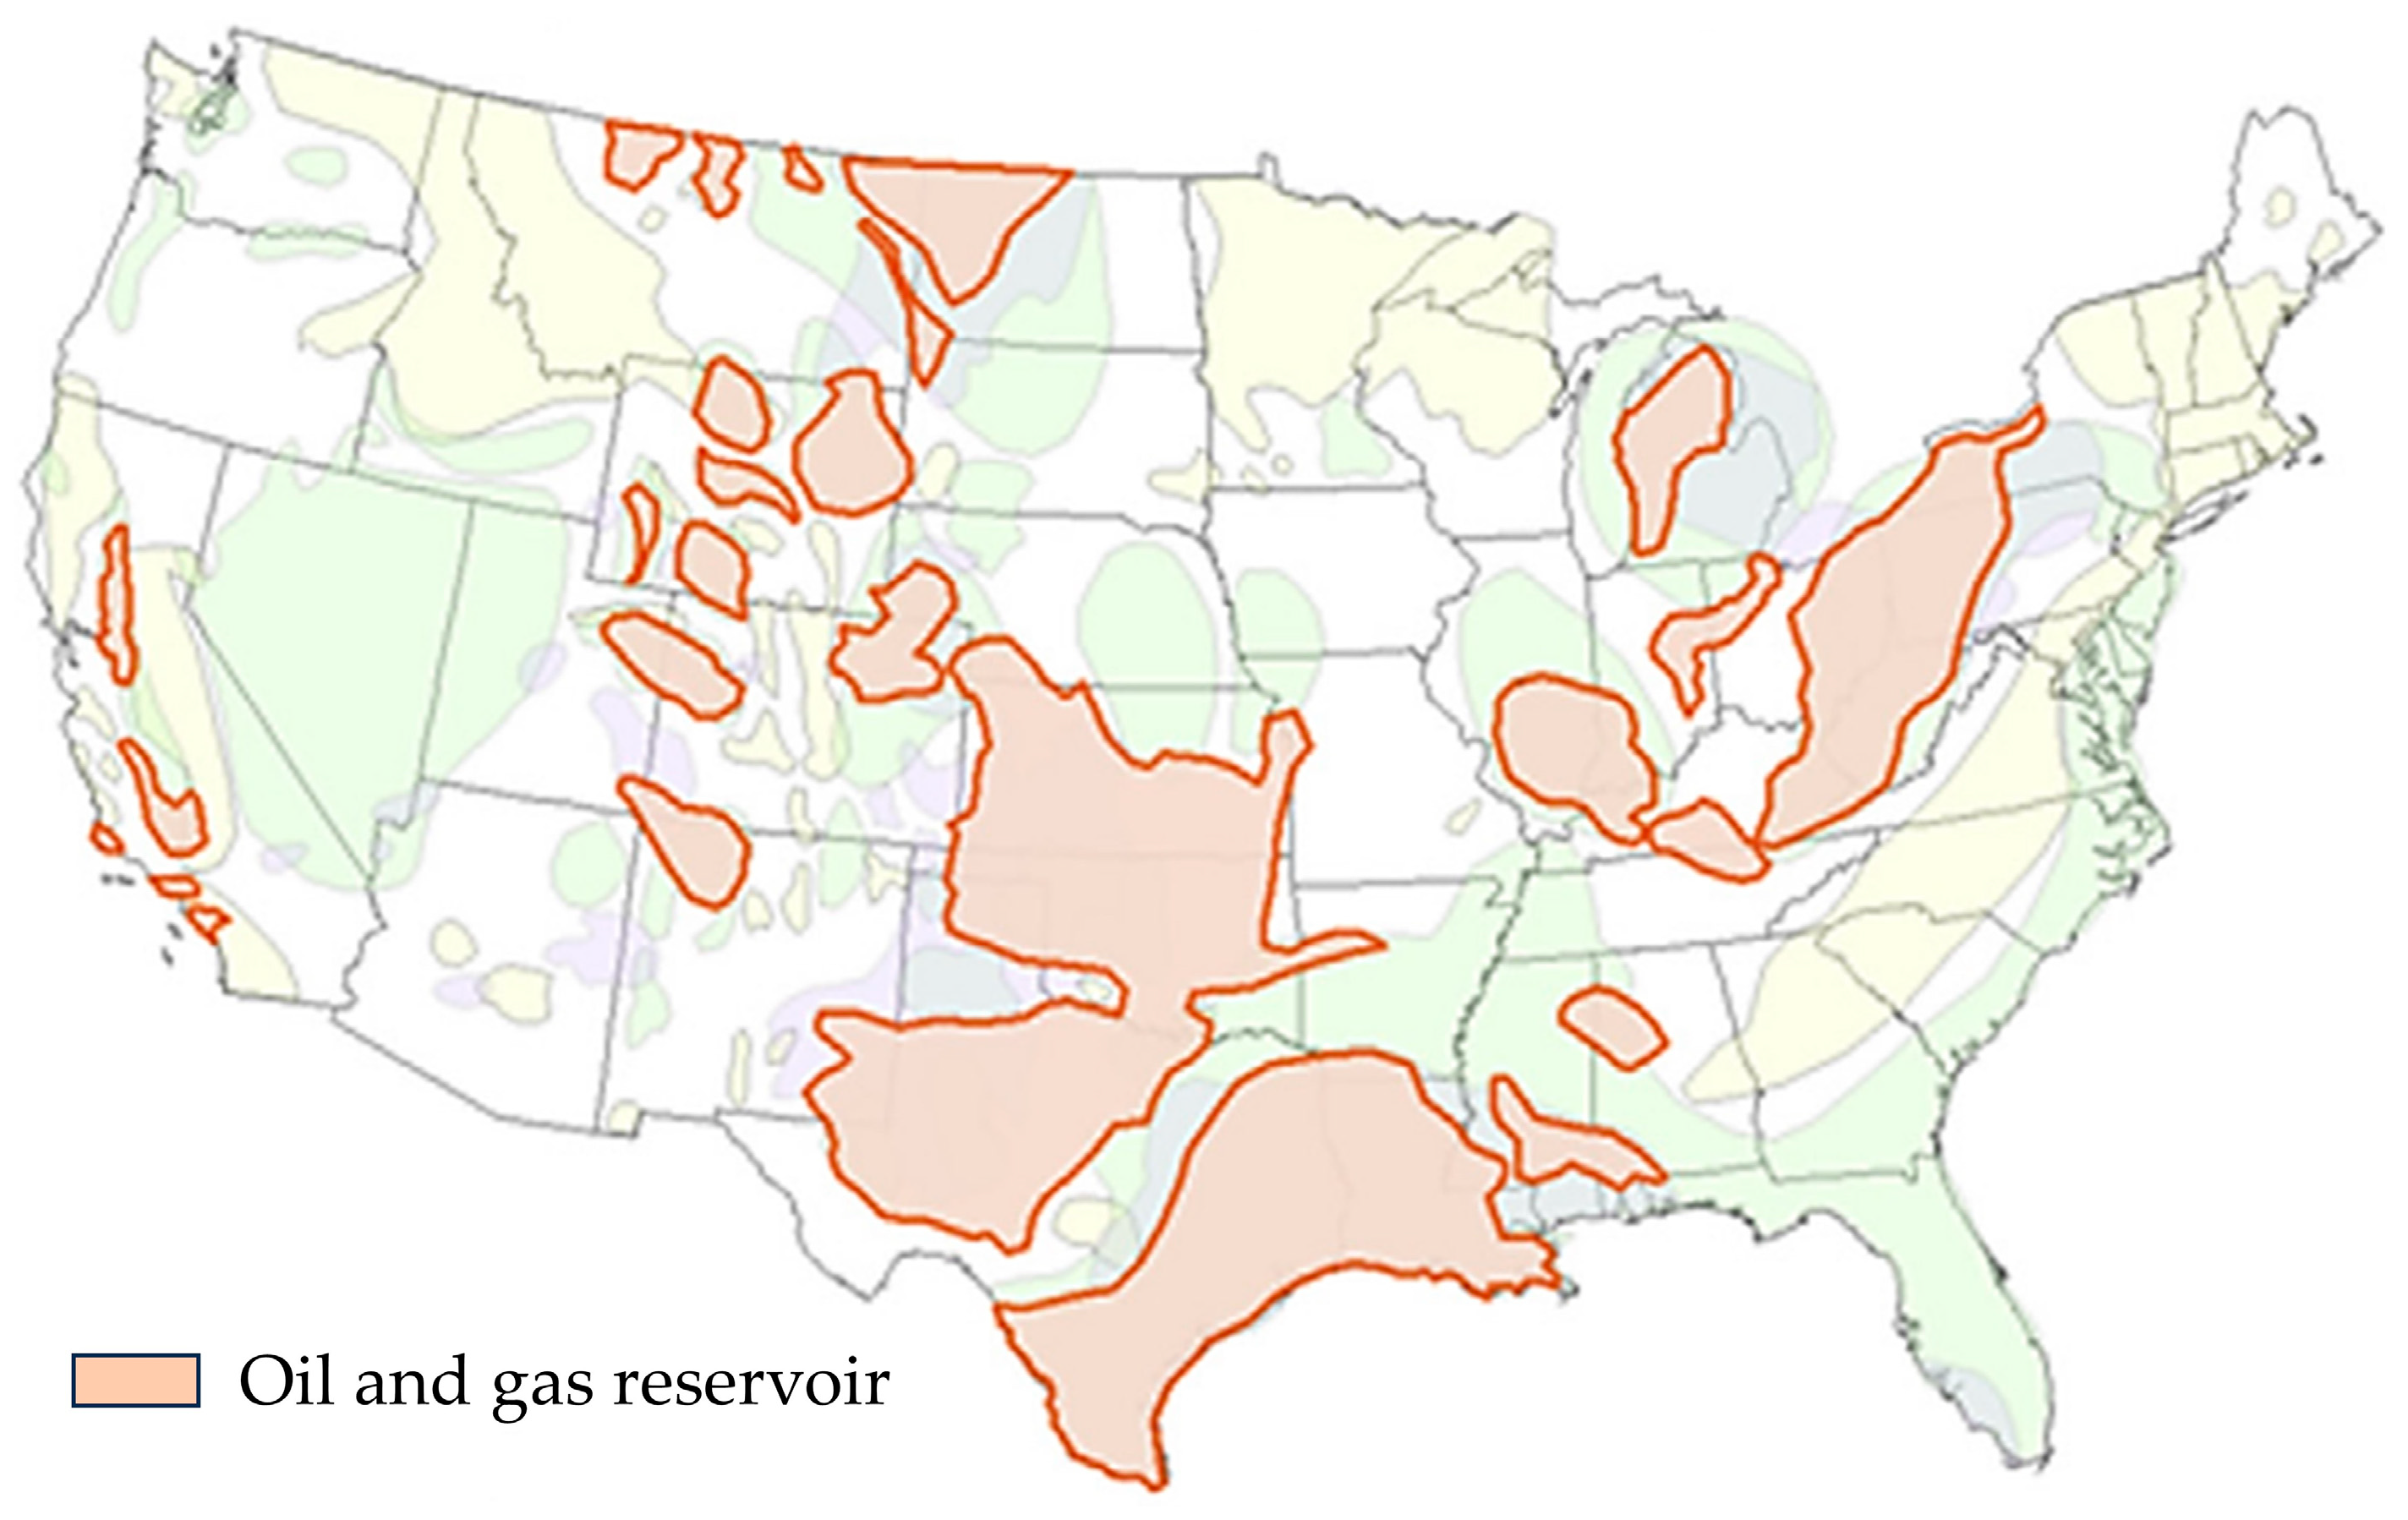
The U.S. government is currently implementing strategies to incorporate H2 into the national energy system, with a strong focus on clean H2 [13]. As experts in national energy planning predict a rapid growth in wind energy generation, using wind-generated electricity to produce green H2 for export could play a crucial role in making H2 an economically viable energy carrier for the country [22]. Measures such as establishing H2 storage in geological reservoirs are necessary to ensure sufficient hydrogen for export and enhance the security of the United States (U.S.) electricity sector. The U.S. Bureau of Economic Geology identifies dissolution cavities in salt domes, depleted oil and gas fields, and brine reservoirs as viable options for large-scale geological storage (Figure 3). However, further research and development are required to create a more extensive inventory of suitable storage locations throughout the United States. Table 2 provides an overview of large-scale UHS in the United States.
However, UHS is a relatively new field that is expected to significantly impact its long-term energy carrier viability. It involves selecting suitable geological reservoirs based on physical-chemical properties, reservoir tightness, and geochemical interactions [20]. While it is synonymous with CO2 storage, H2 storage is typically short-term and has different physical-chemical requirements compared to CO2 storage [21].
The U.S. government is currently implementing strategies to incorporate H2 into the national energy system, with a strong focus on clean H2 [13]. Concurrently, experts in national energy planning predict a rapid growth in wind energy generation [22]. As a result, using wind-generated electricity to produce green H2 for export could play a crucial role in making H2 an economically viable energy carrier for the country. Moreover, to ensure sufficient hydrogen for export, and enhance the security of the U.S. electricity sector, measures such as establishing H2 storage in geological reservoirs are necessary. The U.S. Bureau of Economic Geology identifies dissolution cavities in salt domes, depleted oil and gas fields, and brine reservoirs as viable options for large-scale geological storage (Figure 3). However, further research and development are required to create a more extensive inventory of suitable storage locations throughout the United States. Table 2 provides an overview of large-scale UHS in the United States.
Furthermore, among the available options, depleted oil and gas reservoirs have gained attention due to their well-understood geological structures, high density, intact source rock, and existing surface and subsurface infrastructure [25]. They have proven to be a cost-effective solution [1] and offer H2 storage capacities several times larger than other types (Figure 3) when comparing discharge duration and power [26]. Table 3 provides typical selection criteria for depleted hydrocarbon reservoirs.
This study investigates the use of depleted gas fields for H2 storage, in the Bakken Formation situated in North Dakota’s Williston Basin, utilizing the extensive technical expertise developed in the U.S. and other regions as a case study. The Bakken Formation, a significant geological formation in North Dakota, offers considerable potential for H2 storage. Known primarily for its oil and gas reserves, the Bakken Formation’s unique geological characteristics also make it suitable for H2 storage. As of November 2022, there were 17,563 active oil and gas wells in production in North Dakota [26]. Moreover, North Dakota ranks among the top states in the U.S. for wind power capacity due to its substantial wind energy resources [27]. The state’s vast open plains and favorable wind conditions make it an ideal location for wind energy generation. Despite the considerable installed wind capacity, the variability in wind speeds poses challenges for maintaining a consistent power supply. Hence, integration with H2 storage could significantly improve the reliability and efficiency of wind energy systems in North Dakota.
By leveraging the region’s favorable geological characteristics and substantial wind resources, North Dakota can pioneer an integrated energy system that not only bolsters energy security but also contributes to the state’s shift towards a more carbon-neutral and resilient energy infrastructure. This research aims to identify optimal locations within the Bakken Formation for subsurface H2 storage and evaluate the feasibility of large-scale wind–H2 integration, providing valuable insights for the development of sustainable energy policies and strategies.
At present, there are no specific studies that estimate the H2 storage capacity of the Williston Basin. The novelty of this research lies in the comprehensive integration of wind energy with geological H2 storage, specifically within the Bakken Formation in North Dakota, with one strategy to consider the use of local strengths and resources. For instance, North Dakota with abundant wind energy resources can focus on green H2 production, in addition to blue H2 with carbon capture and storage; however, the scope of this work is based on green H2 production. While H2 storage and wind energy are not new concepts, combining these technologies in the context of an established geological formation primarily known for its oil and gas reserves is innovative. To the author’s knowledge, this study is the first to introduce a large-scale geological storage system integrated with wind-generated H2. The motivation for this study stems from a paucity of adequate literature in this knowledge area, specifically pertaining to North Dakota. The objectives of this study are twofold. Firstly, it aims to identify suitable locations within the Bakken Formation for subsurface H2 storage using readily available data from existing wells from the North Dakota Department of Mineral Resources (NDDMR). Secondly, it aims to evaluate the possibility of large-scale wind–H2 storage in depleted oil and gas fields. To achieve these objectives, a comprehensive methodology is employed, which includes field selection, reservoir characterization, and mathematical modeling to simulate the wind, H2 production, and storage systems. This study contributes to the existing knowledge on hydrogen storage in depleted oil and gas reservoirs. Additionally, it sheds light on the potential of geological hydrogen storage as a crucial component in integrating renewable energy sources with the current energy infrastructure. The findings and insights from this research can inform the development of sustainable energy policies and strategies, facilitating the shift to a more carbon-neutral and resilient energy system. Furthermore, it contributes to the discussion on whether depleted oil and gas reservoirs can serve as H2 storage technology in the future, underscoring the importance of hydrogen as a potential energy vector.
The subsequent sections of the paper provide a brief literature overview, outline the methodology and mathematical models used, present the data and assumptions utilized in the study, and discuss the results and implications of the analysis. Finally, the paper concludes with remarks and recommendations for further research in this field.

2. Related Studies on Underground Hydrogen Storage in Depleted Gas Reservoirs

Although the integration of renewable sources and storage of large amounts of H2 (ranging from tens to thousands of tons) has received attention, very limited literature is available. Currently, successful storage of H2 in underground geological formations is mainly limited to aquifers and caverns in Europe and the United States, as indicated in Table 1 [1]. This study does not aim to provide an exhaustive list and analysis of all H2 storage sites. Instead, it focuses on highlighting advancements in UHS worldwide, particularly in terms of their potential and large-scale feasibility for depleted reservoirs. For example, Tarkowski [28] conducted a comprehensive review of the geological aspects of hydrogen storage in depleted gas fields. The study emphasized the importance of reservoir characterization parameters such as porosity, permeability, and cap rock integrity in determining the suitability of a depleted reservoir for hydrogen storage. Zivar et al. [17], explored the potential of depleted gas reservoirs for hydrogen storage in the context of the energy transition. They provided a framework for assessing the suitability of specific depleted reservoirs for hydrogen storage and highlighted the role of UHS in balancing renewable energy fluctuations. Their work also addressed the challenges of H2 mixing with residual natural gas and emphasized the importance of proper cushion gas management. Focusing on the critical issue of hydrogen loss, Hagemann et al. [29] conducted laboratory experiments and numerical simulations to investigate hydrogen migration and trapping mechanisms in depleted gas reservoirs. The findings suggested that capillary trapping could significantly reduce hydrogen mobility, potentially improving storage efficiency and security. Regarding practical implementation, Mouli-Castillo et al. [14] conducted a feasibility study for repurposing depleted North Sea gas fields for large-scale H2 storage. The study highlighted the potential for integrating offshore wind power with UHS to create a sustainable energy system.
Despite these advancements, researchers have observed several natural hazards associated with UHS in depleted reservoirs. These include the potential for H2 leakage through existing faults, fractures, or poorly sealed wellbores [30], which could lead to environmental contamination or safety [31]. The altered pressure regime within the reservoir after hydrogen injection might also trigger subsidence or induce seismic events, posing a risk to surface infrastructure. Additionally, the interaction between H2 and residual hydrocarbons or brine in the reservoir could lead to unexpected chemical reactions, potentially compromising the integrity of the storage site [32]. Aluah et al. [33] evaluated the caprock integrity of the Upper Bakken formation which serves as a seal for UHS in the middle Bakken. They concluded that exposure to hydrogen led to increased permeability and porosity over time in reservoir rocks, raising concerns about potential leakage and reduced mechanical stability. Additionally, changes in mineral composition and mechanical properties, including decreased Young’s modulus and altered fracture patterns, indicate heightened susceptibility to deformation and leakage risks in the H2 storage system. Table 4 illustrates the summary of some of the recent work on UHS in depleted gas reservoirs.

3. Study Area

The proposed case study will focus on the Bakken Formation in North Dakota as a potential location for wind H2 production and underground storage (Figure 4). The Bakken Formation is a geological structure extending across parts of North Dakota, Montana, and Saskatchewan in Canada. Situated at a depth of approximately 3100 m (10,000 feet), it comprises three distinct layers: the Upper, Middle, and Lower Bakken. Recent research has concentrated on the Middle Bakken’s geological and petrophysical properties, revealing a porosity range of 3% to 10% and permeability from 0.001 mD to slightly above 0.01 mD [46]. The Upper and Lower Bakken Shale serve as fluid barriers, while the Middle Bakken exhibits varied lithology, including carbonates, sandstones, and fine-grained clastics. The Bakken has yielded over a billion barrels of oil. Currently, there are no specific studies estimating the H2 storage capacity of Bakken formation. There have been no reports of active faults within the Bakken to disrupt the H2 storage process. However, since the conditions for CO2 storage are similar, existing knowledge in that area can be used as a preliminary reference [21,47].
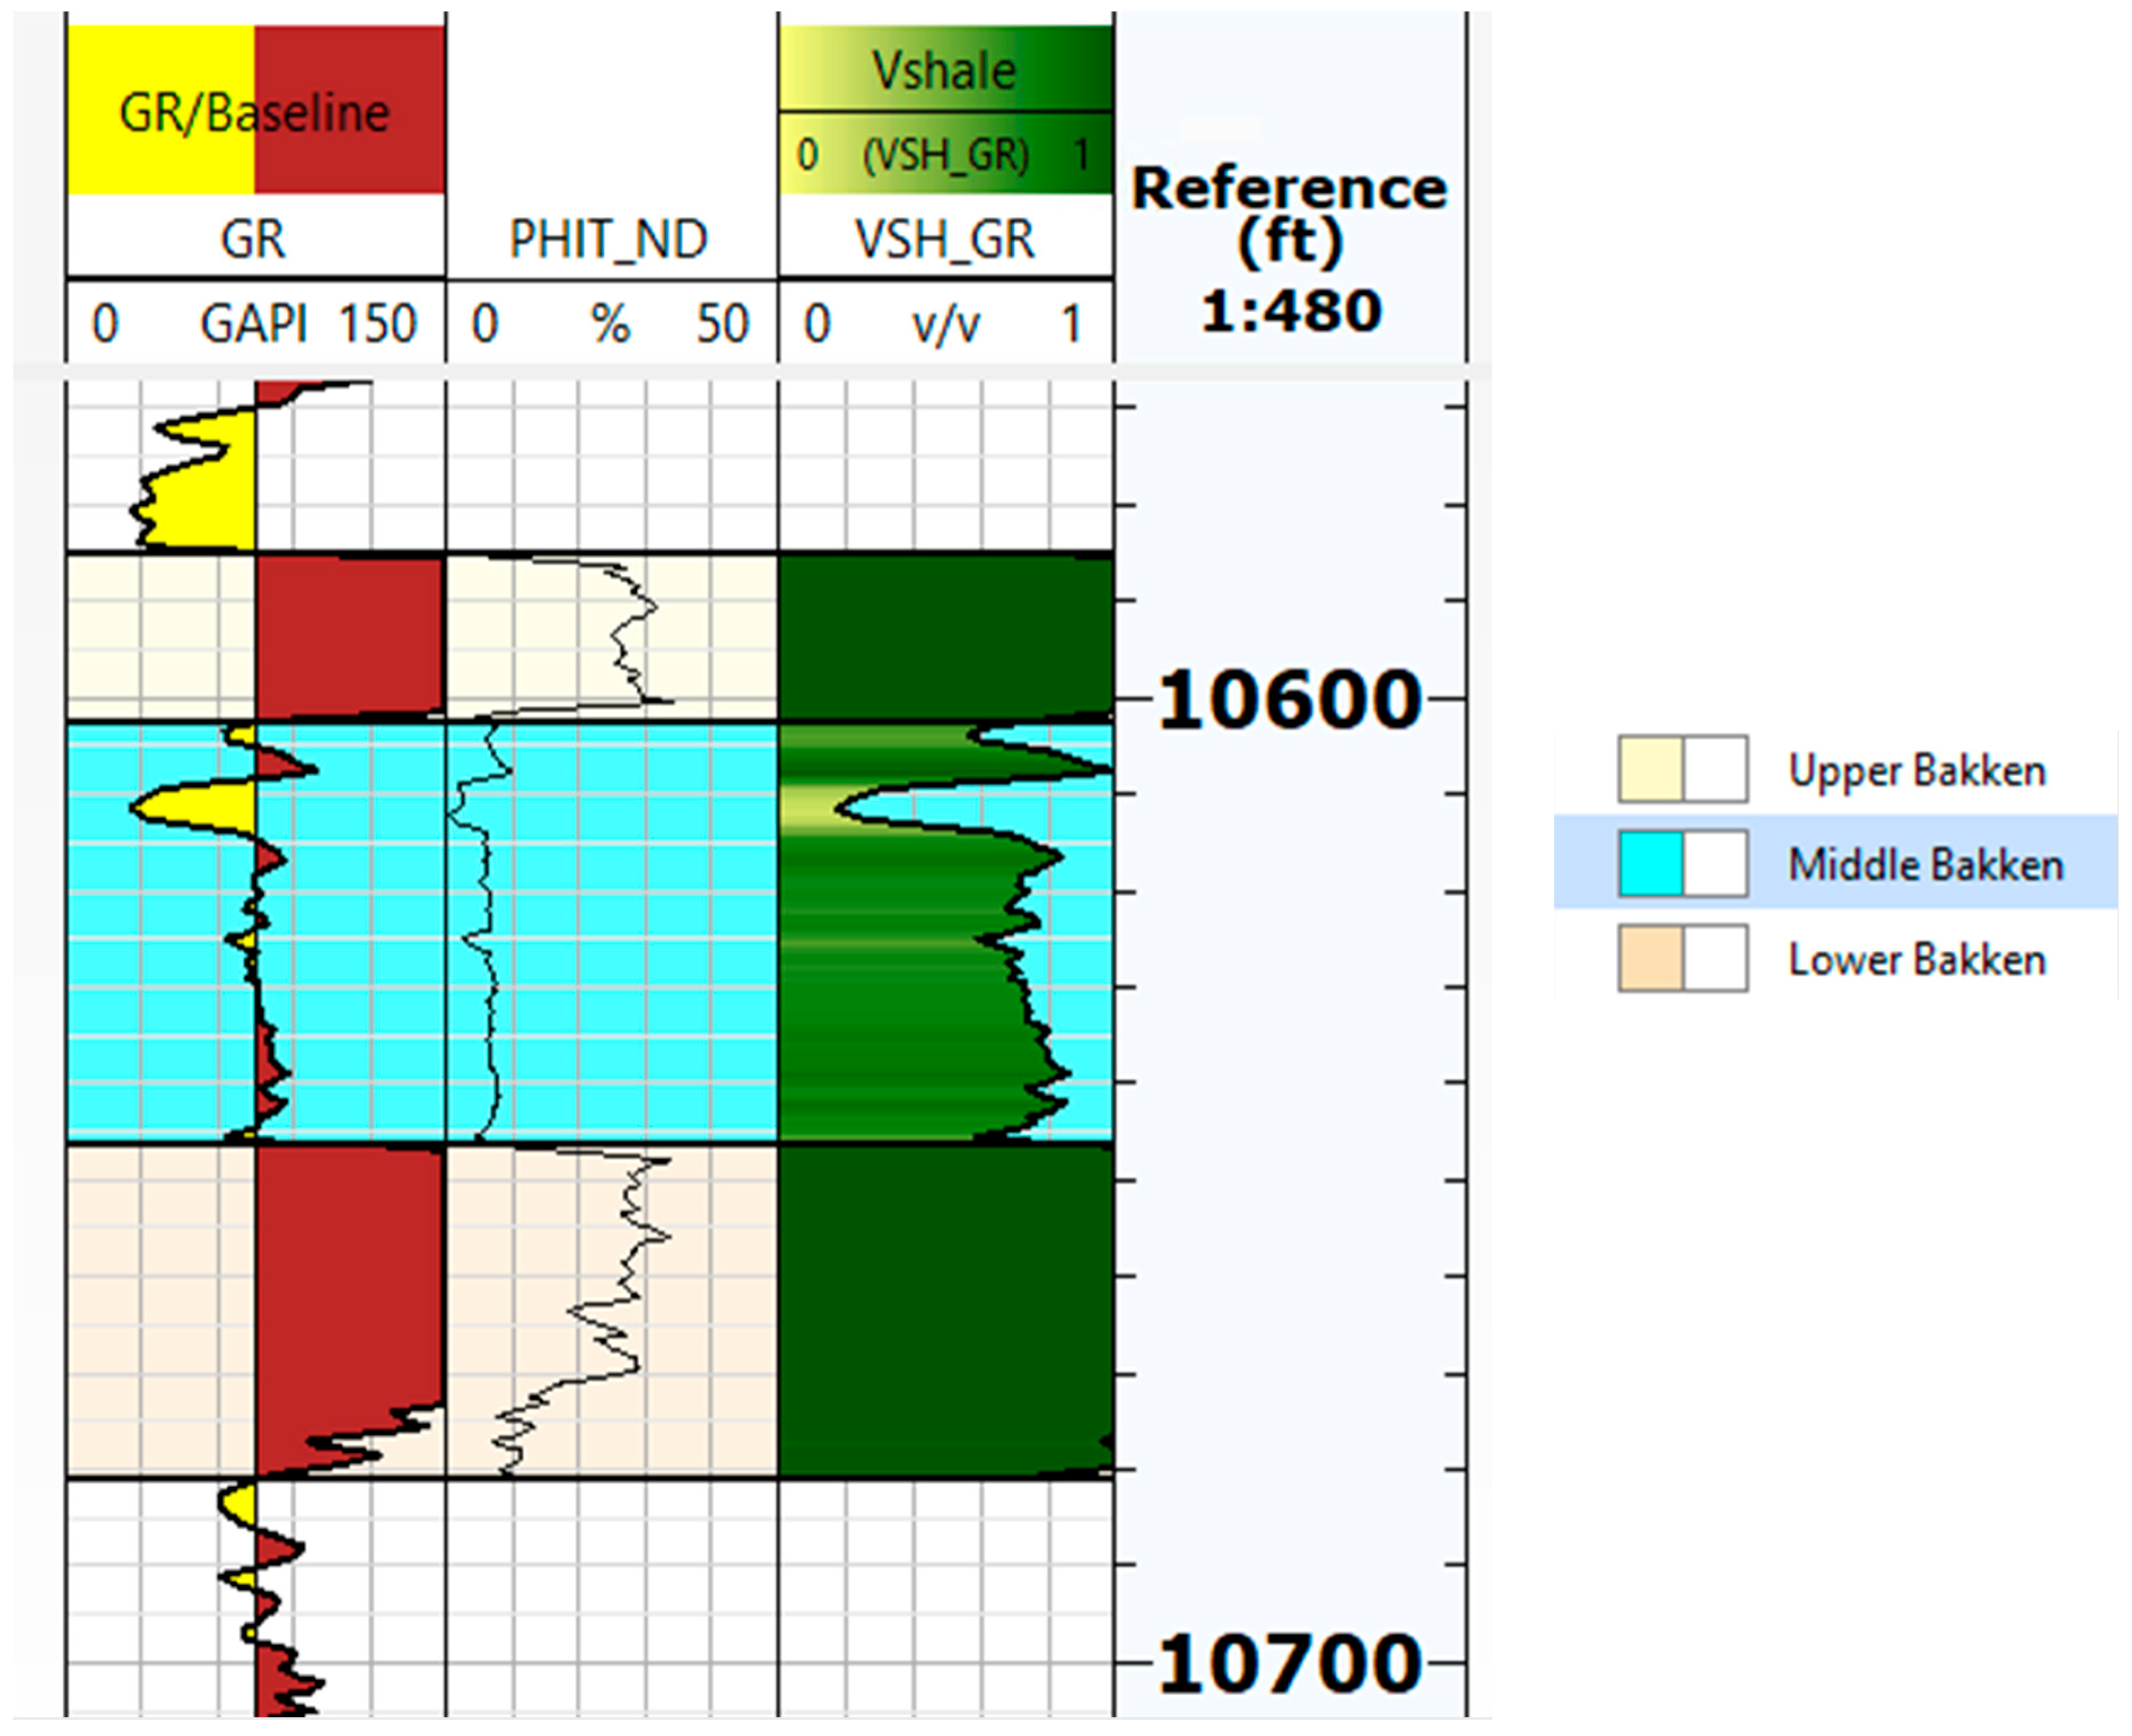
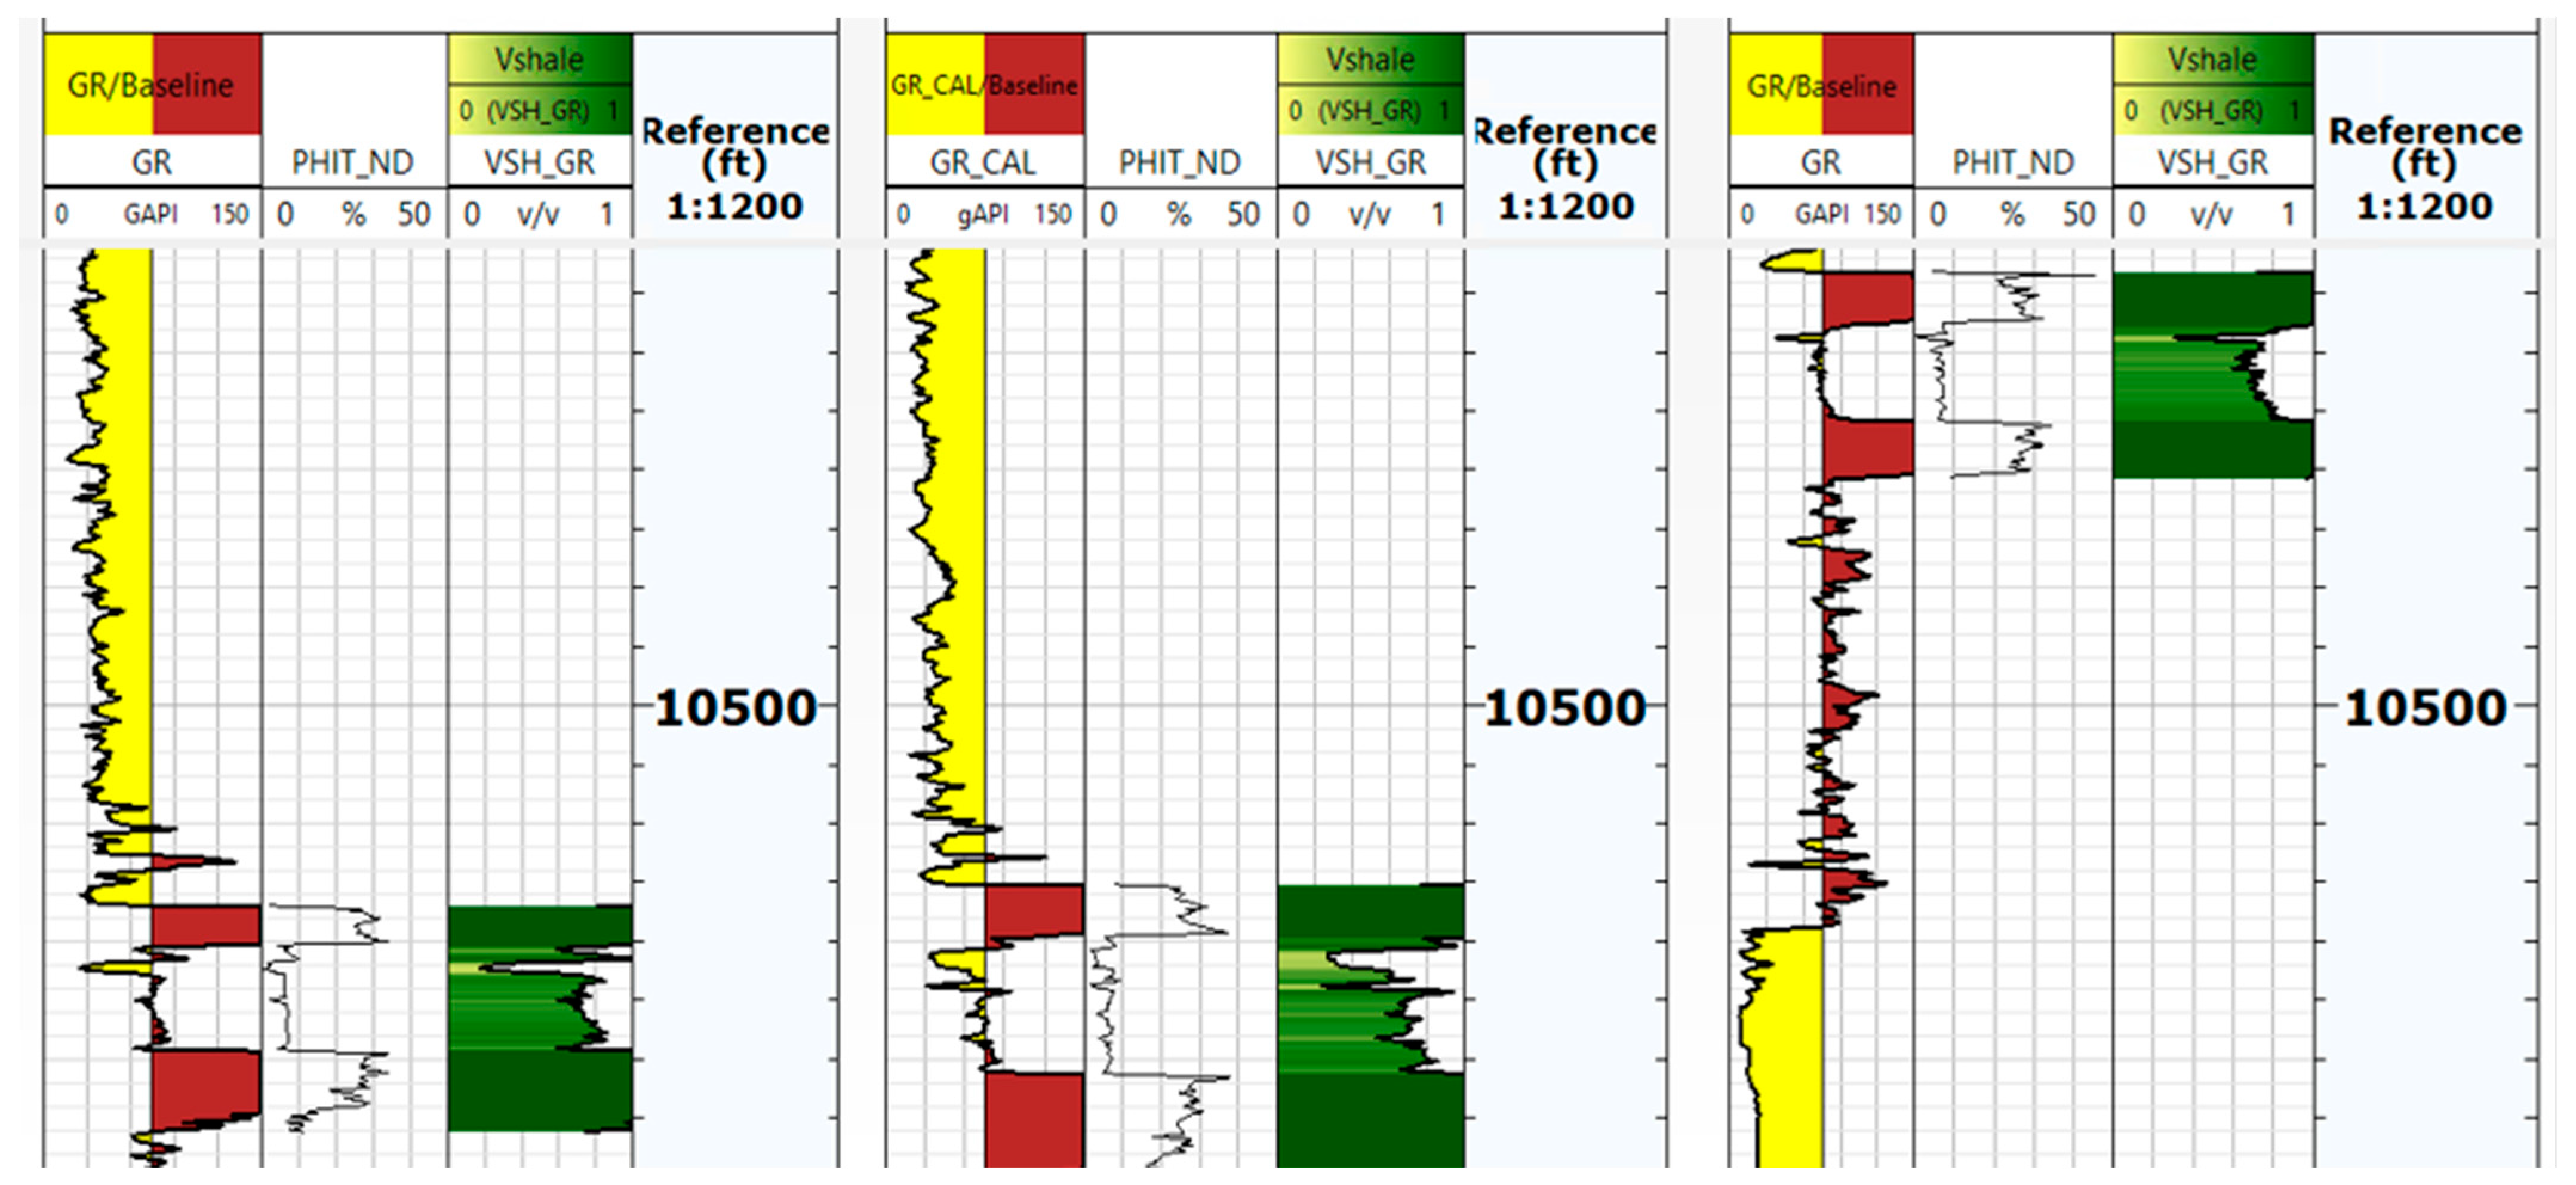
In this study, gamma-ray logs were used to estimate shale volume in a specific zone. Accurate shale volume measurements required data from clean sand and shale rock samples. The Techlog 2024.1 software was employed to estimate shale volume (Vshale) using the gamma-ray method, which utilizes gamma-ray logs as input data to produce the Vshale trace. Total porosity was determined using the neutron density method, which involves neutron porosity logs (NPOR) and bulk density logs (RHOZ) to calculate total porosity (PHIT-ND). Figure 5 and Figure 6 display elevated gamma-ray readings and significant shale volumes in the Upper and Lower Bakken formations across all three wells, indicating the presence of shale rock. Figure 7 illustrates the variable lithology within the Middle Bakken, including sandstone, siltstone, and limestone, consistent with core descriptions. The top and bottom Bakken formations act as barriers, effectively trapping CO2 in the Middle Bakken. The Bakken Formation is located in the Williston Basin, which is considered a stable intracratonic basin. This geological setting is generally favorable for underground storage operations as it is not near active plate boundaries or major tectonic zones. The Williston Basin contains various structural features, including the Nesson Anticline, Cedar Creek Anticline, and Poplar Dome. These structures are generally considered stable and safe for UHS.
Historically, the Bakken Formation area has experienced low seismicity. However, there has been an increase in induced seismicity related to oil and gas operations, particularly hydraulic fracturing. These induced seismic events are generally of low magnitude and are considered to pose a low risk for UHS operations in the Bakken Formation.
North Dakota has emerged as a promising state for wind energy production due to its abundant wind resources. Ranking seventh in the nation for wind electricity generation, North Dakota boasts over 4302 MW of installed wind energy capacity, accounting for 36.85% of its net electricity generation [27] and exports approximately 50% of its electricity to neighboring states and Canada. The state’s wind power generation capacity has doubled between 2015 and 2021, with more than 2200 wind turbines currently in operation. The largest wind farm, near Williston, has a capacity of 393 MW. North Dakota’s annual wind resource is estimated at 1.2 trillion kWh, the highest in the United States. The summary of the wind energy in North Dakota is shown in Table 5.
The integration of wind energy with UHS presents a transformative opportunity to maximize the use of renewable resources and enhance energy sustainability. The Bakken Formation in North Dakota, known for its significant oil and gas reserves, offers a unique potential to repurpose its depleted reservoirs for UHS. This approach not only optimizes the utilization of wind resources but also addresses the intermittency issues associated with wind energy. Despite the state’s significant wind resources, there are currently no operational H2 plants in North Dakota. However, initiatives are underway to develop H2 production facilities in the state. One notable project is the hydrogen production facility being developed by Bakken Energy’s Great Plains Synfuels, which aims to produce up to 380,000 tons of hydrogen per year by 2026. Additionally, the Heartland H2 hub, spanning several states including North Dakota, Minnesota, Montana, and Wisconsin, has been awarded funding from the U.S. Department of Energy (DOE) under the Biden Infrastructure Job Act (BIJA), with the goal of producing 390,000 tons of H2 [13]. The potential for North Dakota to become a significant producer of renewable hydrogen is supported by its abundant wind resources, as highlighted in a report by the National Energy Technology Laboratory (NETL) [48].
Table 5. Summary of wind energy in North Dakota.
Potential Wind Capacity296,084 MW [49]
Current installed wind capacity4032 MW [27]
Current wind electricity generation16,571 GWh [27]

4. Methodology

Existing studies and literature under-explore the integration of wind turbines, electrolyzers, and UHS, necessitating further investigation. To assess the performance of such systems, mathematical models are indispensable. Simulation studies employ these models, which are vital for understanding and managing energy and H2 production in the proposed system. This section first discusses the mathematical models of the system components and presents a strategy for energy management.

4.1. Mathematical Model of the Wind-Electrolyzer-UHS System

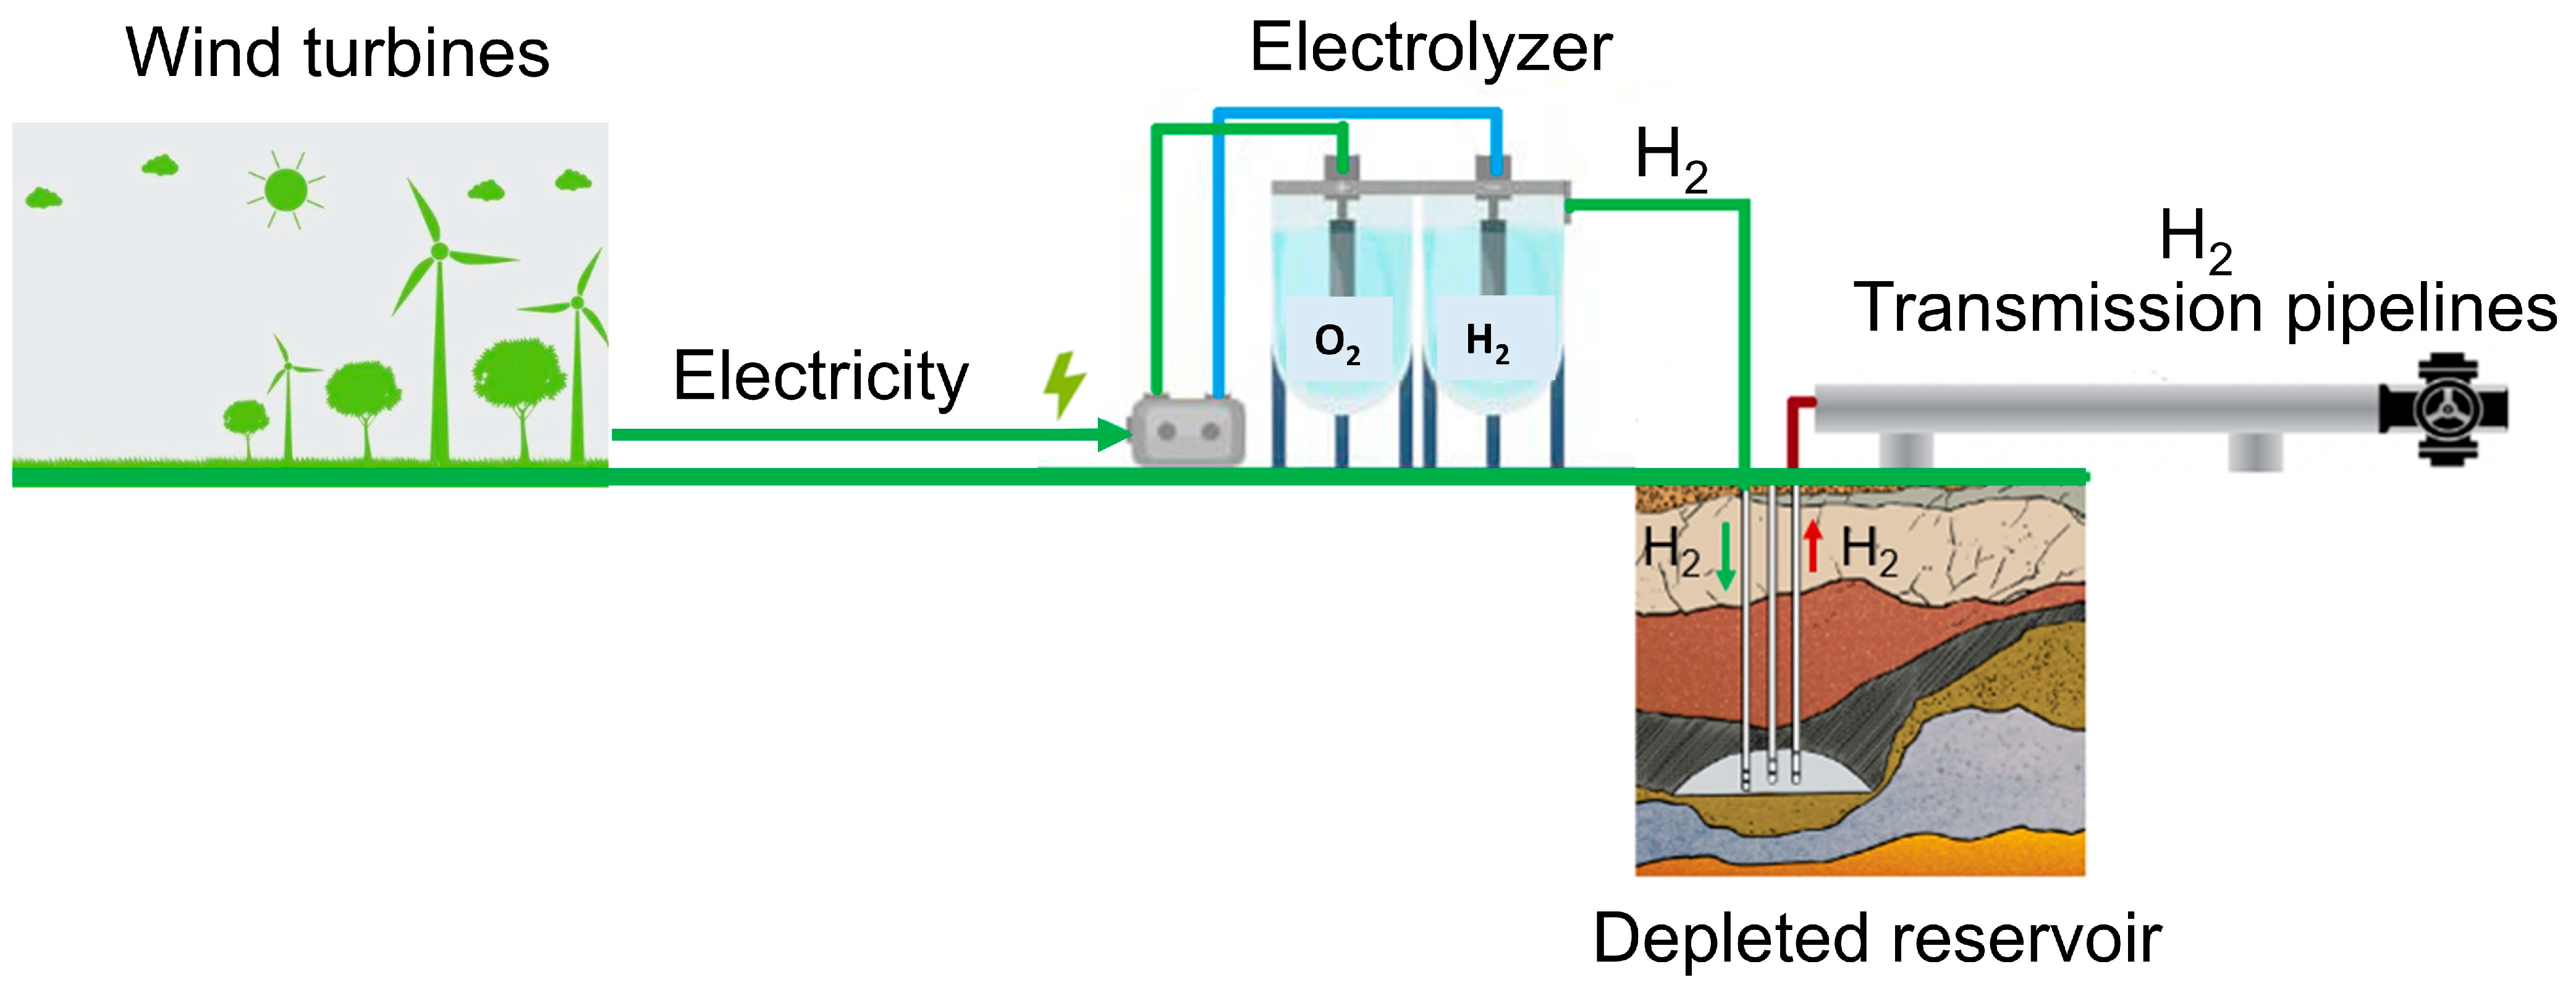
A simplified diagram of the proposed system under study is presented in Figure 8. The mathematical representation of all subsystems is presented in brief in the following subsections.

4.1.1. Wind Power System

The power output of a wind turbine can be determined using various methods [49]. In this study, the power curve method is utilized, which assumes a standardized form for the wind turbine’s power curve. This curve illustrates the relationship between output power and wind speed at hub height. The power curve, Equation (1), and Equation (2) methods, involve developing characteristic equations to estimate the wind turbine’s output across wind speeds ranging from zero to the cut-out speed.
P t = 0 ,   v < v c u t i n P v ,   v c u t i n v < v r a t e d P r a t e d ,   v r a t e d v v c u t o u t 0 ,   v c u t o u t < v
The power generation function P v is determined using the cubic law which is expressed as:
P v = 0.5 · ρ · A · C p · v 3
In the Equations, the variables are defined as follows: v c u t i n denotes the cut-in speed, v r a t e d represents the rated speed, and v c u t o u t indicates the cut-out speed.
In Equation (2), ρ represents the air density, A indicates the rotor swept area, and C p represents the power coefficient. To simplify the calculations, a maximum achievable C p value of 0.4 is assumed. Equation (3) is used to ascertain the wind farm’s overall time-varying effect, taking into account the number of wind turbines in the farm, denoted by n.
P t o t a l   w i n d t = i = 1 n P n ( t )

4.1.2. Hydrogen Production Using Wind Energy

Although the wind farm is specifically designed for hydrogen production, it must also provide all the electricity needed for ancillary services like water filtration/desalination and H2 compression. This study utilized the PEM electrolyzer model introduced by Dinh et al. [50]. Equation (4) is used to calculate the theoretical quantity of H2 that can be generated per hour, based on the wind farm’s output to determine the theoretical amount of H2 which can be produced each hour based on the output of the wind farm.
m H 2 , t h e o r y t = P w i n d t E e l e c η c o n v + E p c l [ kg / h ]
where Eelec represents the electricity consumption specified by the electrolyzer manufacturer the manufacturer of the electrolyzers. Epcl represents the electricity required for other components associated with the electrolyzer, including water purification, other losses. η c o n v represents the conversion efficiency.
Equation (5) mathematically represents the practical hourly production of H2.
m H 2 , p r a c t i c a l t = P H 2 p l a n t · η c o n v E e l e c [ kg / h ]
where, PH2plant is called the rated capacity of H2 electrolyzer and should be.
P H 2 p l a n t m a x   m H 2 , t h e o r y t   E e l e c   [ MW ]
In order to correctly quantify the H2 production per hour, this study also incorporated three conditions as defined in Dinh et al. [50]. These conditions are low wind power, wind power capable of operating the H2 plant at its nominal capacity, and wind power below the nominal capacity ( P H 2 p l a n t ). To ensure an efficient operation, the electrolyzers should be shut down when the input power (i.e., the real-time output from the wind farm) falls below a certain threshold. This lower limit, Pfarm_low, is set at 5% of the electrolysis plant’s rated capacity, as indicated in Equation (7).
P w i n d , m i n = 0.05 · P H 2 p l a n t
A series of characteristic equations in Equation (8) were formulated to measure the H2 production, taking into account the electrolyzer’s nominal capacity and the power produced by the wind farm.
m H 2 , p r a c t i c a l t =     0 ,   P w i n d ( t ) P w i n d , m i n P w i n d t E e l e c η c o n v + E p c l ,   P w i n d ( t ) < P H 2 p l a n t P H 2 p l a n t · η c o n v E e l e c ,   P w i n d ( t ) P H 2 p l a n t  

4.1.3. North Dakota Depleted Oil and Gas Fields Storage Capacity in the Antelope Field

Well data from North Dakota Industrial Commission such as depth to top of formation, porosity and thickness were utilized for final calculations of capacity estimates. Formation tops were correlated from well logs whereas porosity values were assigned from log curves and quality control (QC) techniques with core data.
H2 storage in the antelope field (Approximately 46,000 acres) was estimated using two approaches: pore volume per acre approach and storativity approach.

Pore Volume Per Acre Approach

The pore volume per acre approach can be used to estimate reserves by finding the pore space within the formation on a per acre basis. This approach is commonly utilized in the oil and gas sector for an initial approximation of reserves.
Pore volume = A h ϕ
where A is area (acres), h is thickness (ft), ϕ is the porosity (fraction).

Storativity Approach

The Storativity approach is a reservoir engineering tool used to assess the storage capacity of subsurface reservoirs. It is used to measure the ability of a reservoir to store fluids such as oil, gas, and water.
S t o r a t i v i t y = · h c u m ( · h )
where h is thickness (ft), ϕ is the porosity (fraction)
Storage capacity estimate for antelope study area is mathematically represented as.
G H 2 = P V · ρ H 2 · E 1000 ( kg tones )
where, GH2 is the total mass of H2 could be potentially stored (tons). P V , ρ H 2 , and E are total effective pore space in m3, density of H2 under reservoir temperature and pressure in kg/m3, and storage capacity coefficient, respectively.

4.2. Energy and Hydrogen Production Strategy

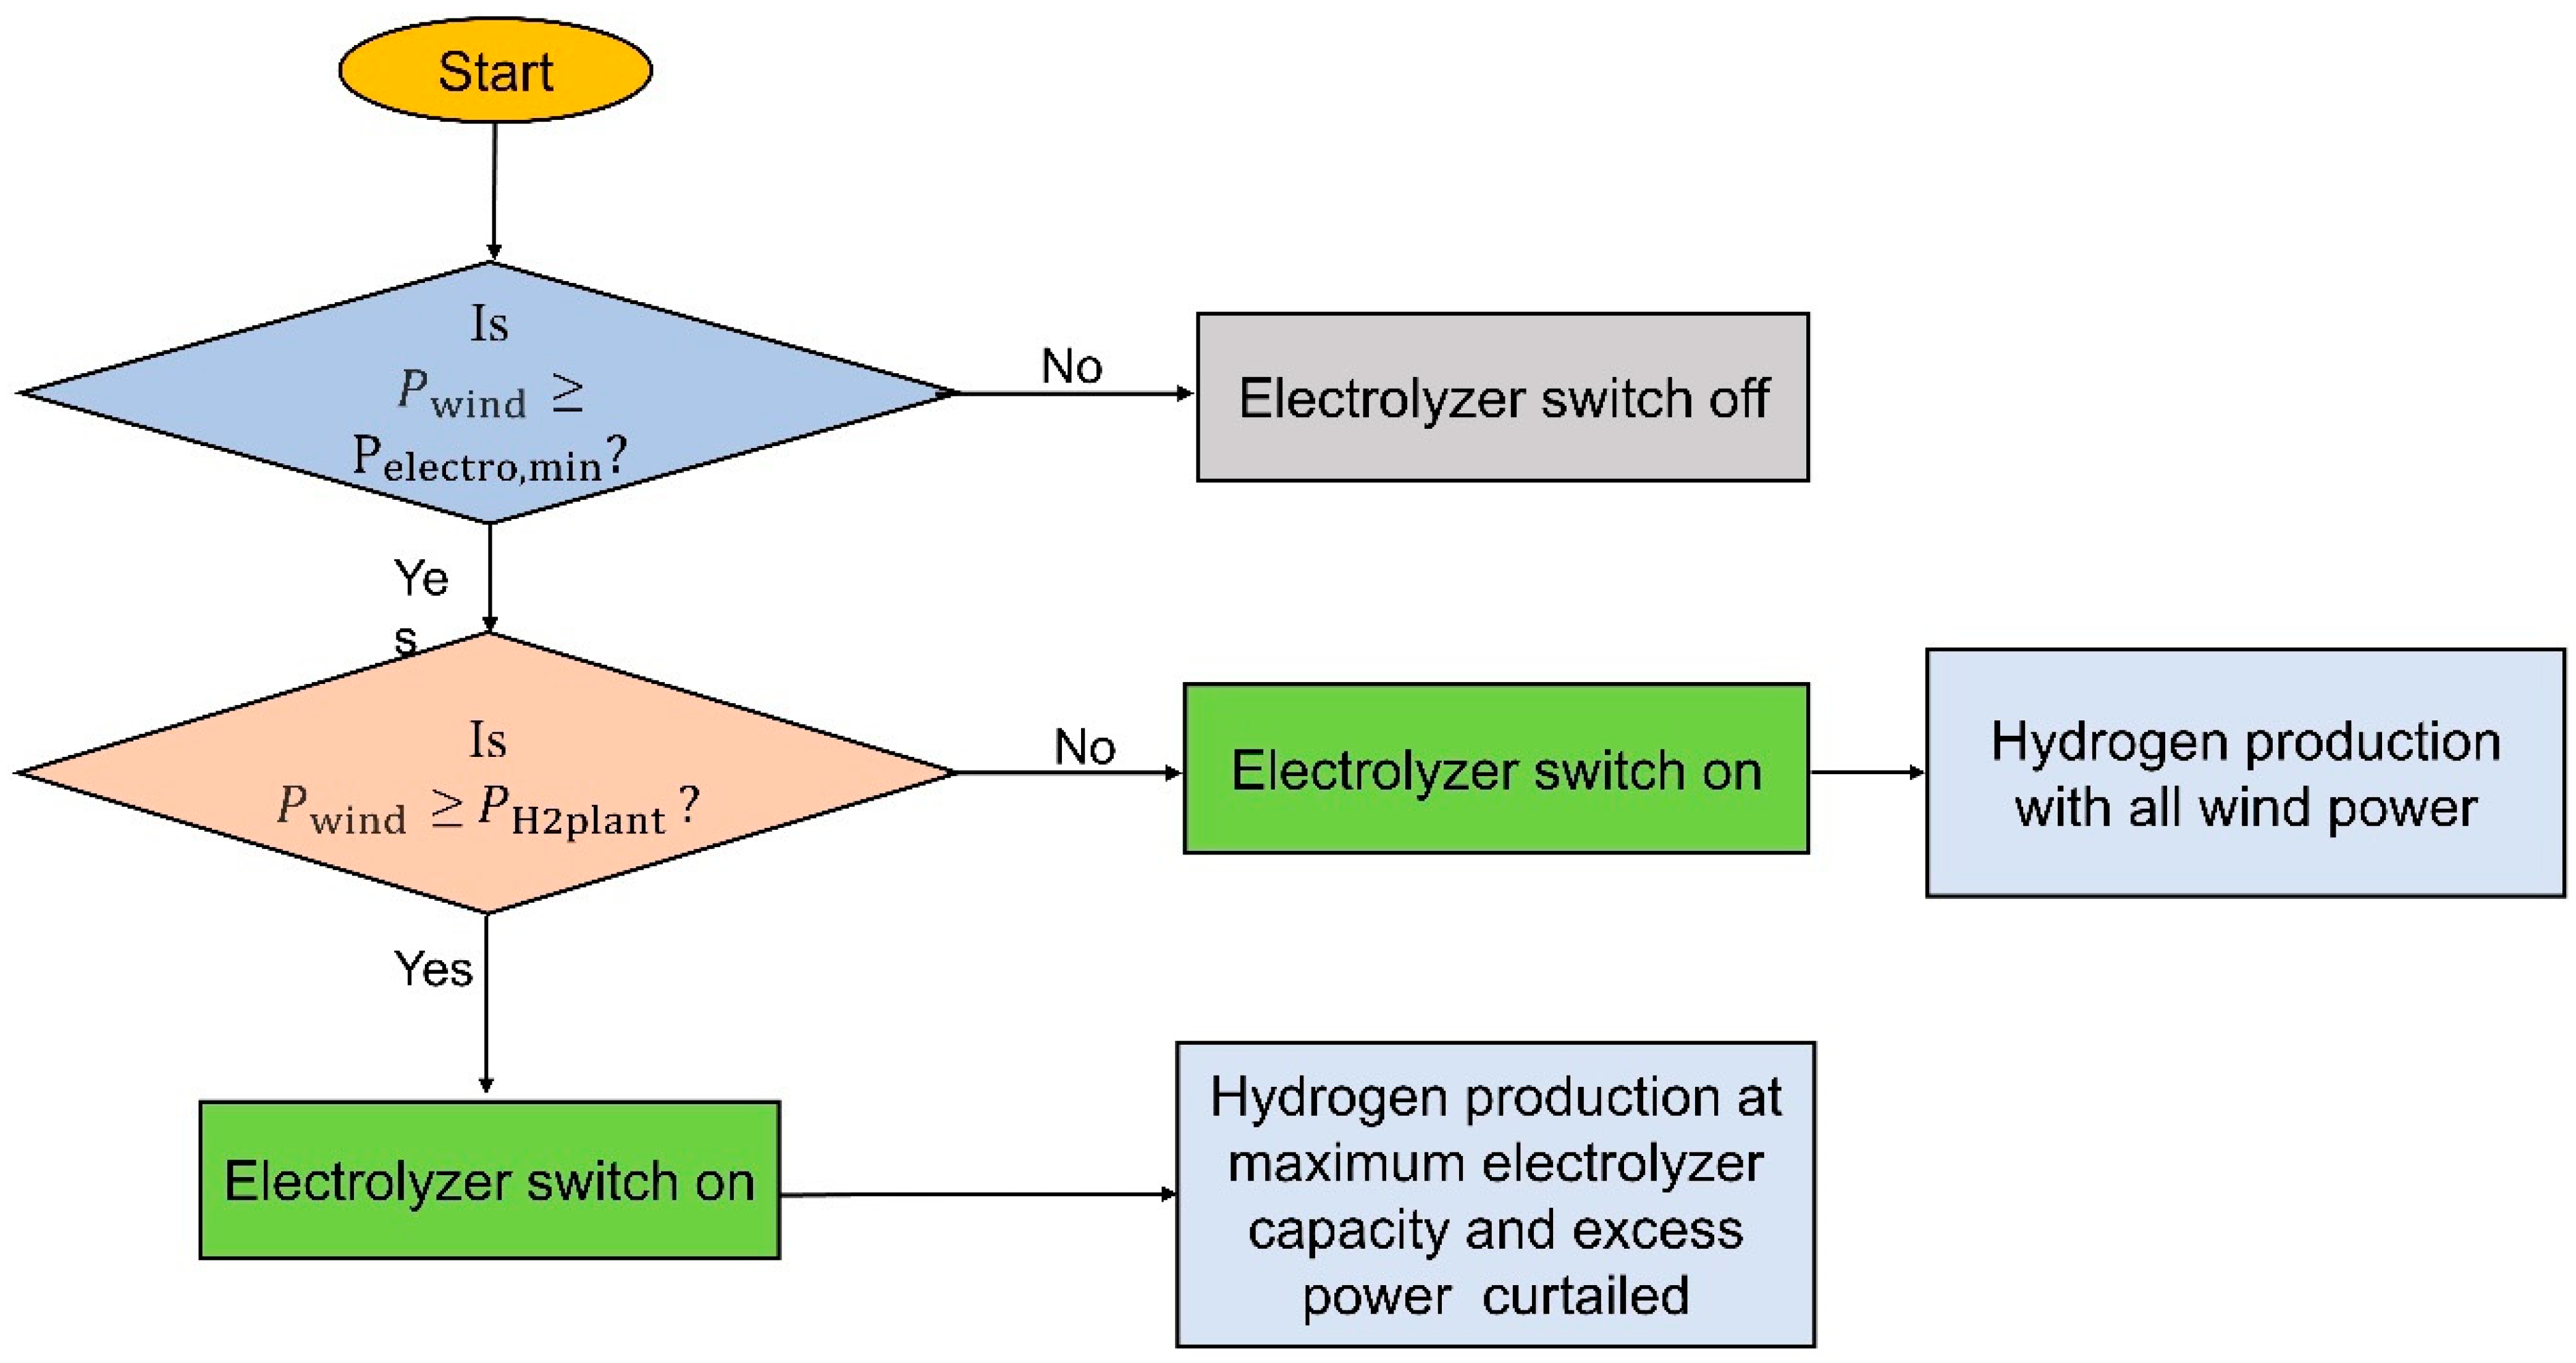
Figure 9 illustrates the general control system employed for power and H2 production. The electrolyzer is only activated when the wind power reaches or surpasses 5% of the electrolyzer’s rated capacity. Conversely, if the wind power falls below this threshold, the electrolyzer is deactivated to prevent unnecessary toggling. Consequently, H2 production remains minimal during this low power range. In the case where the wind turbine’s power output hits this minimum threshold, two scenarios arise. The first scenario involves the continuous operation of the control system, wherein all the wind power is utilized for H2 production. When wind power is greater than the maximum electrolyzer capacity, H2 is produced at maximum electrolyzer capacity and excess power gets curtailed, which will be discussed in future work.

5. Assumptions and System Parameters

5.1. Assumptions

The wind and electrolyzer data, the reservoir characterization and selection process, and the mathematical modeling assumptions and parameters used to simulate wind, H2 production, and storage systems may all contain some degree of uncertainty or error.
To deal with utility-scale wind farms containing multiple wind turbines, the study utilized aggregated modeling techniques. This approach aims to represent the whole farm as a single equivalent unit with a re-scaled power capacity, which simplifies the system’s complexity and reduces computation time significantly.
This study does not include cost and market analyses, plant siting, or sizing.
It is assumed that all the wind resources that are available are harnessed.
There are numerous H2 storage options available, but only underground storage in depleted oil and gas fields is considered in this study.
The study did not consider the reactions between H2 and the subsurface rock and fluid, geo-mechanical effects, or microbial activity.
The amount of water required for the study was not included.
Additionally, the findings might only apply directly to the unique geological and environmental conditions of North Dakota’s Bakken Formation, not to other regions or formations.

5.2. Wind Data

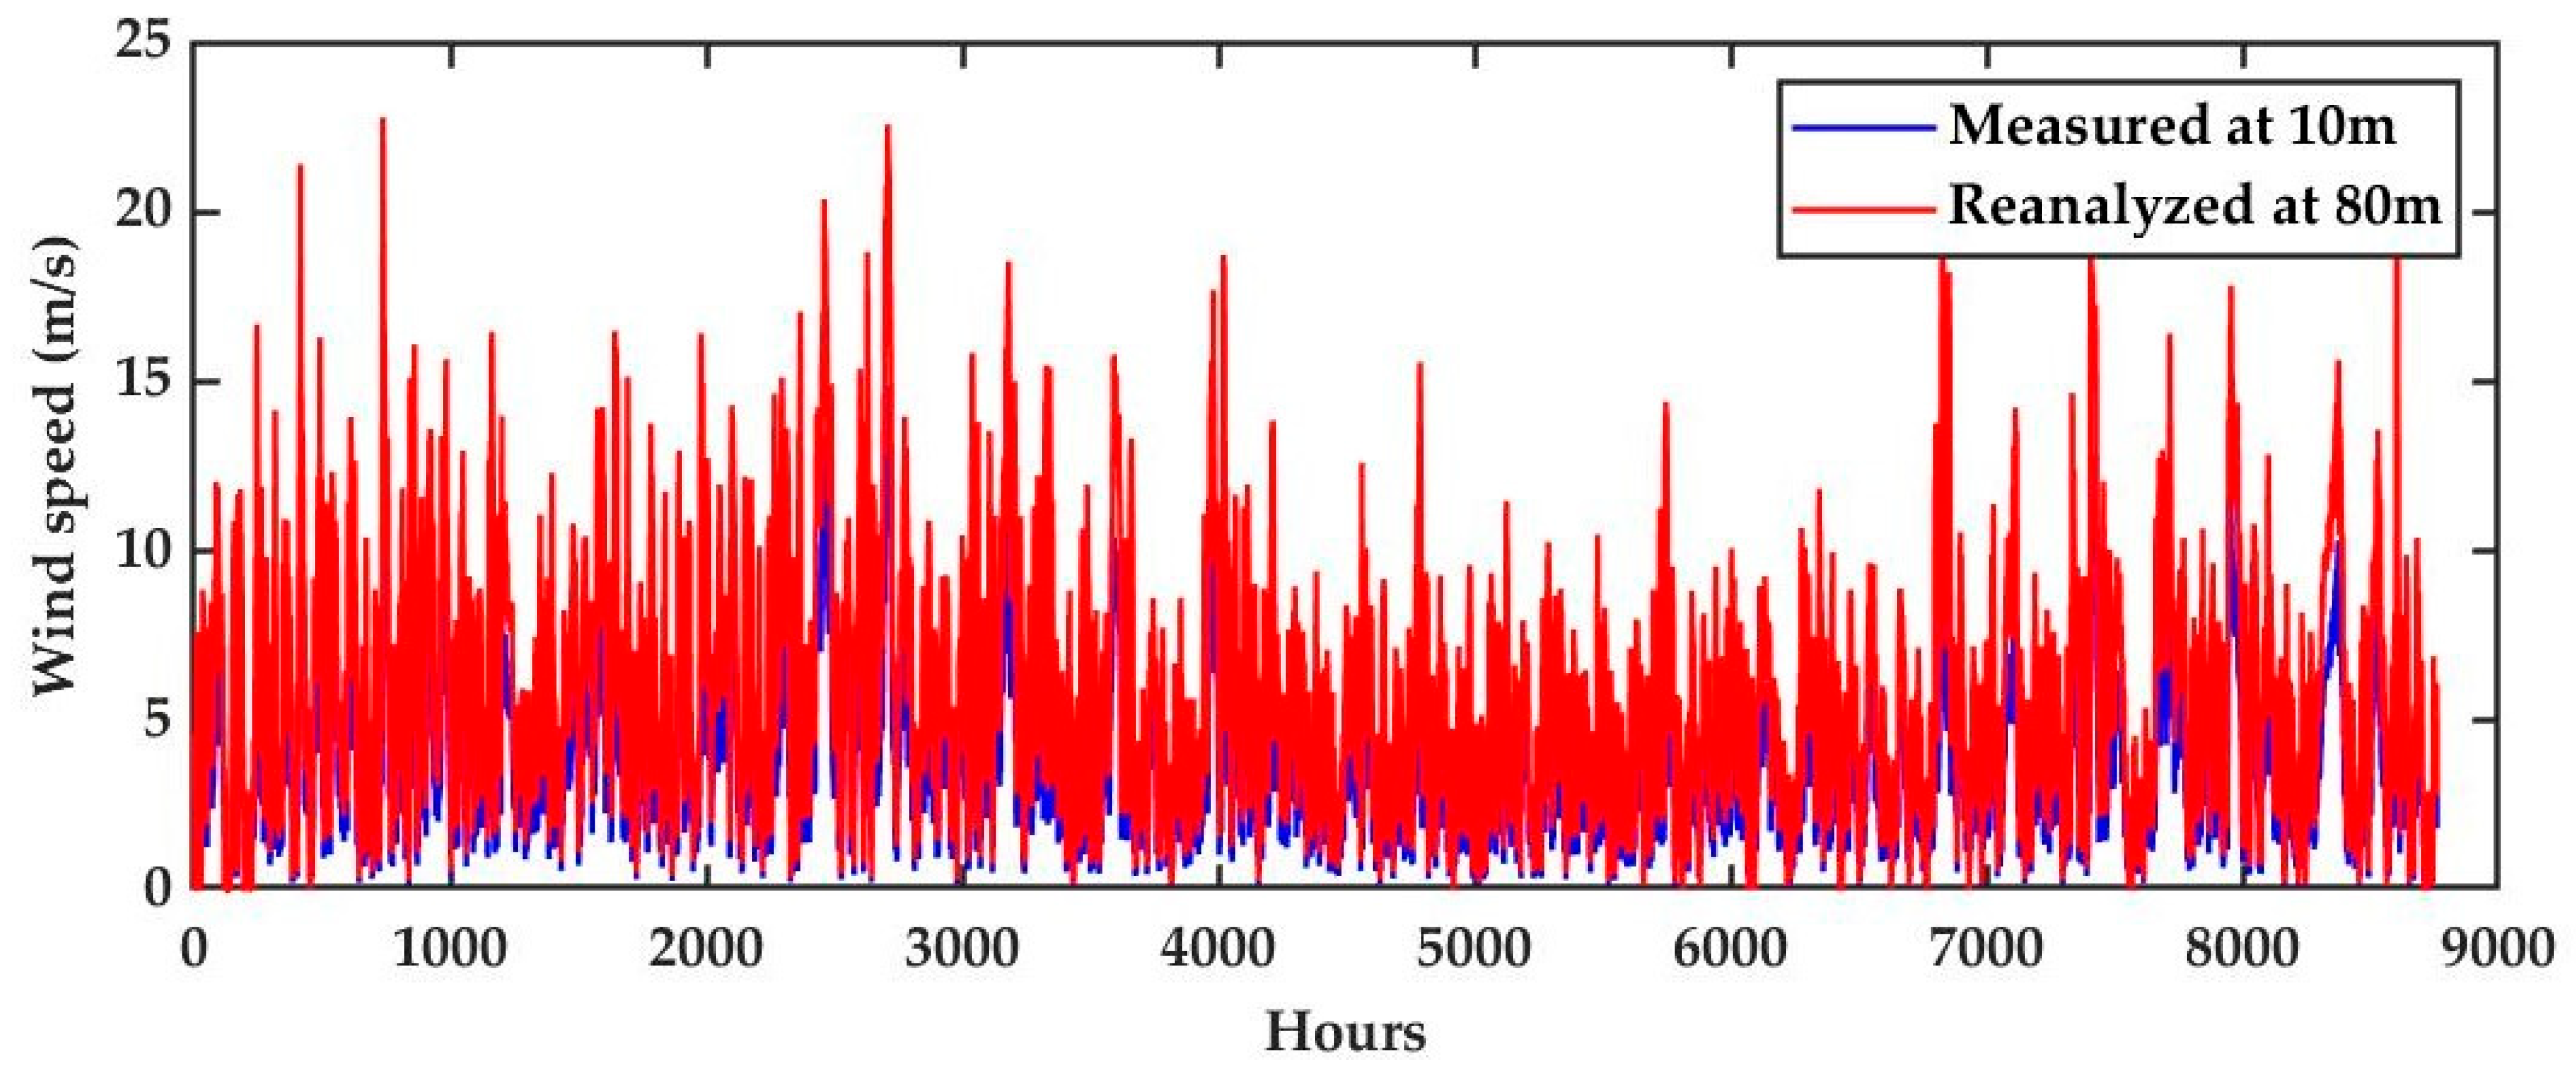
The General Electric model, with a nominal capacity of 1.5 MW, is the chosen wind turbine for the proposed wind farm. Table 6 provides detailed specifications of the wind turbine. The wind data used for the analysis was retrieved from the North Dakota Agricultural Weather Network (NDAWN) at a height of 10 m [51]. However, we reanalyzed these data using the vertical wind profile equation to estimate wind conditions at a height of 80 m. Figure 10 provides a visual representation of this reanalyzed wind data. The minimum value of the wind speed should be 3.5 m/s for the process to be realized.
Mathematically, the process of reanalyzing wind data from 10 m to 80 m can be expressed as follows:
V 80 = V 10 H 80 H 10 α
where V 80 and V 10 are the wind speeds at height H 80 and H 10 and α is the wind shear exponent and considered value is 0.2.

5.3. Electrolyzer Data

The technology chosen for this study is the Proton exchange membrane electrolyzer. In this research, it is assumed that the electrolyzers will operate exclusively based on the variable power produced by the wind farm, with no grid support. The parameters for the electrolyzer, sourced from Dinh et al. [50], are detailed in Table 7. Consequently, the electrolyzers function intermittently, aligning with the fluctuating wind power input.

5.4. Reservoir Data

The storage potential of the depleted oil and gas field was assessed using well data provided by the North Dakota Department of Mineral Resources (NDDMR). The available log data for the field, detailed in Table 8, was imported into Techlog, a petrophysical analysis and data visualization software developed by Schlumberger. This log data were utilized to measure the reservoir’s average porosity, net-to-gross ratio, and both gross and net thickness.
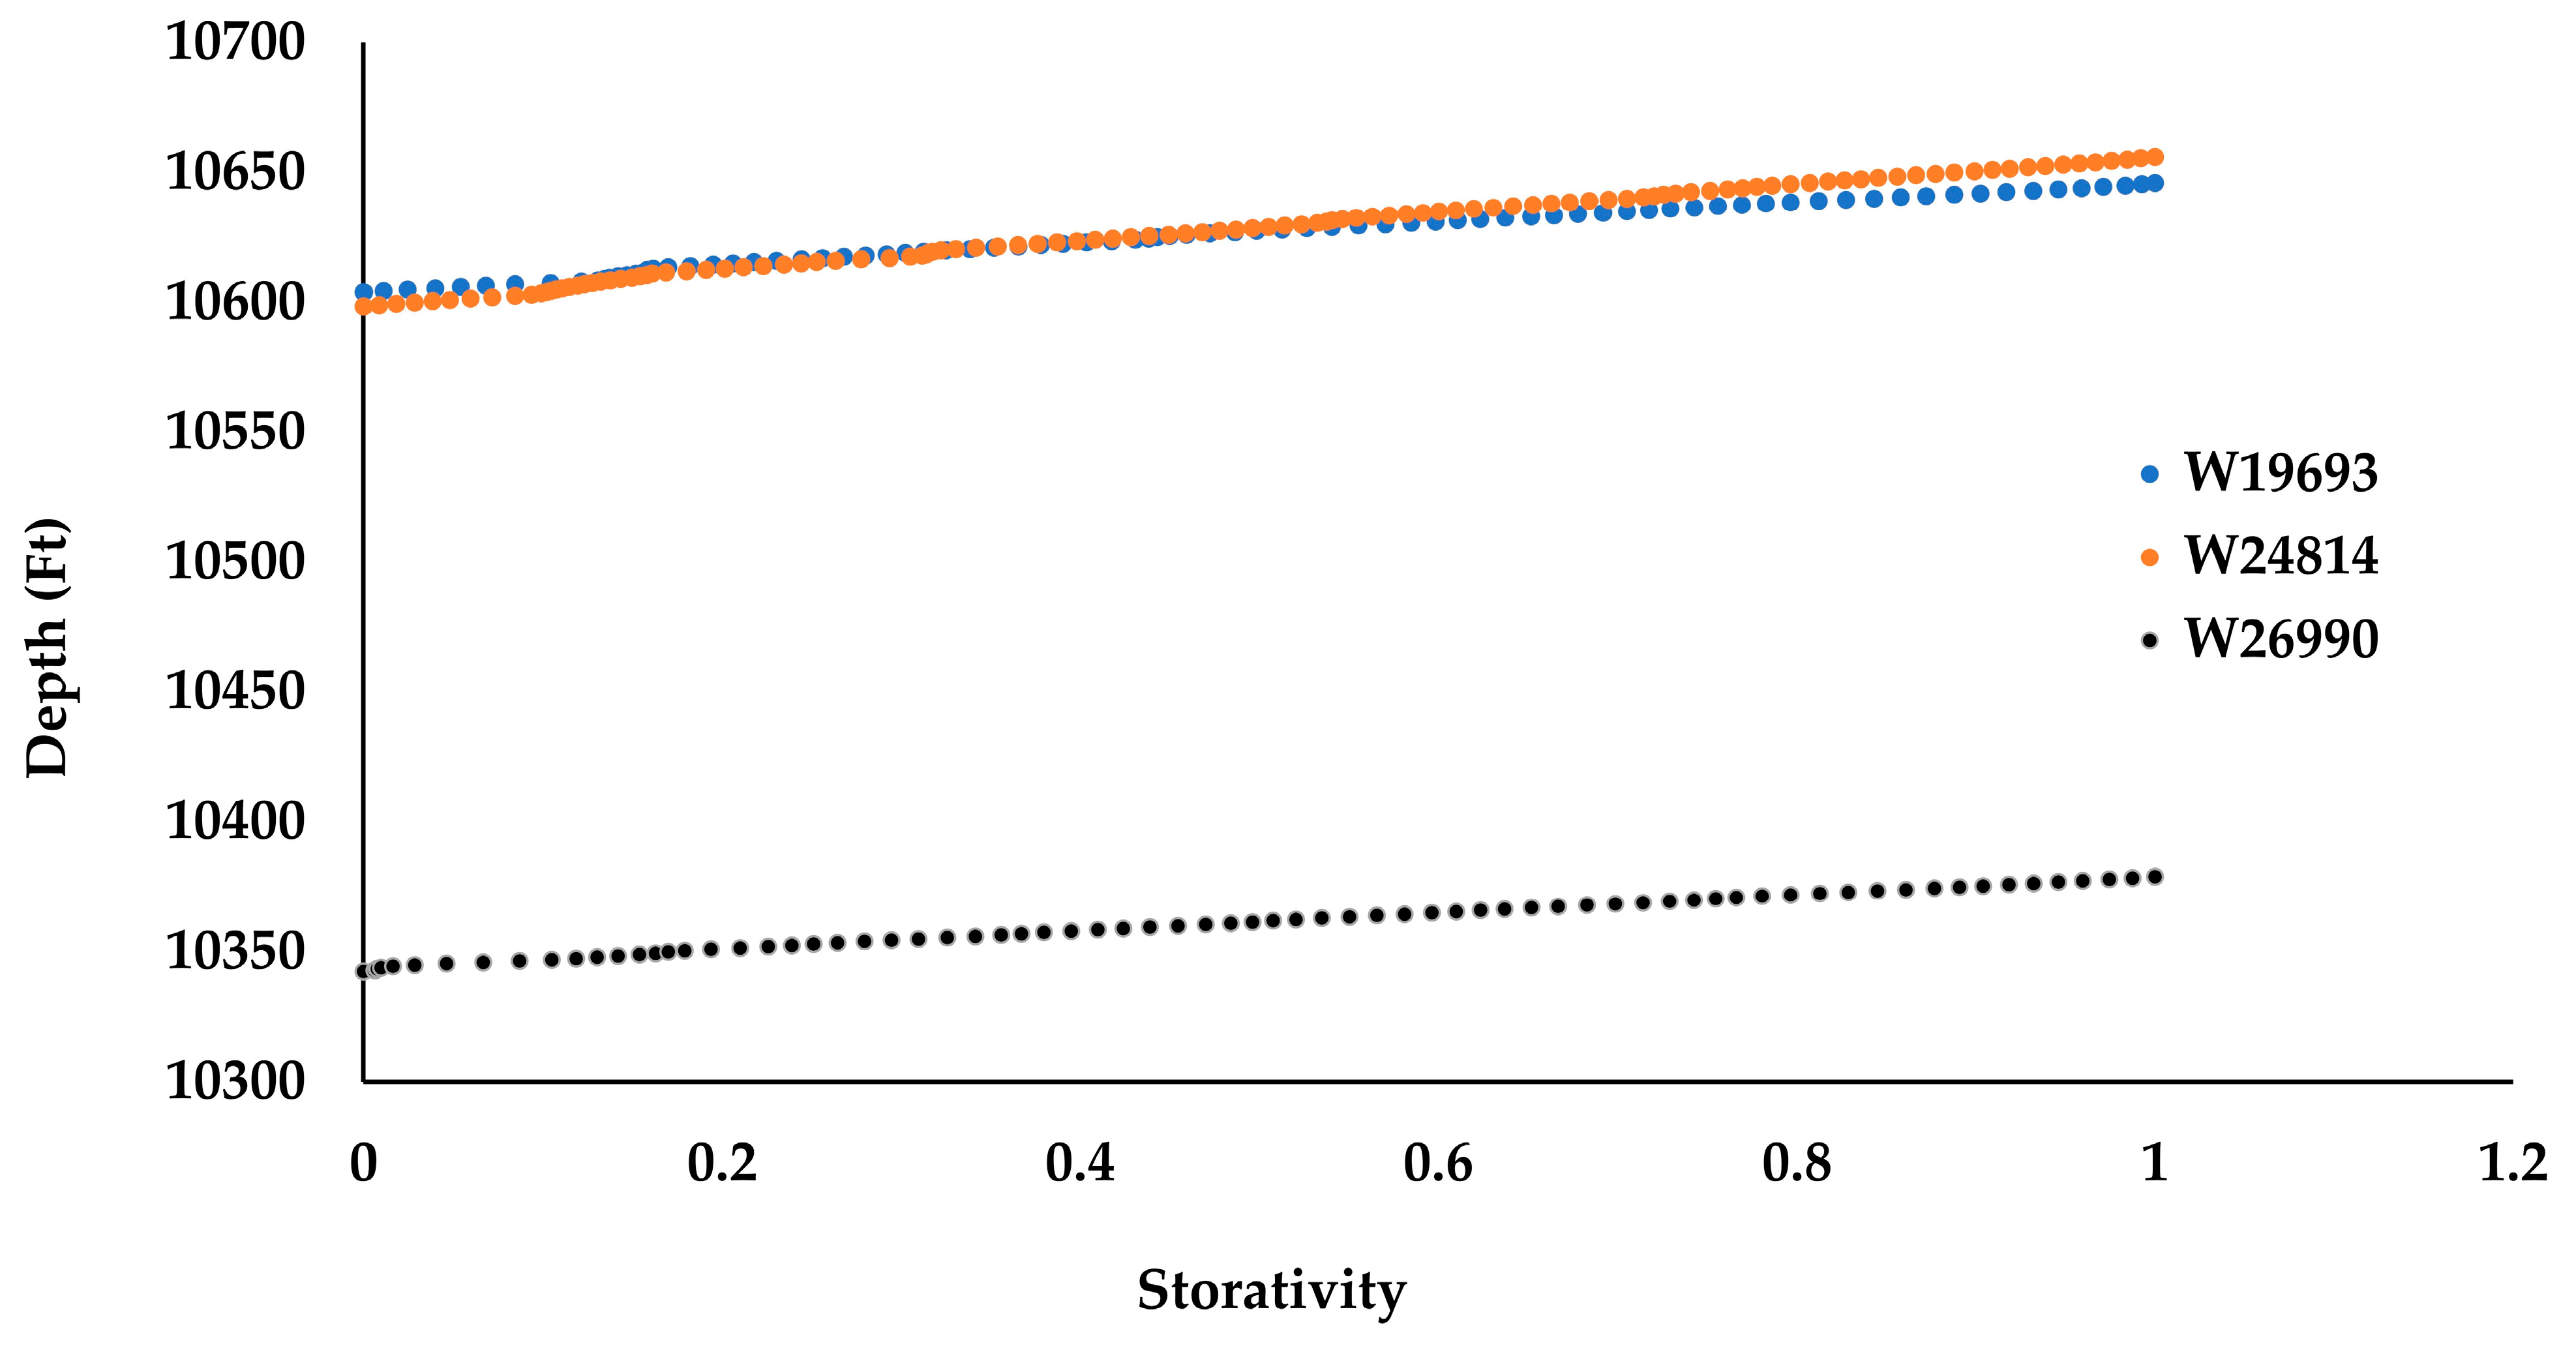
Two different approaches, outlined in Equations (9) and (10), were used to estimate the H2 storage capacity of the antelope field (Table 9). Both approaches were used to ensure consistency and validation of the results obtained from each method. Figure 11 illustrates the proportional correlation between storativity and depth for three wells.

6. Results

6.1. Quantifying Storage Capacity in the Antelope Field

The well (W24814) demonstrated the best storage capacity using the previous two methods, Equations (9) and (10), and had the optimal volume for potentially storing large quantities of hydrogen. Consequently, well W24814 was chosen for the case study. Each well in the Middle Bakken formation was evaluated using low, mid, and high scenarios. A 5% allowance was applied to two key reservoir parameters—gross thickness and porosity—since these significantly influence reserve estimation. This 5% allowance was used to estimate the storage capacity based on the pore volume as described in Equation (11). A conservative value of 0.04 for E was used in our study, considering H2′s density under reservoir temperature and pressure, as well as reservoir properties. The summary of pore volume and storage capacity for the selected Middle Bakken wells is presented in Table 10.
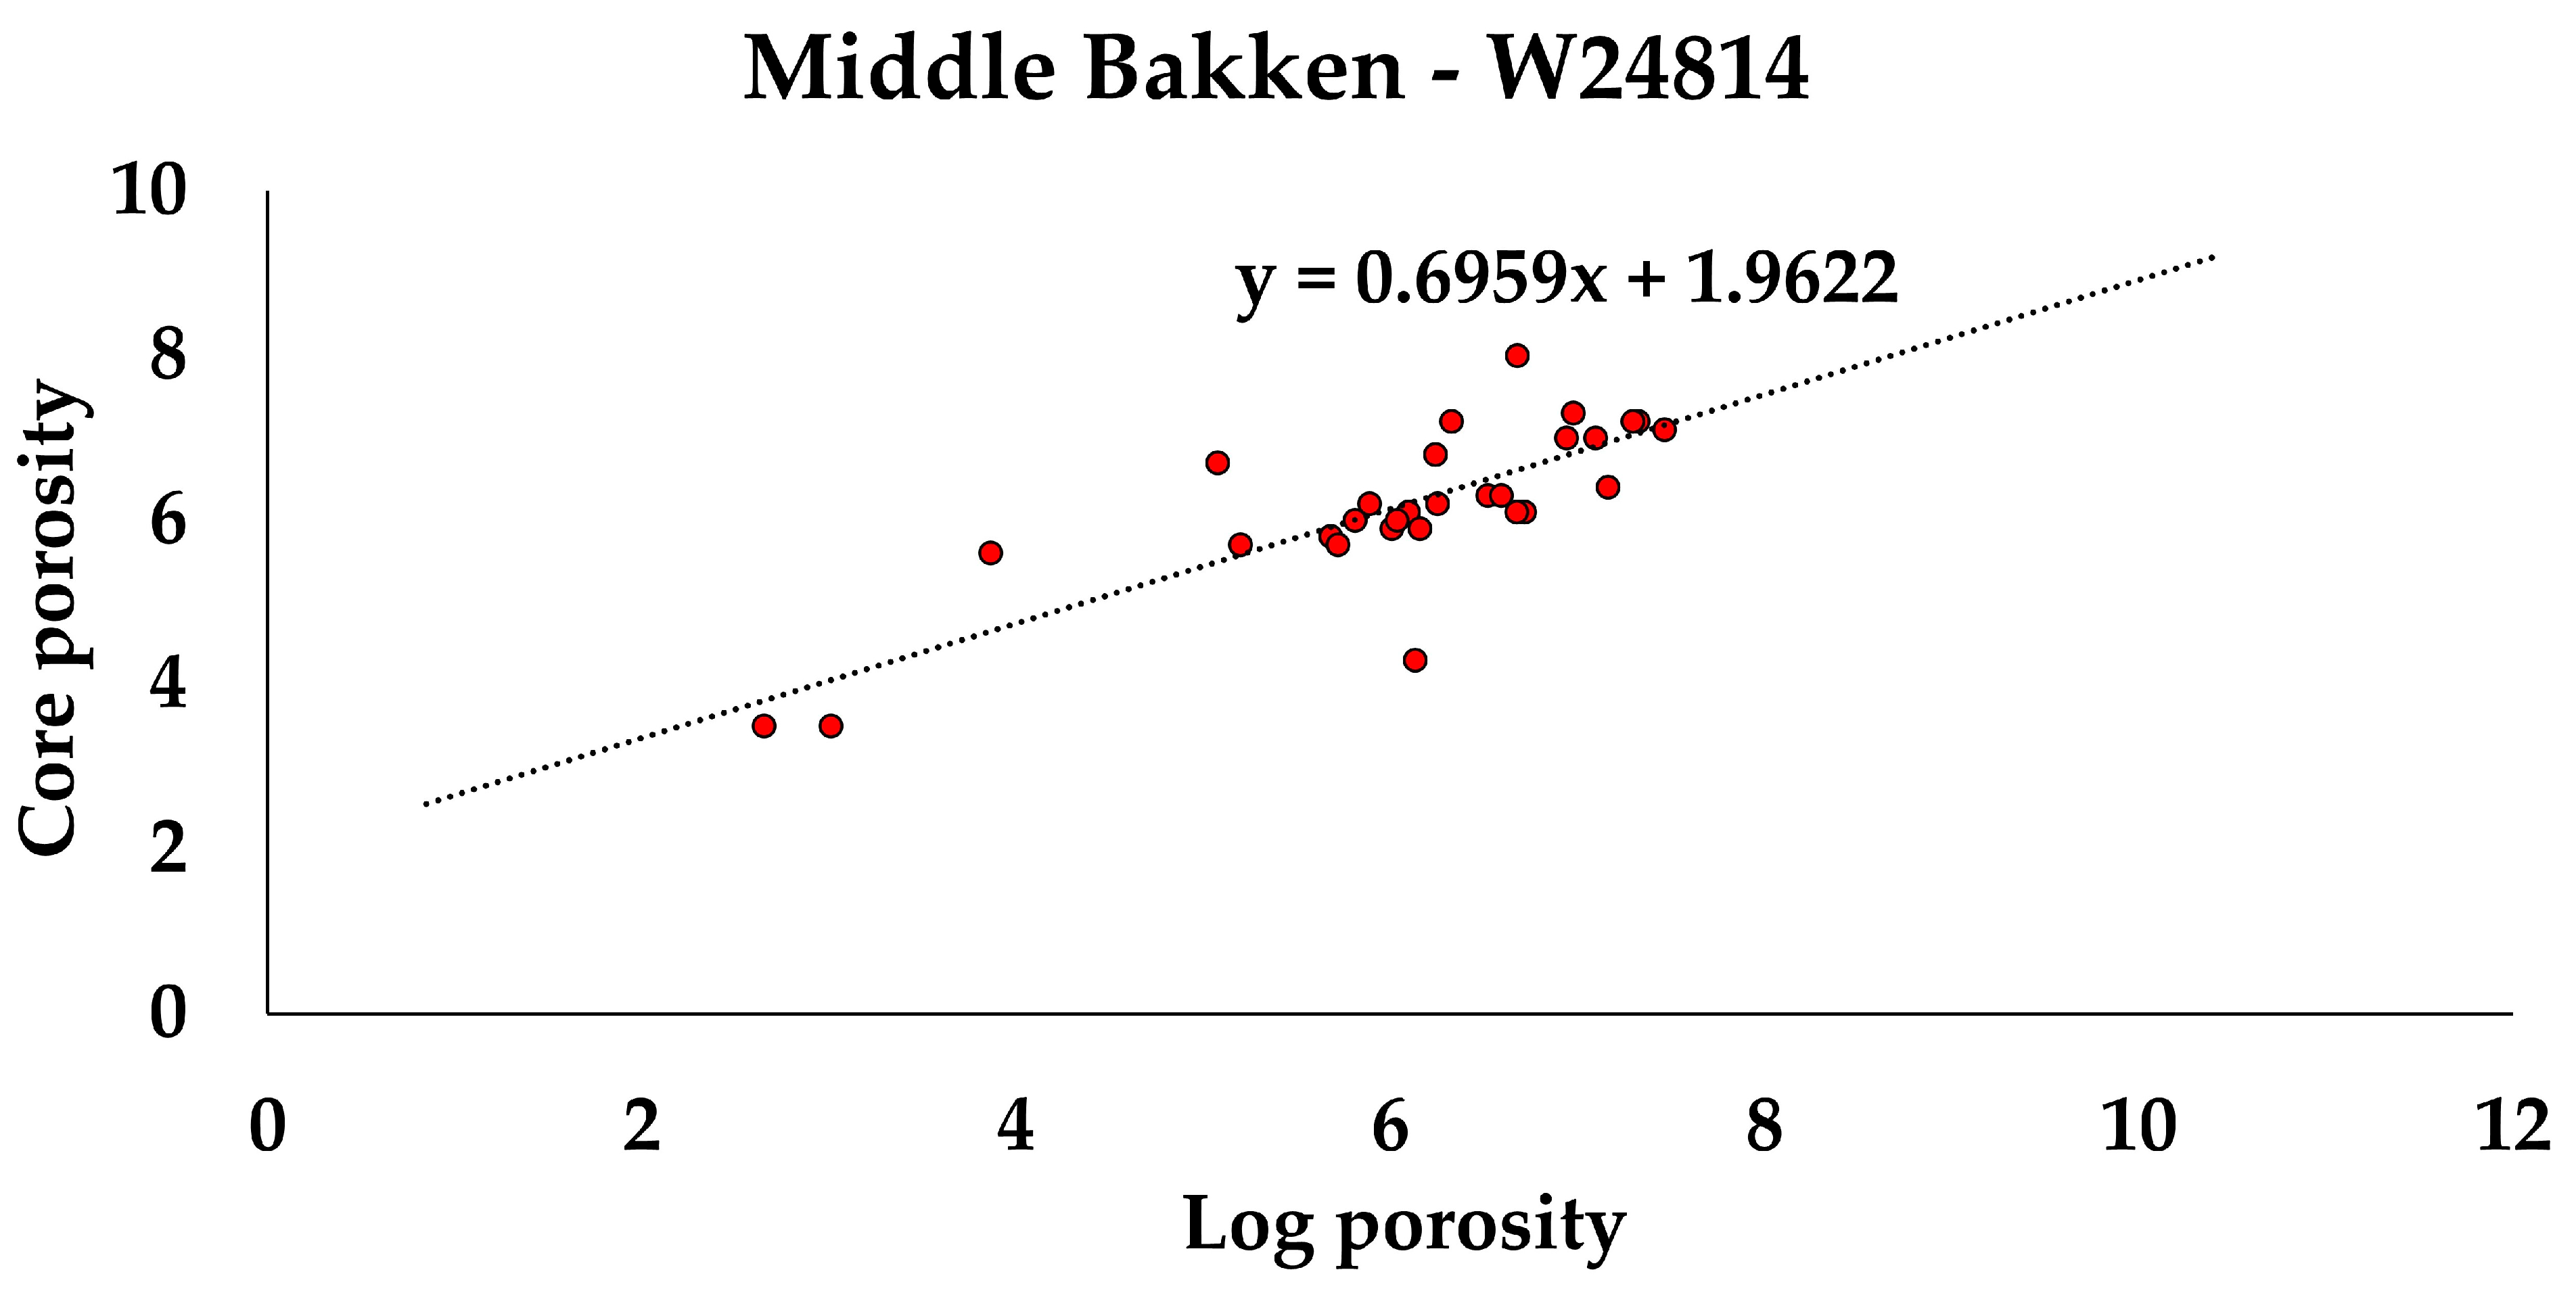
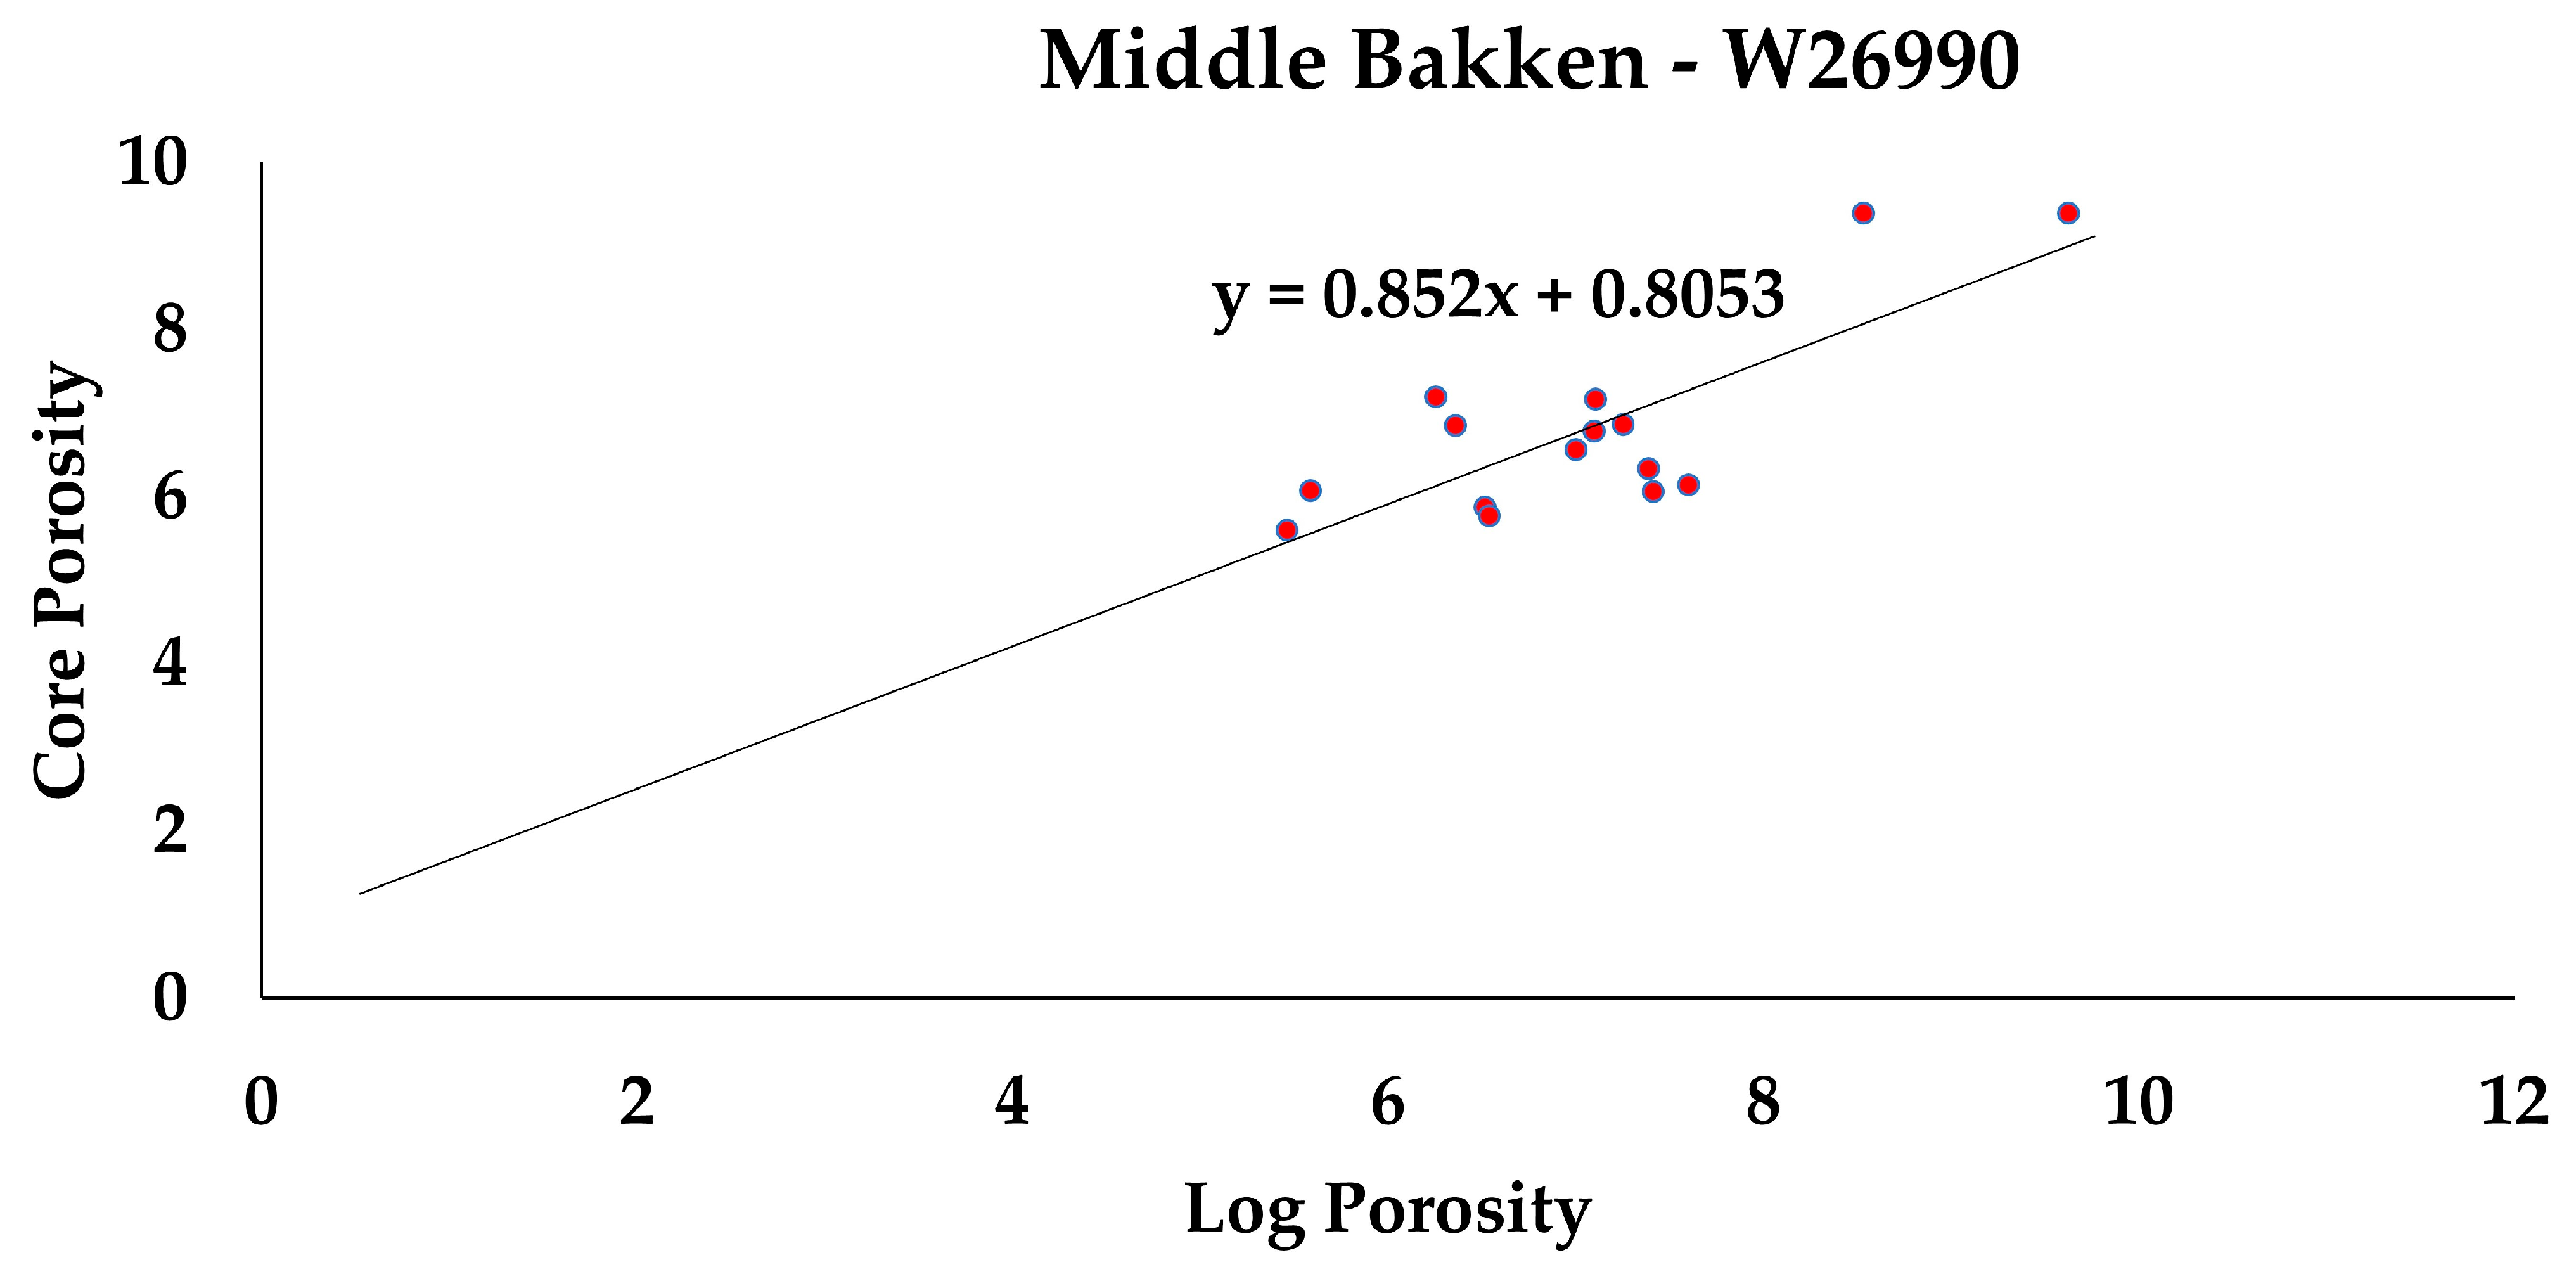
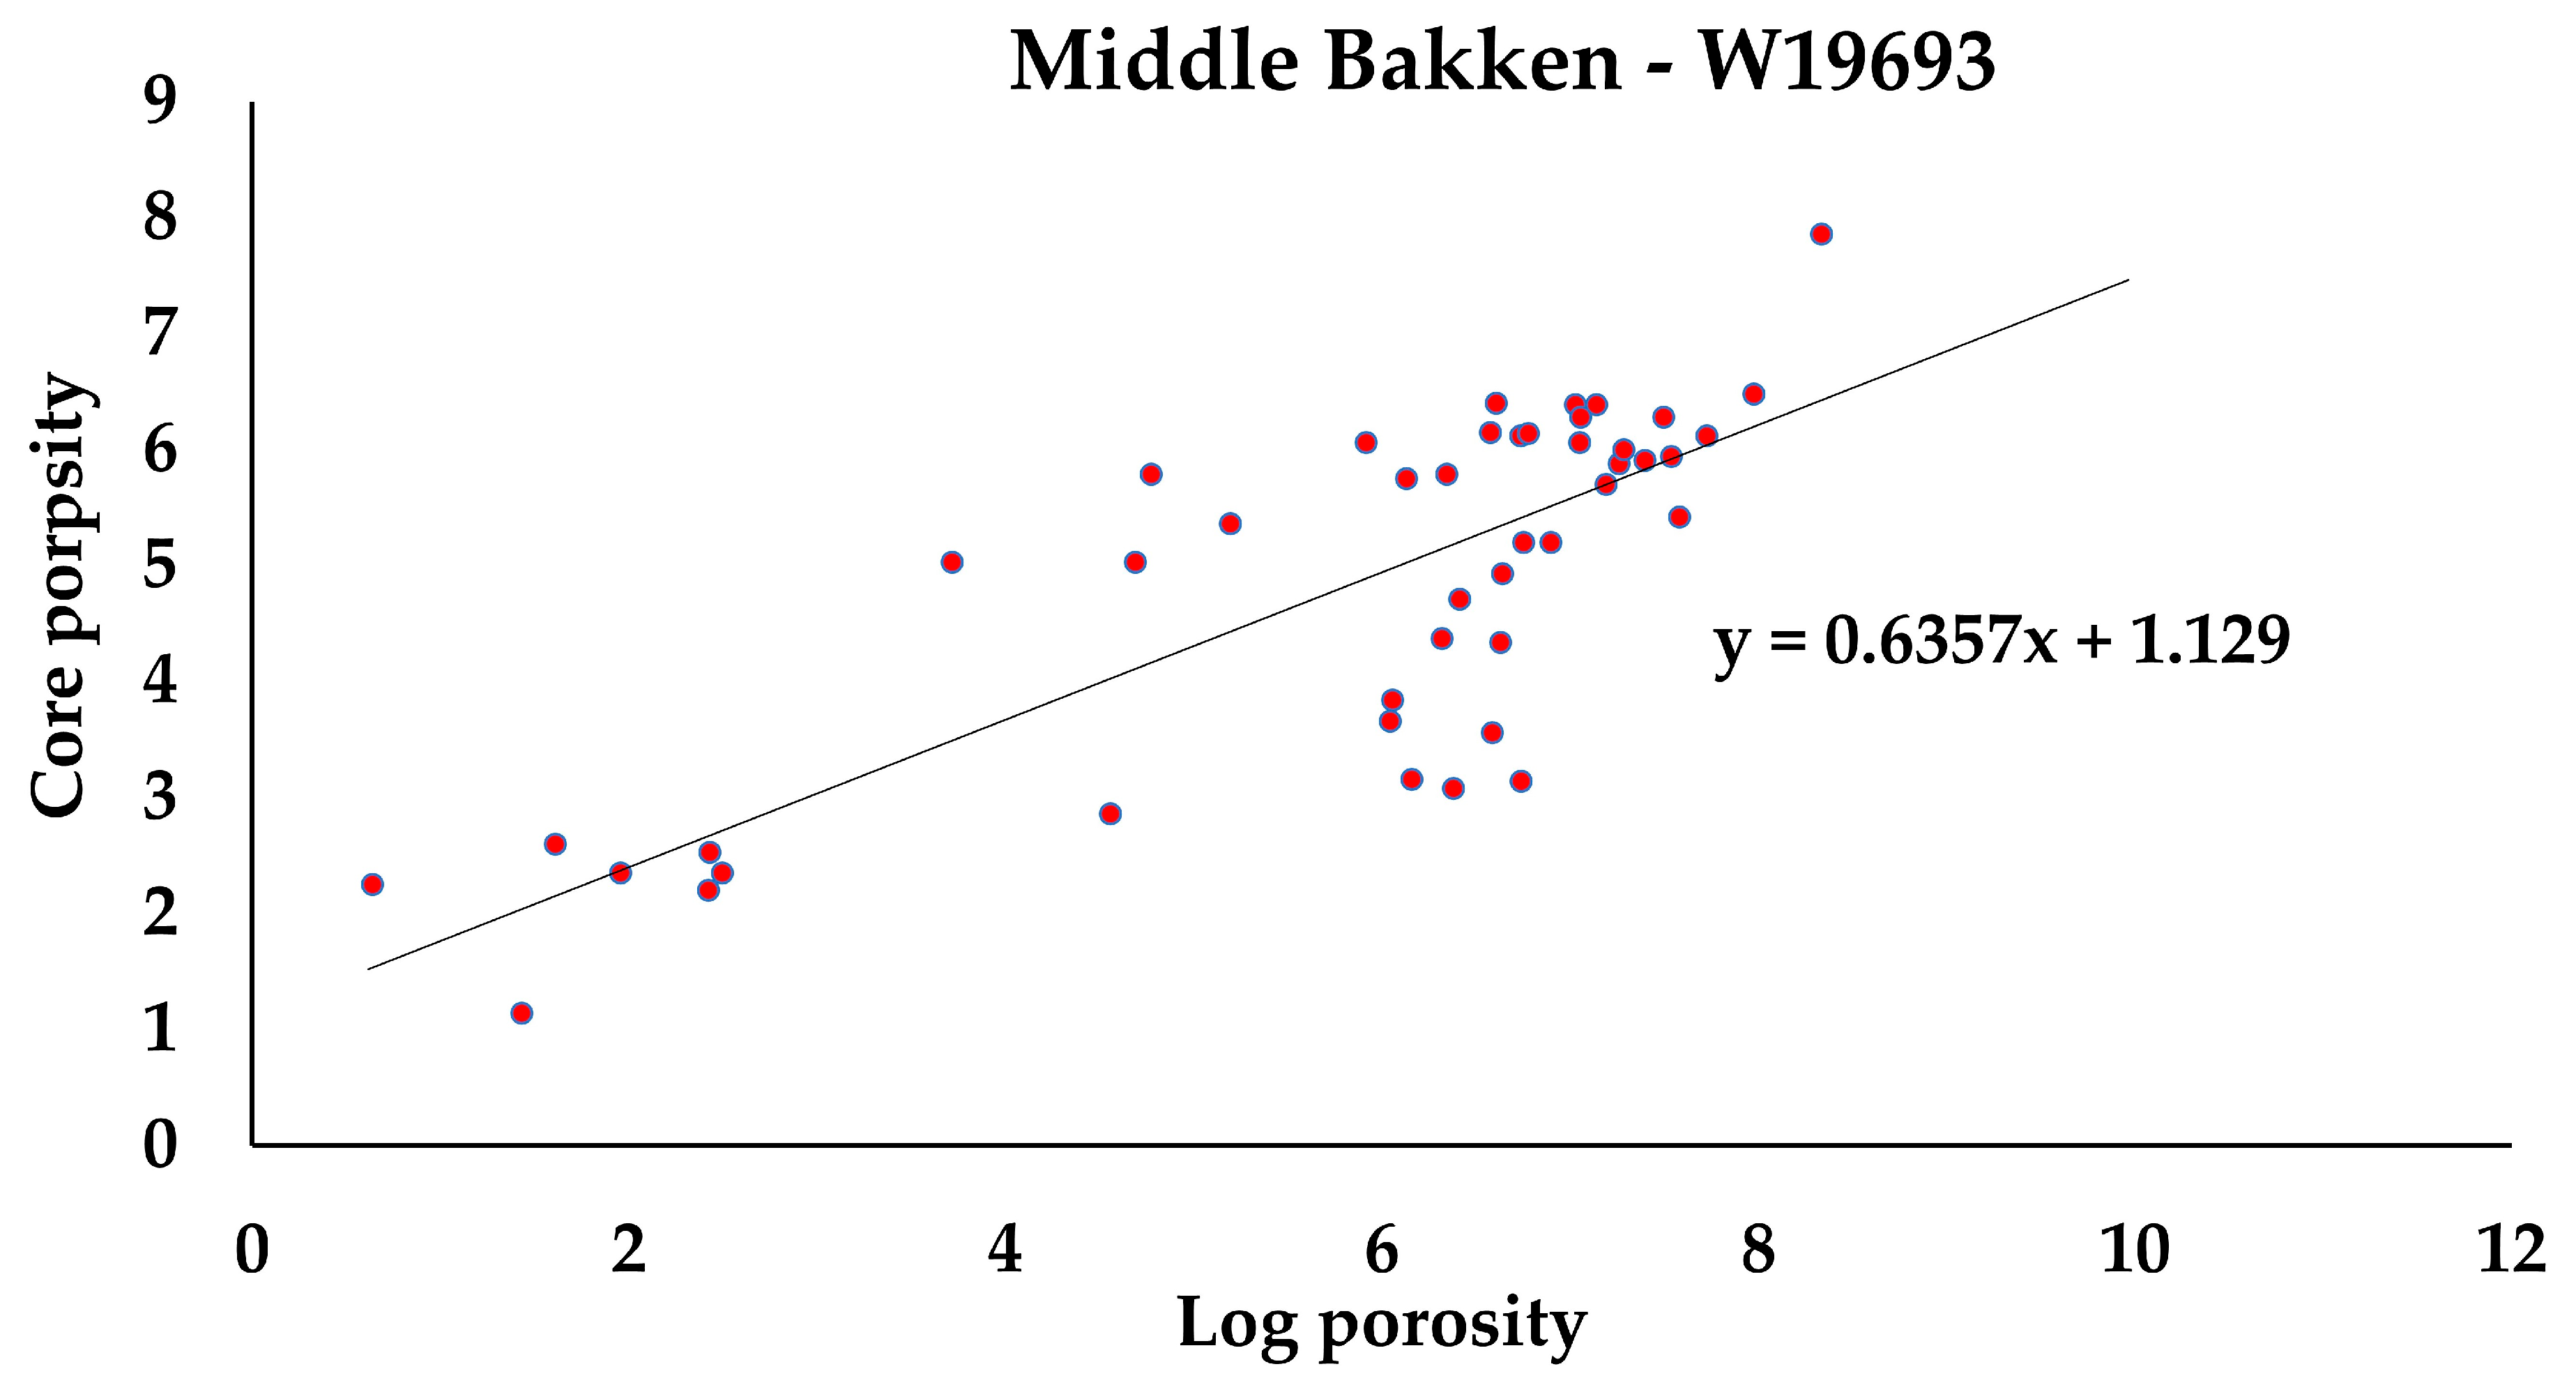
Core and log data from the Antelope field were utilized for calibration in this study (Figure 12, Figure 13 and Figure 14). Given the limited core data for most formation depths, porosity cross-plots were generated using the available core depths. These cross-plots were essential in refining the data, removing anomalies, and enhancing correlation coefficients. The findings show that the porosity values obtained from well logs were highly representative, resulting in accurate reserve estimates.
In this study, the primary focus was on estimating storage capacity using pore volume, a standard method in the industry for preliminary assessments, without considering wellbore integrity or potential leakage. To enhance the accuracy of the evaluation, the authors also incorporated a core analysis and log analysis, which provided detailed insights into the reservoir’s properties. These methods enable a better understanding of the formation’s porosity, permeability, and other critical factors that influence H2 storage potential. While the initial assessment is based on pore volume, core and log analyses help refine the understanding of the reservoir’s suitability for H2 storage. Future work with wellbore integrity and potential leakage can utilize the modeling approach for a more thorough evaluation.

6.2. Energy and Hydrogen Production Simulation

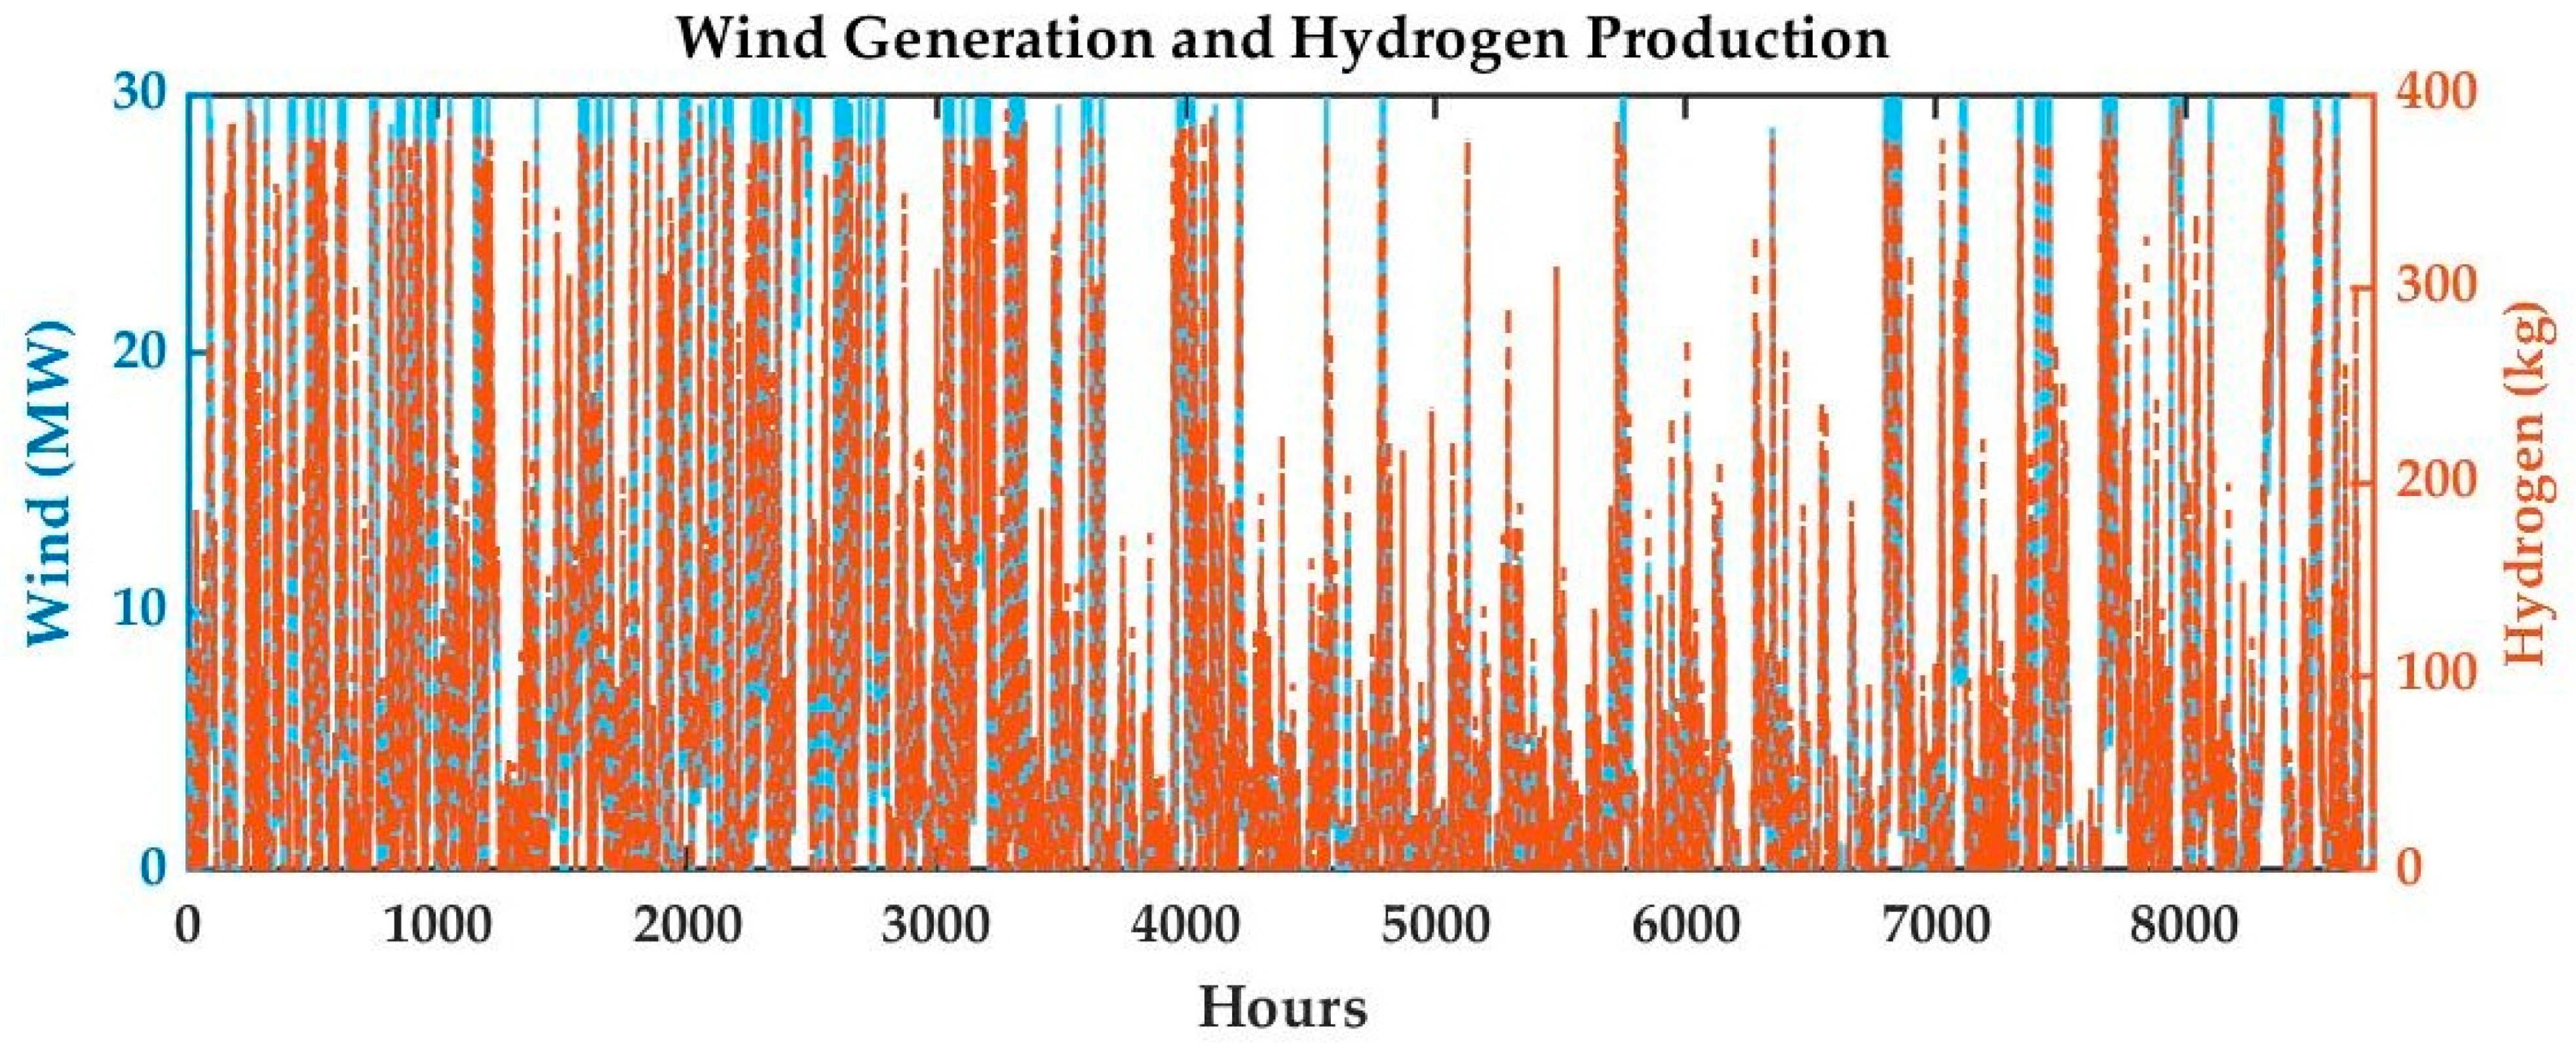
In this operation, the wind farm generates electricity as usual, supplying electricity to the electrolyzer for H2 production without any grid support. As a result, the electrolyzers operate intermittently, depending on the fluctuating power input. The installed capacity is 15 MW, with each unit having a capacity of 1.5 MW, giving a scale factor of 10. Wind power production fluctuates throughout the year, as shown in the hourly wind profile (Figure 15). The simulation was run using average hourly wind data for one year, from 1 January 2023 to 31 December 2023. For simplicity, the data were averaged for each hour over the period from 1 January 2023 to 31 January 2023, for the Middle Bakken. The simulation results in Figure 15 indicate that the annual average power output from the wind farm and the hydrogen production exhibit similar patterns and align well. This alignment confirms that the model accurately calculates both H2 production and average power outputs. The correlation between the hourly power output and H2 production in Figure 15 further validates the model’s effectiveness.
These results (Figure 16) show a total production of 386,370 kg of H2 from a 15 MW wind farm, which can be stored for at least 140 days in the depleted reservoir (W24814) with a capacity of 54,000 tons, which is equivalent to 1080 GWh of energy using 60% system efficiency. During this period, the wind farm generated 27.039 GWh, with 1.936 GWh curtailed due to the electrolyzer’s capacity limitations. Similarly, for wells W19693 and W26990, H2 can be stored for at least 86 days and 57 days, with energy storage of 660 and 440 GWh, respectively, using the same wind profile.
Table 11 emphasizes the seasonal H2 production and storage during the four seasons namely winter, spring, summer, and fall. During the summer, the wind speed is low compared to other seasons while spring has the highest wind speed in the Bakken region. As a result, the summer season requires more days to store H2, whilst the spring season requires the least number of days.
In the field of geological H2 storage, various geological factors significantly influence storage capacity and efficiency. Heinemann et al. [36] explored the impact of porosity and permeability on H2 storage within porous media. Their study concluded that higher porosity and permeability generally enhance storage capacity and injectivity; however, they cautioned that excessive permeability could lead to H2 migration, underscoring the necessity of proper caprock sealing. A high intrinsic permeability is required to ensure well deliverability, with a minimum value of 50md and an effective porosity of greater than 10% for sandstones [55]. The study observed varying storage capacities across different wells (W24814, W19693, and W26990), which can be attributed to differences in porosity and permeability, in line with Heinemann et al. [36]’s findings. Additionally, Flesch et al. [56] investigated the geochemical interactions between H2 and caprock minerals, emphasizing the crucial role of caprock integrity in preventing H2 leakage and ensuring long-term storage stability. Although the study did not directly assess caprock integrity, the successful storage durations (140, 86, and 57 days for the respective wells) indicate sufficient sealing properties within the Bakken formation. Moreover, Amid et al. [34] examined the effects of reservoir pressure and temperature on H2 storage capacity in depleted gas fields. They found that higher pressures generally enhance storage capacity, while temperature effects are more complex. The differences in storage capacities across the wells in the study, reflecting variations in pressure and temperature conditions within the Bakken formation, are consistent with Amid et al. [34]’s findings.

7. Conclusions and Recommendations

This research introduces a novel co-located system approach to energy storage by integrating wind power with UHS within the depleted oil and gas reservoirs of the Bakken Formation, North Dakota. The study’s key innovation lies in repurposing a region historically associated with fossil fuels for sustainable energy storage, thereby addressing the intermittency of wind sources. The focus areas of this research are: (i) determining total reservoir capacity; (ii) evaluating H2 production; and (iii) calculating the minimum amount of time in days that it takes to store the produced hydrogen. The analysis revealed that the selected wells, i.e., W24814, W19693, and W26990 in the Middle Bakken Formation have significant storage capacities of 54,000, 33,000, and 22,000 tons, with potential storage durations ranging from 57 to 140 days, depending on the well. By combining weather data with mathematical models, available wind power and H2 production were estimated. These results not only validate the feasibility of large-scale H2 storage in the Bakken Formation but also highlight its potential to enhance the reliability of wind energy systems.
In terms of future research directions, the authors recommend conducting experiments and real-time simulations to explore the hydrodynamics, geochemical aspects, and microbial factors that influence storage capacity, gas containment efficiency, and withdrawal processes. Accurately modeling the behavior of such plants will provide valuable insights for controlling and operating future H2 storage systems. Therefore, future work should incorporate wellbore integrity and potential leakage for a more comprehensive assessment. Furthermore, they suggest upgrading the model to incorporate a techno-economic framework and dynamic modeling. The study is expected to assist researchers in conducting scenario analyses, validating theoretical findings, and optimizing system operation in future investigations, further solidifying the role of geological H2 storage in the global energy transition.

Author Contributions

Conceptualization, writing—original draft preparation, S.O.B. and E.G; writing—review and editing, S.O.B., O.S.T., E.G., R.A., R.J. and T.O.; supervision, O.S.T. All authors have read and agreed to the published version of the manuscript.

Funding

This research received no external funding.

Data Availability Statement

All data are available on request from the corresponding author.

Acknowledgments

The authors gratefully acknowledge the Department of Energy Engineering and Department of Petroleum Engineering, University of North Dakota, for motivating us to publish this paper.

Conflicts of Interest

The afore-mentioned authors declare no conflicts of interest.

Nomenclature

BIJABiden Infrastructure Job Act
Cp Power coefficient
DOEDepartment of Energy
EelecElectricity consumption
EERCEnergy and Environmental Research Center
GEGeneric Electric
GHGGreenhouse gas
GWhGiga watt hour
mDMilli diameter
MW Megawatt
NDAWNNorth Dakota Agricultural Weather Network
NDDMRNorth Dakota Department of Minerals Resources
NETLNational Energy Technology Laboratory
NRELNational Renewable Energy Laboratory
PEMProton exchange membrane
SMRSteam methane reforming
UHSUnderground hydrogen storage
VcutinCut in speed
VcutoutCut out speed
ϕ Porosity fraction
ηconvConversion efficiency

References

  1. Muhammed, N.S.; Haq, B.; Shehri, D.A.; Al-Ahmed, A.; Rahman, M.M.; Zaman, E.; Iglauer, S. Hydrogen storage in depleted gas reservoirs: A comprehensive review. Fuel 2023, 337, 127032. [Google Scholar] [CrossRef]
  2. Bade, S.O.; Meenakshisundaram, A.; Omojiba, T.; Tomomewo, O. Battery Uses for Regulating Active Power in Utility-scale Wind-based Hybrid Power Plant. Am. J. Energy Res. 2023, 11, 82–92. [Google Scholar] [CrossRef]
  3. Raad, S.M.J.; Leonenko, Y.; Hassanzadeh, H. Hydrogen storage in saline aquifers: Opportunities and challenges. Renew. Sustain. Energy Rev. 2022, 168, 112846. [Google Scholar] [CrossRef]
  4. Bade, S.O.; Tomomewo, O.; Meenakshisundaram, A. Utility-Scale Wind-Based Hybrid Power Plants and Control Strategy. Sustain. Energy 2023, 11, 12–20. [Google Scholar] [CrossRef]
  5. Abe, J.; Popoola, A.; Ajenifuja, E.; Popoola, O. Hydrogen energy, economy and storage: Review and recommendation. Int. J. Hydrogen Energy 2019, 44, 15072–15086. [Google Scholar] [CrossRef]
  6. Gatto, A.; Sadik-Zada, E.R.; Lohoff, T.; Aldieri, L.; Vinci, C.P.; Peitz, K.A. An exemplary subsidization path for the green H2 economy uptake: Rollout policies in the US and the European Union. J. Clean. Prod. 2024, 440, 140757. [Google Scholar] [CrossRef]
  7. Nasiritousi, N.; Grimm, J. Governing toward decarbonization: The legitimacy of national orchestration. Environ. Policy Gov. 2022, 32, 411–425. [Google Scholar] [CrossRef]
  8. Gulli, C.; Heid, B.; Noffsinger, J.; Waardenburg, M.; Wilthane, M. Global Energy Perspectives 2023: Hydrogen Outlook; McKinsey & Company: Chicago, IL, USA, 2024. [Google Scholar]
  9. Ndulue, U.F.; Tomomewo, O.S.; Khalifa, H. A Comprehensive Review of Fishbone Well Applications in Conventional and Renewable Energy Systems in the Path towards Net Zero. Fuels 2023, 4, 376–396. [Google Scholar] [CrossRef]
  10. Ikuerowo, T.; Bade, S.O.; Akinmoladun, A.; Oni, B.A. The integration of wind and solar power to water electrolyzer for green hydrogen production. Int. J. Hydrogen Energy 2024, 76, 75–96. [Google Scholar] [CrossRef]
  11. Bade, S.O.; Tomomewo, O.S.; Meenakshisundaram, A.; Ferron, P.; Oni, B.A. Economic, social, and regulatory challenges of green hydrogen production and utilization in the US: A review. Int. J. Hydrogen Energy 2023, 49, 314–335. [Google Scholar] [CrossRef]
  12. Hassan, Q.; Abbas, M.K.; Tabar, V.S.; Tohidi, S.; Abdulrahman, I.S.; Salman, H.M. Sizing electrolyzer capacity in conjunction with an off-grid photovoltaic system for the highest hydrogen production. Energy Harvest. Syst. 2023, 10, 331–348. [Google Scholar] [CrossRef]
  13. Bade, S.O.; Tomomewo, O.S. A review of governance strategies, policy measures, and regulatory framework for hydrogen energy in the United States. Int. J. Hydrogen Energy 2024, 78, 1363–1381. [Google Scholar] [CrossRef]
  14. Mouli-Castillo, J.; Heinemann, N.; Edlmann, K. Mapping geological hydrogen storage capacity and regional heating demands: An applied UK case study. Appl. Energy 2021, 283, 116348. [Google Scholar] [CrossRef]
  15. Chen, Y.; Jin, X.; Zeng, L.; Zhong, Z.; Mehana, M.; Xiao, W.; Pu, W.; Regenauer-Lieb, K.; Xie, Q. Role of large-scale underground hydrogen storage and its pathways to achieve net-zero in China. J. Energy Storage 2023, 72, 108448. [Google Scholar] [CrossRef]
  16. Sambo, C.; Dudun, A.; Samuel, S.A.; Esenenjor, P.; Muhammed, N.S.; Haq, B. A review on worldwide underground hydrogen storage operating and potential fields. Int. J. Hydrogen Energy 2022, 47, 22840–22880. [Google Scholar] [CrossRef]
  17. Zivar, D.; Kumar, S.; Foroozesh, J. Underground hydrogen storage: A comprehensive review. Int. J. Hydrogen Energy 2021, 46, 23436–23462. [Google Scholar] [CrossRef]
  18. Andersson, J.; Grönkvist, S. Large-scale storage of hydrogen. Int. J. Hydrogen Energy 2019, 44, 11901–11919. [Google Scholar] [CrossRef]
  19. Matos, C.R.; Carneiro, J.F.; Silva, P.P. Overview of Large-Scale Underground Energy Storage Technologies for Integration of Renewable Energies and Criteria for Reservoir Identification. J. Energy Storage 2019, 21, 241–258. [Google Scholar] [CrossRef]
  20. Bade, S.O.; Taiwo, K.; Ndulue, U.F.; Tomomewo, O.S.; Oni, B.A. A review of underground hydrogen storage systems: Current status, modeling approaches, challenges, and future prospective. J. Hydrogen Energy 2024, 80, 449–474. [Google Scholar] [CrossRef]
  21. Ciotta, M.; Tassinari, C.; Zacharias, L.G.L.; Van Der Zwaan, B.; Peyerl, D. Hydrogen storage in depleted offshore gas fields in Brazil: Potential and implications for energy security. Int. J. Hydrogen Energy 2023, 48, 39967–39980. [Google Scholar] [CrossRef]
  22. U.S. Department of Energy. U.S. National Clean Hydrogen Strategy and Roadmap. 2023. Available online: https://www.hydrogen.energy.gov/docs/hydrogenprogramlibraries/pdfs/clean-hydrogen-strategy-roadmap.pdf?Status=Master (accessed on 30 June 2024).
  23. Lord, A.S.; Kobos, P.H.; Borns, D.J. Geologic storage of hydrogen: Scaling up to meet city transportation demands. Int. J. Hydrogen Energy 2014, 39, 15570–15582. [Google Scholar] [CrossRef]
  24. Tarkowski, R. Underground hydrogen storage: Characteristics and prospects. Renew. Sustain. Energy Rev. 2019, 105, 86–94. [Google Scholar] [CrossRef]
  25. Epelle, E.I.; Obande, W.; Udourioh, G.A.; Afolabi, I.C.; Desongu, K.S.; Orivri, U.; Gunes, B.; Okolie, J.A. Perspectives and prospects of underground hydrogen storage and natural hydrogen. Sustain. Energy Fuels 2022, 6, 3324–3343. [Google Scholar] [CrossRef]
  26. North Dakota Labor Market Information. North Dakota Oil and Gas Economy. 2023. Available online: https://ndlegis.gov/files/committees/65-2017/19_5029_03000appendixj.pdf (accessed on 6 May 2024).
  27. Energy Information Administration. North Dakota State Profile and Energy Estimates. 2022. Available online: https://www.eia.gov/state/?sid=ND (accessed on 23 May 2024).
  28. Tarkowski, R.; Uliasz-Misiak, B. Towards underground hydrogen storage: A review of barriers. Renew. Sustain. Energy Rev. 2022, 162, 112451. [Google Scholar] [CrossRef]
  29. Hagemann, B.; Rasoulzadeh, M.; Panfilov, M.; Ganzer, L.; Reitenbach, V. Mathematical modeling of unstable transport in underground hydrogen storage. Environ. Earth Sci. 2015, 73, 6891–6898. [Google Scholar] [CrossRef]
  30. Muhammed, N.S.; Haq, B.; Shehri, D.A.; Al-Ahmed, A.; Rahman, M.M.; Zaman, E. A review on underground hydrogen storage: Insight into geological sites, influencing factors and future outlook. Energy Rep. 2022, 8, 461–499. [Google Scholar] [CrossRef]
  31. Hemme, C.; Van Berk, W. Hydrogeochemical Modeling to Identify Potential Risks of Underground Hydrogen Storage in Depleted Gas Fields. Appl. Sci. 2018, 8, 2282. [Google Scholar] [CrossRef]
  32. Kanaani, M.; Sedaee, B.; Asadian-Pakfar, M. Role of Cushion Gas on Underground Hydrogen Storage in Depleted Oil Reservoirs. J. Energy Storage 2022, 45, 103783. [Google Scholar] [CrossRef]
  33. Aluah, R.; Fadairo, A.; Opeyemi, O.; Ni, R.; Foerster, I. An Experimental Study on the Caprock Integrity of Reservoirs to Assess the Repurposing Depleted Bakken Formation Oil and Gas Fields for Underground Hydrogen Storage. In Proceedings of the SPE Energy Transition Symposium, Houston, TX, USA, 5 August 2024. [Google Scholar] [CrossRef]
  34. Amid, A.; Mignard, D.; Wilkinson, M. Seasonal storage of hydrogen in a depleted natural gas reservoir. Int. J. Hydrogen Energy 2016, 41, 5549–5558. [Google Scholar] [CrossRef]
  35. Song, H.; Guo, H.; Wang, Y.; Lao, J.; Zhu, H.; Tang, L.; Liu, X. A novel hybrid energy system for hydrogen production and storage in a depleted oil reservoir. Int. J. Hydrogen Energy 2021, 46, 18020–18031. [Google Scholar] [CrossRef]
  36. Heinemann, N.; Alcalde, J.; Miocic, J.M.; Hangx, S.J.; Kallmeyer, J.; Ostertag-Henning, C.; Hassanpouryouzband, A.; Thaysen, E.M.; Strobel, G.J.; Schmidt-Hattenberger, C.; et al. Enabling large-scale hydrogen storage in porous media–the scientific challenges. Energy Environ. Sci. 2021, 14, 853–864. [Google Scholar] [CrossRef]
  37. Scafidi, J.; Wilkinson, M.; Gilfillan, S.M.; Heinemann, N.; Haszeldine, R.S. A quantitative assessment of the hydrogen storage capacity of the UK continental shelf. Int. J. Hydrogen Energy 2021, 46, 8629–8639. [Google Scholar] [CrossRef]
  38. Okoroafor Okoroafor, E.R.; Kim, T.W.; Nazari, N.; Watkins, H.Y.; Saltzer, S.D.; Kovscek, A.R. Assessing the Underground Hydrogen Storage Potential of Depleted Gas Fields in Northern California. In Proceedings of the SPE Annual Technical Conference and Exhibition, Houston, TX, USA, 5 October 2022. [Google Scholar] [CrossRef]
  39. Chen, F.; Ma, Z.; Nasrabadi, H.; Chen, B.; Mehana, M.; Wieke, V.W.J. Technical and Economic Feasibility Analysis of Underground Hydrogen Storage: A Case Study in Intermountain-West Region USA. arXiv 2022, arXiv:2209.03239. [Google Scholar] [CrossRef]
  40. Barison, E.; Donda, F.; Merson, B.; Le Gallo, Y.; Réveillère, A. An insight into underground hydrogen storage in Italy. Sustainability 2023, 15, 6886. [Google Scholar] [CrossRef]
  41. Yousefi, S.H.; Groenenberg, R.; Koornneef, J.; Juez-Larré, J.; Shahi, M. Techno-economic analysis of developing an underground hydrogen storage facility in depleted gas field: A Dutch case study. Int. J. Hydrogen Energy 2023, 48, 28824–28842. [Google Scholar] [CrossRef]
  42. Saeed, M.; Jadhawar, P.; Bagala, S. Geochemical effects on storage gases and reservoir rock during underground hydrogen storage: A depleted North Sea oil reservoir case study. Hydrogen 2023, 4, 323–337. [Google Scholar] [CrossRef]
  43. Okoroafor, E.; Nazari, N.; Kim, T.; Watkins, H.; Saltzer, S.; Kovscek, A. Assessment of hydrogen storage potential in depleted gas fields and power-to-hydrogen conversion efficiency: A northern California case study. Int. J. Hydrogen Energy 2024, 71, 982–998. [Google Scholar] [CrossRef]
  44. Uliasz-Misiak, B.; Lewandowska-Śmierzchalska, J.; Matuła, R. Hydrogen Storage Potential in Natural Gas Deposits in the Polish Lowlands. Energies 2024, 17, 374. [Google Scholar] [CrossRef]
  45. Saadat, Z.; Farazmand, M.; Sameti, M. Integration of underground green hydrogen storage in hybrid energy generation. Fuel 2024, 371, 131899. [Google Scholar] [CrossRef]
  46. Simenson, A.L.; Sonnenberg, S.A.; Cluff, R.M. Depositional facies and petrophysical analysis of the Bakken Formation, Parshall Field and surrounding area, Mountrail County, North Dakota. 2011. Available online: https://repository.mines.edu/handle/11124/16188 (accessed on 20 April 2024).
  47. Johanson, K. States with Most Wind Energy. 2021. Available online: https://stacker.com/environment/states-most-untapped-wind-energy-potential (accessed on 20 April 2024).
  48. National Energy Technology Laboratory. Underground Hydrogen Storage Remains a Key Research Topic for NETL. Available online: https://netl.doe.gov/node/11982 (accessed on 29 June 2024).
  49. Eminoglu, U.; Turksoy, O. Power curve modeling for wind turbine systems: A comparison study. Int. J. Ambient Energy 2021, 42, 1912–1921. [Google Scholar] [CrossRef]
  50. Dinh, V.D.; Leahy, P.; McKeogh, E.; Murphy, J.; Cummins, V. Development of a viability assessment model for hydrogen production from dedicated offshore wind farms. Int. J. Hydrogen Energy 2021, 46, 24620–24631. [Google Scholar] [CrossRef]
  51. North Dakota Agricultural Weather Network. Available online: https://ndawn.ndsu.nodak.edu/weather-data-hourly.html (accessed on 19 May 2024).
  52. General Electric. 1.5-77 Wind Turbine Brochure. Available online: https://www.energy-xprt.com/downloads/15-77-wind-turbine-brochure-402601 (accessed on 6 October 2024).
  53. International Renewable Energy Agency. Hydrogen from Renewable Power Technology Outlook for the Energy Transition. Abu Dhabi. Available online: https://www.irena.org/publications/2018/Sep/Hydrogen-from-renewable-power (accessed on 7 October 2024).
  54. North Dakota Department of Mineral Resources. Available online: https://www.ndic.nd.gov/agencies/department-mineral-resources (accessed on 15 June 2024).
  55. Pfeiffer, W.T.; Beyer, C.; Bauer, S. Hydrogen storage in a heterogeneous sandstone formation: Dimensioning and induced hydraulic effects. Pet. Geosci. 2017, 23, 315–326. [Google Scholar] [CrossRef]
  56. Flesch, S.; Pudlo, D.; Albrecht, D.; Jacob, A.; Enzmann, F. Hydrogen underground storage—Petrographic and petrophysical variations in reservoirs and stones from laboratory experiments under simulated reservoir conditions. Int. J. Hydrogen Energy 2018, 43, 20822–20835. [Google Scholar] [CrossRef]
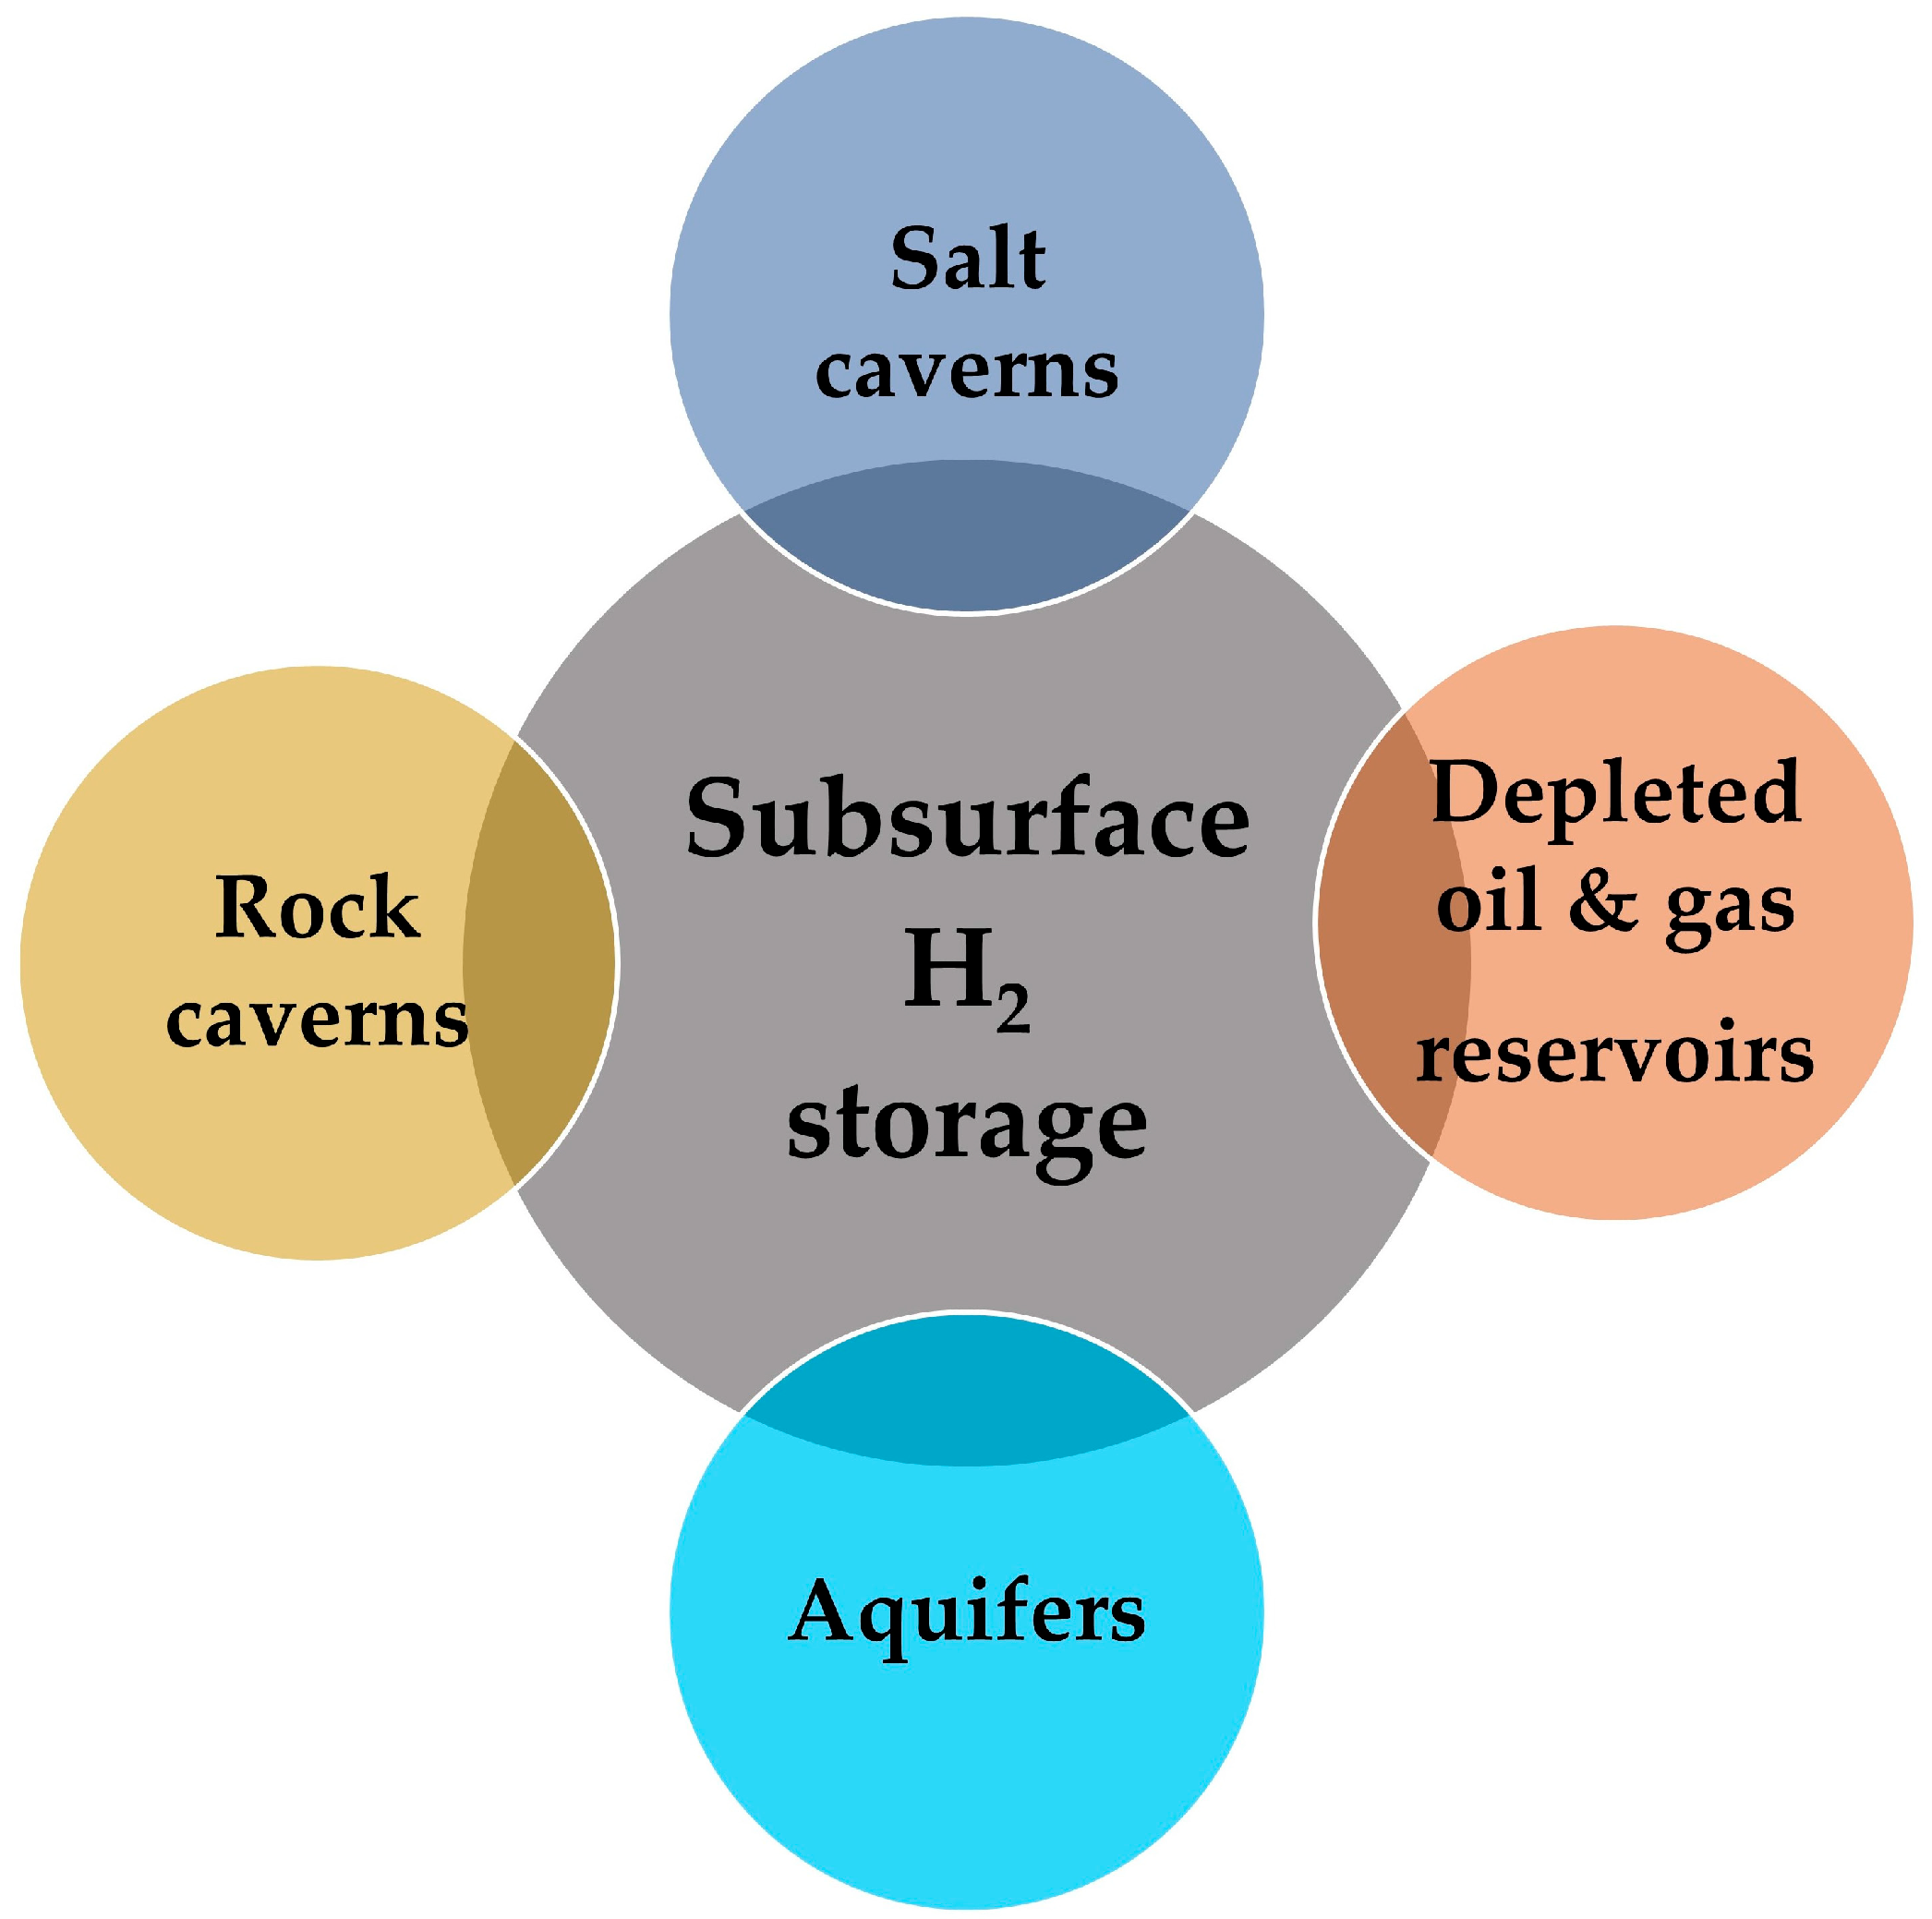
Figure 1. Geological hydrogen storage.
Hydrogen 05 00039 g001
Figure 2. Scalability of hydrogen storage in various confining media.
Hydrogen 05 00039 g002
Figure 3. Illustrating oil and gas reservoirs in the USA (image: modified from [23]).
Hydrogen 05 00039 g003
Figure 4. Proposed location.
Hydrogen 05 00039 g004
Figure 5. Gamma ray, total porosity, and volume of shale for Bakken formation.
Hydrogen 05 00039 g005
Figure 6. Gamma ray, total porosity, and volume of shale for three wells.
Hydrogen 05 00039 g006
Figure 7. Bulk Density and Neutron Porosity for Well24814.
Hydrogen 05 00039 g007
Figure 8. Schematic proposed wind–electrolyzer–underground storage system.
Hydrogen 05 00039 g008
Figure 9. Overview of the control system.
Hydrogen 05 00039 g009
Figure 10. Wind profile in Williston (collected from: North Dakota Agricultural Weather Network [51]).
Hydrogen 05 00039 g010
Figure 11. Storage capacity for Well W19693, W24814 and W26990.
Hydrogen 05 00039 g011
Figure 12. Porosity cross-plots for W24814.
Hydrogen 05 00039 g012
Figure 13. Porosity cross-plots for W26990.
Hydrogen 05 00039 g013
Figure 14. Porosity cross-plots for W19693.
Hydrogen 05 00039 g014
Figure 15. Hourly power output from the wind farm and hydrogen production.
Hydrogen 05 00039 g015
Figure 16. Annual wind speed, power generation, hydrogen production and power curtailment for W24814.
Hydrogen 05 00039 g016
Table 1. Worldwide active UHC Sites [17,20].
CountryField/Project NameH2 (%)Pressure ConditionsDepth (m)Volume (m3)Status
Depleted reservoir
ArgentinaDiadema1010 bar/50 °C600Not reportedOperating
AustriaUnderground Sun Storage1078 bar/40 °C1000Not reportedOperating
ArgentinaHychico10-600–800Not reportedOperating
RussiaYakshunovskoe field----Operating
Aquifers
Czech RepublicLobodice5090 bar/34 °C430Not reportedOperating
FranceBeynes50Not reported4503.3 × 10⁶Operating with natural gas
Salt Caverns
United KingdomTeesside9545 bar365210,000Operating
United StatesClemens9570–137 bar1000580,000Operating
Moss Bluff9560–100 bar1200566,000Operating
Spindletop9568–202 bar1340906,000Operating
GermanyKiel6050–100 bar133032,000Repurposed as natural gas storage
Bad Lauchstädt, Town gas--8006.7 × 10⁸Repurposed as natural gas storage
Kirchhellingen, Town gas--9002.4 × 10⁸Repurposed as natural gas storage
Hähnlein, Town gas--5001.6 × 10⁶Repurposed as natural gas storage
Table 2. Large-scale geological storage of hydrogen in the U.S. [24].
TypeStatusComments
Salt caverns3 active storage projects in Texas for industrial useLimited geographic distribution
Depleted oil and gas fieldsUntested for H2 storageWide geographic distribution
Saline aquifersUntested for H2 storageWide geographic distribution.
Suitability of sealing caprocks
Table 3. General UHS criterion for depleted hydrocarbon reservoirs [14,20].
CriteriaRequirement
Geology rock typeLarge sedimentary rocks, massive non-foliated metamorphic rocks, and intrusive igneous rocks
StructureIsotropic rocks: Rocks poorly falter, no discontinuities, fissured, deformations, homogenous, jointed, and folded; no significant tectonic
PorosityLow
Hydraulic conductivity<108 m/s for H2O
Depth70–200 m
PermeabilityLow
Lifecycle>30 years
Thermal stability4 to 80 °C
Table 4. Summary of recent literature on integrating wind and hydrogen storage in depleted gas fields.
Ref.LocationMethodsFindings
[34]Southern North Sea, UKWell characterization model
Chemical stability
Leakage assessment
The modeled scenario requires 4–5 GW of power for a six-month injection period, supplying 42% of a natural gas facility’s energy capacity and delivering around 100 GWh/day during a 120-day withdrawal period.
[35]Bohai Bay, ChinaMathematical model
Economy and environmental compatibility
Wind speed significantly impacts system NPV and LCOH, followed by H2 prices, with stratum static pressure having the least impact. Annual H2 production was estimated to be 2.6 × 10⁶ m3.
[36]Northern GermanyExperimental studies, reservoir simulationSalt caverns offer faster cycling capabilities, while depleted gas fields provide larger storage volumes suitable for seasonal energy storage from wind power.
[37]North Sea, UK-Large-scale storage is best suited to porous rock reservoirs. Estimated that 150 TWh of seasonal storage is required to replace seasonal variations in natural gas production.
[38]North California, USASite selection and screening
Top sited for H2 storage
Storage and recovery efficiency
Top-ten sites in Northern California have an estimated H2 storage capacity of 203.5 million tons, making them suitable for seasonal H2 from renewable energy electrolysis.
[39]Intermountain west region, USAHydrogen storage capacity
Site selection
Economic analysis
The study reveals that geologic hydrogen storage can provide 72% of the I-WEST region’s total energy consumption in 2020. The most cost-effective option is a depleted gas reservoir, with cushion gas type and volume significantly affecting storage costs.
[21]Southeast and Northeast BrazilSimulation for site identification
Layer approached
Depleted offshore gas fields in Brazil have the potential to store 5483 TWh of H2, which is equivalent to ten times Brazil’s annual electricity consumption.
[40]ItalyGeological assessment and classificationIdentified potential UHS sites, classified based on confidence levels. Existing underground gas stores offer high confidence for hydrogen storage.
[41]North Sea, NetherlandsTechno-economic analysis, geological assessmentDepleted gas fields could store up to 77 TWh of hydrogen, potentially balancing seasonal wind power fluctuations. Storage is technically feasible and economically viable under certain market conditions
[42]North Sea, UKGeochemical effects studyAssessed fluid-fluid and fluid-rock interactions during UHS, highlighting the need for detailed geochemical analysis
[43]North California, USAGeological and reservoir Assessment
H2 production analysis
H2 recovery efficiency evaluation
Northern California’s depleted gas fields can store 203.5 million tonnes of H2 from curtailed renewable energy, with 36% efficiency. Improved recovery and electrolyzer efficiency could enhance this.
[44]North and Northwest, PolandAssessment of the size of the pore space of the gas deposit.Estimates based on the proposed methodology indicate that the average H2 storage potential for the studied natural gas fields ranges from 0.01 to 42.4 TWh of the H2 energy equivalent
[45]Texas, USANumerical modeling, sensitivity analysisDepleted gas reservoirs in Texas could store significant amounts of wind-generated H2. Reservoir characteristics like porosity and permeability are crucial for determining storage capacity and efficiency.
Present workBakken Formation, USAMathematical modeling, SimulationMiddle Bakken can storage H2 54,000, 33,000, 22,000 tons and estimated energy of 1080, 660, and 440 GWh.
Table 6. Turbine specifications used in the case study [52].
ParametersValue
rated power1.5 MW
cut-in wind speed3.5 to 4 m/s
cut-out wind speed20 to 25 m/s
rotor diameter77 m
hub heights80 m
rated wind speed11.2 m/s
air density1.225 kg/m3
power coefficient0.4
Table 7. Parameters for electrolyzer.
ParametersValue
Energy used for electrolysis Eelec50 kWh/kg [53]
Water purification energy,
H2 losses and compression, Epcl
3 kWh/kg
Conversion efficiency ηconv90%
Plant size PH2plant13 MW
Stack lifetime12.5 years
Table 8. Reservoir parameters for three wells [54].
Well
Middle Bakken
Top (ft)Bottom (ft)Gross (ft)Net (ft)Net to GrossAverage Porosity (%)
W2481410,603.310,655.0651.759.50.1842.7
W1969310,602.6310,646.1843.5550.1152.0
W2699010,342.710,378.2235.521.50.0421.6
Table 9. Pore Volume Per Acre and storativity for three wells.
Well (Middle Bakken)Pore Volume Per Acre (ft)Storativity Cum. Por-Th (ft)
W2481460,864.21329.04
W1969337,938.15252.29
W2699024,756.02237.09
Table 10. Pore volume and store capacity for the selected Middle Bakken wells.
Middle Bakken FormationPore Volume (106 m3)H2 Capacity (106 Tonnes)
LowMidHighLowMidHigh
W2481471.55079.28087.4060.0480.0540.059
W1969344.60249.42154.4860.0300.0330.037
W2699029.10332.24735.5520.0200.0220.24
Table 11. Seasonal wind and H2 production.
SeasonWind Power
(GWh)
Hydrogen Production (kg)Reservoirs Storage in Days
W24814W19693W26990
Winter (December 1 to February 28)73.86106,350508310207
Spring (March 1 to May 31)98.63138,590390239159
Summer (June 1 to August 31)40.558,980916560373
Fall (September 1 to Novemebr 31)57.3382,449655401267
Disclaimer/Publisher’s Note: The statements, opinions and data contained in all publications are solely those of the individual author(s) and contributor(s) and not of MDPI and/or the editor(s). MDPI and/or the editor(s) disclaim responsibility for any injury to people or property resulting from any ideas, methods, instructions or products referred to in the content.