Abstract
This contribution presents the results of continued investigations on the production of hydrogen by means of pyrolysis in a liquid metal bubble column reactor, as developed at the Karlsruhe Institute of Technology in recent years. Part I of this contribution described the motivation and the methodology of this study, as well as a significant scale-up, and discussed its results for pure methane pyrolysis. Here in part II, two additional experimental campaigns with methane–ethane mixtures (MEMs) and high-calorific natural gas (nGH) will be presented and discussed for the first time, using the up-scaled liquid metal bubble column reactor. It could be proven that an MEM as the feed gas led to an increase in methane conversion at low temperatures, which is consistent with the literature data. The nGH pyrolysis confirms this trend and also results in a significant rise in methane conversion compared to pure methane pyrolysis. Furthermore, the nGH pyrolysis leads to an increased methane conversion even at higher temperatures compared to MEM pyrolysis. Additionally, both MEM and nGH pyrolysis also showed a shift in the formation of by-products toward lower temperatures.
1. Introduction
Methane pyrolysis is a well-known process to which many publications refer [1]. However, recent publications deal mostly with pure methane pyrolysis in tubular, molten salt, fluidized bed or plasma reactors [2]. A liquid metal bubble column reactor was used in this publication. The focus is on the pyrolysis not only of methane but also of methane–ethane mixtures (MEMs) and natural gas. Proof of concept studies of the bubble column reactor concept with liquid tin have already been successfully performed by Plevan and Geißler and colleagues [3,4,5,6,7]. The reactor developed (reactor type [RT] 1) was scaled-up to a volume of 6 L and the authors investigated the reachable methane conversion compared to the 1.6 L reactor. That study and the methodology were described in part one of this publication. As the impact of the scale-up on methane conversion of pure methane (PM) pyrolysis was negligible, the following step for industrial applications was the pyrolysis of pipeline gas (high-calorific natural gas: nGH [8]) instead of PM. The most abundant minor components of European nGH pipeline gas are generally CmHn hydrocarbons (m = 2 or 3) [9], with dominant proportions of ethane (C2H6) [10]. Therefore, as a step towards natural gas pyrolysis, the influence of ethane admixtures to methane on pyrolysis was investigated, using the up-scaled liquid tin bubble column reactor technology for the first time. In the next step of this investigation, an nGH sample was pyrolyzed for the first-time and the product gas composition, methane conversion and hydrogen yields were compared to the data from the PM and MEM pyrolysis.
2. Experimental Results and Discussion
The reactors, measurement techniques and evaluation approaches used were described in detail in the first part of this publication.
2.1. Methane–Ethane Mixture Pyrolysis
Three MEMs were pyrolyzed using RT 2 with ethane molar fractions of 1, 5 and 10% in the feed gas composition, which led to higher methane conversion at about 1223 and 1273 K (Figure 1) compared to PM pyrolysis.
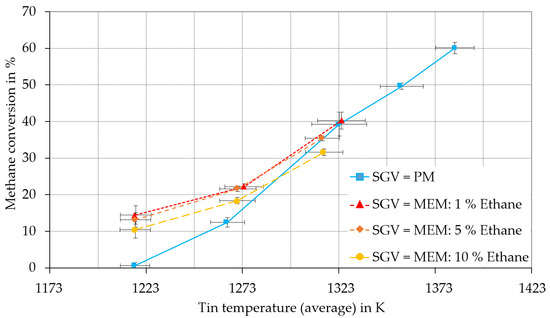
Figure 1.
Comparison of the methane conversion of a pure methane (PM) feed (blue) with a methane–ethane mixture (MEM) feed containing 1% (red), 5% (orange) and 0% (yellow) ethane in reactor type (RT) 2 with a superficial gas velocity (SGV) of 1.9 mm/s. The methane conversions were calculated using the system of equations for PM and MEM developed in part I of this publication.
The methane conversion increasing effect seemed to vanish at about 1323 K. This tendency could be seen at every superficial gas velocity (SGV) adjusted (also at 1.1 and 1.5 mm/s). In order to explain this behavior, the methane and ethane pyrolysis mechanisms had to be examined in detail: Moldoveanu [11] considered the formation of a methyl radical by splitting off one hydrogen radical to be the first reaction step of methane pyrolysis as given in Equation (1). The first reaction step of the ethane pyrolysis is also assumed to be the building of methyl radicals, but, unlike methane pyrolysis, the C-C bond is split [11], as shown in Equation (2). Additionally, ethyl and hydrogen radicals are formed as a side reaction (3).
CH4 → CH3* + H*
C2H6 → 2 × CH3*
C2H6 → C2H5* + H*
Thus, the main initial reaction step for both methane and ethane pyrolysis is to build methyl radicals. The activation energy of the first step of methane pyrolysis (1), with 450 kJ/mol [11], was found to be higher than that of the first step of ethane pyrolysis (2), with 372 kJ/mol [11], and its side step (3), with about 425 kJ/mol [11]. This indicates that methane should be more stable when undergoing thermal treatment than ethane [12].
Therefore, ethane should generate more radicals than the substituted amount of methane at the same temperature in gas mixtures. This higher concentration of mainly methyl radicals (and other radicals due to the ethane pyrolysis, as described by Khan and Crynes [11]) activates the methane pyrolysis since methyl radicals are involved in the other complex reaction network of methane pyrolysis. The methane conversion enhancing effect observed by adding ethane into the methane feed gas is in line with the findings of Keramiotis et al. [13] and Ogihara et al. [12] who investigated this effect in their experiments. Ogihara et al. [12] studied the pyrolysis of mixtures of CH4 and C2H6 between 973 and 1073 K, using a quartz tube reactor. The methane–ethane mixtures they pyrolyzed had ethane molar fractions of 50, 25 and 17%. They were compared to PM pyrolysis and argon–ethane mixtures with the same amounts of ethane as in the methane–ethane mixtures. They found that the pure CH4 pyrolysis did not proceed, even with the highest temperature and the lowest volume flow rate of 10 mL/min used in their study. By adding ethane to the methane feed, they observed that CH4 became part of the ethane pyrolysis reaction network. Keramiotis et al. The authors of [13] investigated the impact of 1% of ethane in a nitrogen–methane mixture (9% methane, 90% nitrogen) on methane conversion, compared to a nitrogen–methane mixture of 10% methane and 90% nitrogen. These investigations were carried out using a flow reactor between 1250 and 1500 K with a residence time of . The experiment carried out by Keramiotis et al. [13] showed that the methane conversion of nitrogen–methane–ethane mixtures at 1323 K reaches almost 50%, whereas the methane conversion of the nitrogen–methane mixture reached about 25%. They also reported a reduction of the methane conversion increasing effect at higher temperatures, which fits the results of the MEM experiments in this study well (Figure 1): the methane conversion enhancing trend vanished at a temperature of about 1323 K. The explanation given by Keramiotis et al. [13] for the reduction of the conversion increasing effect was that the thermal decomposition of the ethane to methyl radicals (2) at high temperatures becomes faster than the decomposition of ethane to ethyl and hydrogen radicals (3). As the hydrogen radical shows a much higher accelerating impact on methane conversion than the ethyl radical, the methane conversion increasing effect diminishes at high temperatures [13]. Additionally, Olsvik et al. [14] and Khan and Crynes [15] found hydrogen (H2) inhibits pyrolysis reactions in general, which might also have resulted in a reduction of the methane conversion increasing effect of feed ethane. They observed that the impact of hydrogen inhibition becomes more important at higher hydrogen dilution and, thus, at higher methane conversions obtained at higher temperatures. The experiments of Olsvik et al. [14], using a tubular flow reactor between 1473 and 1773 K with residence times < 1 s, led to the outcome that hydrogen dilutions of the feed (H2:CH4 = 2:1 and 4:1) with a residence time of 0.05 s at 1573 K resulted in the lowest CH4 conversions. The effect of hydrogen inhibition increases with increasing residence time and temperature. The calculations with the model they developed indicated that the concentration of methyl and hydrogen radicals decreased with the increasing hydrogen mole fraction by reversing the reaction (1) of methane pyrolysis [14]. In the case of the bubble column experiments, despite the high hydrogen molar fractions achieved in the product gas (Figure 2), the ethane pyrolysis still showed high ethane conversions (Figure 3) but the hydrogen and methyl radical concentrations probably decreased. When the radical concentrations fell below a critical concentration to accelerate the methane pyrolysis, the conversion increasing effect was properly diminished. Furthermore, the hydrogen radical was estimated to be about a factor of 100 more reactive than the methyl radical [14]. Applied to the MEM pyrolysis of this study, the inhibition effect of the hydrogen formed in reaction (1) influenced the methane pyrolysis with the same intensity as the methyl radical concentration increase of the pyrolysis of ethane (2). Thus, the inhibition and acceleration effects balanced each other.
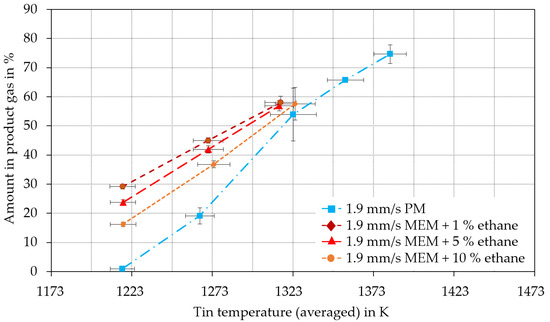
Figure 2.
Comparison of hydrogen molar fractions in the product gas from PM feed (blue), with feed MEMs containing 1% (dark red), 5% (red) and 10% (yellow) ethane in an RT2 with an SGV of 1.9 mm/s. The pyrolyzed MEM feeds contained 1, 5 and 10% of ethane.
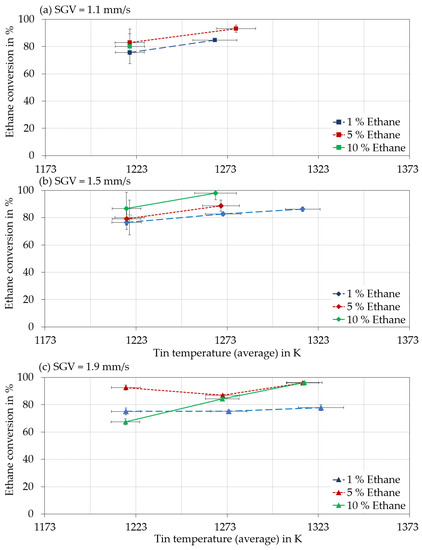
Figure 3.
Temperature-dependent ethane conversions in the RT2 for ethane feed molar fractions of 1% (blue), 5% (red) and 10% (green) with SGVs of (a) 1.1 mm/s, (b) 1.5 mm/s and (c) 1.9 mm/s. Calculated using systems of equations. The methane conversions were calculated using the system of equations for MEMs developed in part I of this publication.
Khan and Crynes [15] conducted a literature review on methane pyrolysis in tube reactors. They discovered that the importance of hydrogen inhibition, observed in several non-shock tube reactor studies between 1373 and 2473 K, increases with higher hydrogen contents. Thus, the inhibiting effect should occur at high conversions of methane. In the present study, higher hydrogen molar fractions were gained at lower temperatures due to the ethane content (Figure 2), therefore, the hydrogen inhibition on methane pyrolysis probably becomes more important at lower temperatures in MEM pyrolysis than in the PM pyrolysis investigated [14,15].
The MEM pyrolysis led to a hydrogen molar fraction at 1323 K between 50 and 62%, as shown in Figure 2. The hydrogen content in the product gas increases with increasing ethane content. Since one ethane molecule contains six hydrogen atoms but methane four, the hydrogen content in the product gas naturally increases if methane is enriched with an increasing amount of ethane, particularly due to the high conversion of ethane compared to methane at the same temperature.
The differences between the hydrogen molar fractions in the product gases of MEM and PM pyrolysis decreased with increasing temperature. The PM pyrolysis generated about 50% hydrogen in the product gas composition at about 1323 K, which was in the range of the hydrogen molar fraction of all MEMs reached at this temperature. According to the calculations of Guéret et al. [16] and the literature reviews of Khan and Crynes [15] and Olsvik et al. [14], hydrogen inhibition is likely to occur for hydrogen concentrations about 50% and above. Thus, the methane conversion increasing effect seems to disappear at about 1323 K in the MEM pyrolysis. High ethane conversions were confirmed in this study and were apparently not or only negligibly affected by inhibition effects at all temperatures (Figure 3).
High ethane conversions were achieved even at moderate temperatures, confirming the experiments and calculations of Moldoveanu [11], Ogihara [12] and Xu [17]. The conversion of ethane reaches values greater than 64% at all the driven temperatures and SGVs reported here. The ethane conversion values may be distorted by the formation of ethane [16] as a by-product during the methane pyrolysis, as determined for PM pyrolysis in this study. The ethane conversion for all SGVs was higher for or similar to 5% ethane in the feed than for 1%. The ethane conversion of MEM pyrolysis for SGVs of 1.1 and 1.5 mm/s at about 1223 K seemed to be lower compared to higher temperatures at constant SGVs and ethane feed molar fractions.
In this study, a selectivity of 100% was presumed for Equation (4) for the ethane pyrolysis, hence the hydrogen yield of ethane pyrolysis corresponds to the ethane conversion .
This presumption could not be made for the methane conversion in PM pyrolysis. The by-products ethane (C2H6), ethene (C2H4) and ethyne (C2H2) were assumed to be formed in the PM pyrolysis. Only the formation of ethene (C2H4) and ethyne (C2H2) were considered for the MEM pyrolysis. Ethane in the product gas detected by the gas chromatograph was assumed to stem only from the feed ethane. The hydrogen yields of methane in the PM pyrolysis compared to the MEM pyrolysis showed the same trends as the methane conversion at every SGV (1.1 to 1.9 mm/s). The example of an SGV of 1.9 mm/s is shown in Figure 4.
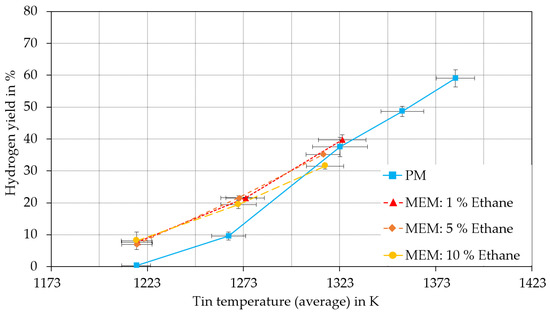
Figure 4.
Comparison of methane to hydrogen yield of a PM feed (blue), with MEM feed containing 1% (red), 5% (brown) and 10% ethane (orange) in RT2 with an SGV of 1.9 mm/s. Calculated using systems of equations for PM and MEM developed in part I of this publication.
As mentioned in part I of this publication, the formation of ethane (C2H6) due to methane pyrolysis was not taken into account for the calculation of the ethane conversion, but the ethane detected by gas chromatograph analysis was defined as residual feed ethane. However, the pyrolysis of PM resulted in the synthesis of ethane and ethene. Both gases could be determined with temperature-dependent molar fractions for PM and MEM pyrolysis (Figure 5).
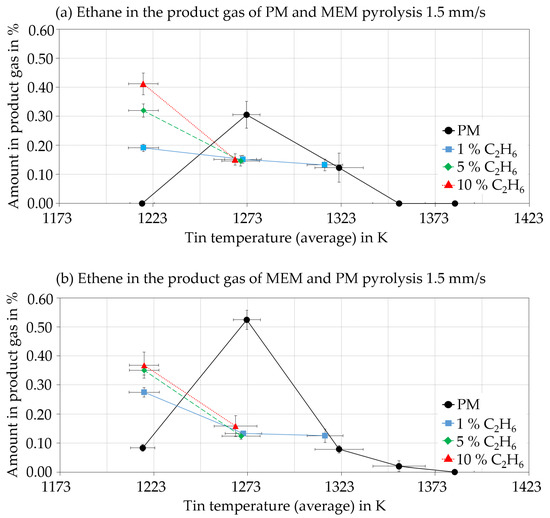
Figure 5.
Temperature dependences of the molar fractions in the product gas of PM (black) and MEM (1% C2H6 blue, 5% C2H6 green and 10% C2H6 red) pyrolysis: (a) ethane in the product gas and (b) ethene in the product gas. SGV = 1.5 mm/s. All trends shown in Figure 5 were similar at every SGV in the range of existing data points.
Figure 5a,b show that no detectable amounts of ethane but low amounts of ethene were found in the product gas during PM pyrolysis at 1223 K. Significant amounts of ethene and ethane were formed due to PM pyrolysis above 1223 K, with a peak concentration of both ethane and ethene at about 1273 K. Above 1273 K, the amounts of ethane and ethene decreased with increasing temperature, reaching zero at 1380 K. On the other hand, the concentration peaks of PM disappeared in the MEM pyrolysis at every SGV and every ethane feed fraction. However, the proportions of ethane in the MEM pyrolysis product gas increased significantly below the temperature of the ethane peak of the PM pyrolysis. This indicates that the ethane peak may have shifted to lower temperatures or that the temperature-dependent ethane conversion may have decreased. The proportions of ethene in the product gas of the MEM pyrolysis showed the same increasing behavior with decreasing temperature.
Guéret et al. [16] modelled a reaction network for methane pyrolysis and predicted a peak in the ethene mole fraction in the product gas between 1373 and 1473 K, and for ethane between 973 and 1073 K at the thermodynamic equilibrium. Therefore, the tendency of temperature-dependent maxima in by-product molar fractions could be confirmed with the present experiments of this study. The temperature differences between the peak molar fractions predicted and the values measured in this study could be caused by the calculation of Guéret et al. [16], which was based on the thermodynamic equilibrium and idealized by taking only 14 species into account. By contrast, several thousand reactions and species were candidates to affect methane pyrolysis [18,19]. The reactor type might also have an effect on the product gas composition, as Abbas and Daud [1] reported. Ethyne, which should occur with higher molar fractions than ethane above 973 K and at higher molar fractions than ethene above 1373 K, calculated by Guéret et al. [16], could not be determined in any product gas analysis of this study. Keramiotis et al. [13] found that the ethyne mole fraction in the product gas predicted from their calculation models was fundamentally overestimated at above 1325 K. Nevertheless, they were able to detect ethyne concentrations of about 0.25 mole% in their experiments.
In contrast to the simplified reaction mechanism used by Guéret et al. [16], Uhlenbruck et al. [20] considered 10,000 reactions and 333 reaction species based on a reaction mechanism from the literature [21,22,23,24]. This model of a liquid metal bubble column reactor accounts for the residence time distribution of the gas bubbles in the liquid metal and the residence time distribution of the gas in the head room of the reactor. The ethane and ethene molar fractions modelled at the reactor outlet are in good agreement with the molar fraction peaks of ethane and ethene in this study. Furthermore, their model predicts an ethyne molar fraction of less than 0.1%, which is below the limit of detection of the gas chromatograph used in this study and, thus, also matches the experimental findings presented here. Ogihara et al. [12] predicted an ethene peak molar fraction in the pyrolysis of MEMs at a temperature range between 1020 and 1100 K. They used a mixture of ethane and argon for ethane pyrolysis, and estimated the ethene peak molar fraction at 1025 K. These values led to the consideration of shifted by-product molar fraction peaks caused by ethane addition to the feed gas compared to the PM in the present work.
As mentioned above, the increasing molar fraction of ethane with decreasing pyrolysis temperatures, found in the product gas of MEM pyrolysis, could be interpreted to derive from ethane production as one of the first reaction steps of methane pyrolysis, as reported by Moldoveanu [25], Arutyunov et al. [26] and others [4,13,14,15,19,20]. Another possible explanation is a lower ethane conversion compared to higher temperatures due to the drop in reaction rates at lower temperatures. If the lower reaction temperature led to lower ethane conversions, the ethane content of the product gas should increase by increasing the molar fraction of the ethane feed. However, as can be seen in Figure 5b and Figure 6a, this correlation has been proven at 1220 K.
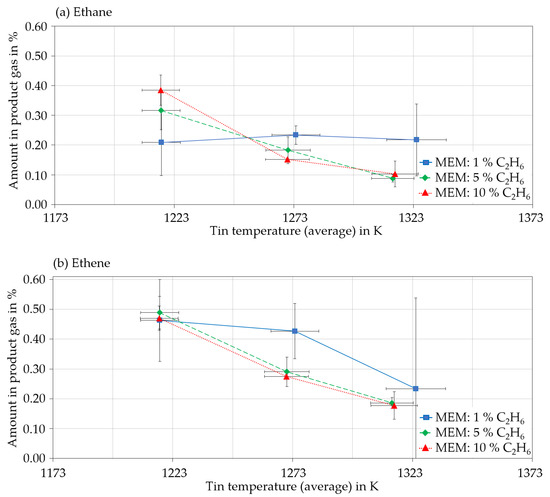
Figure 6.
Temperature dependences of the molar fractions in the product gas of MEM pyrolysis for (a) ethane and (b) ethene, for different feed ethane molar fractions (1% C2H6 blue, 5% C2H6 green and 10% C2H6 red) at an SGV of 1.9 mm/s.
The differences in ethane molar fractions in the product gas at all other pyrolysis temperatures did not systematically correlate with the ethane molar fraction in the feed. Ethene (Figure 6b), on the other hand, was formed as an intermediate and by-product in both PM and MEM pyrolysis [11,12]. The ethene molar fraction was also found to be independent of the ethane feed molar fraction within the measurement accuracy.
2.2. Natural Gas Pyrolysis
A commercially available nGH, whose composition is given in Table 1, was used for the studies with nGH.

Table 1.
Determined composition of the high-calorific natural gas (nGH) sample used. Analyzed in compliance with DIN EN ISO 6975 (gas chromatographic data). This Analysis was carried out by DVGW (German Association for Gas and Water at the Engler-Bunte-Institute of KIT): Report 21-01501-PB01.
As the most abundant minor species of nGH is ethane (Table 1), the pyrolysis of nGH was expected to lead to higher methane conversions compared to PM pyrolysis [12], as MEM pyrolysis did. This was successfully confirmed for each SGV (Figure 7).
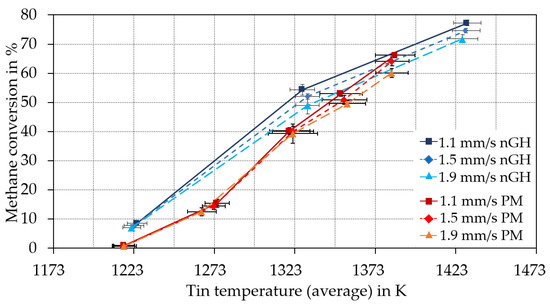
Figure 7.
Comparison of the methane conversion of the PM pyrolysis (red and orange) carried out in RT2 to the pyrolysis of the high-calorific natural gas (nGH) (blue) carried out in RT3. Calculated using the systems of equations for PM and MEM developed in part I of this publication.
The methane conversion of nGH pyrolysis was increased at every temperature conducted below 1373 K, compared to the PM pyrolysis. Furthermore, the methane conversion of nGH pyrolysis at approximately 1323 and 1423 K seemed to be SGV-dependent. Increased SGVs led to decreased methane conversions. The hydrogen yields of nGH and PM pyrolysis compared to each other showed the same temperature and SGV-dependent behavior (Figure 8).
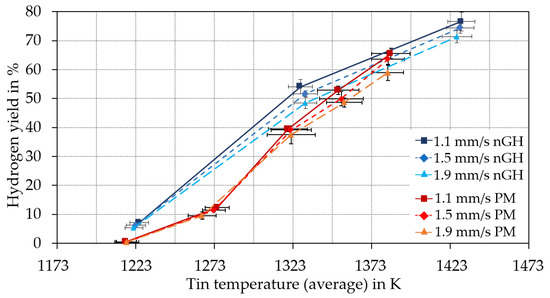
Figure 8.
Temperature-dependent hydrogen yield for temperature experiments of the PM pyrolysis (red and orange) carried out in RT2 compared to the pyrolysis of nGH (blue) carried out in RT3. Calculated using the systems of equations for PM and MEM developed in part I of this publication.
In an attempt to determine whether the differences in conversion were due to the ethane content, the methane conversions of the nGH pyrolysis were compared with those of the MEM pyrolysis for 1 and 5% ethane ratios in the educt gas and the PM pyrolysis (Figure 9).
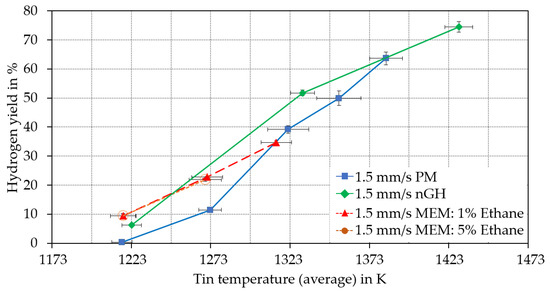
Figure 9.
Comparison of the hydrogen yield of the pyrolysis of PM (blue) and MEM (red) using RT2 to the pyrolysis of nGH (green) using RT3. Calculated using the systems of equations for PM and MEM developed in part I of this publication.
Whereas the enhanced methane conversions of MEM fell compared to the methane conversion of PM pyrolysis at about 1323 K, for nGH, this effect was only investigated at about 1383 K. As a result, the increase in the methane conversion in nGH pyrolysis was comparable to that of the MEM pyrolysis in the lower temperature range investigated (≤1273 K). The increase in the conversion of methane in the nGH pyrolysis remained up to 1323 K (Table 2) compared to the PM pyrolysis.
Table 2.
Absolute increase in average methane conversion during the nGH pyrolysis compared to average methane conversions from the PM pyrolysis. Calculated using the systems of equations for PM and MEM developed in part I of the publication.
As shown in Figure 1, it could be verified due to MEM pyrolysis that ethane in the feed gas increased the conversion of the methane. Certainly, the ethane addition into the methane feed led only to higher methane conversions below 1323 K. Near to this temperature, no conversion enhancing effect could be determined in the MEM pyrolysis. As outlined above, commencing hydrogen inhibition could have caused the diminishing of the methane conversion increasing effect in the MEM pyrolysis. However, this inhibition effect was observed in the nGH pyrolysis as well, but at higher temperatures of about 1383 K. Consequently, the ethane content in the nGH feed could not have been the only factor increasing the methane conversion. The nGH used contains several other hydrocarbons (Table 1), which are likely to have also had an effect on the methane conversion. Greensfelder et al. [27] found that the overall rate constant of n-paraffin (CnH2n+2) pyrolysis increases by a higher C-Number. Safarik et al. [28] compared the Arrhenius parameters for the thermal decomposition reactions of n-alkanes with C-numbers above 4. They concluded that the overall decomposition of the educts generally follows first-order kinetics and the rate constants measured increase with increasing molecular size [28]. Therefore, at the same temperature and residence time, the conversion should increase with the increasing C-number (Table 3).
Table 3.
Initial steps of alkane pyrolysis. Radical species were marked (*).
The activation energy for the initial steps of the additional components of nGH was even lower than that of the initial step of ethane pyrolysis, as summarized in Table 3. Compared to ethane, even lower activation energies are needed to activate the radical reaction network with higher hydrocarbons. Therefore, these higher hydrocarbons are suspected of causing the increase in the methane conversion of the nGH pyrolysis even at higher temperatures, as they further increase the concentration of radicals that counteract the hydrogen inhibition.
The ethane conversion in the MEM and nGH pyrolysis showed comparable values, as presented in Figure 10. The ethane conversion of nGH was expected to show values between the MEM experiments containing 1 and 5% of ethane in the feed gas. This expectation was met at about 1223 K (Figure 10). The expectation was also met at about 1323 K with interpolated ethane conversion values of 1 and 5% MEM pyrolysis.
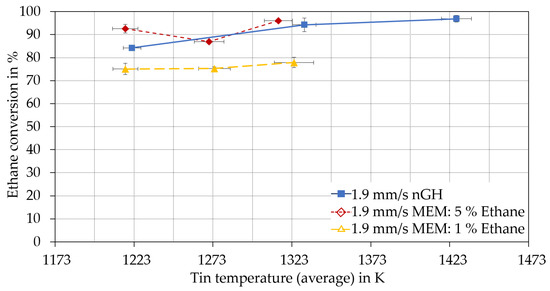
Figure 10.
Comparison of the ethane conversion of the MEM pyrolysis in the RT2 to the pyrolysis of nGH in RT3. Calculated using the system of equations for MEM developed in part I of this publication.
The highest ethane conversion of nGH pyrolysis for an SGV of 1.9 mm/s was determined at about 1423 K with a value of 97 ± 2% (about 100% for all other SGVs). While ethyne could still not be detected in the product gas of the nGH pyrolysis, the maximum concentrations of both ethane and ethene were determined at 1223 K (Figure 11).
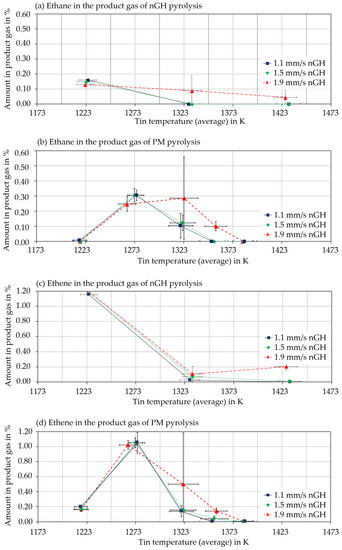
Figure 11.
Comparison of the molar fraction of ethane in the product gas of (a) nGH and (b) PM pyrolysis and of ethene in the product gas of (c) nGH and (d) PM pyrolysis. Calculated using the systems of equations for PM and MEM developed in part I of this publication.
Since the temperature of the peak in the molar fractions of ethane and ethene of the PM pyrolysis (Figure 11b,c, about 1273 K) was not included in the nGH pyrolysis experimental campaign (Figure 11a,b), a definite conclusion about the peak shift of molar fractions was not appropriate. Nevertheless, at 1323 K, the ethane molar fraction in the product gases of the nGH pyrolysis was significantly lower than that of the PM pyrolysis. The same conclusion applies to 1323 K for SGVs of 1.1 and 1.5 mm/s (for reference, a poor reproducibility was obtained at 1323 K with 1.9 mm/s).
In the case of the ethene molar fraction of the product gas, a molar fraction peak between 1223 and 1323 K seems to be unlikely. The methane and the ethane conversion of the nGH pyrolysis show a similar behavior to the MEM pyrolysis (Figure 12). Furthermore, if an additional molar fraction peak of ethene were to form at 1232 K, it would have to be above 1.2 mol%, which is already the highest value determined for any by-product concentration in the present pyrolysis study. Additionally, the decrease in the molar fraction of ethene in the product gas from 1273 to 1323 K would have to be sharper than any other temperature-dependent reduction in the molar fraction found in the present experiment.
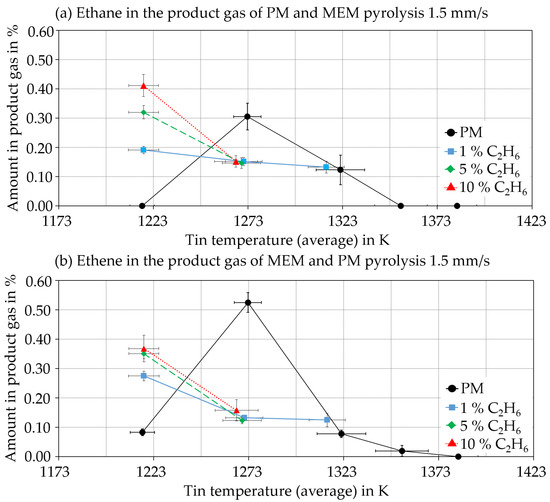
Figure 12.
Comparison of by-product molar fractions of (a) ethane and (b) ethene in the product gas of PM, MEM and nGH pyrolysis at an SGV of 1.5 mm/s. Calculated using the systems of equations for PM and MEM developed in part I of this publication.
Contrary to the decrease in the maximum ethane molar fraction, the ethene molar fraction of the product gas from the nGH pyrolysis obtained at 1223 K had increased by a factor of two compared to the ethene molar fraction of the MEM pyrolysis product gas (Figure 12).
A possible explanation for the higher molar fraction of ethene in the product gas during the nGH pyrolysis at 1223 K is the enhanced ethene formation during the pyrolysis of higher hydrocarbons, which has been described several times in the literature [11,28,30].
All pyrolysis experiments which were conducted showed a common feature: only minimal amounts of C2H4 and C2H6 could be detected from 1323 K and above. However, in detail, the comparison between the PM, MEM and nGH pyrolysis shows differences. The product gas molar fractions of ethane of the MEM pyrolysis (containing 1 and 5% ethane in the feed) and the nGH pyrolysis were below 0.4% and did not show any substantial peak in the molar fraction, but were, in both cases, significantly higher than in the PM pyrolysis at 1223 K. The ethene molar fractions in the product gas of the nGH and MEM pyrolysis at 1223 K were also higher than in the product gas of the PM pyrolysis. On the other hand, the ethene molar fraction in the product gas of the nGH pyrolysis at 1223 K was even higher than in the MEM pyrolysis (Figure 12b). The pyrolysis mechanism of propane and n/iso-butane (as these higher alkanes were present in nGH as well) were found from Moldoveanu [11] to generate ethene as a by-product of the high molar fraction. Thus, the higher ethene molar fraction found in the product gas of the nGH pyrolysis compared to the MEM pyrolysis was expected in principle.
The increased methane conversion naturally increased the hydrogen content in the product gas composition. Therefore, an increased hydrogen content in the product gas was also found (Figure 13) in the temperature range of the increased methane conversion due to the ethane content of the MEM pyrolysis (Figure 1).
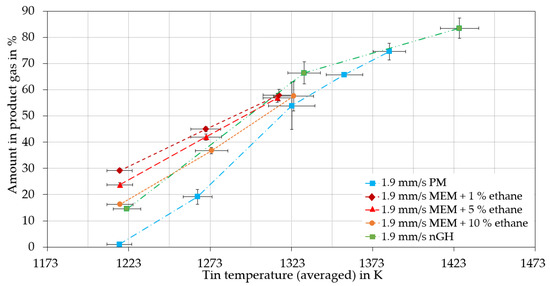
Figure 13.
Hydrogen molar fraction in the product gas from the PM, nGH and MPM pyrolysis at an SGV of 1.9 mm/s.
The hydrogen content was additionally increased by the ethane pyrolysis with conversions between 67 and 98%. The MEM pyrolysis still showed a slightly higher hydrogen value in the product gas at 1323 K, where the methane conversion was equal to the PM pyrolysis. This was caused by the ethane pyrolysis and became more significant with increasing ethane feed content. The hydrogen content in the nGH pyrolysis was also significantly improved compared to PM and as expected from the increased methane conversion rates (Figure 7) and hydrogen yields (Figure 4). On the other hand, the hydrogen content of the product gas of the nGH pyrolysis at 1223 K was lower than that of the MEM pyrolysis, which was presumably an effect of the greater formation of ethene in the nGH pyrolysis at this temperature compared to the MEM pyrolysis.
3. Conclusions
Using the enlarged reactor and the evaluation methodology developed and described in part I of this publication, decisive statements could be made about the MEM and nGH pyrolysis: Ethane in the feed gas led to increased methane conversion and hydrogen yield below a tin temperature of 1323 K. Since ethane was the most abundant minor component of nGH, this pyrolysis resulted in an increased methane conversion compared to that of PM, as expected in accordance with the literature and proven by the pyrolysis experiments of MEM in this study. The methane conversion increasing effect of the nGH pyrolysis, however, still occurred at temperatures up to 1350 K. Therefore, the ethane content in nGH does not fully account for the conversion increases observed in pyrolysis. The small amounts of higher hydrocarbons in the feed mixture of nGH are considered to affect methane conversion as well and may contribute to the increased methane conversion up to 1350 K. Furthermore, it was shown that the use of nGH significantly increases the ethene formation as a by-product at lower temperatures compared to PM and MEM. The hydrogen content of the product gas was significantly increased by both MEM and nGH compared to PM pyrolysis at low temperatures. The hydrogen content in the product gas of MEM and nGH pyrolysis at about 1323 K and above converges to the PM pyrolysis. It follows from the experimental campaigns presented in this study that the liquid metal bubble column technology is not only capable of pyrolyzing nGH, but the pyrolysis of nGH leads to an increased methane conversion and hydrogen yield at lower temperatures.
Author Contributions
Conceptualization, C.M.H., L.S. and T.W.; methodology, C.M.H.; Investigation, C.M.H.; Resources, R.K.; Data curation, C.M.H.; Writing—original draft preparation, C.M.H.; Writing—review and editing, B.D., I.D.V., L.S., N.U. and T.W.; Supervision, L.S. and T.W.; Project administration, L.S., T.W.; Funding acquisition, T.W. All authors have read and agreed to the published version of the manuscript.
Funding
This research was funded by Wintershall DEA. The APC was funded by KIT-Publication Fund of the Karlsruhe Institute of Technology.
Data Availability Statement
Not applicable.
Acknowledgments
The authors sincerely thank Wintershall Dea for the cooperation, exchange of ideas and the financial support.
Conflicts of Interest
The authors declare no conflict of interest.
Abbreviations
| RT 1/2/3 | Reactor type 1/2/3 |
| PM | Pure methane |
| MEM | Methane–ethane mixture |
| nGH | High-calorific natural gas |
| SGV | Superficial gas velocity |
References
- Abbas, H.F.; Wan Daud, W.M.A. Hydrogen production by methane decomposition: A review. Int. J. Hydrogen Energy 2010, 35, 1160–1190. [Google Scholar] [CrossRef]
- Schneider, S.; Bajohr, S.; Graf, F.; Kolb, T. State of the Art of Hydrogen Production via Pyrolysis of Natural Gas. ChemBioEng Rev. 2020, 7, 150–158. [Google Scholar] [CrossRef]
- Geißler, T.; Plevan, M.; Abánades, A.; Heinzel, A.; Mehravaran, K.; Rathnam, R.K.; Rubbia, C.; Salmieri, D.; Stoppel, L.; Stückrad, S.; et al. Experimental investigation and thermo-chemical modeling of methane pyrolysis in a liquid metal bubble column reactor with a packed bed. Int. J. Hydrogen Energy 2015, 40, 14134–14146. Available online: https://www.sciencedirect.com/science/article/pii/S0360319915022491 (accessed on 1 December 2022). [CrossRef]
- Geißler, T.; Abánades, A.; Heinzel, A.; Mehravaran, K.; Müller, G.; Rathnam, R.; Rubbia, C.; Salmieri, D.; Stoppel, L.; Stückrad, S.; et al. Hydrogen production via methane pyrolysis in a liquid metal bubble column reactor with a packed bed. Chem. Eng. J. 2016, 299, 192–200. Available online: https://www.sciencedirect.com/science/article/pii/S1385894716305162 (accessed on 1 December 2022). [CrossRef]
- Abánades, A.; Rathnam, R.K.; Geißler, T.; Heinzel, A.; Mehravaran, K.; Müller, G.; Plevan, M.; Rubbia, C.; Salmieri, D.; Stoppel, L.; et al. Development of methane decarbonisation based on liquid metal technology for CO2-free production of hydrogen. Int. J. Hydrogen Energy 2016, 41, 8159–8167. [Google Scholar] [CrossRef]
- Geißler, T.G. Methanpyrolyse in Einem Flüssigmetall-Blasensäulenreaktor; Verlag Dr. Hut: Munich, Germany, 2017. [Google Scholar]
- Plevan, M. Entwicklung Eines Verfahrens zur Thermischen Zerlegung von Methan zu Wasserstoff und Kohlenstoff unter Nutzung Flüssiger Metalle als Wärmeübertragungsmedium. Ph.D. Dissertation, Karlsruher Institut für Technologie (KIT), Karlsruhe, Germany, 2017. [Google Scholar]
- Altfeld, K.; Schley, P. Development of natural gas qualities in Europe; Entwicklung der Erdgasbeschaffenheiten in Europa. Gaswaerme Int. 2012, 61, 57–63. [Google Scholar]
- Ko, Y.-C.; Lin, T.-H. Emissions and efficiency of a domestic gas stove burning natural gases with various compositions. Energy Convers. Manag. 2003, 44, 3001–3014. [Google Scholar] [CrossRef]
- Dörr, H.; Koturbash, T.; Kutcherov, V. Review of impacts of gas qualities with regard to quality determination and energy metering of natural gas. Meas. Sci. Technol. 2019, 30, 22001. [Google Scholar] [CrossRef]
- Moldoveanu, S.C. Pyrolysis of hydrocarbons. In Pyrolysis of Organic Molecules: Applications to Health and Environmental Issues, 2nd ed.; Elsevier: Amsterdam, The Netherlands, 2018; pp. 35–161. [Google Scholar]
- Ogihara, H.; Tajima, H.; Kurokawa, H. Pyrolysis of mixtures of methane and ethane: Activation of methane with the aid of radicals generated from ethane. React. Chem. Eng. 2020, 5, 145–153. [Google Scholar] [CrossRef]
- Keramiotis, C.; Vourliotakis, G.; Skevis, G.; Founti, M.; Esarte, C.; Sánchez, N.; Millera, A.; Bilbao, R.; Alzueta, M. Experimental and computational study of methane mixtures pyrolysis in a flow reactor under atmospheric pressure. Energy 2012, 43, 103–110. Available online: https://www.sciencedirect.com/science/article/pii/S036054421200179X (accessed on 10 January 2023). [CrossRef]
- Olsvik, O.; Rokstad, O.A.; Holmen, A. Pyrolysis of methane in the presence of hydrogen. Chem. Eng. Technol. 1995, 18, 349–358. [Google Scholar] [CrossRef]
- Khan, M.S.; Crynes, B.L. Survey of Recent Methane Pyrolysis Literature. Ind. Eng. Chem. 1970, 62, 54–59. [Google Scholar] [CrossRef]
- Guéret, C.; Daroux, M.; Billaud, F. Methane pyrolysis: Thermodynamics. Chem. Eng. Sci. 1997, 52, 815–827. [Google Scholar] [CrossRef]
- Xu, C.; Al Shoaibi, A.S.; Wang, C.; Carstensen, H.-H.; Dean, A.M. Kinetic modeling of ethane pyrolysis at high conversion. J. Phys. Chem. A 2011, 115, 10470–10490. [Google Scholar] [CrossRef] [PubMed]
- Matheu, D.M.; Dean, A.M.; Grenda, J.M.; Green, W.H. Mechanism Generation with Integrated Pressure Dependence: A New Model for Methane Pyrolysis. J. Phys. Chem. A 2003, 107, 8552–8565. [Google Scholar] [CrossRef]
- Fau, G.; Gascoin, N.; Gillard, P.; Steelant, J. Methane pyrolysis: Literature survey and comparisons of available data for use in numerical simulations. J. Anal. Appl. Pyrolysis 2013, 104, 1–9. Available online: https://www.sciencedirect.com/science/article/pii/S0165237013000831 (accessed on 9 January 2023). [CrossRef]
- Uhlenbruck, N.; Dietrich, B.; Hofberger, C.; Stoppel, L.; Wetzel, T. Methane Pyrolysis in a Liquid Metal Bubble Column Reactor: A Model Approach Combining Bubble Dynamics with Byproduct and Soot Formation. Energy Technol. 2022, 10, 2200654. [Google Scholar] [CrossRef]
- Faravelli, T.; Ranzi, E.; Frassoldati, A.; Cuoci, A.; Mehl, M.; Pelucchi, M.; Stagni, A.; Debiagi, P.; Maffei, L.P.; Bertolino, A. C1-C16 HT+ Soot+ NOx mechanism (Version 2003, March 2020). Available online: http://creckmodeling.chem.polimi.it/menu-kinetics/menu-kinetics-detailed-mechanisms/107-category-kinetic-mechanisms/412-mechanisms-1911-tot-ht-soot-nox (accessed on 11 January 2023).
- Pejpichestakul, W.; Ranzi, E.; Pelucchi, M.; Frassoldati, A.; Cuoci, A.; Parente, A.; Faravelli, T. Examination of a soot model in premixed laminar flames at fuel-rich conditions. Proc. Combust. Inst. 2019, 37, 1013–1021. [Google Scholar] [CrossRef]
- Eliseo, R.; Carlo, C.; Alberto, C.; Alessio, F.; Matteo, P.; Tiziano, F. New reaction classes in the kinetic modeling of low temperature oxidation of n-alkanes. Combust. Flame 2015, 162, 1679–1691. Available online: https://www.sciencedirect.com/science/article/pii/S0010218014003848 (accessed on 10 January 2023).
- Muradov, N.; Smith, F.; Huang, C.; T-Raissi, A. Autothermal catalytic pyrolysis of methane as a new route to hydrogen production with reduced CO2 emissions. Catal. Today 2006, 116, 281–288. Available online: https://www.sciencedirect.com/science/article/pii/S0920586106003154 (accessed on 10 January 2023). [CrossRef]
- Moldoveanu, S.C. Pyrolysis of hydrocarbons. Tech. Instr. Anal. Chem. 2010, 28, 131–229. [Google Scholar]
- Arutyunov, V.S.; Vedeneev, V.I. Pyrolysis of methane in the temperature range 1000–1700 K. Russ. Chem. Rev. 1991, 60, 1384–1397. [Google Scholar] [CrossRef]
- Greensfelder, B.S.; Voge, H.H.; Good, G.M. Catalytic and Thermal Cracking of Pure Hydrocarbons: Mechanisms of Reaction. Ind. Eng. Chem. 1949, 41, 2573–2584. [Google Scholar] [CrossRef]
- Safarik, I.; Strausz, O.P. The thermal decomposition of hydro-carbons. Part 1. n-alkanes (C ≥ 5). Res. Chem. Intermed. 1996, 22, 275–314. [Google Scholar] [CrossRef]
- Edelson, D.; Allara, D.L. A computational analysis of the alkane pyrolysis mechanism: Sensitivity analysis of individual reaction steps. Int. J. Chem. Kinet. 1980, 12, 605–621. [Google Scholar] [CrossRef]
- Aliev, A.M.; Tairov, A.Z.; Guseinova, A.M.; Kalaushina, Y.M.; Shakhtakhtinskii, T.N. Optimal design of alkane pyrolysis processes: Propane pyrolysis. Theor. Found. Chem. Eng. 2004, 38, 654–659. [Google Scholar] [CrossRef]
Disclaimer/Publisher’s Note: The statements, opinions and data contained in all publications are solely those of the individual author(s) and contributor(s) and not of MDPI and/or the editor(s). MDPI and/or the editor(s) disclaim responsibility for any injury to people or property resulting from any ideas, methods, instructions or products referred to in the content. |
© 2023 by the authors. Licensee MDPI, Basel, Switzerland. This article is an open access article distributed under the terms and conditions of the Creative Commons Attribution (CC BY) license (https://creativecommons.org/licenses/by/4.0/).