Article

Decomposition of Saccharides and Alcohols in Solution Plasma for Hydrogen Production

Graduate School of Energy Science, Kyoto University, Yoshida-honmachi, Sakyo-ku, Kyoto 606-8501, Japan
*
Author to whom correspondence should be addressed.
Hydrogen 2022, 3(3), 333-347; https://doi.org/10.3390/hydrogen3030020
Submission received: 15 July 2022 / Revised: 10 August 2022 / Accepted: 16 August 2022 / Published: 18 August 2022

Abstract

:
Solution plasma or in-liquid plasma, which is generated by gas-phase discharge within bubbles in a solution, is an exciting reaction field for biomass conversion. However, it is not fully elucidated how the solution plasma works to degrade biomass or how biomass is degraded in it. In this study, various saccharides and alcohols, mainly sucrose, were treated in solution plasma using a high-voltage pulse power supply to study the degradation mechanisms. Hydrolysis and gasification were observed in the solution-plasma treatment of sucrose. The former was mainly influenced by the water temperature, and the latter was mainly influenced by the discharge power. Therefore, it was inferred that hydrolysis occurred in the hot-compressed water region around the plasma, and gasification occurred at the interface between the plasma and water. Gasification of saccharides and alcohols produced H2-rich gases, but gasification was faster for high-volatility alcohols and slower for non-volatile saccharides. The formation of H2-rich gas can be attributed to H2 formation by the water–gas shift reaction of CO and direct H2 formation from water, in addition to H2 from the sample.

Graphical Abstract

1. Introduction

With the increasing energy and material demand, carbon dioxide in the atmosphere is increasing owing to the use of fossil resources. Hydrogen energy is attracting attention as a way of realizing a carbon-neutral society [1]. Currently, most hydrogen is produced by the steam reforming of natural gas or petroleum. However, production of renewable hydrogen by the electrolysis of water with renewable electricity [2,3], the reforming of bioethanol [4], and the pyrolysis gasification of biomass [5] is more desirable.
Biomass resources are renewable and carbon neutral, and they are thus expected to be alternative energy and material sources to fossil resources. A typical use of biomass is for the production of bioethanol as a gasoline substitute, with global production reaching 2.2 exajoules in 2021 [6]. Bioethanol is mainly produced from edible resources, for example, from sugar resources such as sugarcane and from starch resources such as corn, but there are concerns about competition with food demand [7]. Woody biomass is a promising long-term alternative to fossil resources because it is inedible and abundant, and it accounts for more than 90% of all biomass on Earth [8].
There are many challenges in the utilization of woody biomass. Because of the crystallinity and fibrous nature of cellulose, the main cell-wall component, although various saccharification methods, such as acid [9], enzymatic [10], and hydrothermal [11] hydrolysis, have been studied, there are still issues in terms of economic and energy efficiency compared with edible resources [12]. Lignin-derived and sugar-degraded products can inhibit the fermentation of the resulting saccharide solution [13]. In biomass gasification, tar and coke formation are longstanding issues that have not yet been resolved [14,15].
Given the current situation of biomass conversion, plasma technology has been investigated as a potential biomass conversion method. Plasma is an ionized but electrically quasi-neutral gas with high-energy electrons, positive ions, radicals, and excited species that can promote various chemical reactions [16]. In practical applications, electrical discharge is a simple way to generate plasma, and it is widely used in, for example, illumination, surface modification, and material processes. Plasma-induced radical reaction fields are expected to enhance wood gasification. Tar and coke formation are partly due to the construction of polycyclic aromatic hydrocarbons from the unsaturated bond structures created during the wood-pyrolysis process. The hydrogen radicals in plasma can hydrogenate and stabilize such unsaturated structures. Studies applying atmospheric pressure plasmas, such as microwave and radiofrequency plasmas, to biomass gasification have demonstrated enhanced gasification and suppressed tar and coke formation [17,18,19,20].
Research on solution plasmas for biomass decomposition is still limited. Solution plasma or in-liquid plasma is, in a broad sense, plasma that has a boundary with a liquid, and it can be easily generated by gas-phase discharge within bubbles in a liquid [21]. The solution-plasma process has high flexibility in its configuration, depending on the power source, electrode structure and materials, and solvent. It is expected to have a variety of applications, including the decomposition of toxic compounds in water [22], nanoparticle synthesis [23], and surface modification [24]. Solution plasma is also a unique reaction field for biomass. While high reactivity is expected in and near the plasma region, the solvent temperature is below its boiling point. Therefore, the desired products from biomass can be protected from undesired decomposition in the solvent. Even at temperatures below the boiling point and ambient pressure, biomass gasification could be possible with low energy consumption.
Prasertsung et al. [25,26] found that the hydrolysis of microcrystalline cellulose and cassava starch occurs in solution plasma, and the resulting glucose yield varies with the electrode material, although they used sulfuric acid in their studies. Lee and Park [27] reported the gasification of bio-oil from kraft lignin by solution-plasma treatment, and H2 and CO were the main gases produced. Tange et al. [28] reported that high electrolyte concentration promotes plasma growth and improves the H2 yield in the radiofrequency solution-plasma treatment of cellulose suspensions. Syahrial et al. [29] found that ultrasonic irradiation improves the H2-production rate in the solution plasma of aqueous glucose solution. Ismail et al. [30] showed that in the radiofrequency solution-plasma treatment of cellulose suspensions, gasification is enhanced when the cellulose concentration is high because cellulose enters the plasma region in granular form.
Despite the above interesting studies, the dynamics and effects of solution plasma as a reaction field for biomass conversion have not been completely elucidated. Cellulose is not soluble in water, making the complex solution-plasma system even more complicated. In this study, using water-soluble di- and monosaccharides, and alcohols as model samples (mainly sucrose), the effects of the sample type, its concentration, the discharge power, and the water temperature on the reaction were investigated to clarify the decomposition behavior in solution plasma while discussing the simple kinetics. Sucrose is an edible biomass resource that is widely found in nature. It is a disaccharide composed of glucose and fructose joined by an α-1,2-glycosidic linkage, and it is not a reducing sugar; thus, it is far from a model for cellulose. Cellobiose is a more appropriate cellulose model. Nevertheless, in this study, we mainly investigated sucrose because it is readily hydrolyzed, and therefore using sucrose is convenient to observe the various reactions in solution plasmas.

2. Materials and Methods

2.1. Materials

Sucrose (extra pure reagent, EP) and D-cellobiose (>98%, guaranteed regent, GR) as disaccharides; D-glucose (>98%, GR) and D-fructose (>98%, GR) as monosaccharides; methanol (>99.8%, GR), ethanol (>99.5%, EP), 1-propanol (>99.5%, GR), 1,3-propanediol (>97%), and glycerol (>99.5%, GR) as alcohols; and acetone (>99.5%, GR) as a reference were purchased from Nacalai Tesque, Inc. (Kyoto, Japan), except for 1,3-propanediol, which was purchased from Fujifilm Wako Pure Chemical Corp. (Osaka, Japan), and they were used as received.
Each sample (0.30–3.0 g) was dissolved in 100 mL of ion-exchanged water with 0.10 g of sodium chloride (>99.5%, EP, Nacalai Tesque, Inc.) as an electrolyte, and the solution was then placed in a solution-plasma reactor for treatment. The ion-exchanged water was produced by an ultrapure water production system (Milli-Q Integral 3, Merck Millipore, Burlington, MA, USA), and the ultrapure water was used after degassing for 10 min in an aspirator with ultrasonic irradiation to remove the remaining CO2.

2.2. Solution-Plasma Treatment

The solution-plasma reactor (Figure 1) consisted of a 100-mL glass bottle and tungsten-rod electrodes (outer diameter, 1.0 mm) insulated with ceramic tubes. The reactor was hermetically sealed with a cap with four through pipes for circulation cooling, gas collection, and thermocouple insertion ports. The pipes for cooling were connected to a coiled stainless-steel pipe heat exchanger (inner diameter, 2.2 mm; length, 1350 mm) immersed in a cold bath by a tubing pump (RP-23, ABLE Corp., Tokyo, Japan). The sample solution was circulated at 5 mL/min for cooling during the experiment. To change the cooling effect, experiments were conducted with either ice water (approximately 5 °C) or room-temperature water (approximately 20 °C) in the cold bath or without circulation. The tip of the thermocouple was placed approximately 1 cm below the solution surface. A 10-L gasbag was used to collect the product gas.
Before the experiment, the free space in the reactor was purged with Ar to prevent nitric acid formation from N2 in air during the solution-plasma treatment. Alternating high-voltage pulses (MPP04-A4-30, Kurita Manufacturing Co., Ltd., Kyoto, Japan) were then applied between the electrodes to perform the solution-plasma treatment. The switching frequency was set to 30 kHz, the pulse width was 0.8 μs, and the voltage at no load was ±4 kV0-p. As shown in Figure 1, when high-voltage pulses were applied, alternating current flowed through the solution, generating Joule heat. This caused the evaporation of water and the formation of vapor bubbles, in which gas-phase discharge occurred. The discharge power was adjusted by changing the distance between the electrodes, as explained in Appendix A, where the power was higher for longer distances between the electrodes. During plasma treatment, approximately 0.5 mL of the sample solution was collected from the circulation line at specific intervals. After treatment, the collected sample solutions were analyzed by high-performance anion-exchange chromatography (HPAEC), and the product gas in the gasbag was analyzed by micro gas chromatography (micro GC).

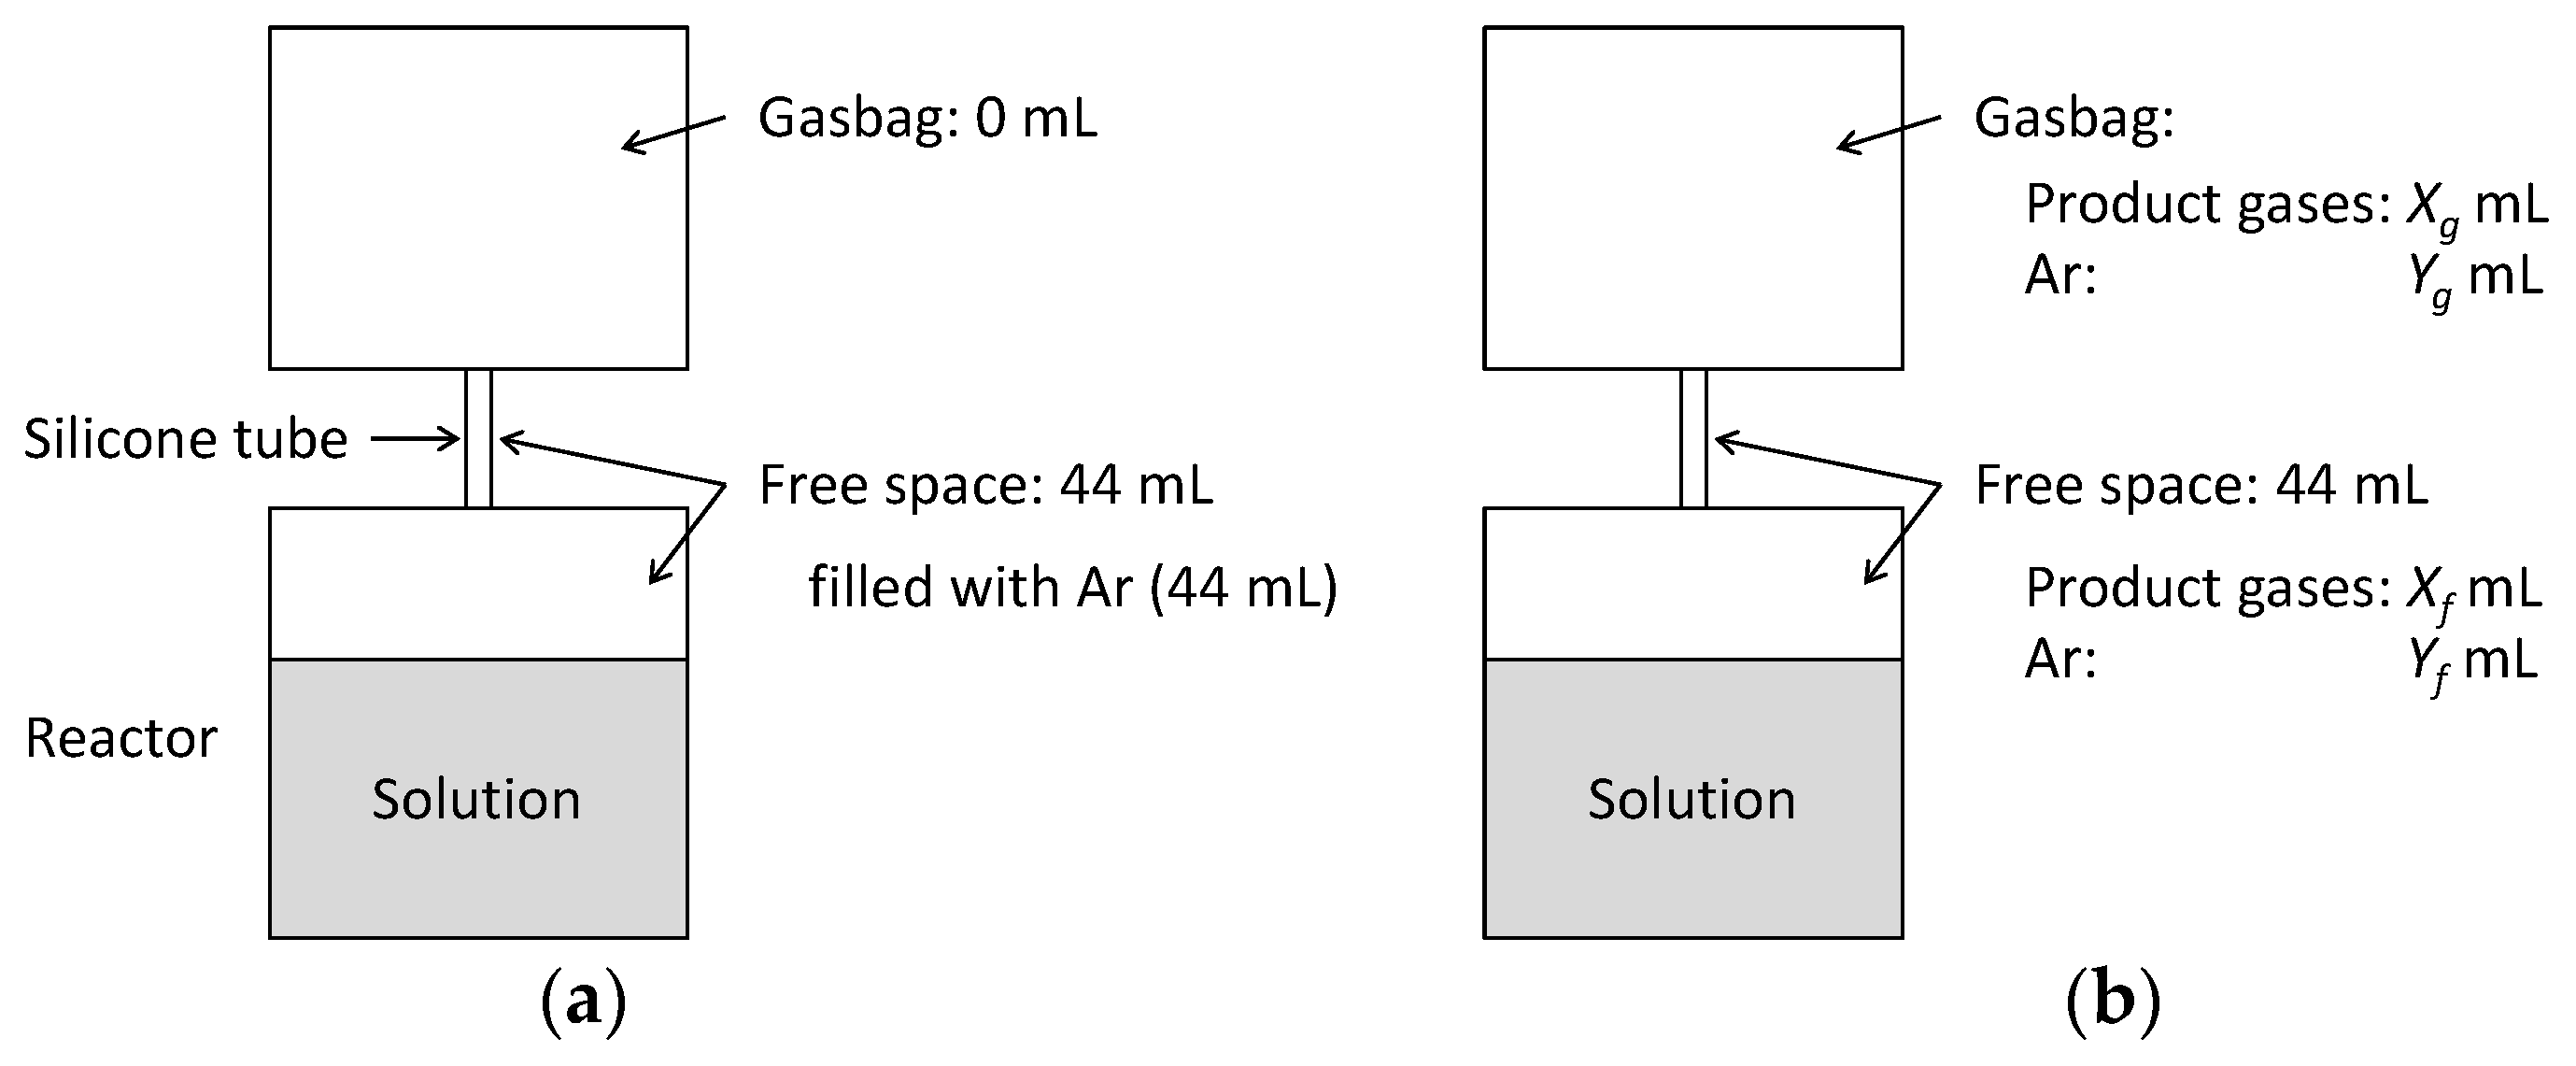
2.3. Analytical Methods

The applied voltage and current were measured with a high-voltage probe (P6015A, Tektronix, Inc., Tokyo, Japan) and a current monitor (Model 110, Pearson Electronics, Inc., Palo Alto, CA, USA), respectively, and the waveforms were displayed on a digital oscilloscope (GDS-2202A, Good Will Instrument Co., Ltd., New Taipei, Taiwan). The discharge power was evaluated from the one-cycle average of the product of the instantaneous values of the voltage and current. Because the oscilloscope did not have a function to record this evaluated power, a video camera was used to capture the displayed value, recognize the characters, and record the value once per second. The water temperature, which was measured by a thermocouple, was recorded with a digital multimeter (GDM-8342, Good Will Instrument Co., Ltd.). Because the solution was not stirred, there was probably a temperature distribution, so the measured temperatures are only a guide. Examples of the discharge-power and water-temperature measurements during solution-plasma treatment are shown in Appendix B.
The sample solutions were analyzed by HPAEC with a Prominence system (Shimadzu Corp., Kyoto, Japan) under the following conditions: column, CarboPac PA1 (a 250-mm analysis column connected with a 50-mm guard column, Thermo Fisher Scientific Inc., Waltham, MA, USA); eluent, 30 mM sodium hydroxide aqueous solution; flow rate, 1 mL/min; column oven temperature, 35 °C; and detector, electrochemical detector (DECADE Elite, Antec Scientific, Zoeterwoude, The Netherlands).
The product gas in the gasbag was analyzed by micro GC (Agilent 990, Agilent Technologies Inc., Santa Clara, CA, USA) under the following conditions. Channel 1: column, MS5 A 10 m; carrier gas, Ar; column temperature, 100 °C; and detector, thermal conductivity detector (TCD). Channel 2: column, PoraPLOT Q 10 m; carrier gas, He; column temperature, 80 °C; and detector, TCD. Channel 3: column, PoraPLOT U 10 m; carrier gas, He; column temperature, 80 °C; and detector, TCD. There was a 44-mL free space in the plasma reactor when the reactor and circulation cooling line were filled with 100 mL of the sample solution. The gas-quantification results were corrected to account for this space, as explained in Appendix C.

3. Results and Discussion

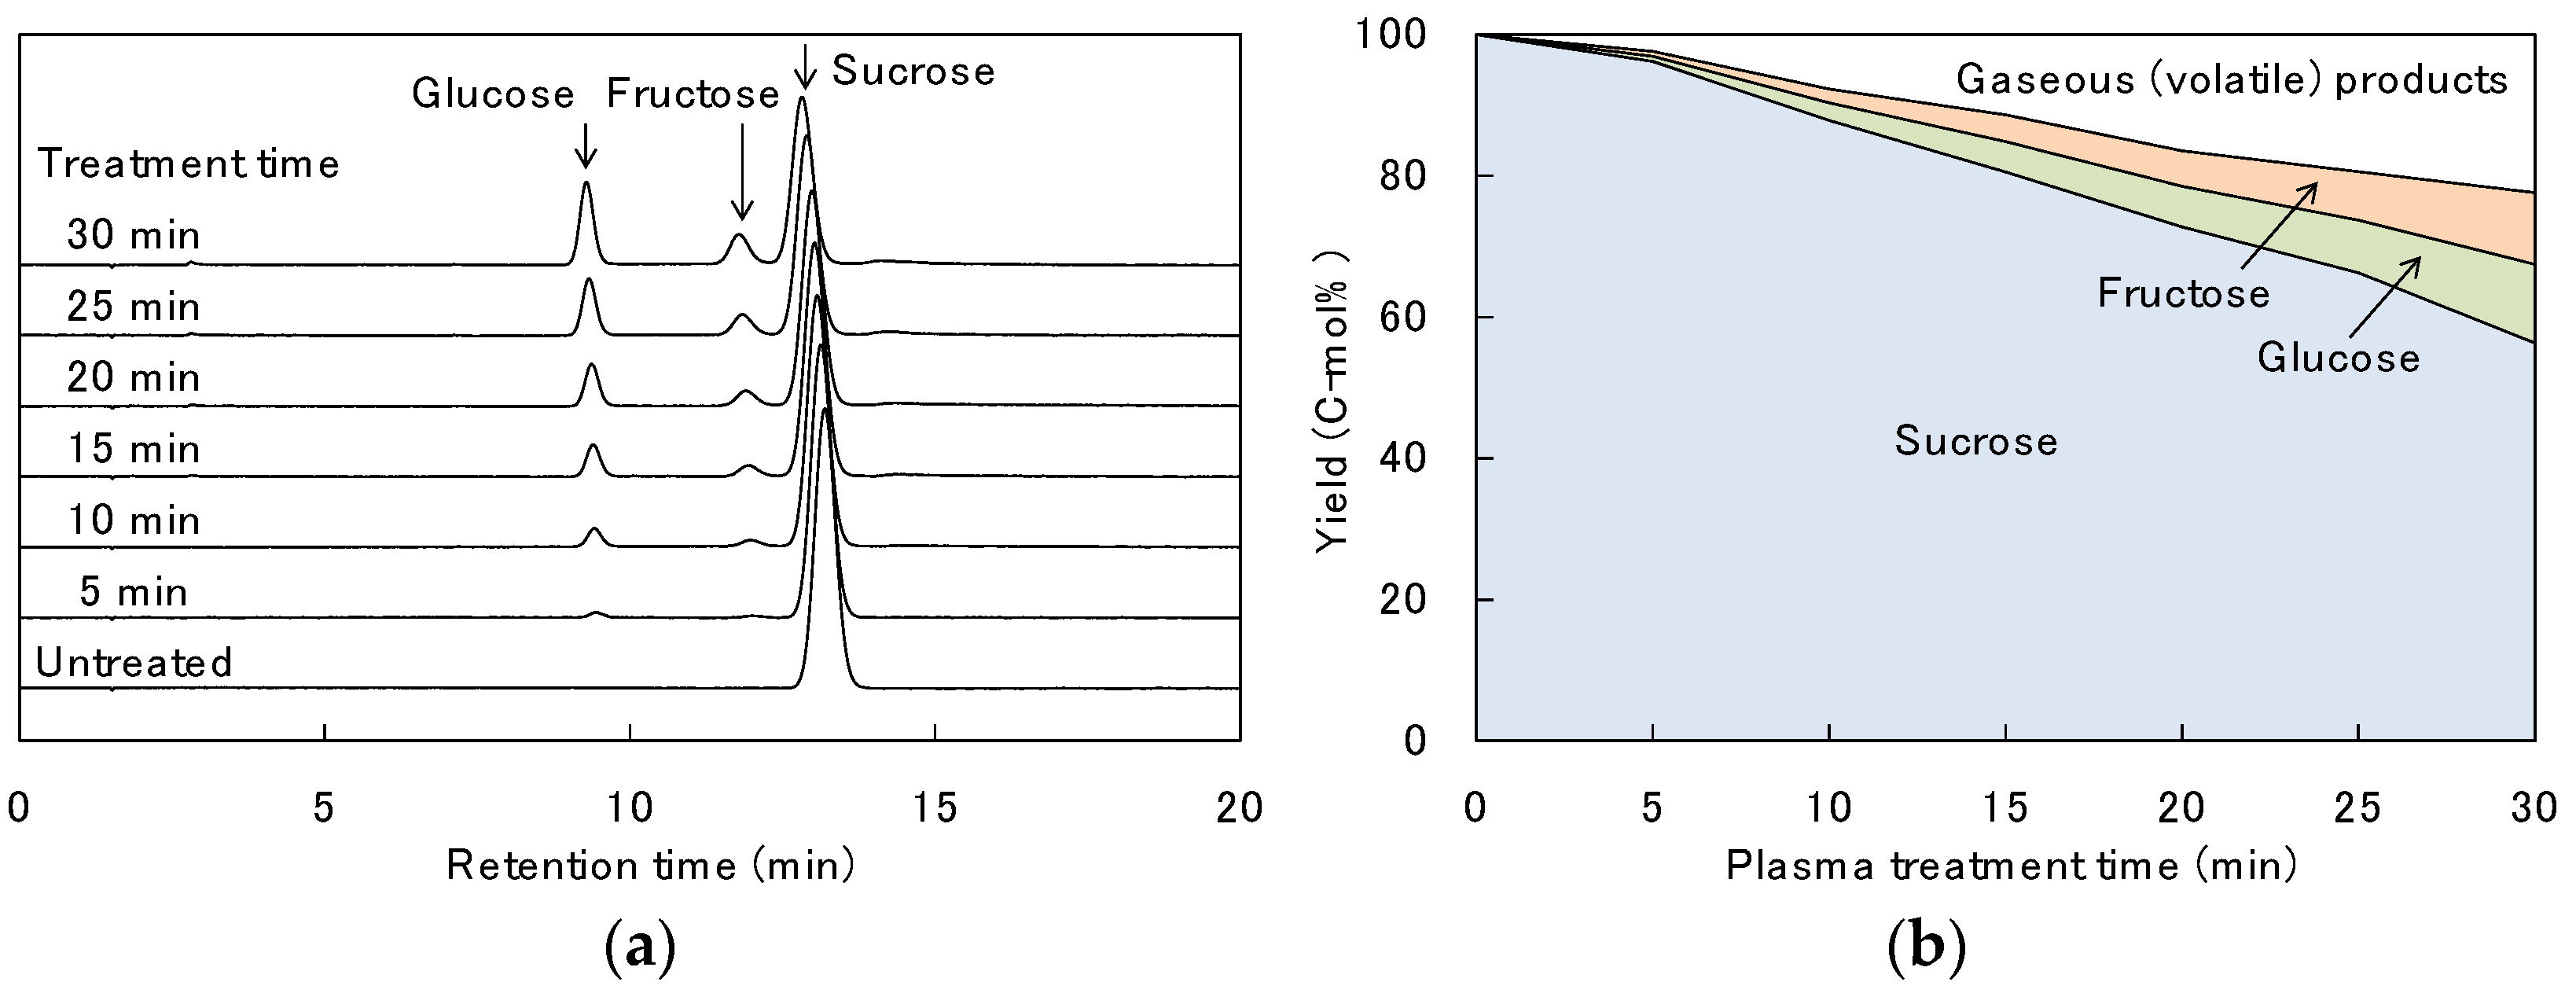
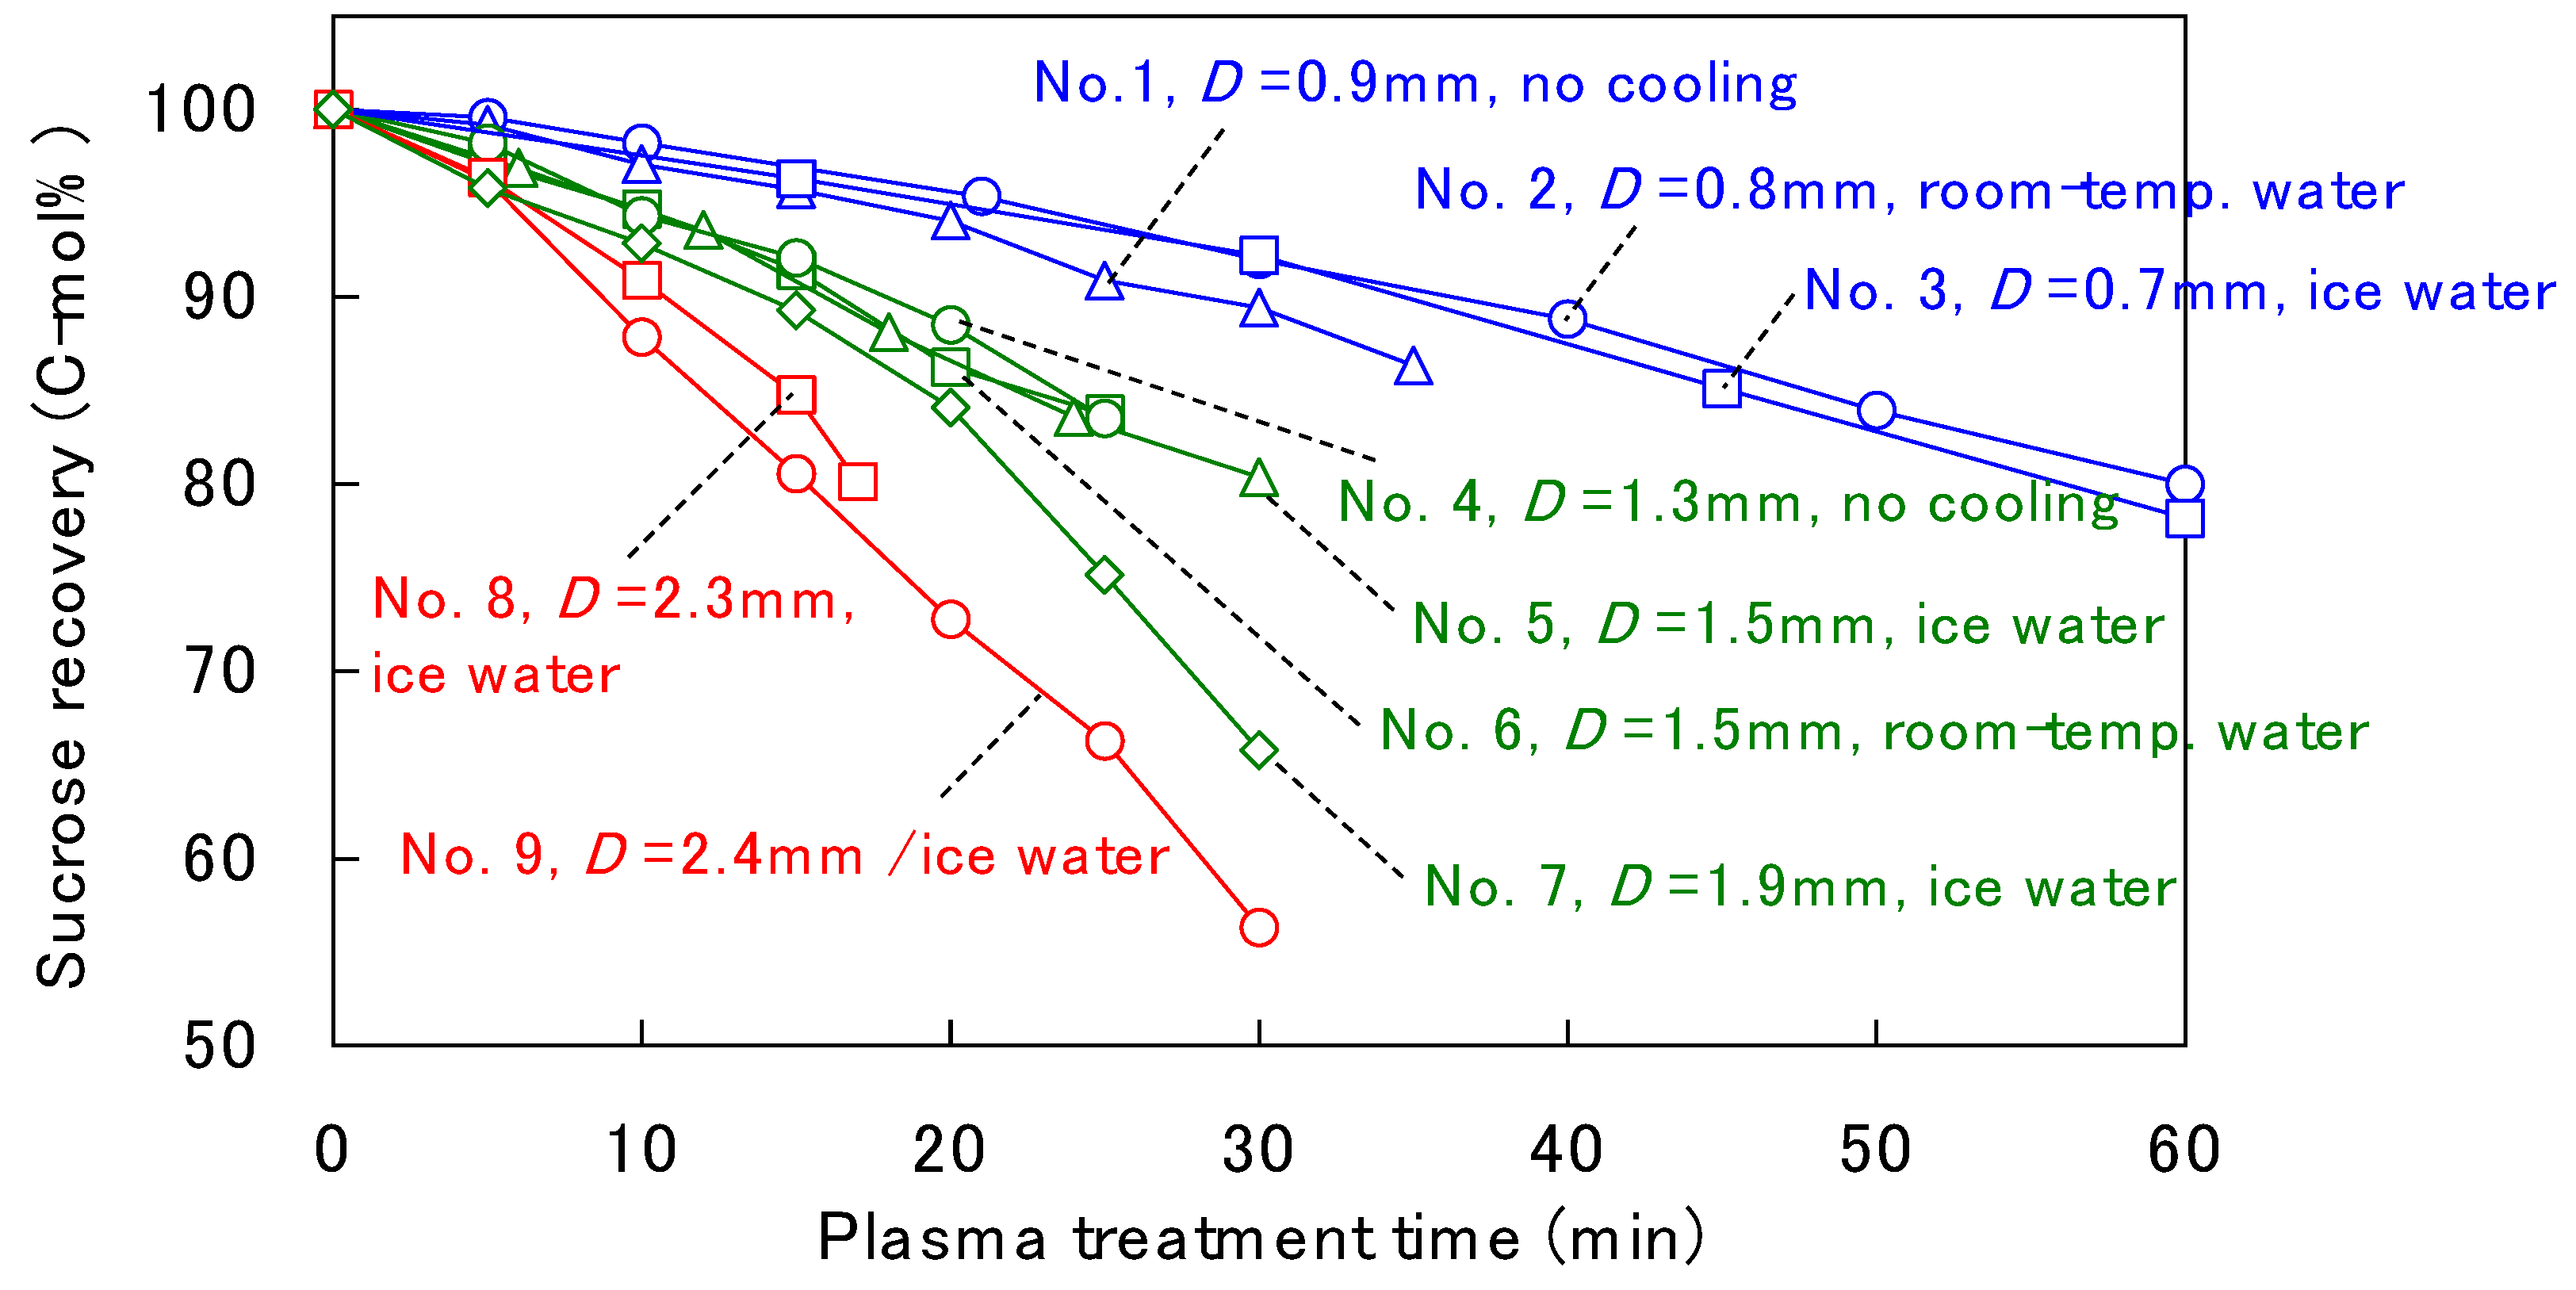
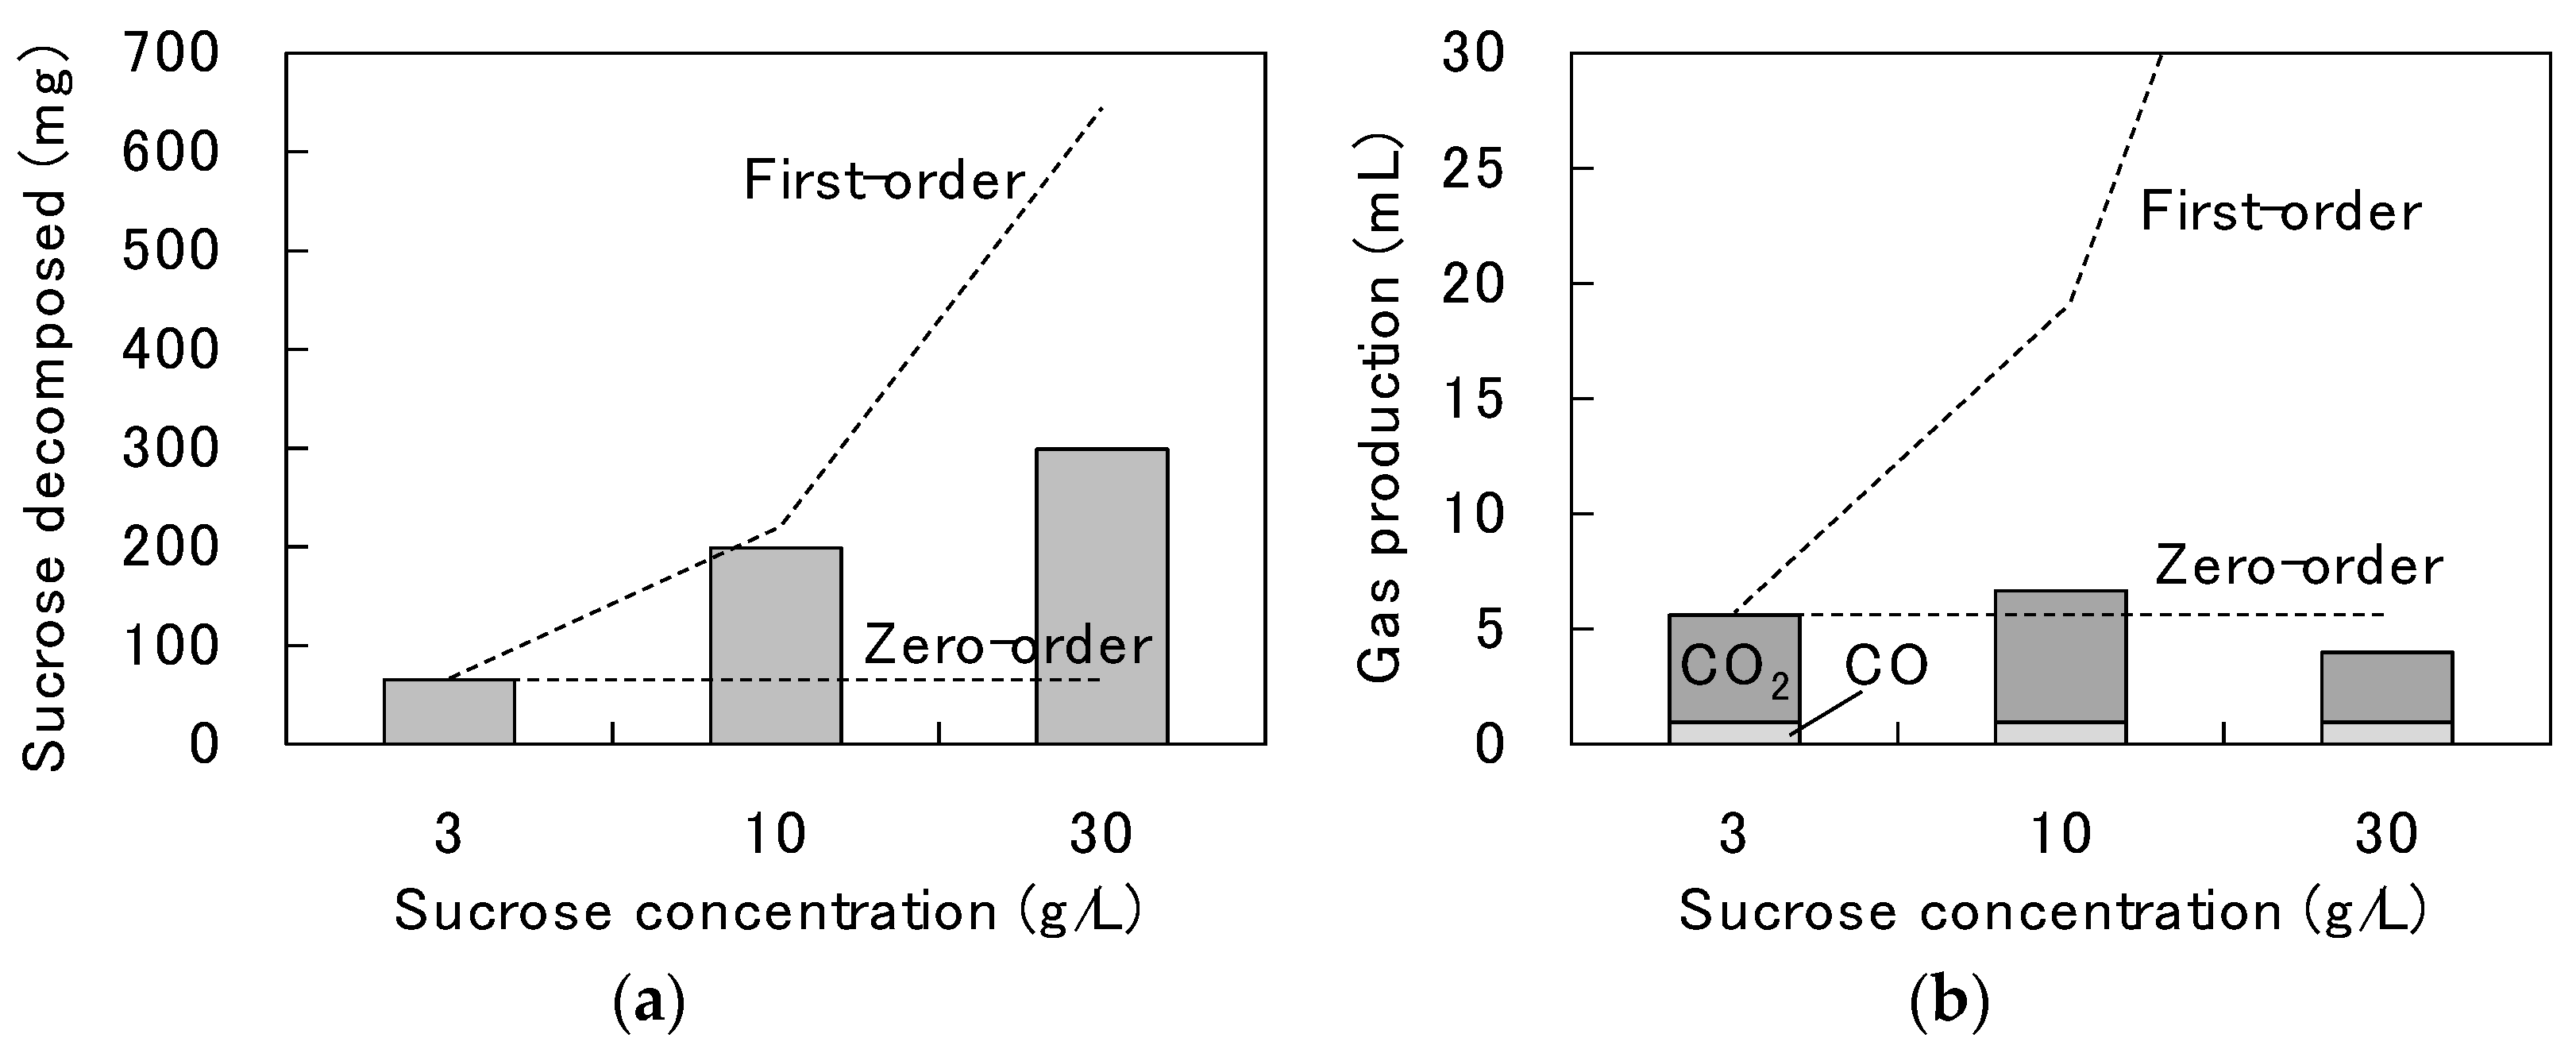
3.1. Decomposition Behavior of Sucrose

The HPAEC chromatograms of the sample solutions obtained by the solution-plasma treatment of sucrose (10 g/L) and the product yields when the electrode distance was 2.4 mm and the average power during plasma treatment was 34.2 W with circulation cooling using ice water are shown in Figure 2a,b, respectively. The water temperature reached 90.8 °C at 30 min. No solid products, such as soot, were observed in this experiment and in all of the other solution-plasma treatments in this study. The gradual shifts of the retention times of the products to the left in the chromatograms are due to the effect of NaCl in the solutions.
Sucrose is a disaccharide consisting of glucose and fructose joined by an α-1,2-glycosidic linkage. The chromatograms showed a decrease in sucrose and an increase in glucose and fructose with increasing plasma-treatment time, clearly indicating that hydrolysis of sucrose occurred. No other clear products were observed, except for a slight broad peak after the retention time of sucrose. In hot-compressed water, it is well known that dehydrated products, such as 5-hydroxymethylfurfural and furfural, are formed from saccharides [31]. The retention times of these dehydrated products are much faster than that of glucose, but no such peaks were observed.
The product yields on a carbon atom basis indicated that the sum of sucrose, glucose, and fructose was not 100 C-mol%; after 30 min of treatment, the yields were 56.3 C-mol% sucrose, 11.1 C-mol% glucose, and 10.2 C-mol% fructose (Figure 2b). The remaining 22.4 C-mol% was presumed to be mainly gases and volatile products. The fructose peak was much smaller than the glucose peak owing to the different sensitivities (Figure 2a), but their yields were close to 1:1, as shown in Figure 2b. Because glucose and fructose are hexoses, the carbon-atom-based yields would be exactly 1:1 if they were quantitatively produced by sucrose hydrolysis. However, in all of the sucrose treatments in this study, the yield of fructose was slightly lower than that of glucose; in the above case, glucose:fructose = 11.1:10.2 (mol/mol). Fructose is probably slightly more degradable than glucose in solution plasma.
The gas yields obtained after 30-min treatment of sucrose are given in Table 1. The gas composition was simple, with only H2, CO, and CO2 detected. Although H2 was the main gas (134 mL), not all of the H2 was produced from sucrose because non-negligible amounts of water-derived H2 (2H2O → 2H2 + O2) were produced even without sucrose, as shown in Appendix D. The carbon-atom yields based on the initial sucrose were 0.35 C-mol% for CO and 2.27 C-mol% for CO2. Adding these to the above sucrose, glucose, and fructose yields, the total was still less than 100 C-mol%, suggesting that undetected products were still present. H2 is outside this carbon balance and cannot be shown in C-mol%, but for comparison, this paper reported its molar yield based on its molar ratio to the other gases. For example, Table 1 shows 17.1 C-mol% for H2, but this is only a calculation of 134 mL (amount of H2)/17.8 mL (amount of CO2) × 2.27 (C-mol% of CO2).
The ideal gasification of hexoses (C6H12O6), such as glucose and fructose, could produce equal amounts of H2 and CO (C6H12O6 → 6H2 + 6CO). However, Table 1 shows that the H2 and CO2 yields were considerably higher than that of CO. This could be because the CO produced from saccharides underwent water–gas shift reaction near the plasma regions, producing H2 and CO2 (CO + H2O → CO2 + H2). In the pyrolysis gasification of saccharides, H2 and CO are the main components, and C1–C3 hydrocarbons, such as methane and ethylene, are also produced, along with char and tar [32]. In contrast, the gasification of saccharides in solution plasma appears to be clean and selective, although the reaction rate is slow.
The sucrose recovery and gas yields from the solution-plasma treatment of sucrose (10 g/L) for various electrode distances and cooling methods are shown in Figure 3 and Table 2, respectively, in which the results with the same entry number are from the same experiment. The average power and water temperature in Table 2 are averages over the entire treatment time.
The sucrose recovery tended to decrease with increasing electrode distance, D, indicating that hydrolysis occurred better at higher power. When the electrode distance was longer than 2.4 mm, no discharge occurred. No. 9 (D = 2.4 mm) was the maximum power in this study and showed the fastest sucrose degradation. No. 8 (D = 2.3 mm) was the second highest power, but the power difference from No. 9 was only 1 W and the temperature difference was only 3 °C. Nevertheless, in Figure 3, there is a clear difference in sucrose recovery. This may be because the increase in sucrose decomposition rate was more significant at higher power and temperature, as discussed later.
Because the hydrolysis of sucrose can occur even in hot-compressed water [33], it is interesting to discuss whether hydrolysis was due to plasma treatment or the high temperature. For the gas yields in Table 2, although direct comparisons cannot be made because of the different treatment times, the gas yield per treatment time tended to increase with increasing electrode distance. It would also be interesting to know which effect, plasma or temperature, is more significant for gasification. The experiments with different cooling methods were intended to clarify this point. In Figure 3, the sucrose recovery was analyzed at intervals of 5 min or longer. The changes in the discharge power and water temperature were measured (Figure A2). These data were used to evaluate the relationship between the average power, water temperature, and decomposition rate at each interval. Assuming a pseudo-first-order reaction, the sucrose recovery, R, can be expressed as:
R = R 0 exp ( κ t )
Thus, the decomposition rate constant (κ) in the period from time, ti to ti+1, can be approximated by:
κ = R i R i + 1 R i ( t i + 1 t i )
The evaluated decomposition rate constants of sucrose are shown as a function of the average power and water temperature in Figure 4a,b, respectively. Here, the average power and water temperature are averages over the time period (from ti to ti+1) for which the decomposition rate was evaluated. To show the approximate distributions of power and water temperature in each period (from ti to ti+1), the ranges of sample standard deviations are indicated by error bars.
The decomposition rate constant of sucrose tended to increase with increasing power and temperature, and it was positively correlated with both. Although the coefficient of determination (R2) for the linear regression of the power was slightly larger than that for the linear regression of the temperature, the difference was not large enough to determine which effect was more significant. Contrary to expectations, this is because the cooling method used in this study did not provide sufficient temperature differences to elucidate the temperature effect. From the results shown in Figure 4, all that can be concluded is that the water temperature and decomposition rate of sucrose increased with increasing discharge power. Although linear regression was tried in Figure 4, the relationship between decomposition rate and power or temperature did not appear to be linear. In particular, Figure 4b shows that the decomposition rate tended to increase more rapidly at higher water temperatures.
For gasification, the total gas yield per treatment time is defined as the gasification rate (C-mol%/h), and it is shown as a function of the average power and water temperature in Figure 5a,b, respectively, in which H2 is excluded because only sucrose-derived gases should be evaluated. The average power and temperature here are averages over the entire treatment time and are the same as the values in Table 2. To show the approximate distributions of power and water temperature over the entire treatment time for each experiment, the ranges of sample standard deviations are indicated by error bars.
The gasification rate was positively correlated with both the power and the temperature, but it was not possible to determine which effect was more dominant in gasification. However, because the ratio of CO2 to CO varied with the treatment conditions (Table 2), the CO2/CO ratio was evaluated as a function of the average power (Figure 5c), which showed an increasing trend with increasing power. This result indicates that more water–gas shift reaction of CO to CO2 occurred for higher discharge power or temperature.
To clarify the effects of the power and water temperature, in addition to continuous discharge treatment, intermittent operation was performed with discharge turned on and off at periodic intervals. The experimental conditions are given in Table 3. In all cases, the electrode distance was set to 1.2 mm, so there was little difference in the average power during discharge (approximately 25 W). In continuous operation, the treatment time was 45 min. In intermittent operation, discharge was turned on for 1 min and off for 1 min, and the total treatment time was 90 min. In the case of discharge for 1 min and no discharge for 3 min, the total treatment time was 180 min. In all cases, the total discharge time was 45 min, and the total electric energy consumed was approximately 19 Wh (25 W × 0.75 h). This experimental method allowed significant variation of the average water temperature (63.7, 47.5, and 35.3 °C) while keeping the discharge power and energy constant. It was found that the sucrose recovery clearly increased with decreasing water temperature despite the same electric energy.
The gas yield (the sum of CO and CO2) showed little difference between continuous operation and 1 min on/1 min off intermittent operation. However, the gas yield decreased significantly for 1 min on/3 min off operation. These results suggest that hydrolysis is strongly affected by the water temperature, while gasification tends to be affected by the discharge power. This indicates where the reactions predominantly occurred: hydrolysis mostly occurred in water and gasification occurred in or very near the plasma.
The effects of the sucrose concentration on the amount of sucrose decomposed (mg) and gas produced (mL), where H2 was excluded to discuss only sucrose-derived gases, are shown in Figure 6a,b, respectively. The amount of degraded sucrose increased with increasing sucrose concentration, but it was not proportional to the sucrose concentration as in the first-order reaction indicated by the dashed line. This shows that the degradation of sucrose was between a first-order reaction and a zero-order reaction, where the latter is independent of the sucrose concentration. Conversely, gas production was almost constant and independent of the sucrose concentration, and gasification seemed to follow a zero-order reaction. At least in dilute aqueous solutions of sucrose, as in this study, it seems natural that the amount of reaction follows a first-order reaction proportional to the sucrose concentration, regardless of where the hydrolysis and gasification reactions occur. The reasons why this was not the case will be discussed later.

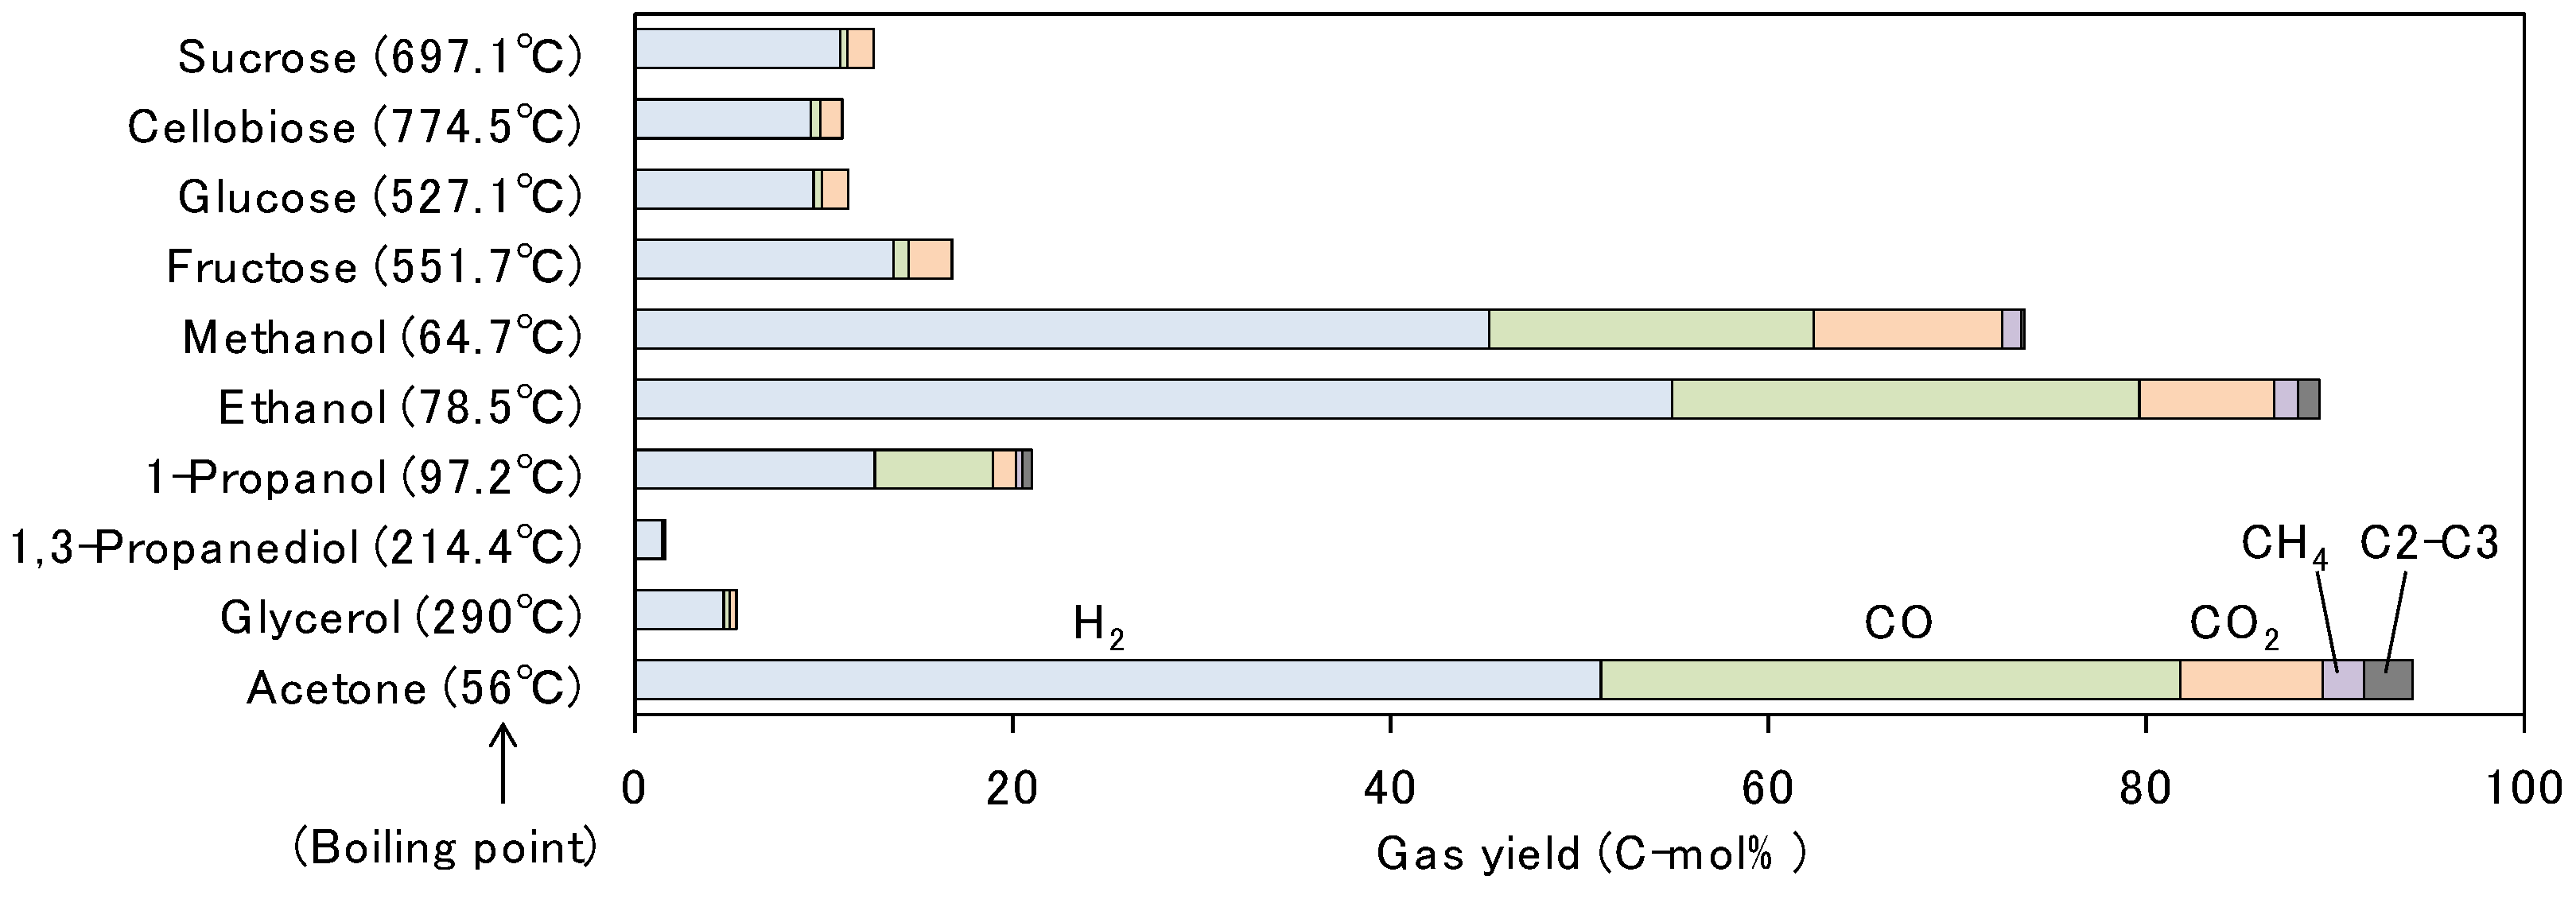
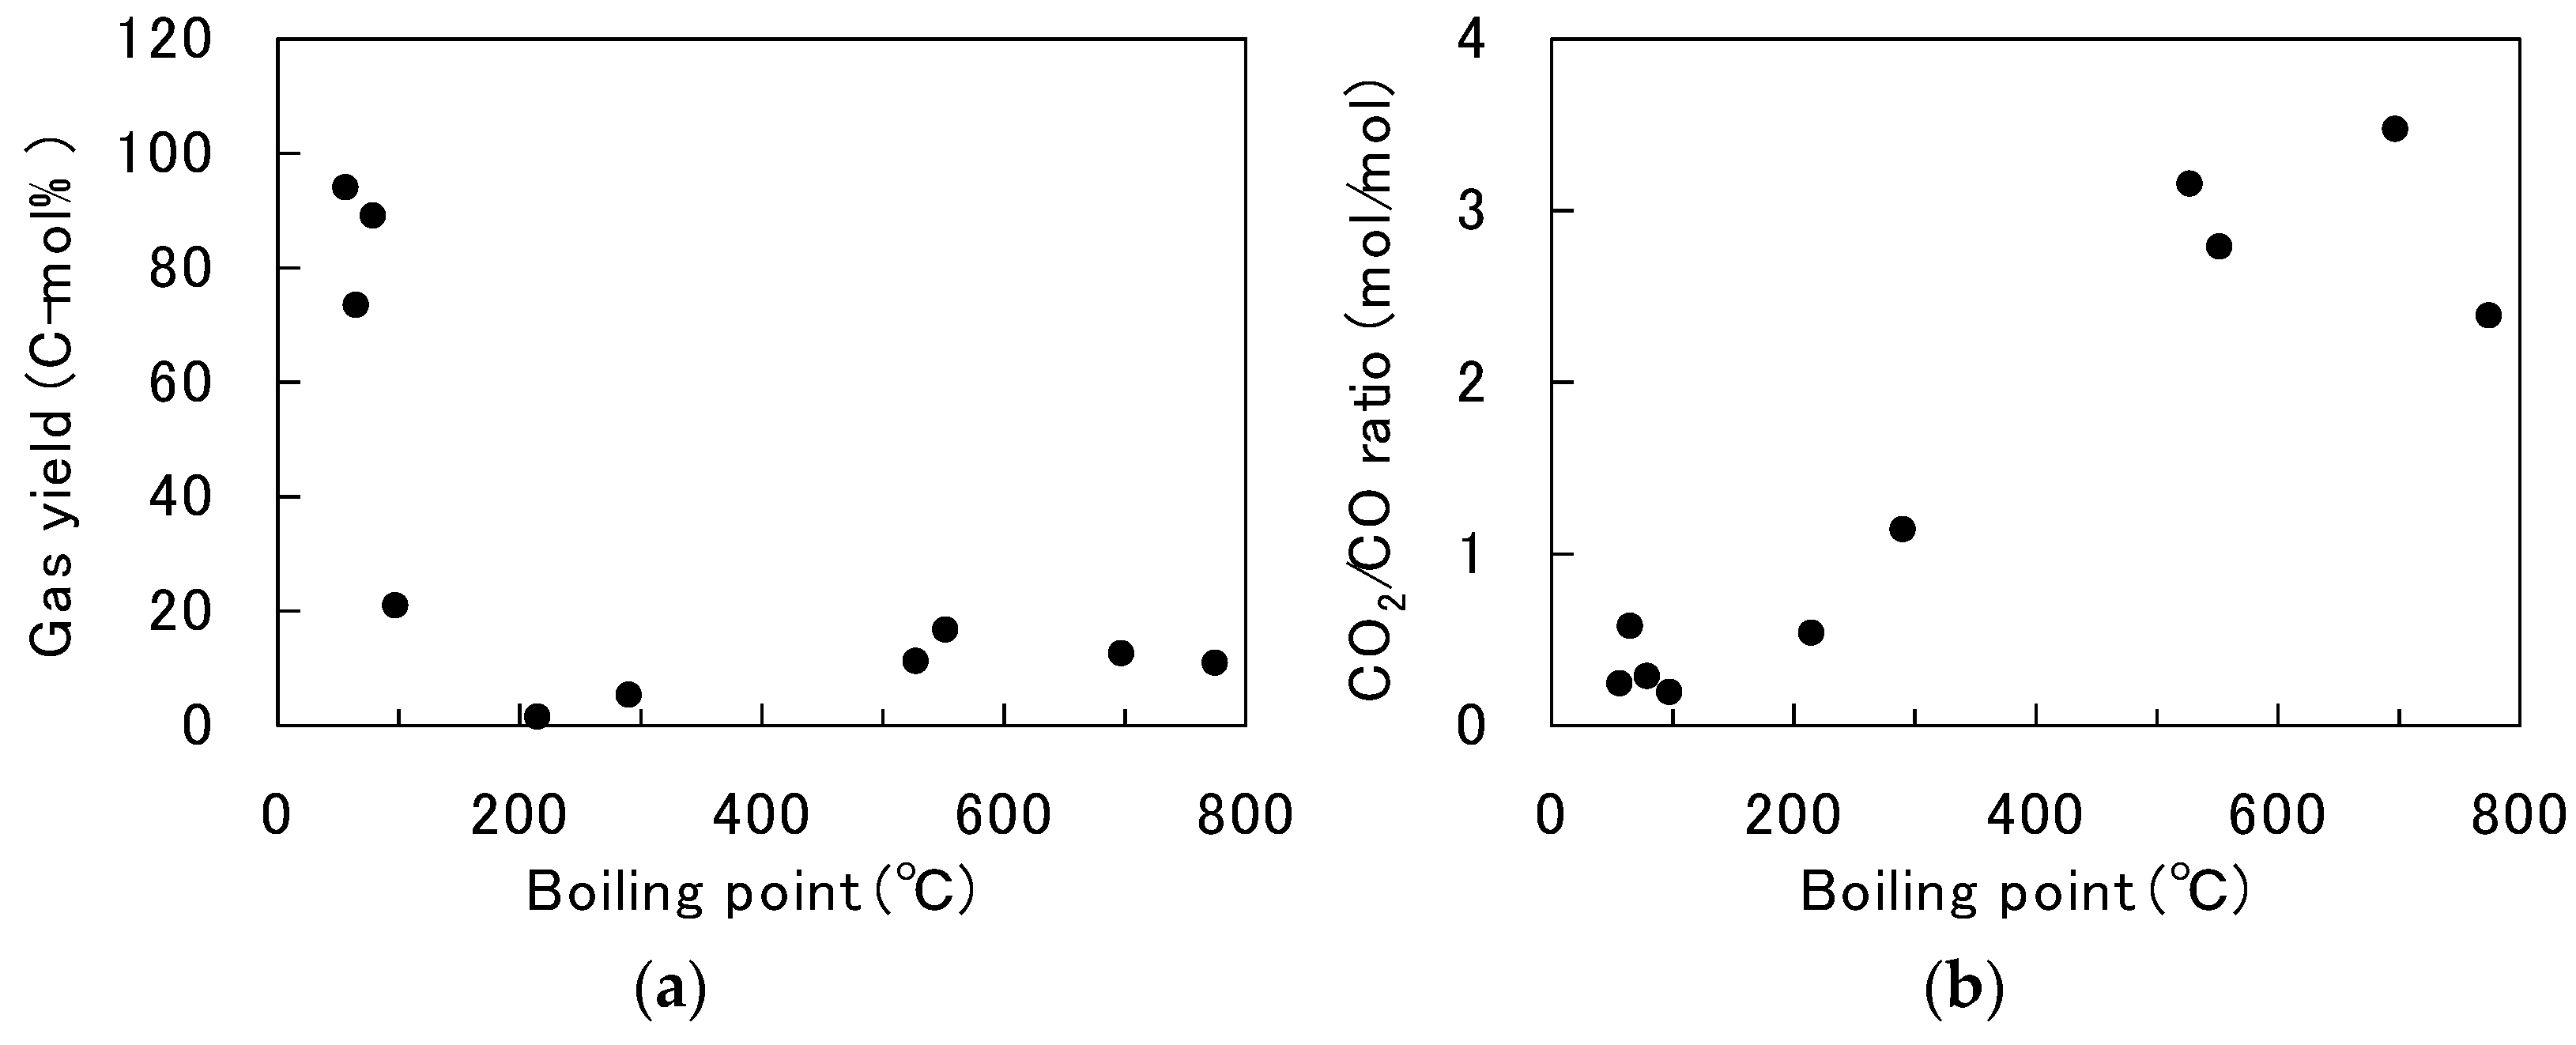
3.2. Comparison of Various Saccharides and Alcohols

The gas yields from the solution-plasma treatment of various saccharides, alcohols, and acetone are shown in Figure 7. The saccharides were treated for 45 min, while the alcohols and acetone were treated for 30 min. The boiling point of each sample is shown in parentheses. The boiling points of the saccharides are the predicted values listed in SciFinder. They are all above 500 °C, meaning that they are almost non-volatile, and pyrolysis usually occurs before boiling.
The gas yields from these samples appear to be related to the boiling point. The relationship between the boiling point and the gas yield (H2 is excluded here) is shown in Figure 8a. Gasification of methanol, ethanol, and acetone, which have boiling points well below 100 °C (the boiling point of water), was significant, whereas the gas yields from alcohols with high boiling points and non-volatile saccharides were low. However, the gas yields were not in the order of the boiling points, suggesting that the chemical structure also plays a role in the gasification reactivity. For example, ethanol had a higher gas yield than methanol, and among the saccharides, the gas yield from fructose was considerably higher than those from the other saccharides, although the reasons for these differences are not known. The slightly higher gas yield from fructose would be related to the slightly lower fructose yield than glucose in Figure 2.
For all of the samples, H2 was the predominant gas product, followed by CO and CO2. In addition, methanol, ethanol, 1-propanol, and acetone produced small amounts of methane and C2–C3 hydrocarbons, such as ethane and ethylene, but the other samples did not. The CO2/CO ratio in the product gas as a function of the boiling point is shown in Figure 8b. The lower boiling point samples tended to contain more CO than the higher boiling point samples. In addition to the saccharides, considering the oxygen atom compositions of the alcohols and acetone treated in this study, CO is also expected to be one of the main product gases in their gasification. Therefore, it is presumed that the water–gas shift reaction was not significant for the high-volatility samples, and the ratio of CO was high. In the case of the high-volatility samples, that is, the samples with boiling points lower than the boiling point of water, gasification was more pronounced, probably because they were readily volatilized instead of or together with water and directly exposed to the plasma generated in the bubbles. Conversely, the low-volatility or non-volatile samples mainly remained in the water, and gasification only occurred at the boundary between the bubbles (plasma region) and liquid phase, resulting in low gas yields. In this case, the water–gas shift reaction was presumed to be more pronounced because the samples were in direct contact with water, resulting in high CO2/CO ratios.

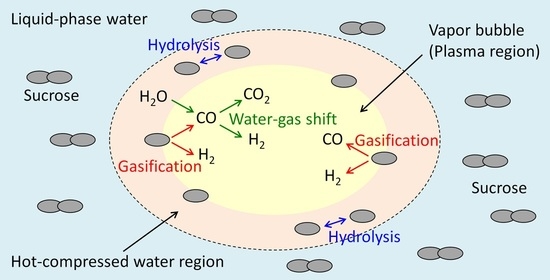
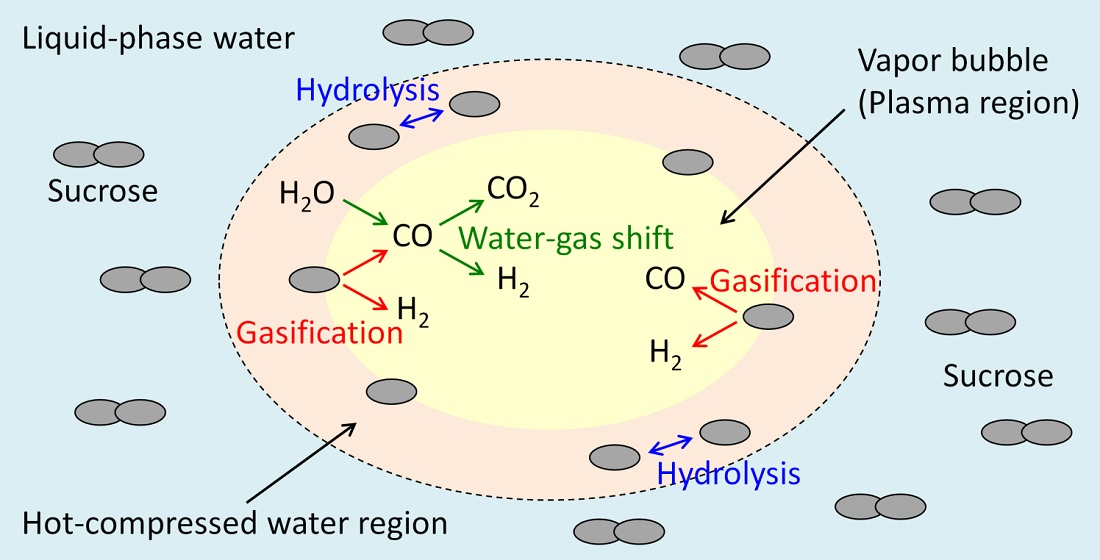
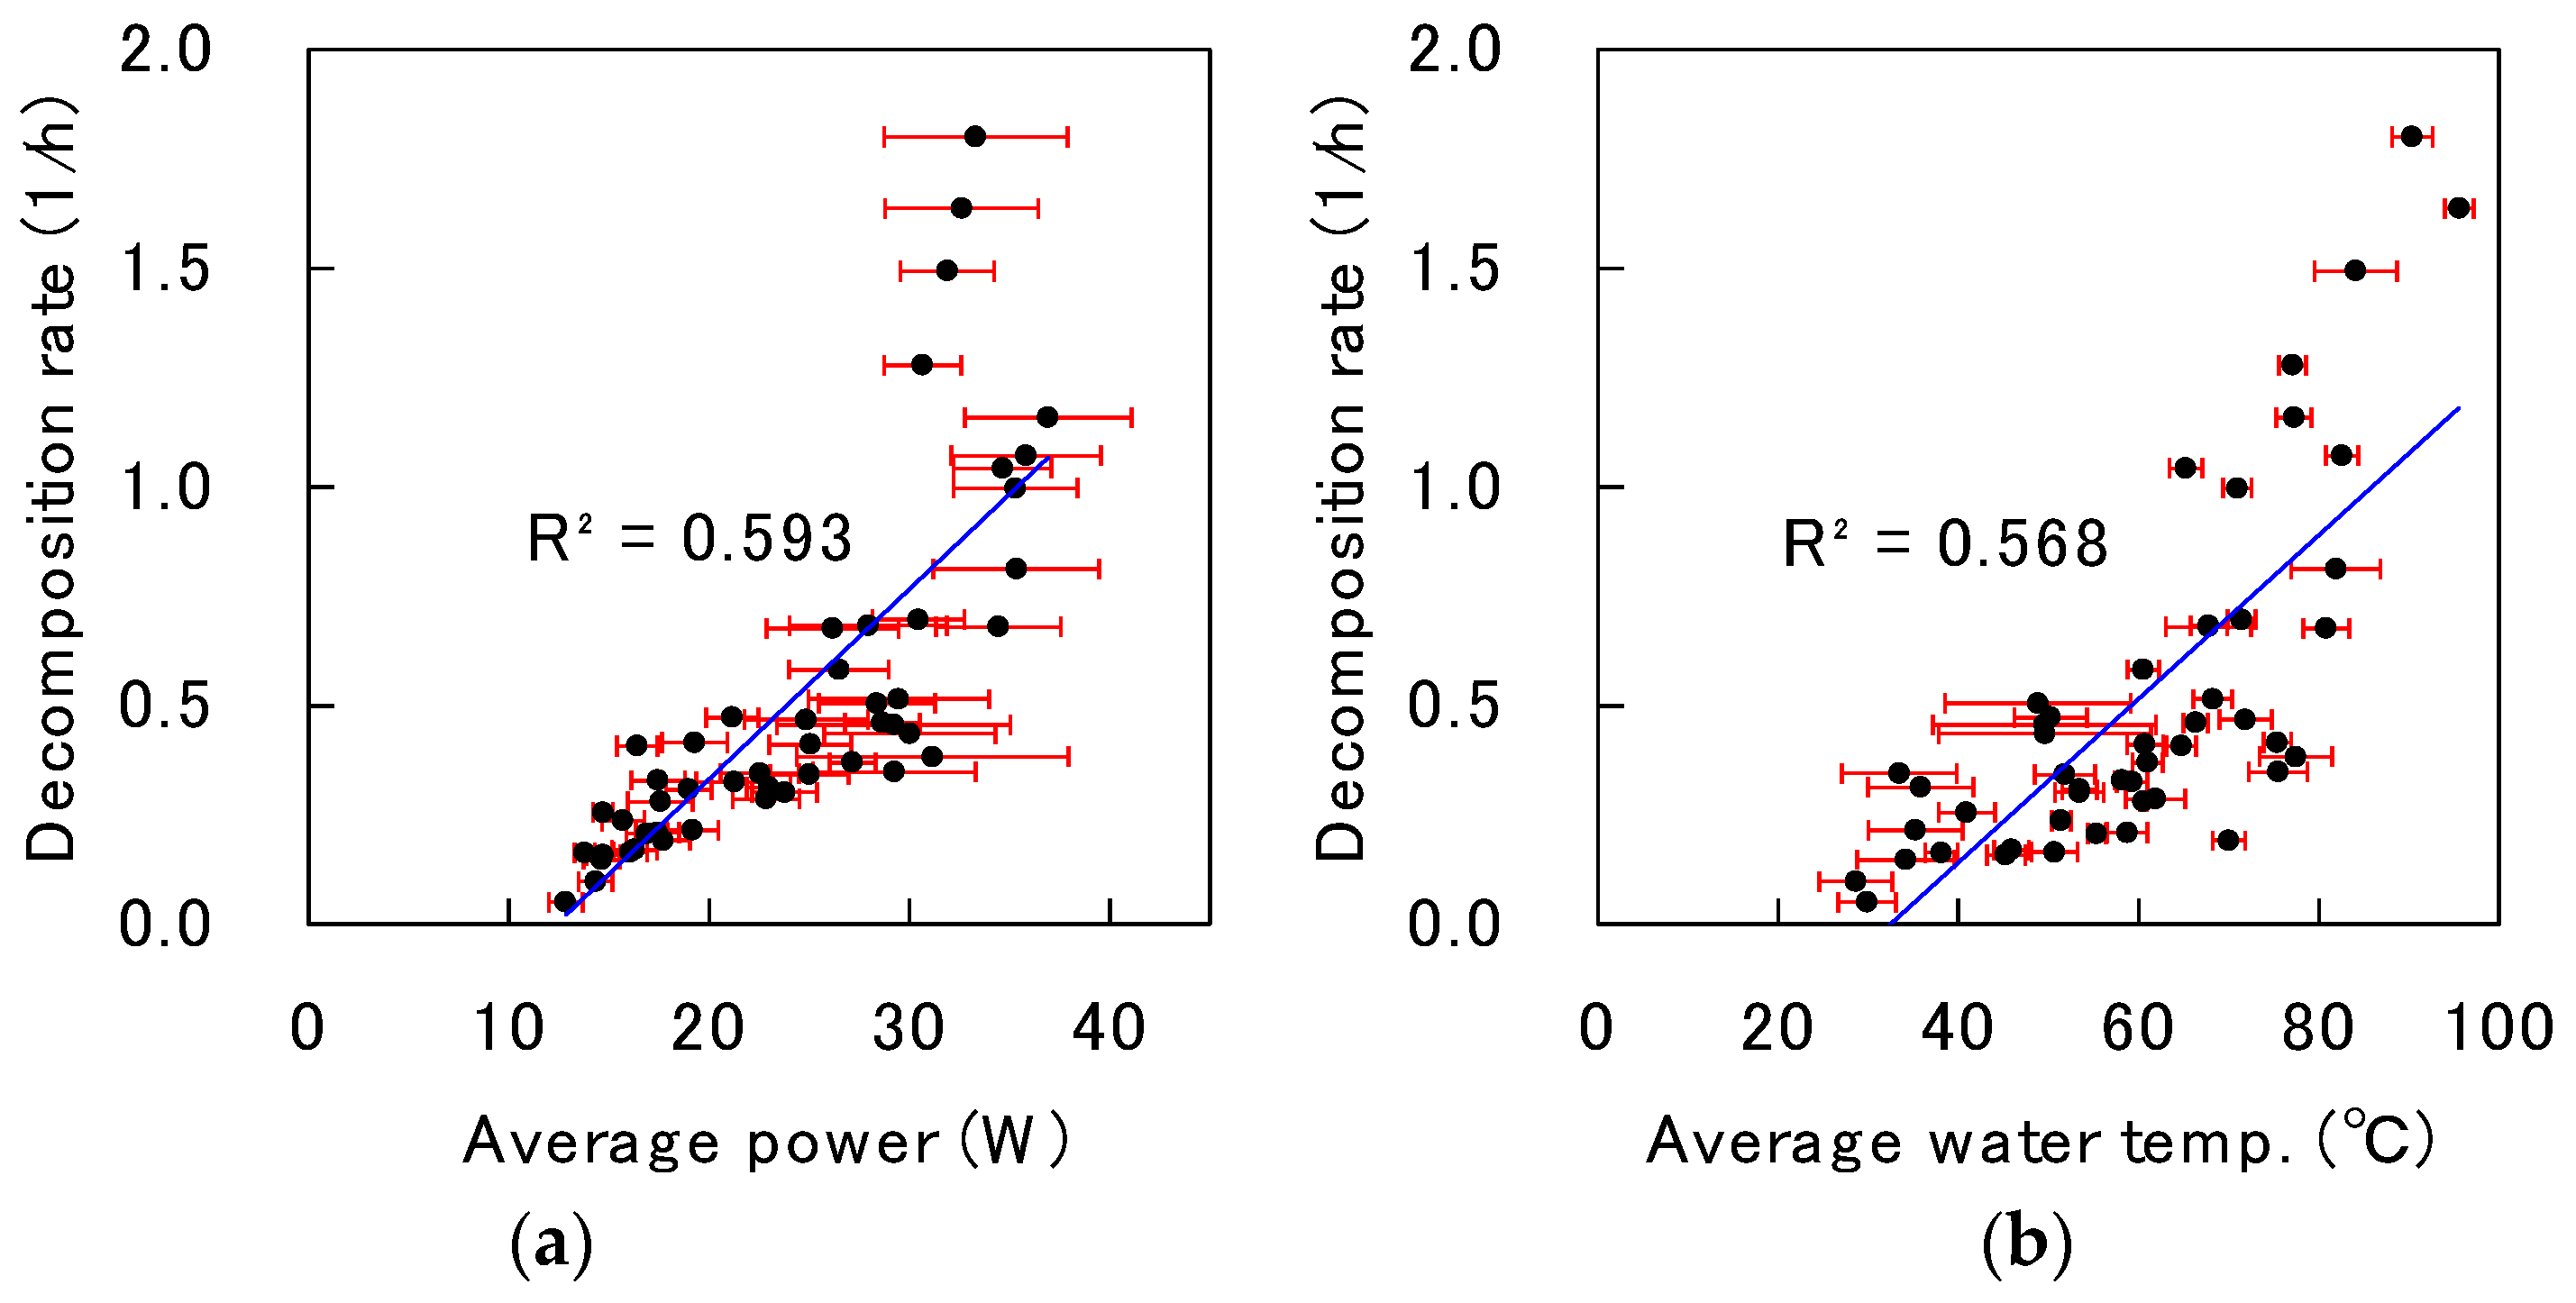
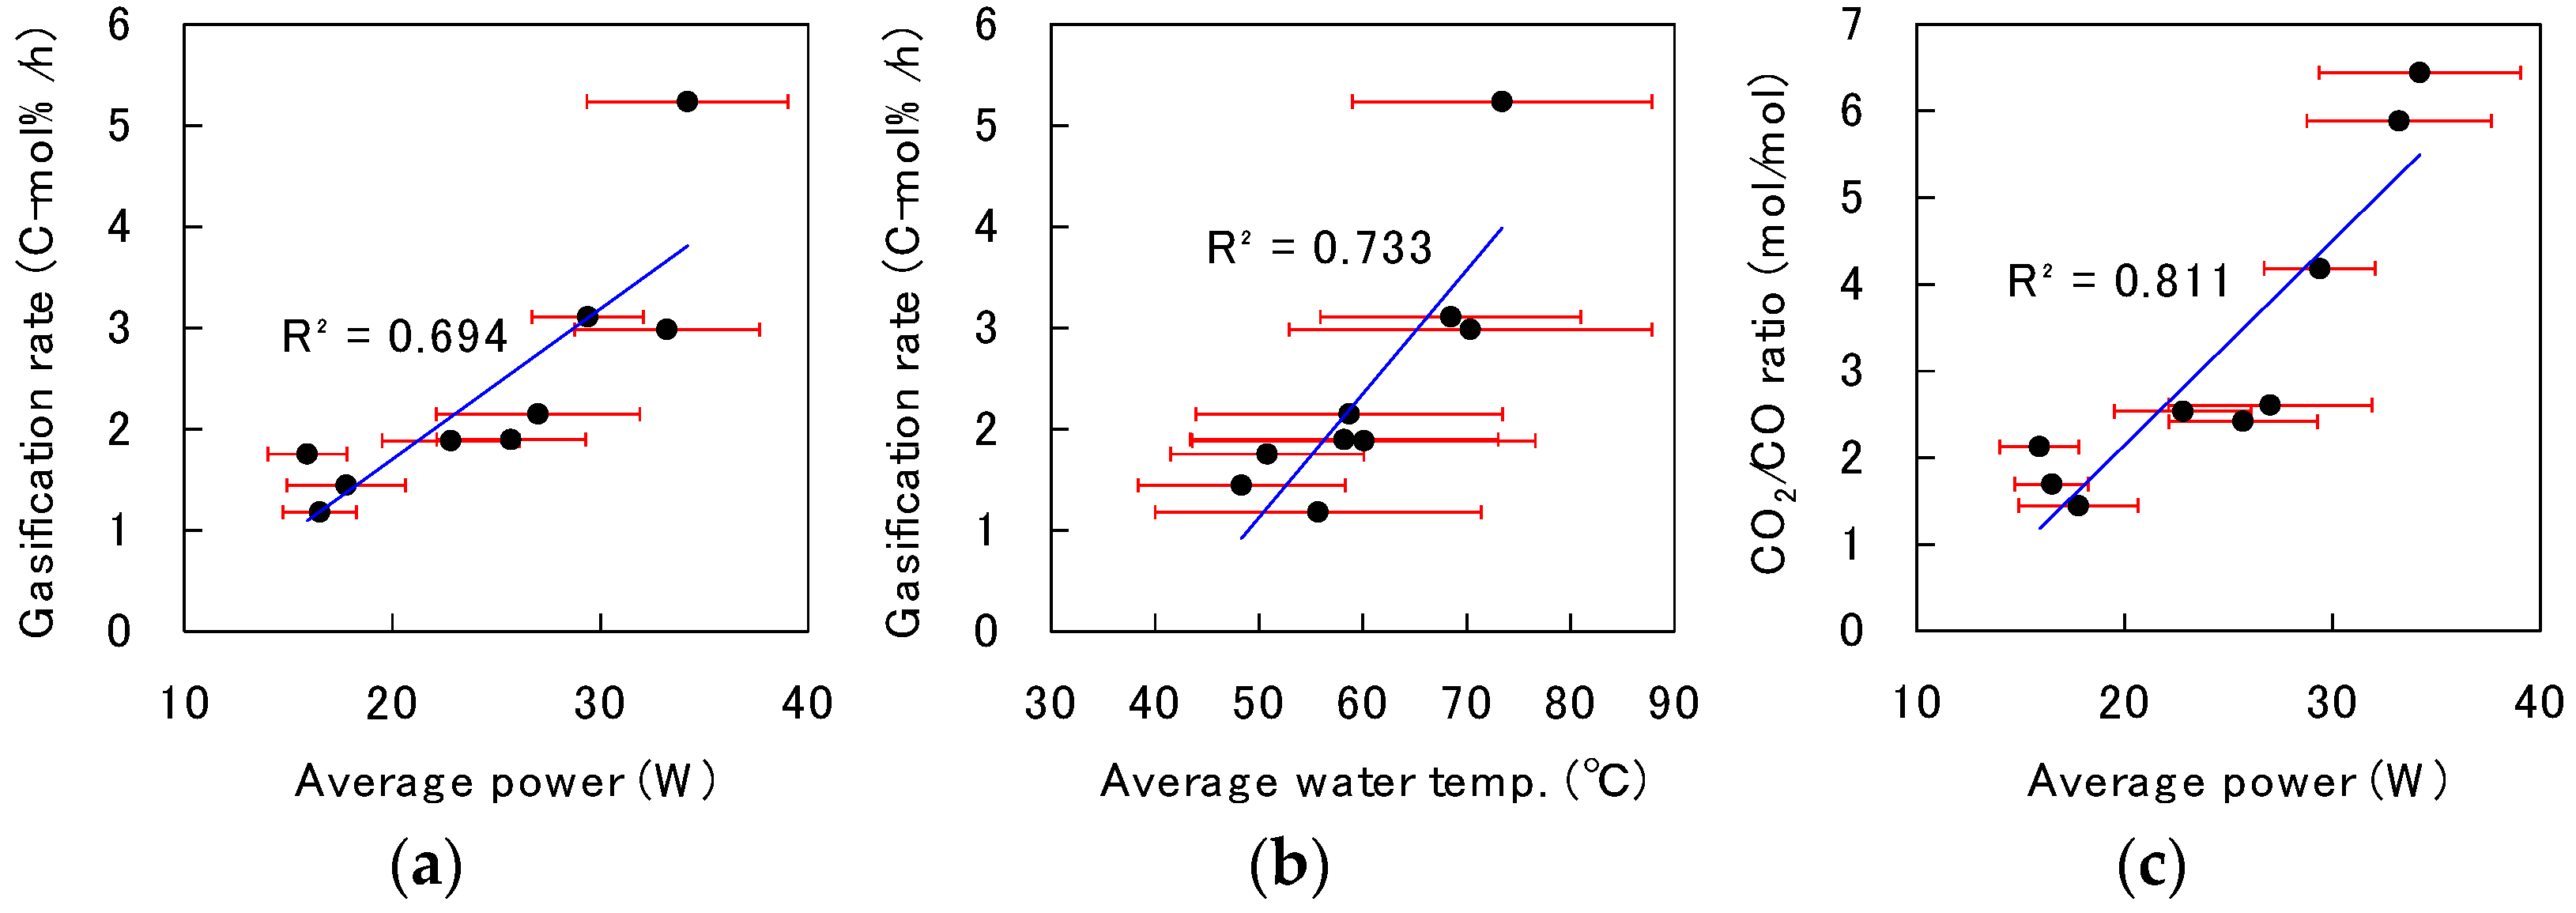
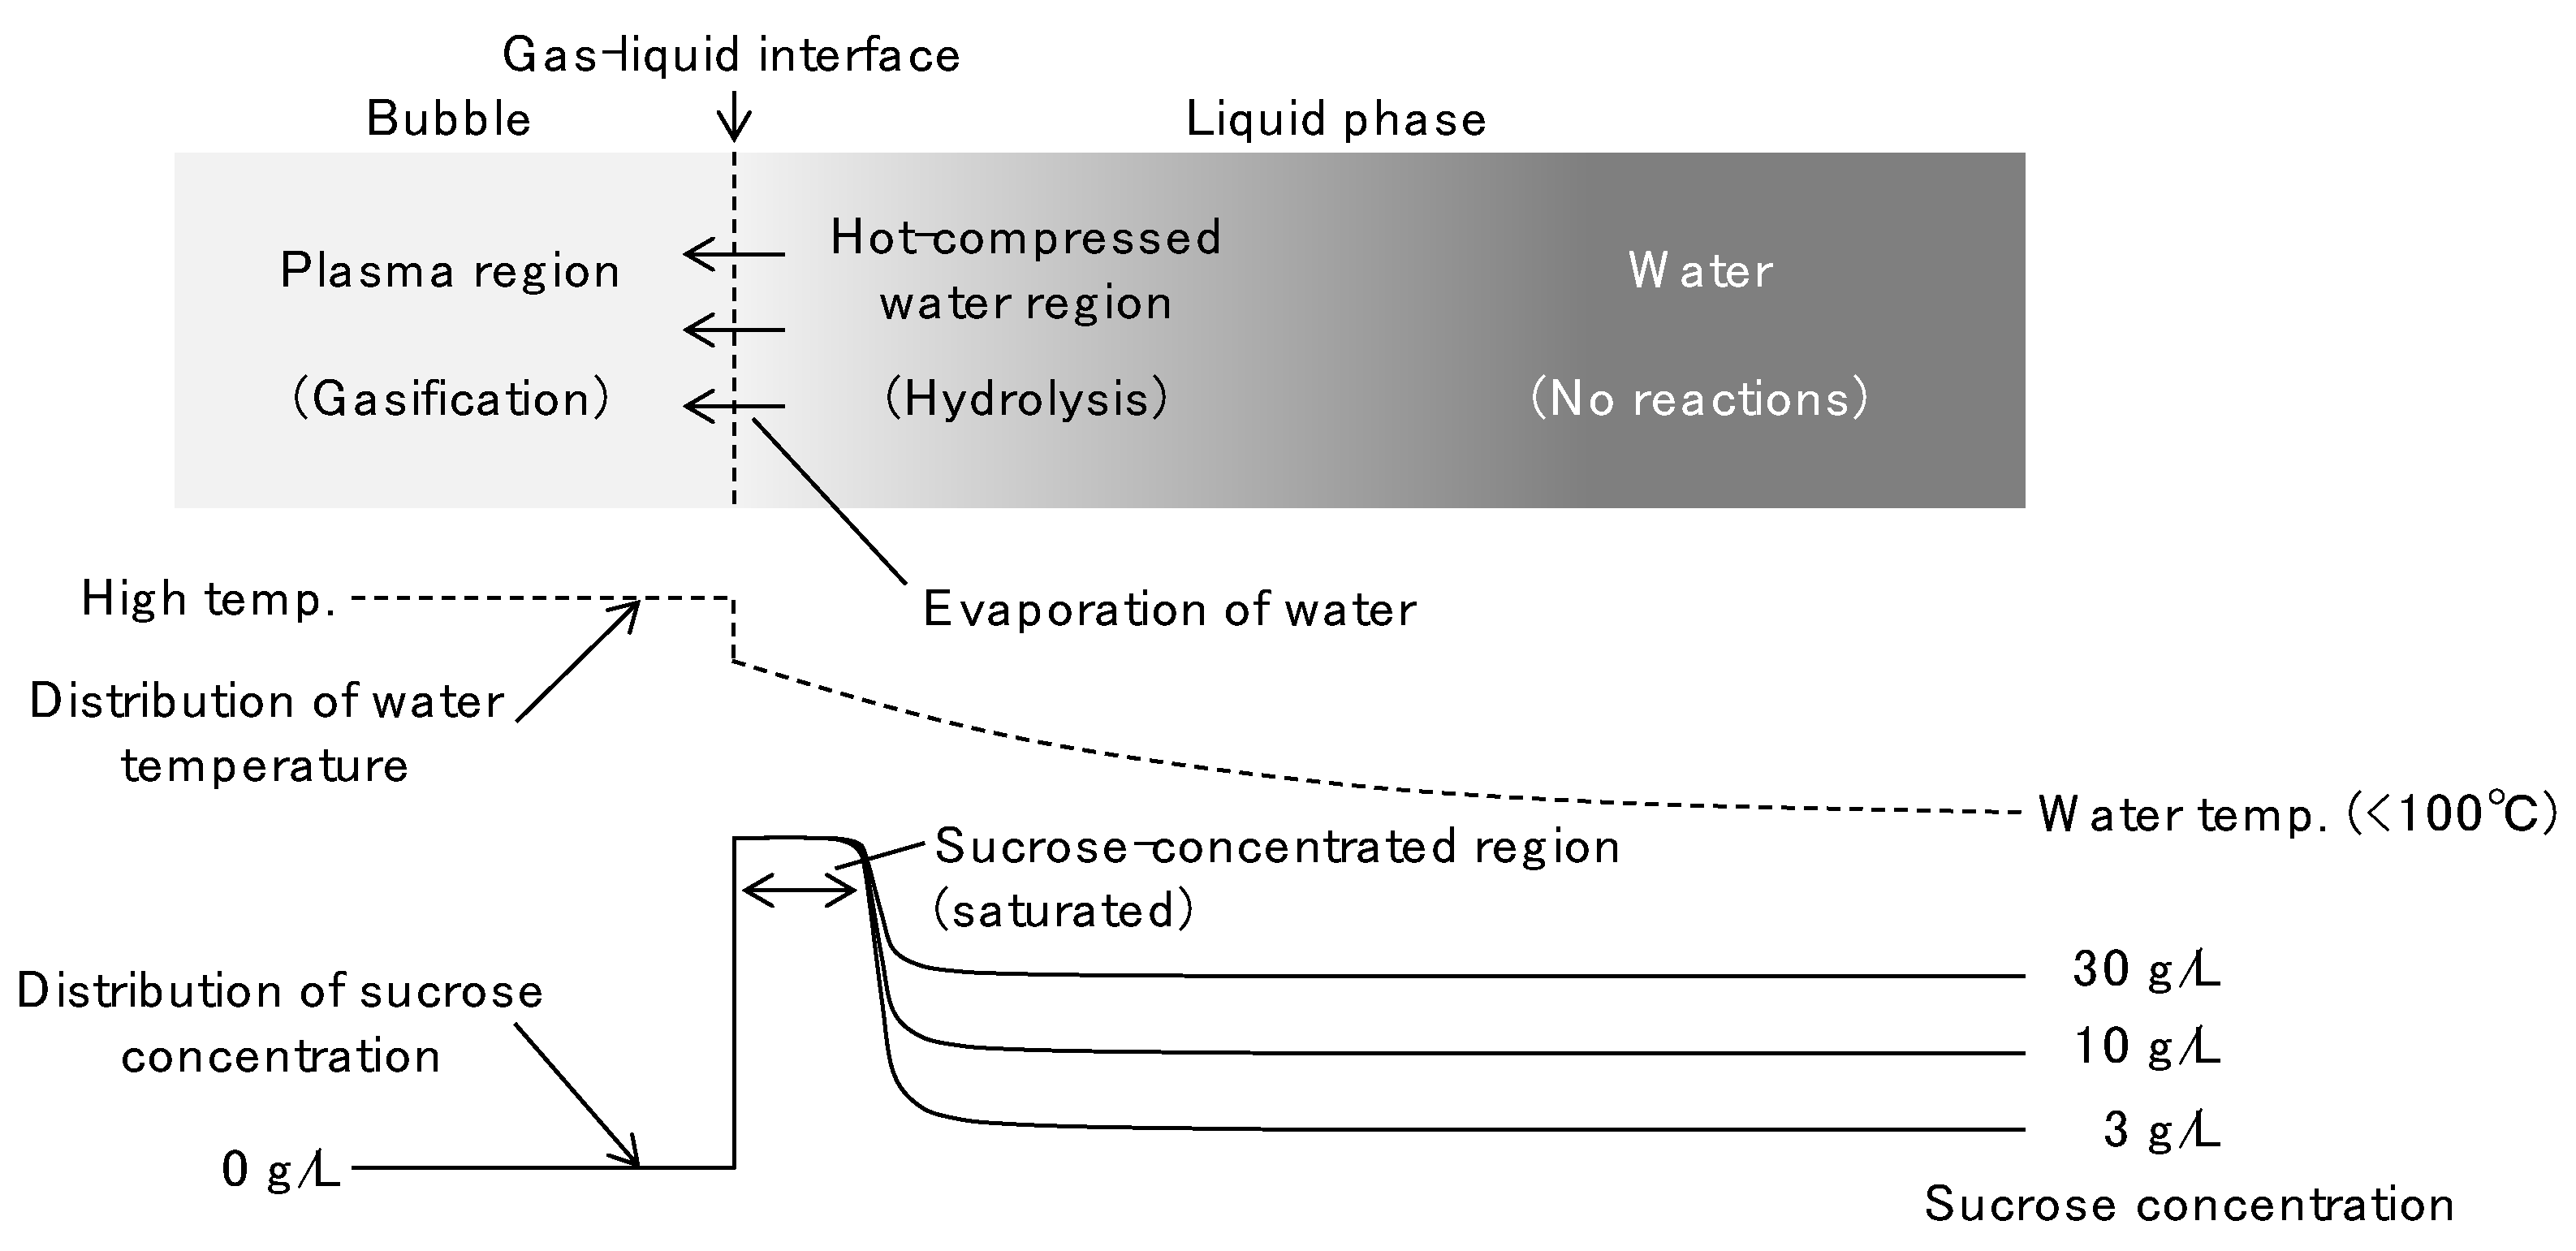
3.3. Discussion of the Decomposition Behavior in Solution Plasma

The degradation behavior of sucrose in solution plasma proposed from the experimental results is shown in Figure 9, which includes a one-dimensional diagram near the boundary between the gas phase (plasma region) and the liquid phase, and the inferred distributions of the temperature and sucrose concentration.
The plasma region is locally very hot, and the temperature of the immediate liquid phase is also relatively high. Farther from the bubble, the temperature decreases to the water temperature. In this system, gasification is expected to occur in or very near the plasma region. Because non-volatile sucrose can hardly volatilize into the plasma region (i.e., the sucrose concentration is zero), gasification can only occur at the gas–liquid interface. In addition, as the bubble expands owing to the successive volatilization of water, the water around the bubble could become locally pressurized. Hydrolysis of sucrose probably mainly occurs in such hot-compressed water regions. By hot-compressed water treatment at 170 °C in a 5-mL pressure-resistant reaction vessel, we confirmed that hydrolysis of sucrose was almost complete in 15 min. Because the region where hydrolysis is possible expands as the water temperature increases, there is a clear relationship between the degradation rate of sucrose and the water temperature (Table 3).
Regarding the sucrose-concentration dependence in Figure 6, sucrose may be locally concentrated near the gas–liquid interface owing to the successive evaporation of water, resulting in a saturated sucrose concentration. Because the sucrose concentration at the gas–liquid interface, where gasification occurs, is constant at the saturated sucrose concentration, it is considered that the gas yield is almost constant, regardless of the overall sucrose concentration. In addition, because hydrolysis occurs in the entire hot-compressed water region, including this saturated region, the hydrolysis behavior is intermediate between a first-order reaction and a zero-order reaction.

4. Conclusions

In this study, we found that in the solution-plasma treatment of sucrose, hydrolysis and gasification occurred. The former was mainly affected by the water temperature, and the latter was mainly affected by the discharge power. Therefore, it was presumed that hydrolysis occurred in the hot-compressed water region around the plasma area and gasification occurred at the gas–liquid interface in contact with the plasma.
High-volatility alcohols, such as methanol and ethanol, were gasified efficiently to produce mainly H2 and CO, while gasification was slow for low-volatility alcohols and non-volatile saccharides. This may be because gasification of the low-volatility substances only occurred at the gas–liquid interface. In such samples, CO2 increased instead of CO, and H2-rich gas was produced, possibly because of the water–gas shift reaction as gasification occurred in a water-rich environment. The gas yield from sucrose was independent of the sucrose concentration, which may be because the concentration of sucrose was saturated at the gas–liquid interface owing to the evaporation of water.
In this study, H2-rich gas was produced from saccharides without carbonized products by solution-plasma treatment, but the gasification rate was slow. Therefore, to efficiently produce H2 from biomass-derived saccharides by solution-plasma treatment, it is necessary to develop methods to accelerate the gasification reaction.

Author Contributions

Conceptualization, E.M.; data curation, E.M.; funding acquisition, E.M. and H.K.; investigation, E.M. and T.M.; methodology, E.M. and H.K.; project administration, E.M. and H.K.; resources, E.M. and H.K.; supervision, E.M.; validation, E.M. and T.M.; visualization, E.M.; writing—original draft, E.M. and T.M.; writing—review and editing, E.M. All authors have read and agreed to the published version of the manuscript.

Funding

This research was funded by the JST-Mirai Program, grant number JPMJMI20E3, Japan.

Institutional Review Board Statement

Not applicable.

Informed Consent Statement

Not applicable.

Conflicts of Interest

The authors declare no conflict of interest.

Appendix A

Examples of the current–voltage waveforms of a single-pulse discharge are shown in Figure A1. Because the magnetic leakage transformer of the high-voltage pulse power supply had a constant-current characteristic, the current waveform changed little when the distance between the electrodes was changed. The voltage during discharge increased with increasing electrode distance, and thus the discharge power (the product of the current and voltage) increased. The pulse width was set to 0.8 μs, which is the on-time of the full-bridge circuit inside the power supply and corresponds to the time from zero current to the peak current. The total width of the current waveform was approximately twice the pulse width, as shown in Figure A1.
Figure A1. Current–voltage waveforms of one-pulse discharge for various electrode distances D.
Hydrogen 03 00020 g0a1

Appendix B

Examples of the changes in the discharge power and water temperature during solution-plasma treatment are shown in Figure A2. The discharge power is the average of 20 single-pulse power values recorded once per second, and the upper and lower error bars indicate the sample standard deviation. The water temperature gradually increased from room temperature, and it sometimes reached close to the boiling point of water when the discharge power was high. The discharge power tended to slightly increase with increasing water temperature. This was probably due to the increased volatilization of water. The fluctuations in the power were small, but when the water temperature increased to some extent, the bubbles tended to actively move, and the fluctuations in the single-pulse power tended to increase, as shown in Figure A2c.
Figure A2. Changes in the discharge power and water temperature for various electrode distances, D, with circulation cooling by room-temperature water.
Hydrogen 03 00020 g0a2

Appendix C

When the plasma reactor was filled with the solution, the total free space in the reactor and silicone tube was 44 mL. Before plasma treatment (Figure A3a), this space was purged with Ar and the gasbag was empty. After treatment (Figure A3b), the product gases (mainly H2, O2, CO, and CO2) were distributed into the gasbag and the free space (Xg and Xf mL, respectively) along with Ar (Yg and Yf mL, respectively). After the gas composition was equilibrated, the following equations hold:
Y g + Y f = 44   mL ,   Y f + X f = 44   mL ,   and   X g Y g = X f Y f
Then, the total amount of product gases (Xg + Xf) is derived as:
X g + X f = X g + X g 2 + 4   ×   44 X g 2
Based on the amount of product gases in the gasbag, Xg, determined by micro-GC analysis, the total amount of product gases was evaluated using Equation (A2) and reported.
Figure A3. Schematic diagram of the reactor and gasbag (a) before and (b) after solution-plasma treatment.
Hydrogen 03 00020 g0a3

Appendix D

The volumes of H2 and CO2 produced by the solution-plasma treatment of only aqueous NaCl solutions are given in Table A1. The changes in the power and water temperature for each electrode distance correspond to those in Appendix B. Non-negligible amounts of H2 were produced from water, and the yield increased slightly with the electrode distance. The H2 yield must be discussed considering this water-derived H2. In addition, because the water used was pre-degassed, very little CO2 was produced, and it was negligible compared with the volumes of CO2 produced from the saccharides and alcohols.
Table A1. Product gas yields * from solution-plasma treatment of 100 mL NaCl solution (0.1 g/L) at various electrode distances for 30 min **.
Electrode Distance D, mm0.71.11.8
H2, mL3.7 11.616.9
CO2, mL0.0110.0140.023
* The CO2 yield was corrected by subtracting air-derived CO2. ** The solution was cooled with room-temperature water during treatment.

References

  1. Abe, J.O.; Popoola, A.; Ajenifuja, E.; Popoola, O. Hydrogen energy, economy and storage: Review and recommendation. Int. J. Hydrog. Energy 2019, 44, 15072–15086. [Google Scholar] [CrossRef]
  2. Kumar, S.S.; Himabindu, V. Hydrogen production by PEM water electrolysis—A review. Mater. Sci. Energy Technol. 2019, 2, 442–454. [Google Scholar]
  3. Chi, J.; Yu, H. Water electrolysis based on renewable energy for hydrogen production. Chin. J. Catal. 2018, 39, 390–394. [Google Scholar] [CrossRef]
  4. Sanchez, N.; Ruiz, R.; Hacker, V.; Cobo, M. Impact of bioethanol impurities on steam reforming for hydrogen production: A review. Int. J. Hydrog. Energy 2020, 45, 11923–11942. [Google Scholar] [CrossRef]
  5. Cao, L.; Iris, K.; Xiong, X.; Tsang, D.C.; Zhang, S.; Clark, J.H.; Hu, C.; Ng, Y.H.; Shang, J.; Ok, Y.S. Biorenewable hydrogen production through biomass gasification: A review and future prospects. Environ. Res. 2020, 186, 109547. [Google Scholar] [CrossRef]
  6. REN21. Renewables 2022 Global Status Report; REN21: Paris, France, 2022; pp. 1–312. [Google Scholar]
  7. Esmaeili, S.A.H.; Sobhani, A.; Szmerekovsky, J.; Dybing, A.; Pourhashem, G. First-generation vs. second-generation: A market incentives analysis for bioethanol supply chains with carbon policies. Appl. Energy 2020, 277, 115606. [Google Scholar] [CrossRef]
  8. Whittaker, R.H. Communities and Ecosystems, 2nd ed.; The Macmillan Company: New York, NY, USA, 1975; pp. 1–352. [Google Scholar]
  9. Lee, Y.; Iyer, P.; Torget, R.W. Dilute-acid hydrolysis of lignocellulosic biomass. Recent Prog. Bioconversion Lignocellul. 1999, 65, 93–115. [Google Scholar]
  10. Khare, S.K.; Pandey, A.; Larroche, C. Current perspectives in enzymatic saccharification of lignocellulosic biomass. Biochem. Eng. J. 2015, 102, 38–44. [Google Scholar] [CrossRef]
  11. Abdullah, R.; Ueda, K.; Saka, S. Hydrothermal decomposition of various crystalline celluloses as treated by semi-flow hot-compressed water. J. Wood Sci. 2014, 60, 278–286. [Google Scholar] [CrossRef]
  12. Ayodele, B.V.; Alsaffar, M.A.; Mustapa, S.I. An overview of integration opportunities for sustainable bioethanol production from first-and second-generation sugar-based feedstocks. J. Clean. Prod. 2020, 245, 118857. [Google Scholar] [CrossRef]
  13. Sjulander, N.; Kikas, T. Origin, impact and control of lignocellulosic inhibitors in bioethanol production—A review. Energies 2020, 13, 4751. [Google Scholar] [CrossRef]
  14. Sikarwar, V.S.; Zhao, M.; Clough, P.; Yao, J.; Zhong, X.; Memon, M.Z.; Shah, N.; Anthony, E.J.; Fennell, P.S. An overview of advances in biomass gasification. Energy Environ. Sci. 2016, 9, 2939–2977. [Google Scholar] [CrossRef]
  15. Molino, A.; Chianese, S.; Musmarra, D. Biomass gasification technology: The state of the art overview. J. Energy Chem. 2016, 25, 10–25. [Google Scholar] [CrossRef]
  16. Piel, A.; Brown, M. Plasma physics: An introduction to laboratory, space, and fusion plasmas. Phys. Today 2011, 64, 55. [Google Scholar]
  17. Konno, K.; Onodera, H.; Murata, K.; Onoe, K.; Yamaguchi, T. Comparison of cellulose decomposition by microwave plasma and radio frequency plasma. Green Sustain. Chem. 2011, 1, 85–91. [Google Scholar] [CrossRef]
  18. Vecten, S.; Wilkinson, M.; Bimbo, N.; Dawson, R.; Herbert, B.M. Hydrogen-rich syngas production from biomass in a steam microwave-induced plasma gasification reactor. Bioresour. Technol. 2021, 337, 125324. [Google Scholar] [CrossRef]
  19. Sasujit, K.; Dussadee, N.; Tippayawong, N. Overview of tar reduction in biomass-derived producer gas using non-thermal plasma discharges. Maejo Int. J. Sci. Technol. 2019, 13, 42–61. [Google Scholar]
  20. Hlina, M.; Hrabovský, M.; Kopecký, V.; Konrad, M.; Kavka, T.; Skoblja, S. Plasma gasification of wood and production of gas with low content of tar. Czechoslov. J. Phys. 2006, 56, B1179–B1184. [Google Scholar] [CrossRef]
  21. Takai, O. Solution plasma processing (SPP). Pure Appl. Chem. 2008, 80, 2003–2011. [Google Scholar] [CrossRef]
  22. MubarakAli, D.; Park, J.; Han, T.; Srinivasan, H.; Lee, S.-Y.; Kim, J.-W. Solution plasma process: An option to degrade bisphenol A in liquid-phase to non-toxic products. J. Mol. Liq. 2019, 276, 605–610. [Google Scholar] [CrossRef]
  23. Chokradjaroen, C.; Wang, X.; Niu, J.; Fan, T.; Saito, N. Fundamentals of solution plasma for advanced materials synthesis. Mater. Today Adv. 2022, 14, 100244. [Google Scholar] [CrossRef]
  24. Dithi, A.B.; Nezu, T.; Nagano-Takebe, F.; Hasan, M.R.; Saito, T.; Endo, K. Application of solution plasma surface modification technology to the formation of thin hydroxyapatite film on titanium implants. Coatings 2018, 9, 3. [Google Scholar] [CrossRef]
  25. Prasertsung, I.; Chutinate, P.; Watthanaphanit, A.; Saito, N.; Damrongsakkul, S. Conversion of cellulose into reducing sugar by solution plasma process (SPP). Carbohydr. Polym. 2017, 172, 230–236. [Google Scholar] [CrossRef]
  26. Prasertsung, I.; Aroonraj, K.; Kamwilaisak, K.; Saito, N.; Damrongsakkul, S. Production of reducing sugar from cassava starch waste (CSW) using solution plasma process (SPP). Carbohydr. Polym. 2019, 205, 472–479. [Google Scholar] [CrossRef]
  27. Lee, H.; Park, Y.-K. Hydrogen production from a solution plasma process of bio-oil. Int. J. Hydrog. Energy 2020, 45, 20210–20215. [Google Scholar] [CrossRef]
  28. Tange, K.; Nomura, S.; Mukasa, S.; Kitahara, T. Cellulose decomposition in electrolytic solution using in-liquid plasma method. J. Jpn. Inst. Energy 2019, 98, 265–271. [Google Scholar] [CrossRef]
  29. Syahrial, F.; Mukasa, S.; Toyota, H.; Okamoto, K.; Nomura, S. Hydrogen production from glucose and cellulose using radio frequency in-liquid plasma and ultrasonic irradiation. J. Jpn. Inst. Energy 2014, 93, 1207–1212. [Google Scholar] [CrossRef]
  30. Ismail, R.; Nomura, S.; Mukasa, S.; Toyoda, H. Fuel gas production from biomass sources by radio frequency in-liquid plasma method. J. Power Energy Eng. 2015, 3, 28–35. [Google Scholar]
  31. Phaiboonsilpa, N.; Yamauchi, K.; Lu, X.; Saka, S. Two-step hydrolysis of Japanese cedar as treated by semi-flow hot-compressed water. J. Wood Sci. 2010, 56, 331–338. [Google Scholar] [CrossRef]
  32. Nomura, T.; Mizuno, H.; Minami, E.; Kawamoto, H. Fast pyrolysis of cellulose by infrared heating. Energies 2021, 14, 1842. [Google Scholar] [CrossRef]
  33. Gao, D.; Kobayashi, T.; Adachi, S. Kinetics of sucrose hydrolysis in a subcritical water-ethanol mixture. J. Appl. Glycosci. 2013, 61, 9–13. [Google Scholar] [CrossRef]
Figure 1. Schematic diagram of the reactor and the mechanism of solution-plasma generation.
Hydrogen 03 00020 g001
Figure 2. Products in the sample solutions after solution-plasma treatment of sucrose (sucrose, 10 g/L; electrode distance, 2.4 mm; average power, 34.2 W). (a) HPAEC chromatograms. (b) Product yields based on the moles of carbon atoms in the initial sucrose.
Hydrogen 03 00020 g002
Figure 3. Sucrose recovery after solution-plasma treatment of sucrose (10 g/L) for various electrode distances, D, and cooling methods.
Hydrogen 03 00020 g003
Figure 4. Decomposition rate constant of sucrose (10 g/L) in solution plasma as a function of the (a) average power and (b) average water temperature. Error bars indicate sample standard deviations for power and water temperature distributions.
Hydrogen 03 00020 g004
Figure 5. Gasification rate (the sum of CO and CO2 yields per treatment time) of sucrose treated in solution plasma (10 g/L) as a function of the (a) average power and (b) average temperature. (c) CO2/CO ratio in the product gas as a function of the average power. Error bars indicate sample standard deviations for power and water temperature distributions.
Hydrogen 03 00020 g005
Figure 6. Effect of the sucrose concentration on the (a) amount of sucrose decomposed and (b) gas production in solution-plasma treatment of sucrose for 17 min with an electrode distance of 2.3 mm and circulation cooling with ice water.
Hydrogen 03 00020 g006
Figure 7. Comparison of the gas yields from solution-plasma treatment of various saccharides for 45 min and alcohols and acetone for 30 min (concentration, 10 g/L; electrode distance, 1.2 mm; cooled with room-temperature water; the gas yields are based on the carbon atoms in the initial sample).
Hydrogen 03 00020 g007
Figure 8. Dependence of the (a) total gas yield (excluding H2) and (b) CO2/CO ratio on the boiling point of the sample (constructed from the data in Figure 7).
Hydrogen 03 00020 g008
Figure 9. Possible mechanism of sucrose degradation in solution plasma.
Hydrogen 03 00020 g009
Table 1. Product gas yields after 30 min of solution-plasma treatment of sucrose under the same conditions as those in Figure 2.
H2COCO2 *
Volume (mL)1342.817.8
Yield (C-mol%) **17.10.352.27
* The CO2 yield was corrected by subtracting air-derived CO2. ** The yields are based on the carbon atoms in the initial sucrose. H2 is outside the carbon balance, but it is listed based on its molar ratio to the other gases.
Table 2. Product gas yields after solution-plasma treatment of sucrose (10 g/L) under the same conditions as those in Figure 3.
Entry No.D, mmCooling MethodAverage Power, WAverage Temp., °CTime, minGas Yield, C-mol% *
H2COCO2 **
10.9no cooling16.555.7354.80.260.43
20.8R.T. water15.950.8609.50.561.19
30.7ice water17.848.3609.80.590.85
41.3no cooling22.860.1256.10.220.56
51.5ice water27.058.7307.40.300.78
61.5R.T. water25.758.2256.40.230.56
71.9ice water29.468.5307.50.301.26
82.3ice water33.270.4176.50.120.72
92.4ice water34.273.43017.10.352.27
* The yields are based on the carbon atoms in the initial sucrose. H2 is outside the carbon balance, but it is listed based on its molar ratio to the other gases. ** The CO2 yield was corrected by subtracting air-derived CO2.
Table 3. Summary of the experimental conditions, sucrose recovery, and gas yield (the sum of CO and CO2) for solution-plasma treatment of sucrose (sucrose concentration, 10 g/L; electrode distance, 1.2 mm; cooled with room-temperature water) with continuous and intermittent discharge.
Continuous1 min on/1 min off1 min on/3 min off
Avg. discharge power, W25.226.224.4
Total discharge time, min454545
Total treatment time, min 4590180
Total electric energy, Wh18.919.718.3
Avg. water temp., °C63.747.535.3
Sucrose recovery, C-mol% *46.551.573.4
CO and CO2 yield, C-mol% *1.81.90.2
* The yields are based on the carbon atoms in the initial sucrose.
Publisher’s Note: MDPI stays neutral with regard to jurisdictional claims in published maps and institutional affiliations.

