
Hybrid Renewable Hydrogen Energy Solution for Remote Cold-Climate Open-Pit Mines


Abstract
:1. Introduction
2. Methodology and Assumptions
2.1. Conventional All-Diesel System
Greenhouse Gases Emissions
2.2. All-Renewable System
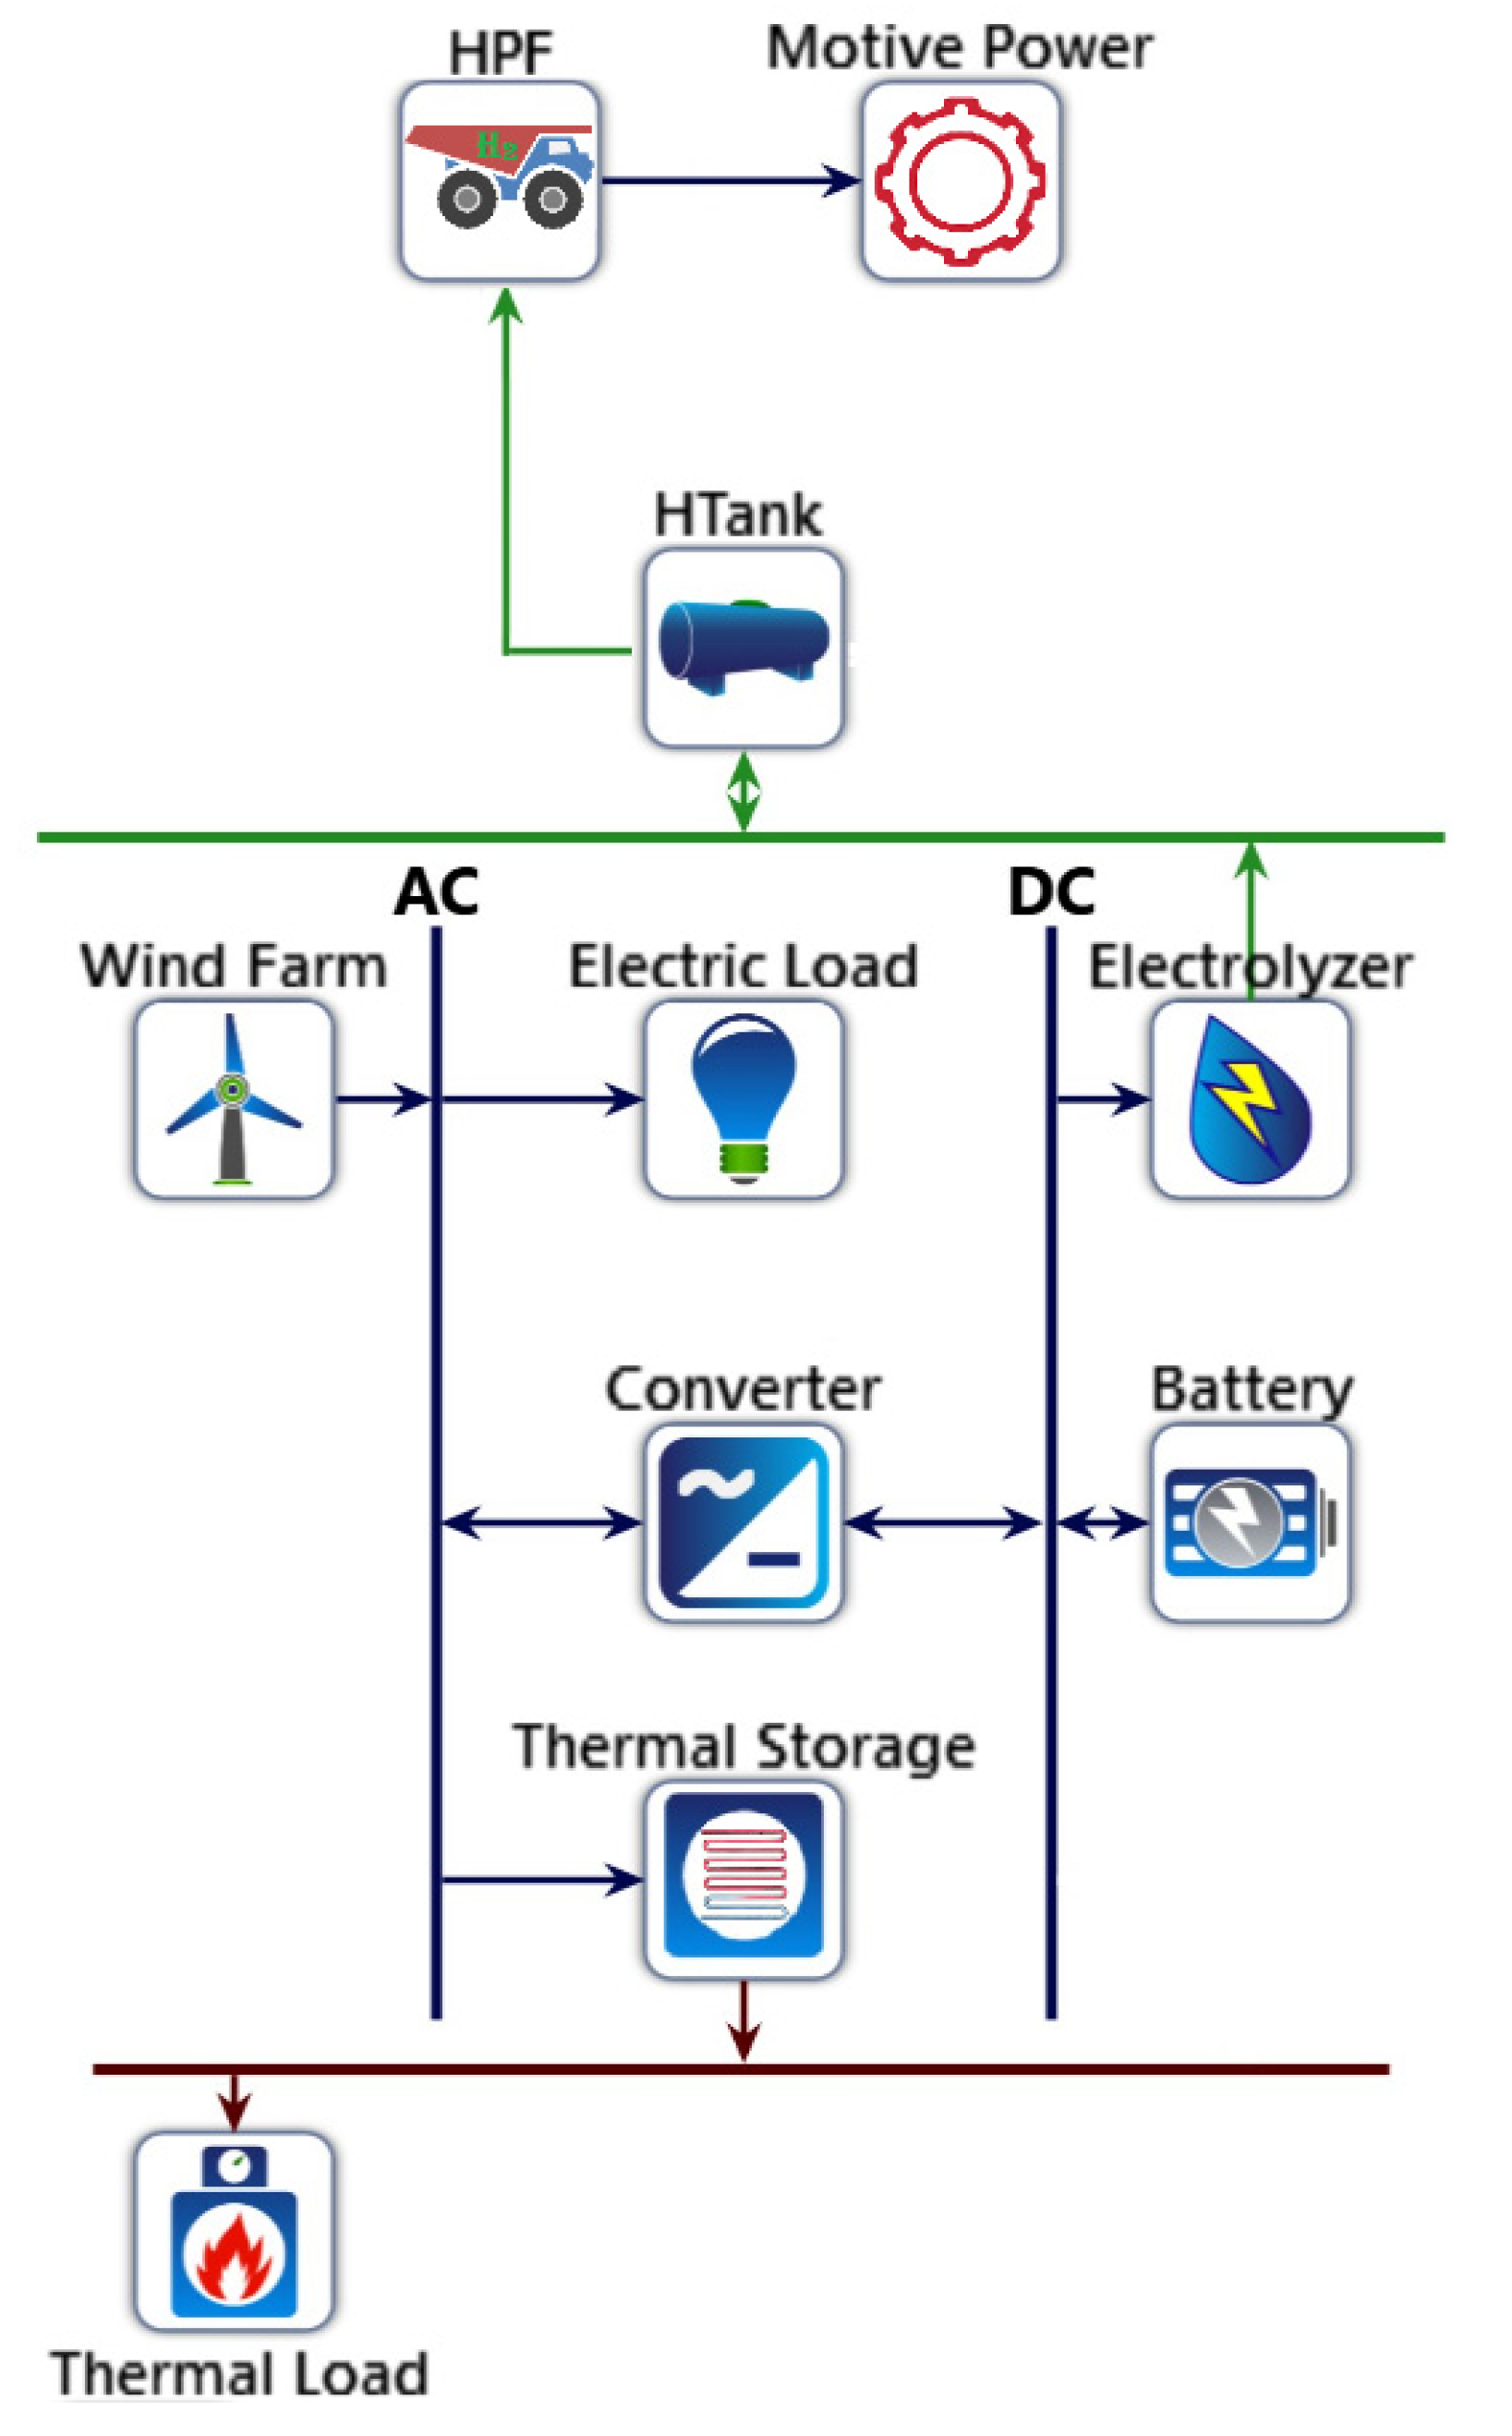
- All-renewable system with hydrogen-powered fleet (HPF) and battery/fc storage configuration (Figure 3):
- Renewable wind generation/Battery/FC system for electrical load
- Hydrogen-powered fleet for haulage equipment
- Electric heater/Thermal storage for thermal load
- All-renewable system with hydrogen-powered fleet (HPF) and battery storage configuration (Figure 4):
- Renewable wind generation/Battery system for electrical load
- Hydrogen-powered fleet for haulage equipment
- Electric heater/Thermal storage for thermal load
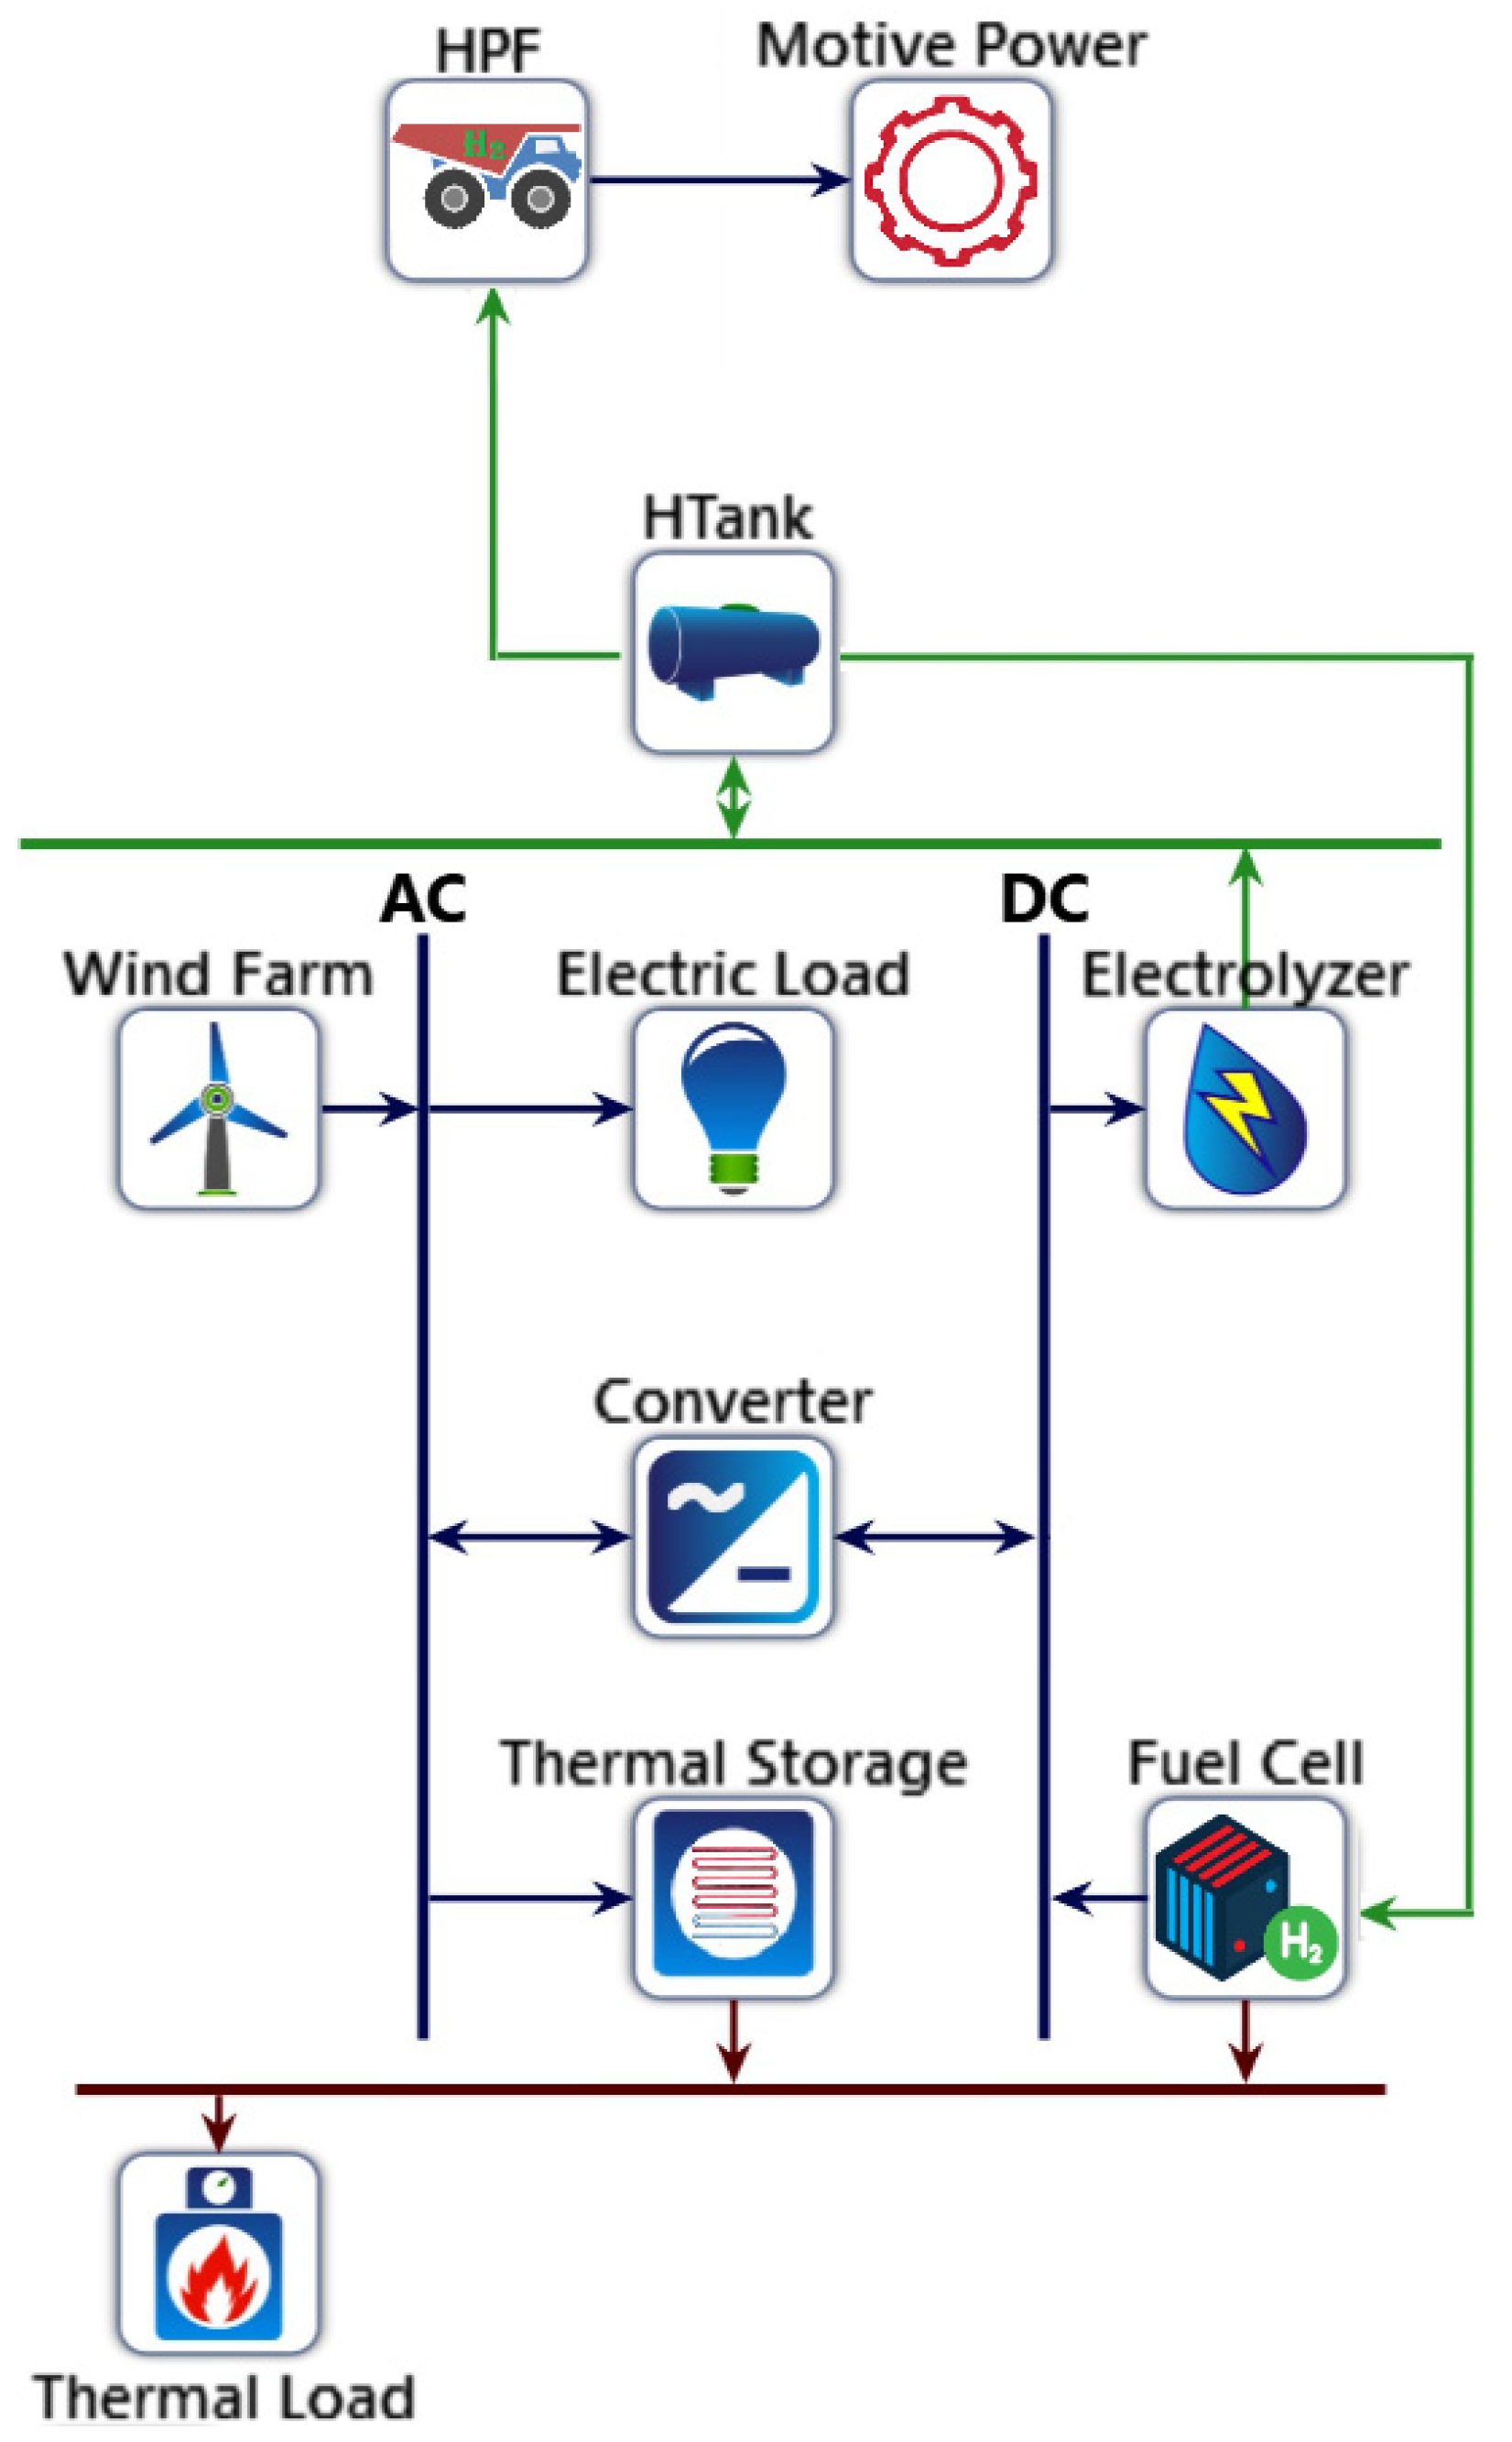
- All-renewable system with hydrogen-powered fleet (HPF) and fc storage configuration (Figure 5):
- Renewable wind generation/FC system for electrical load
- Hydrogen-powered fleet for haulage equipment
- Electric heater/Thermal storage for thermal load
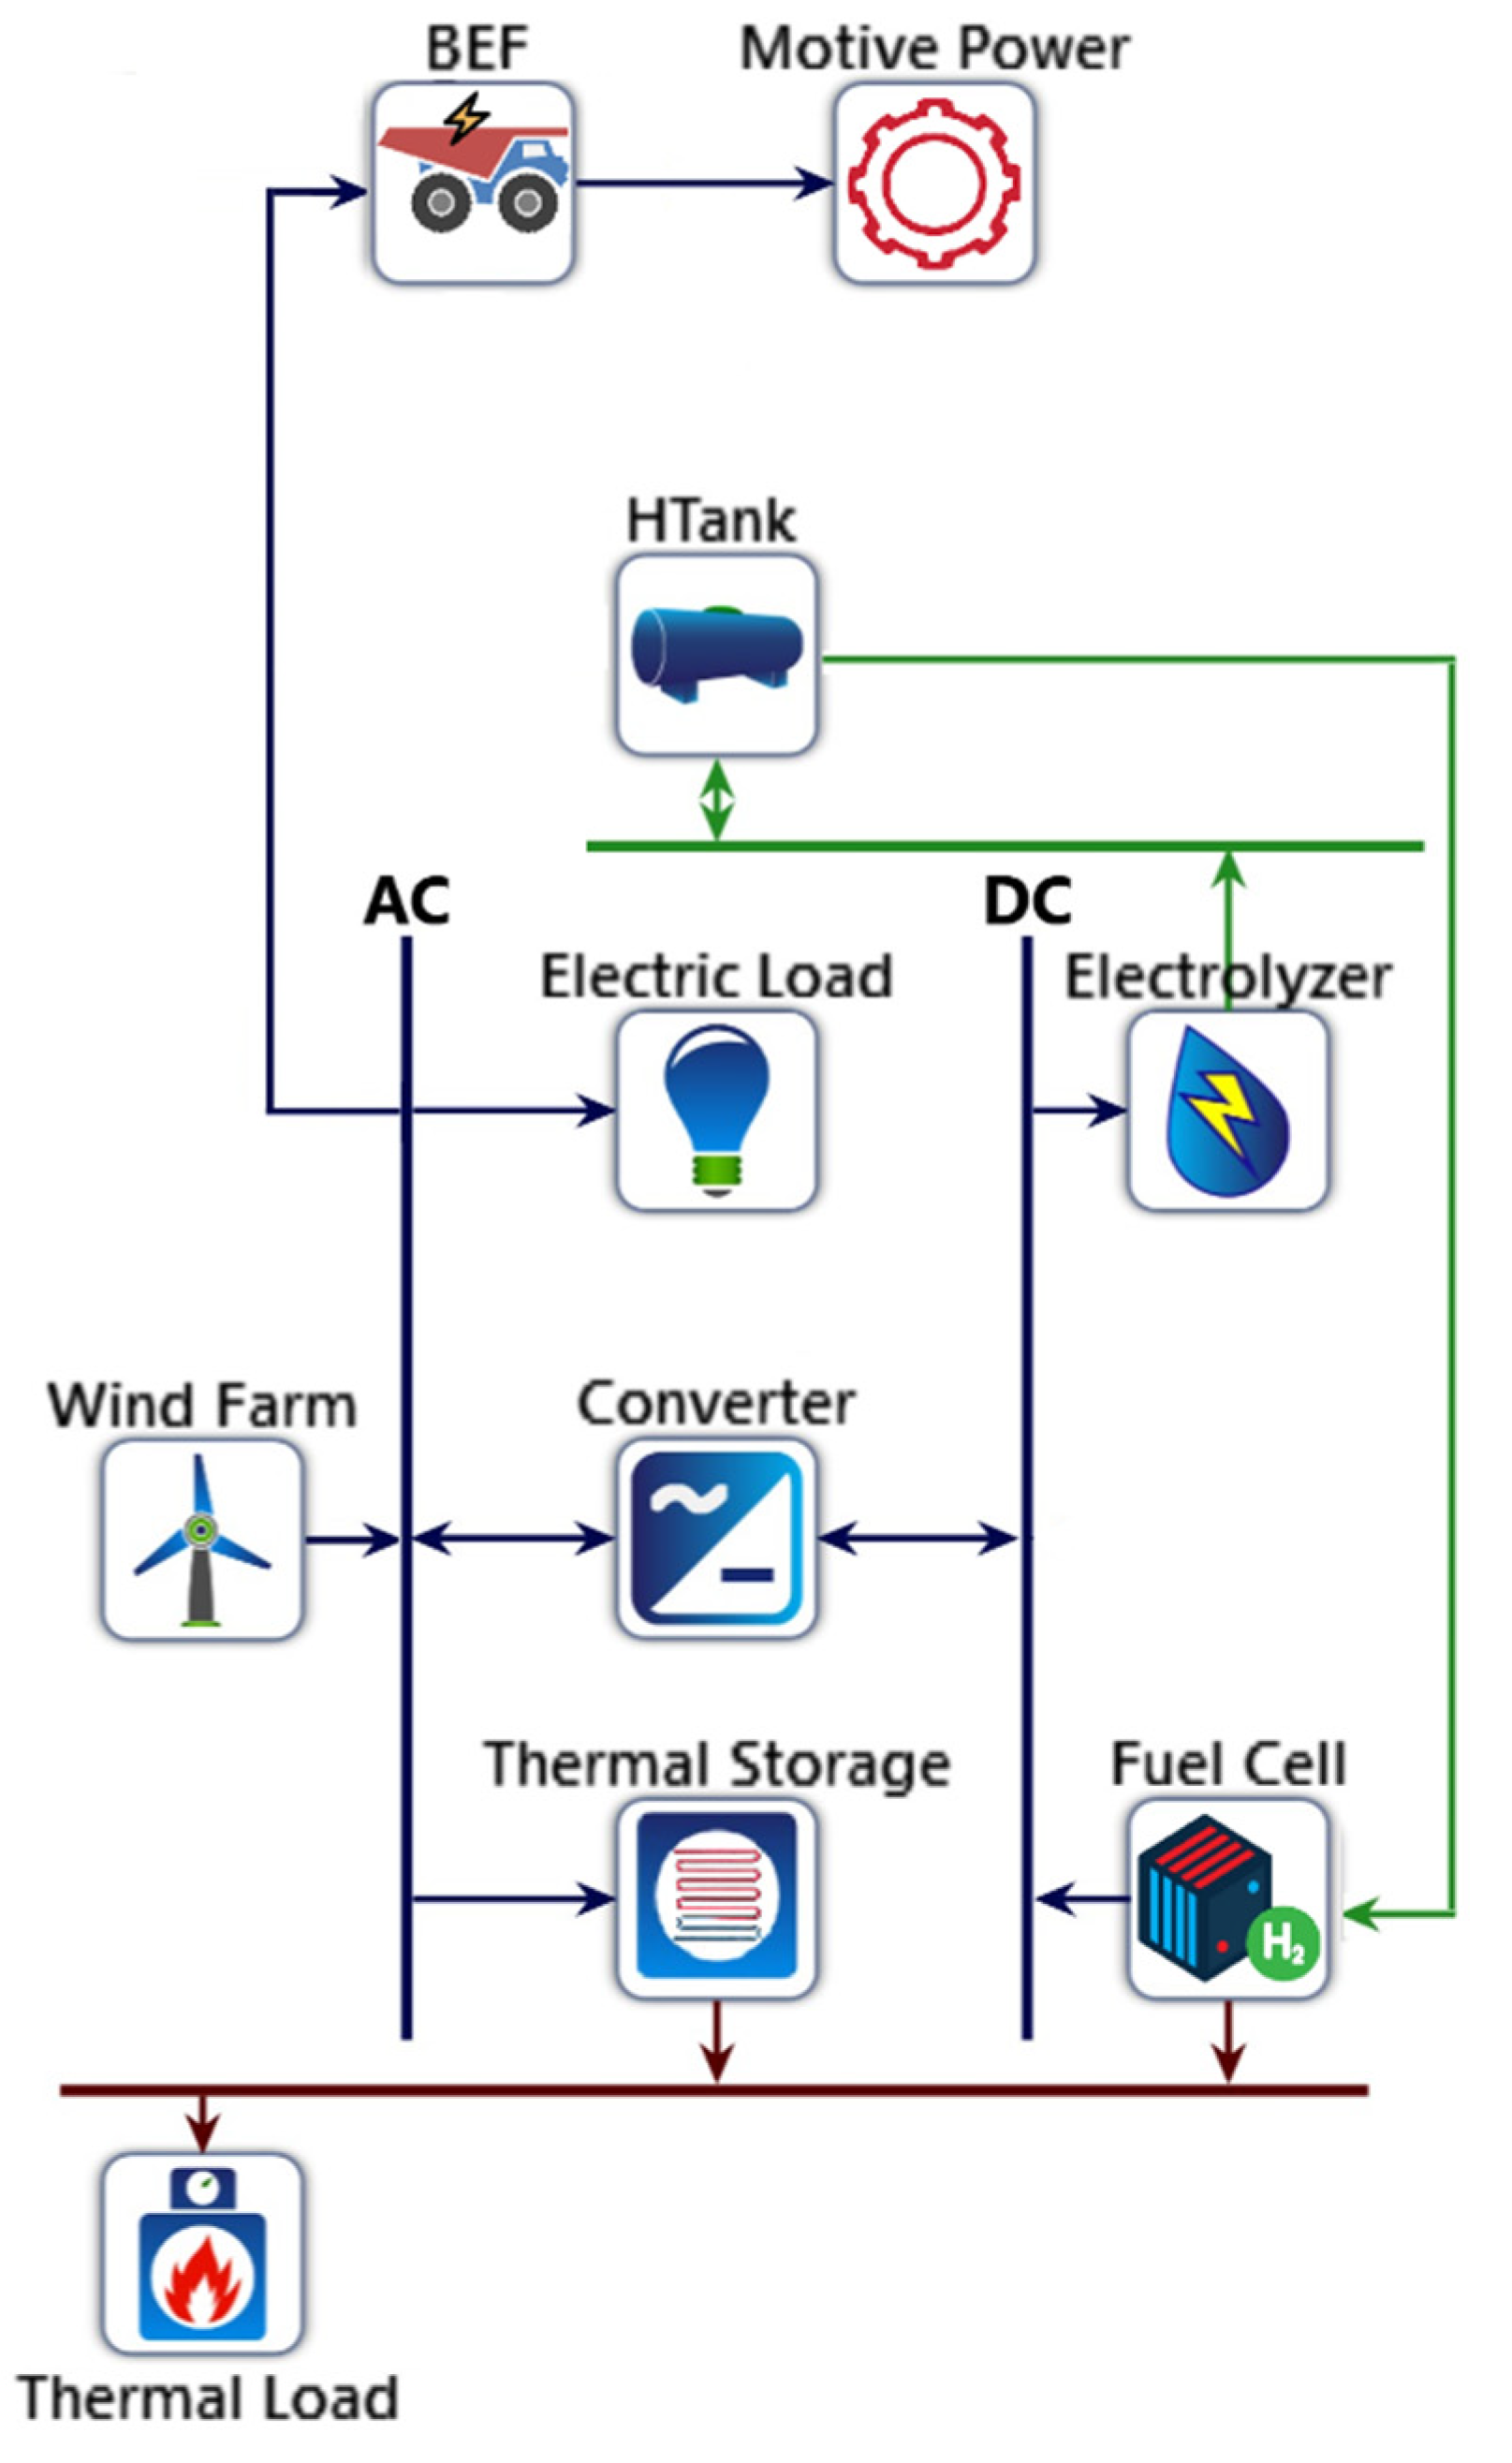
- All-renewable system with battery electric fleet (BEF) and battery/fc storage configuration (Figure 6):
- Renewable wind generation/Battery/FC system for electrical load
- Battery electric fleet for haulage equipment
- Electric heater/Thermal storage for thermal load
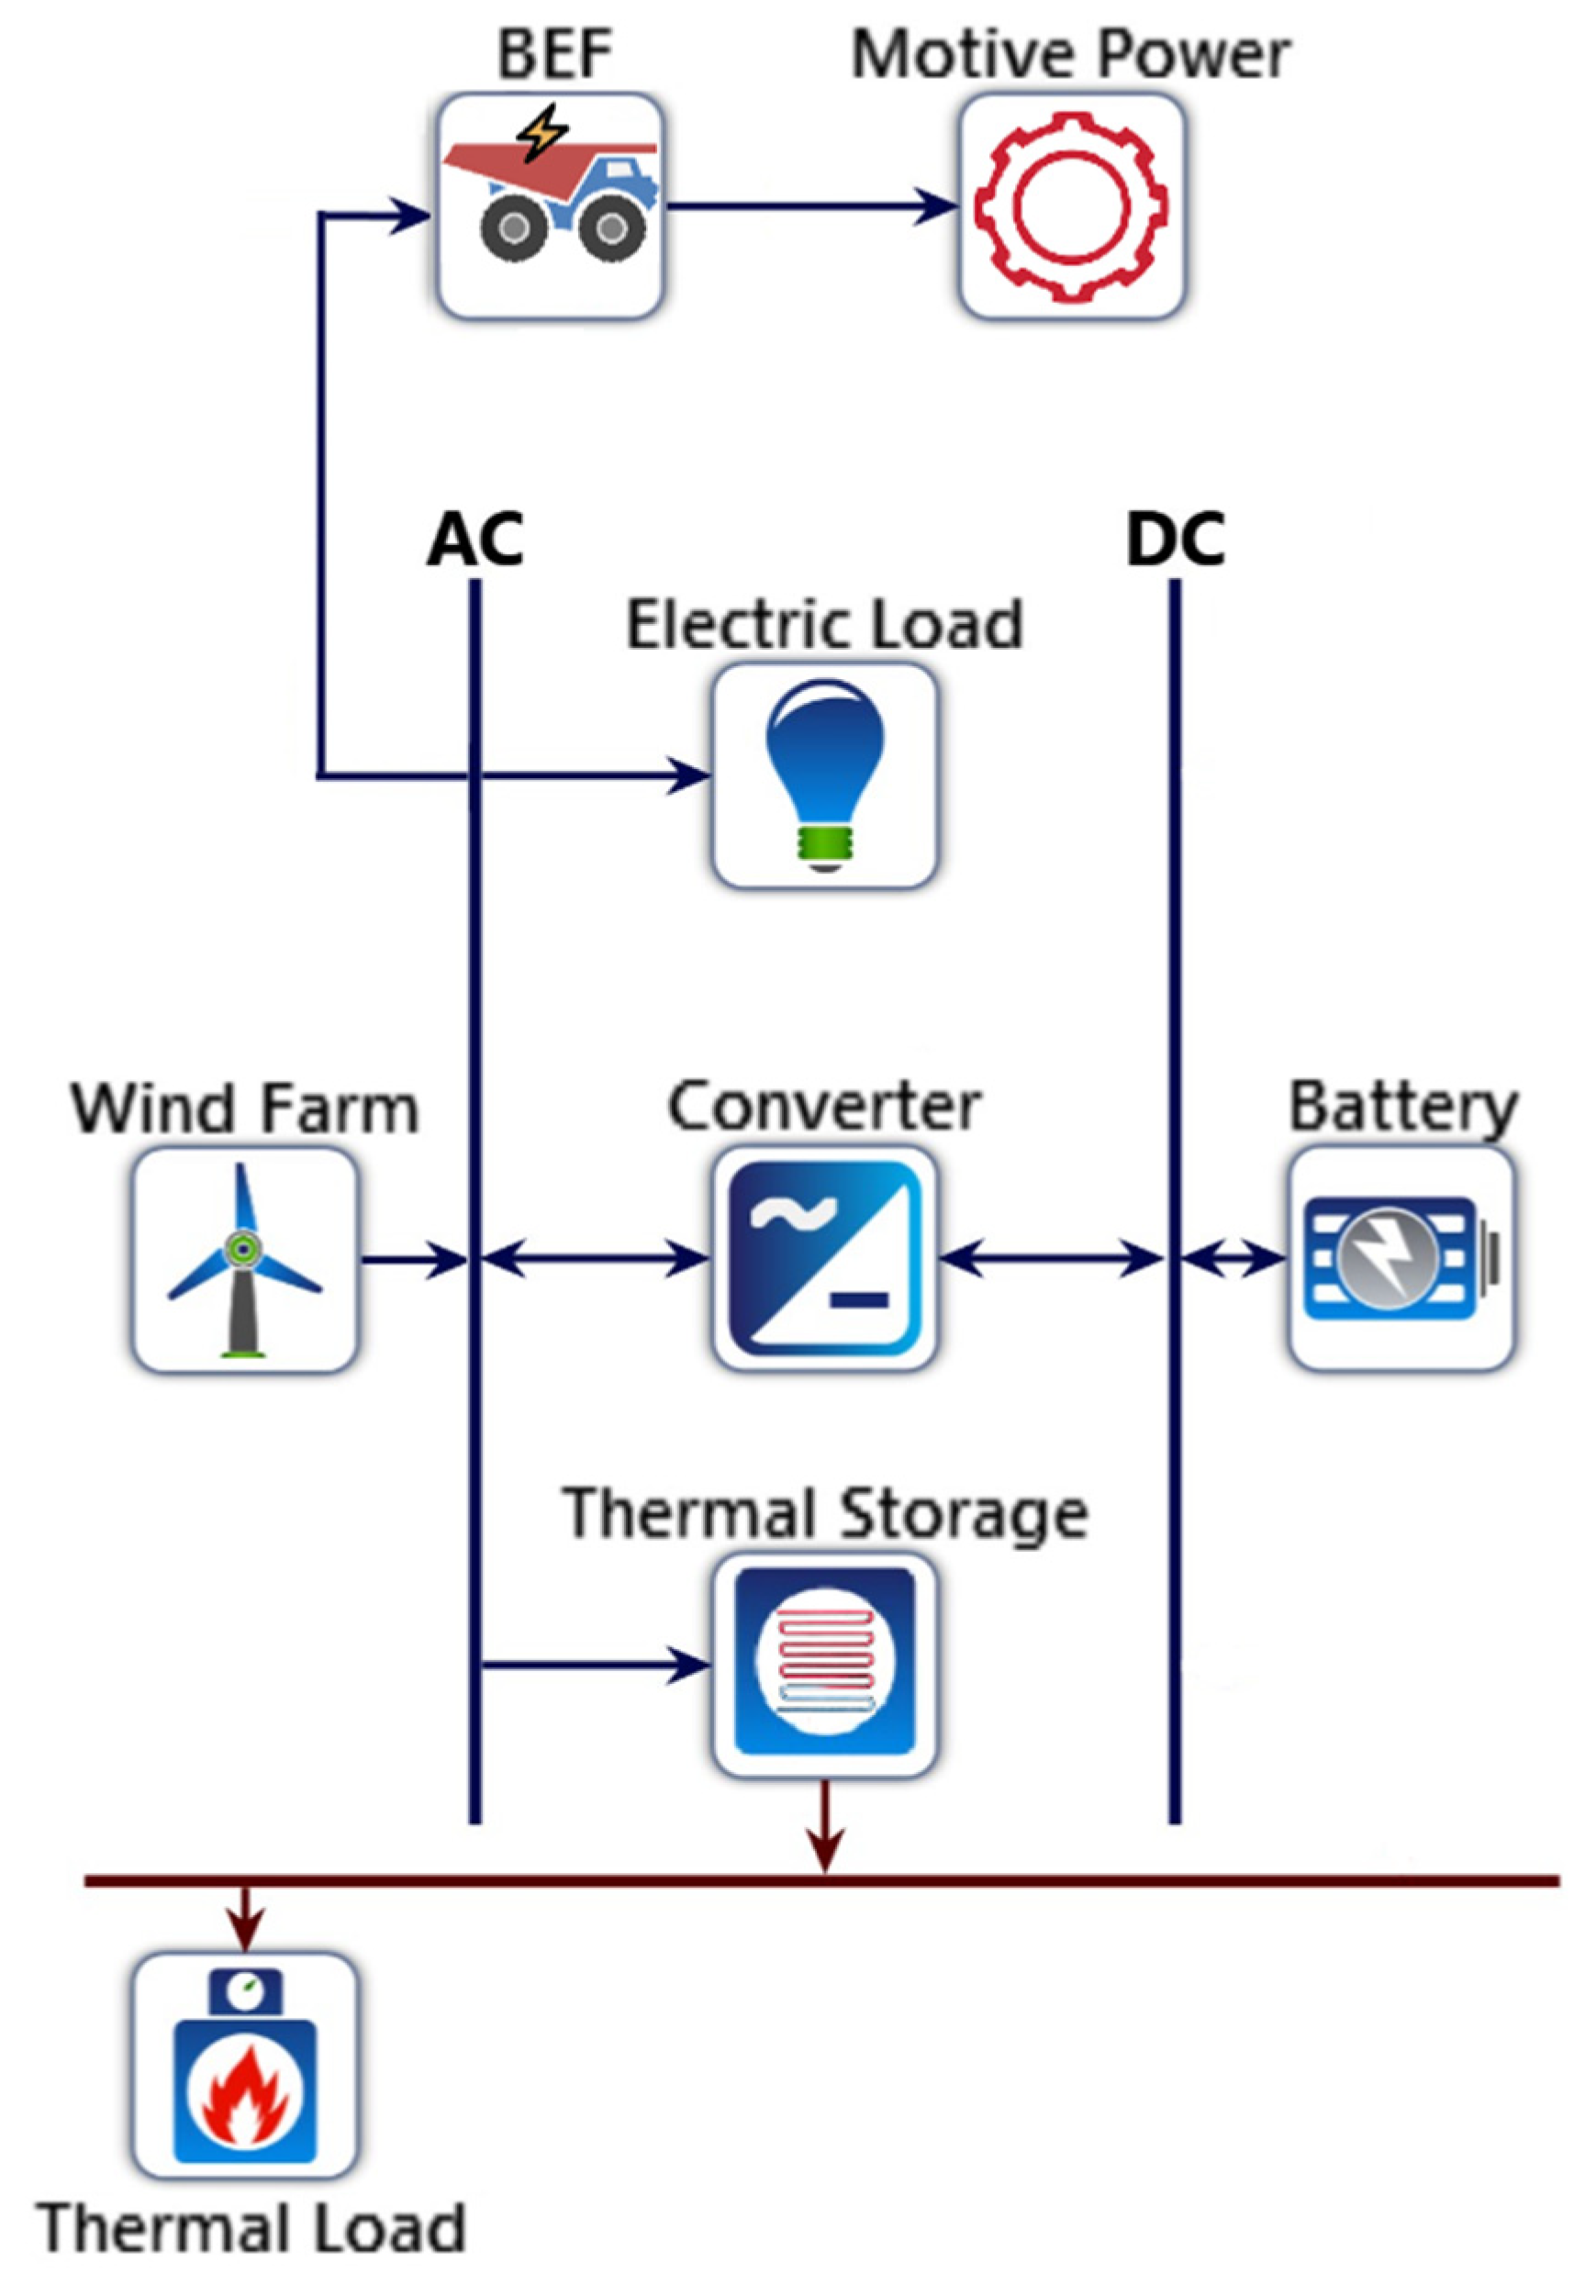
- All-renewable system with battery electric fleet (BEF) and battery storage configuration (Figure 7):
- Renewable wind generation/Battery system for electrical load
- Battery electric fleet for haulage equipment
- Electric heater/Thermal storage for thermal load
- All-renewable system with battery electric fleet (BEF) and fc storage configuration (Figure 8):
- Renewable wind generation/FC system for electrical load
- Battery electric fleet for haulage equipment
- Electric heater/Thermal storage for thermal load
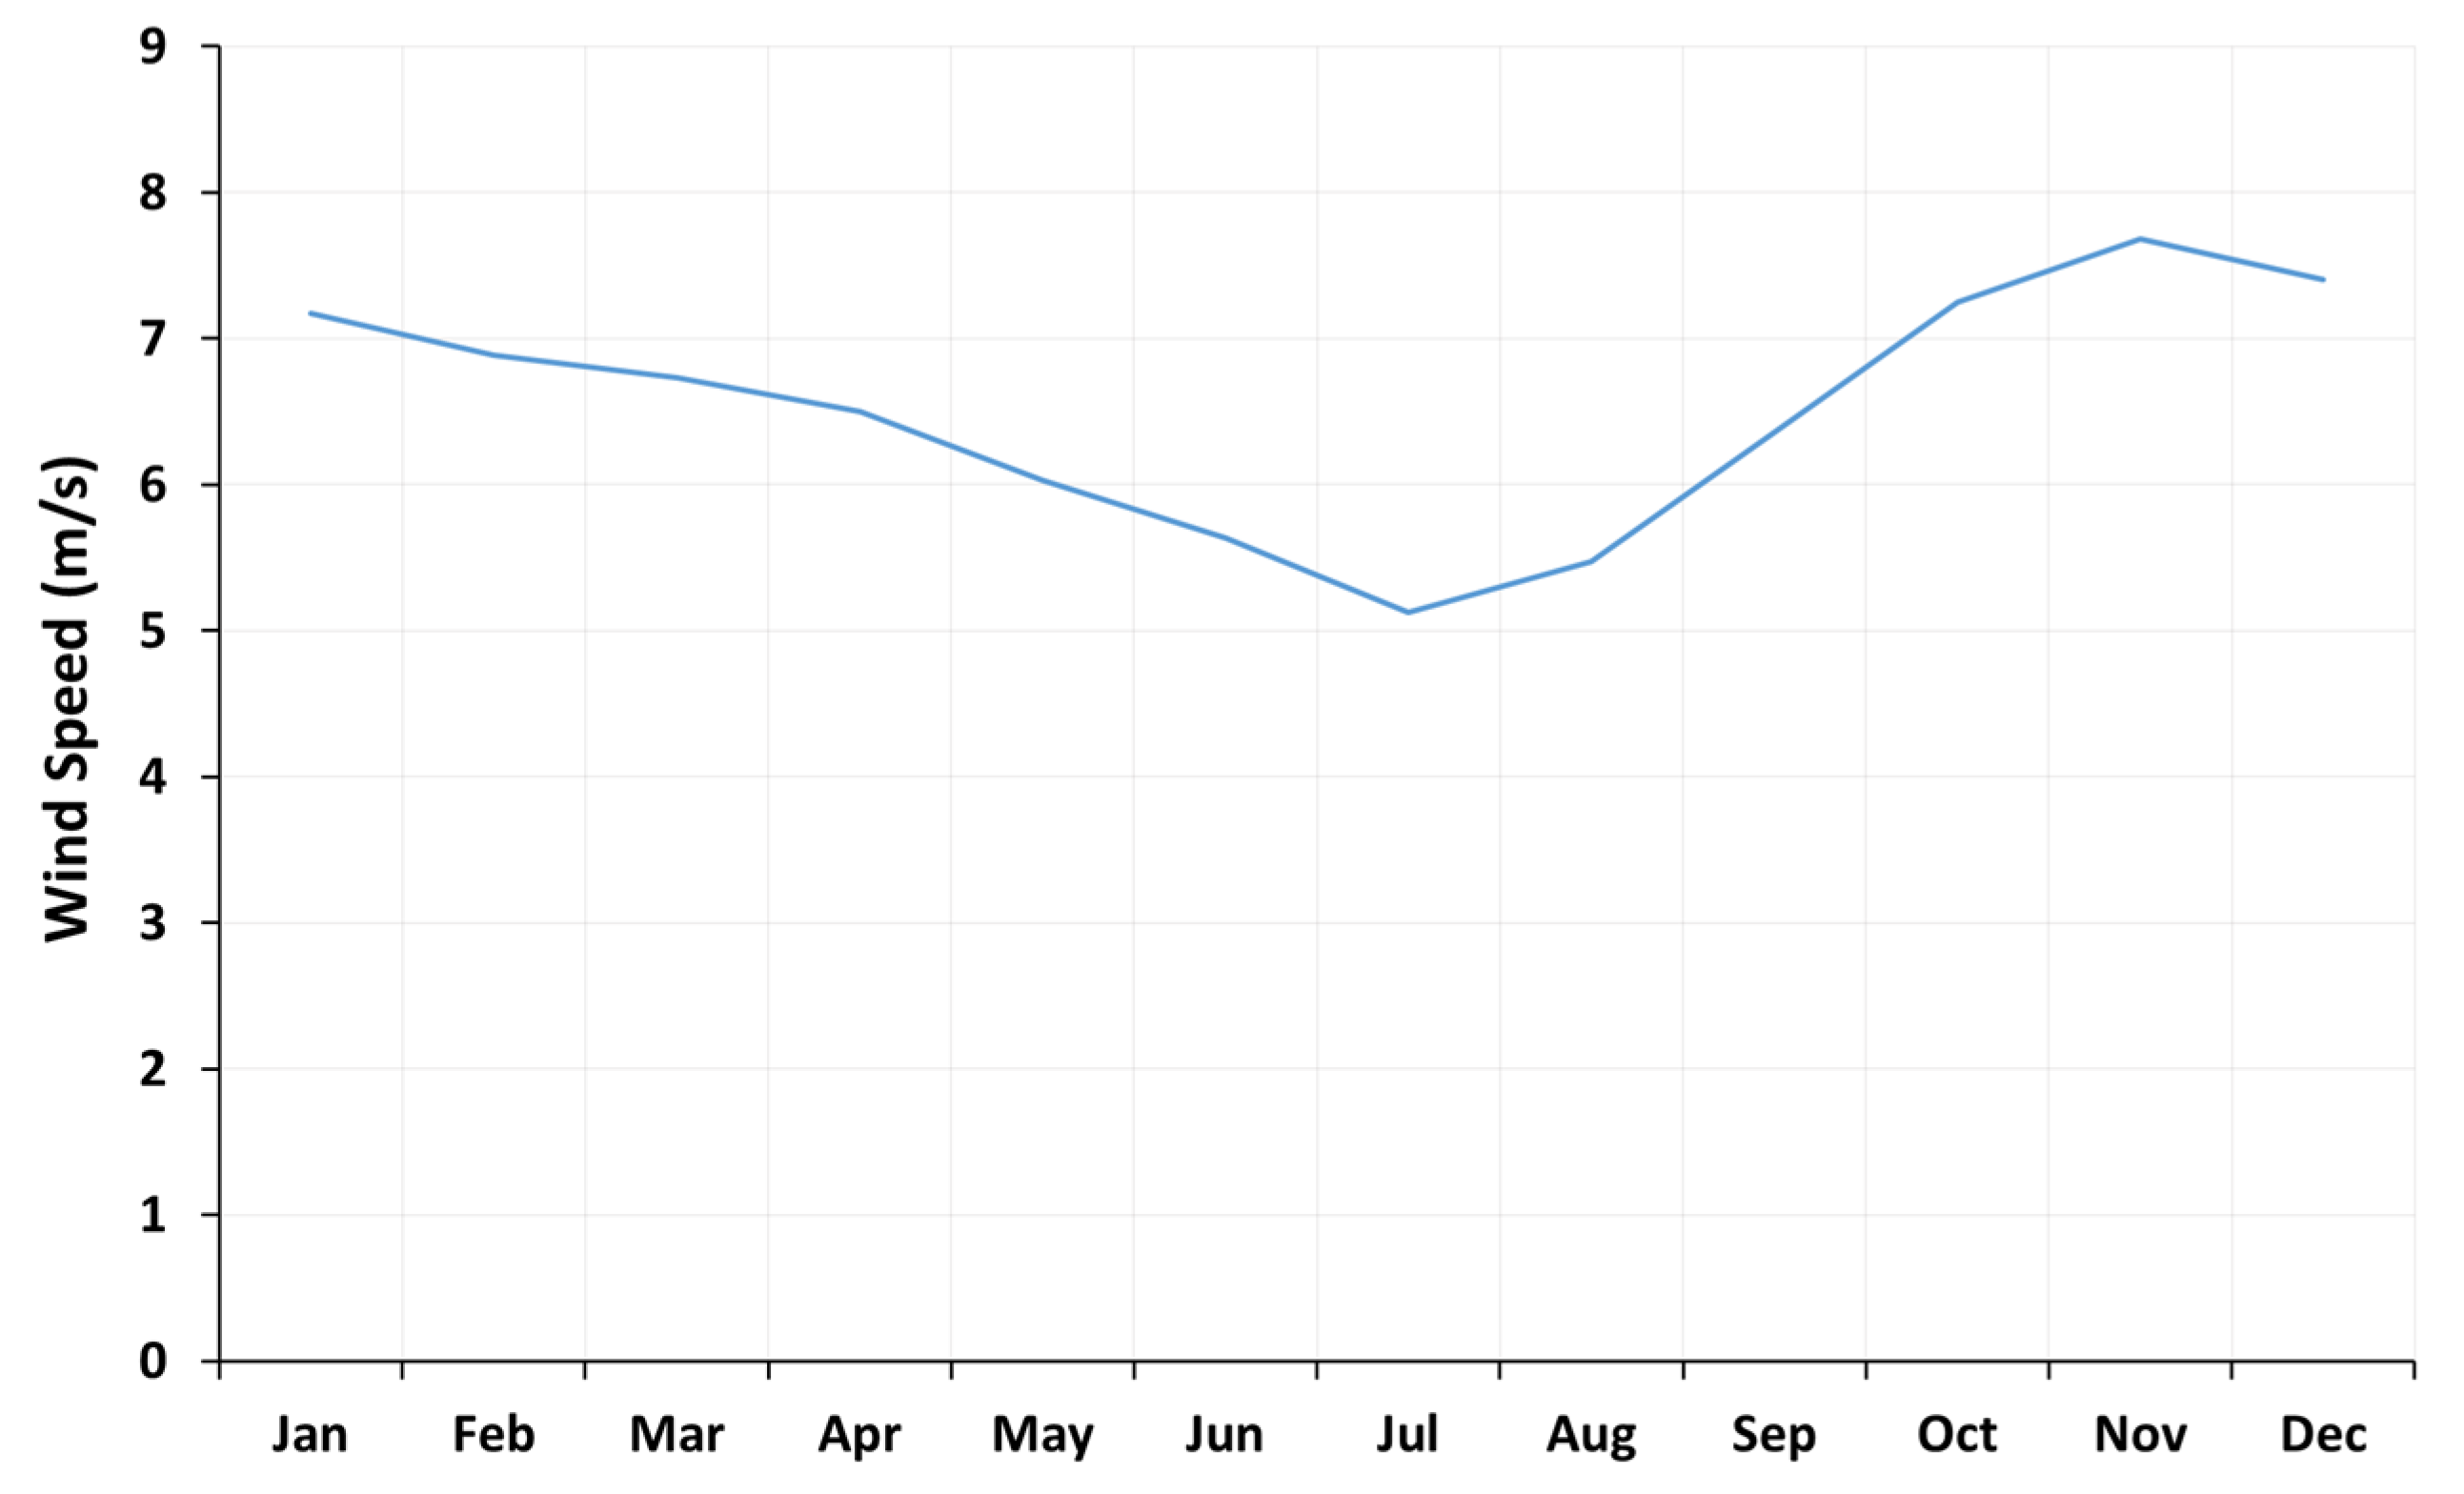
2.2.1. Wind Farm
2.2.2. Storage Units
- a.
- Battery bank:
- b.
- Hydrogen storage:
- c.
- Thermal storage:
2.2.3. Mine Mobile Fleet
- a.
- Battery electric fleet:
- b.
- Hydrogen-powered fleet:
2.3. Economic Model
3. Results and Discussion
3.1. Case Study
3.2. Main Installations and Corresponding Costs
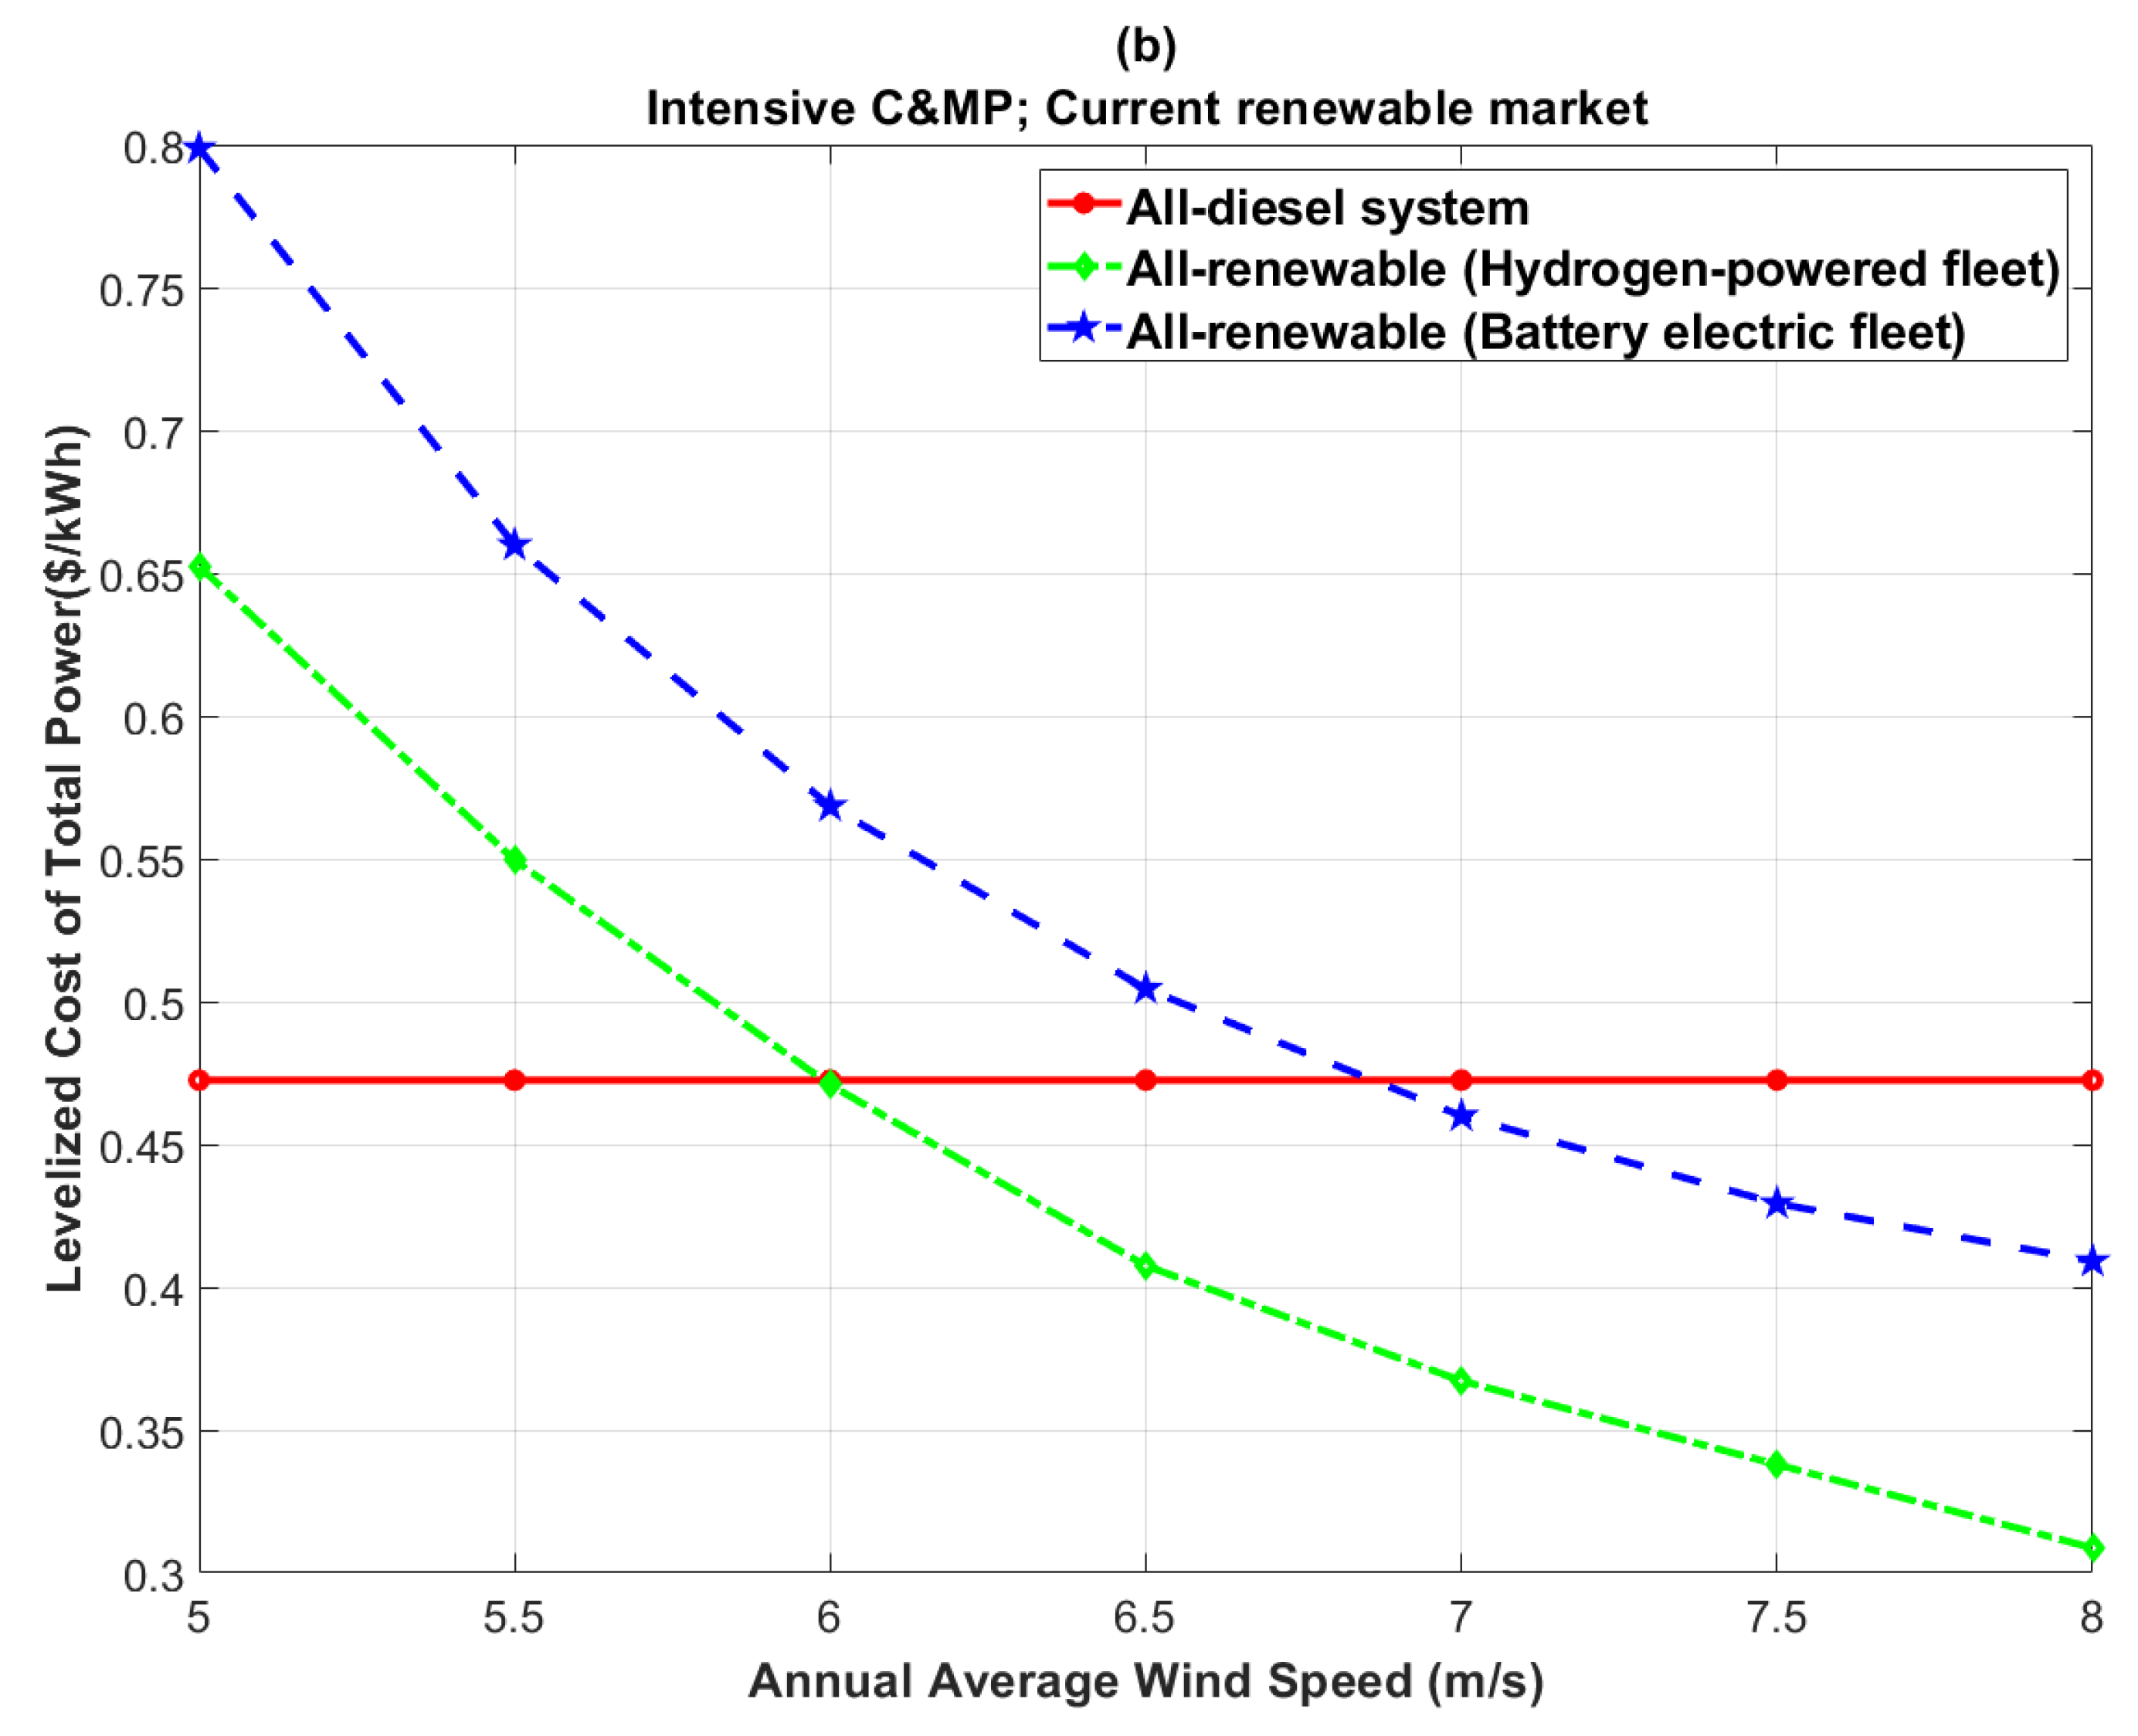
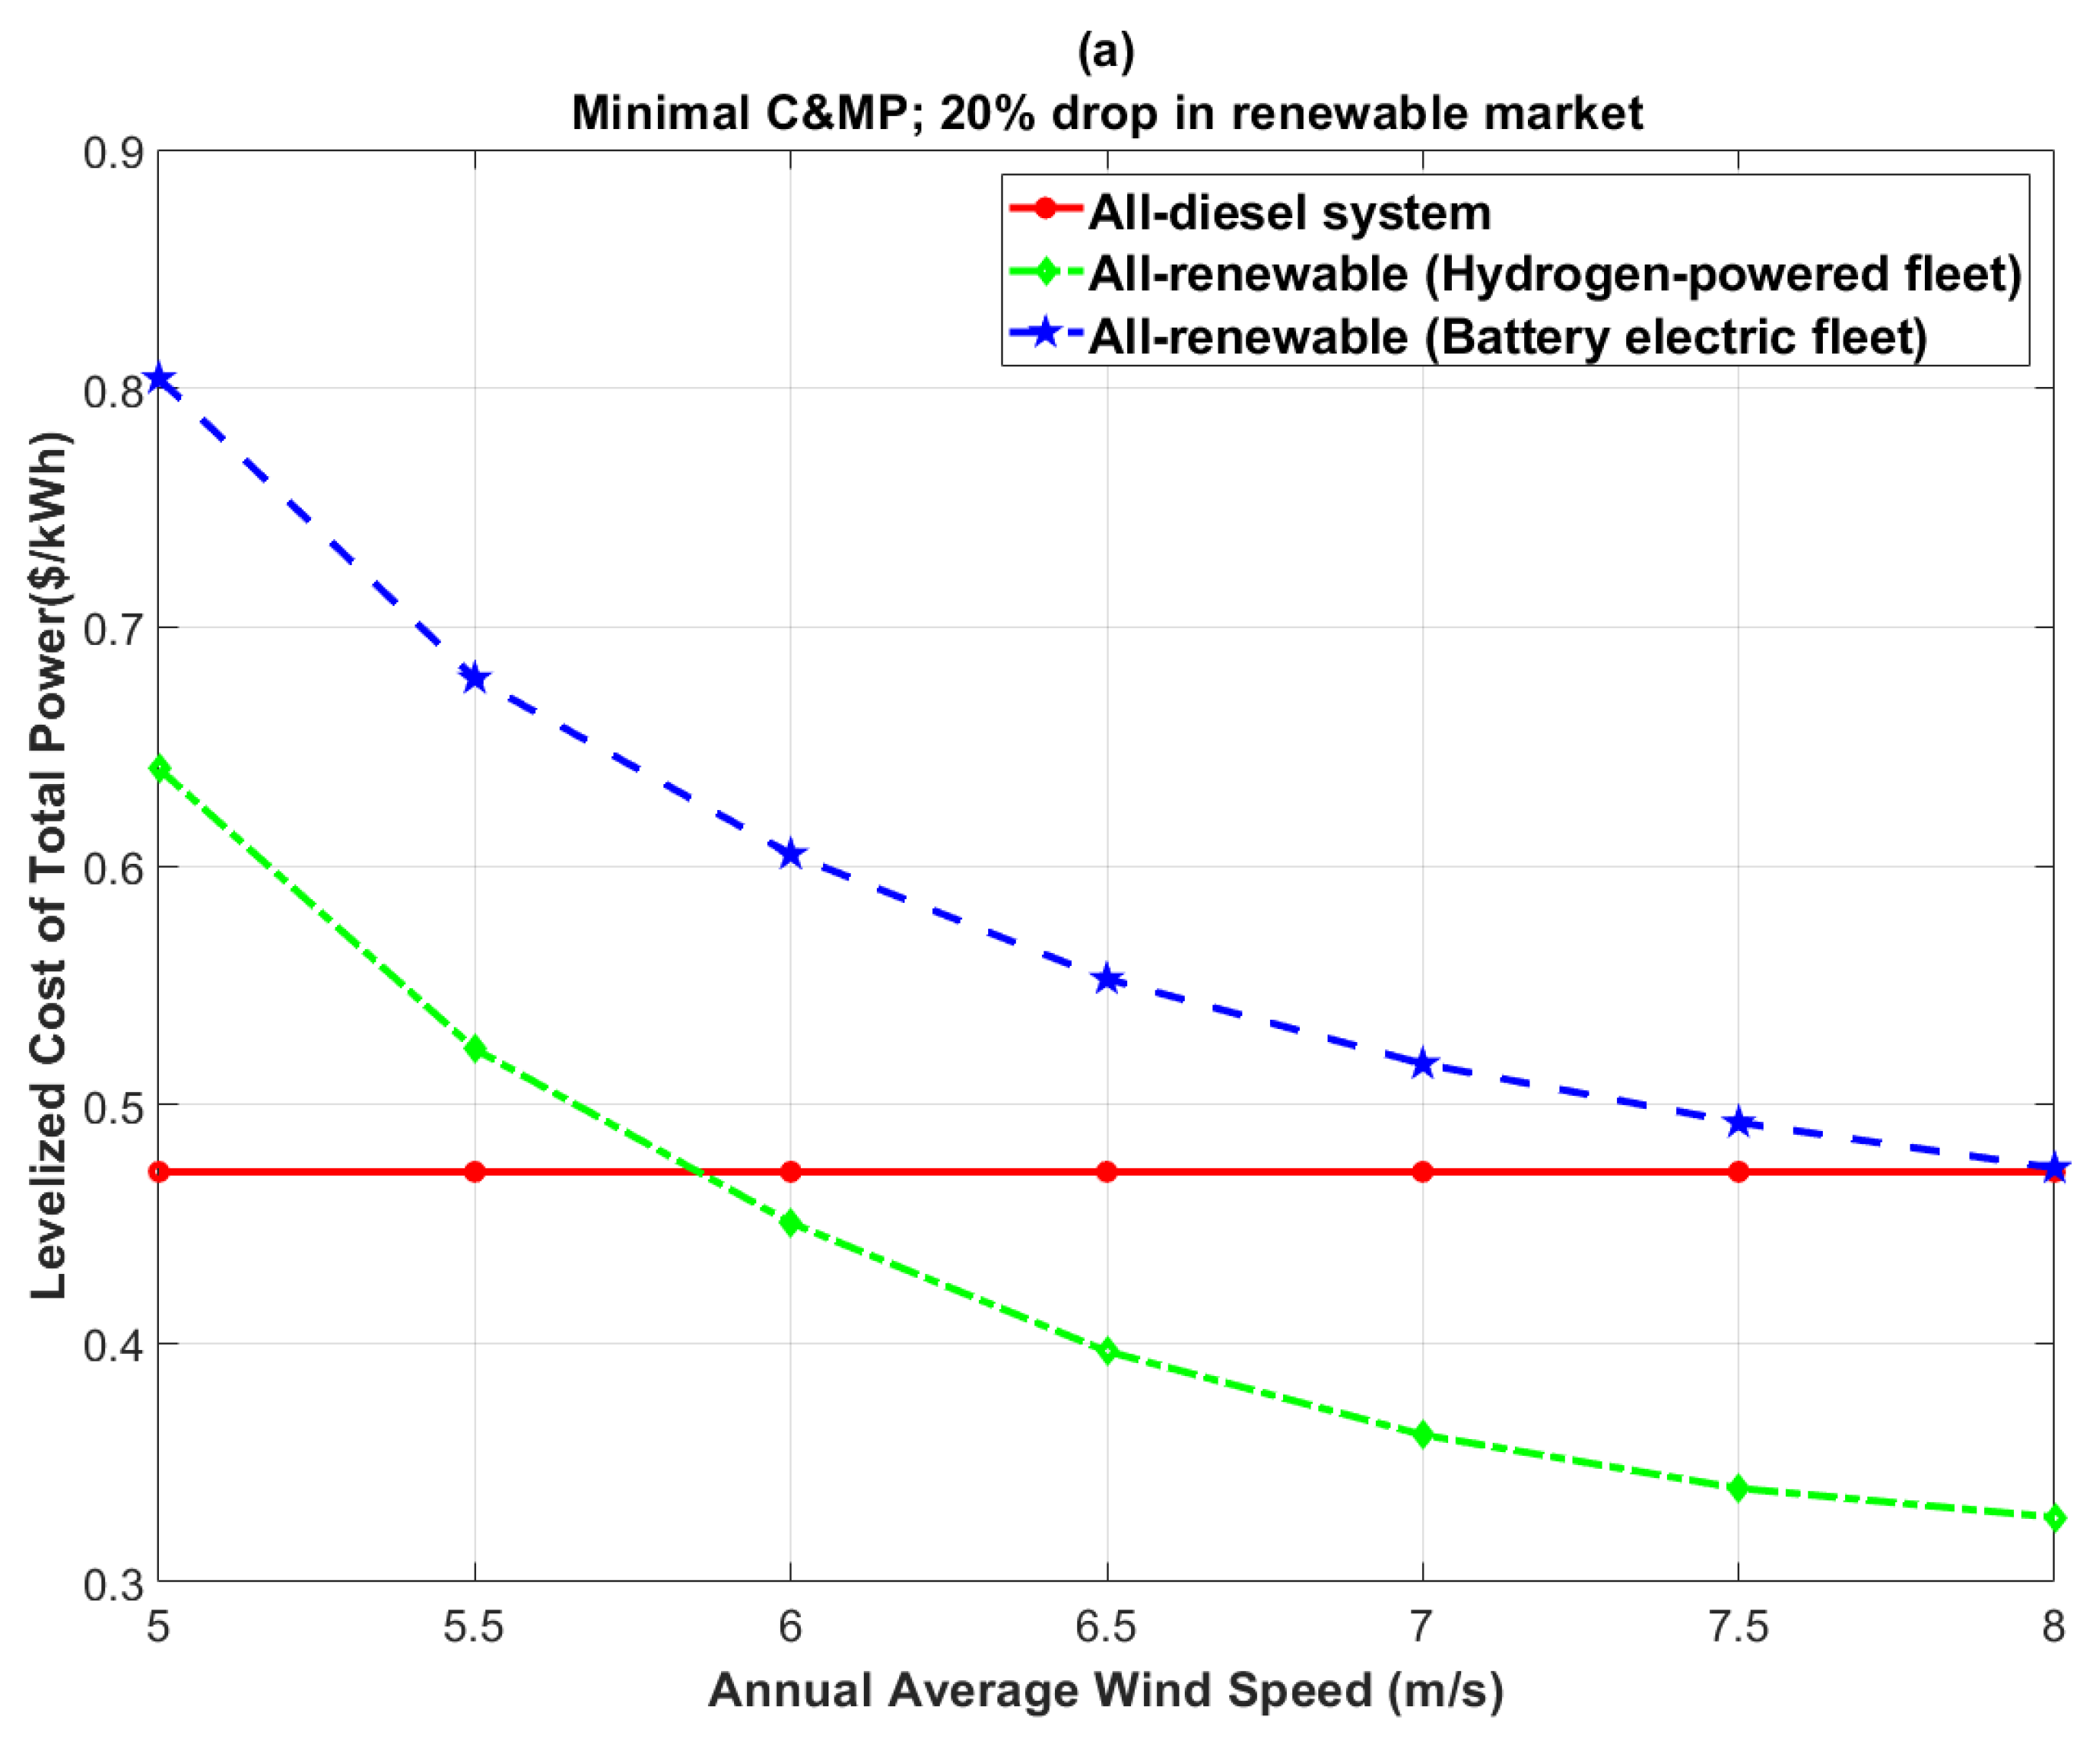
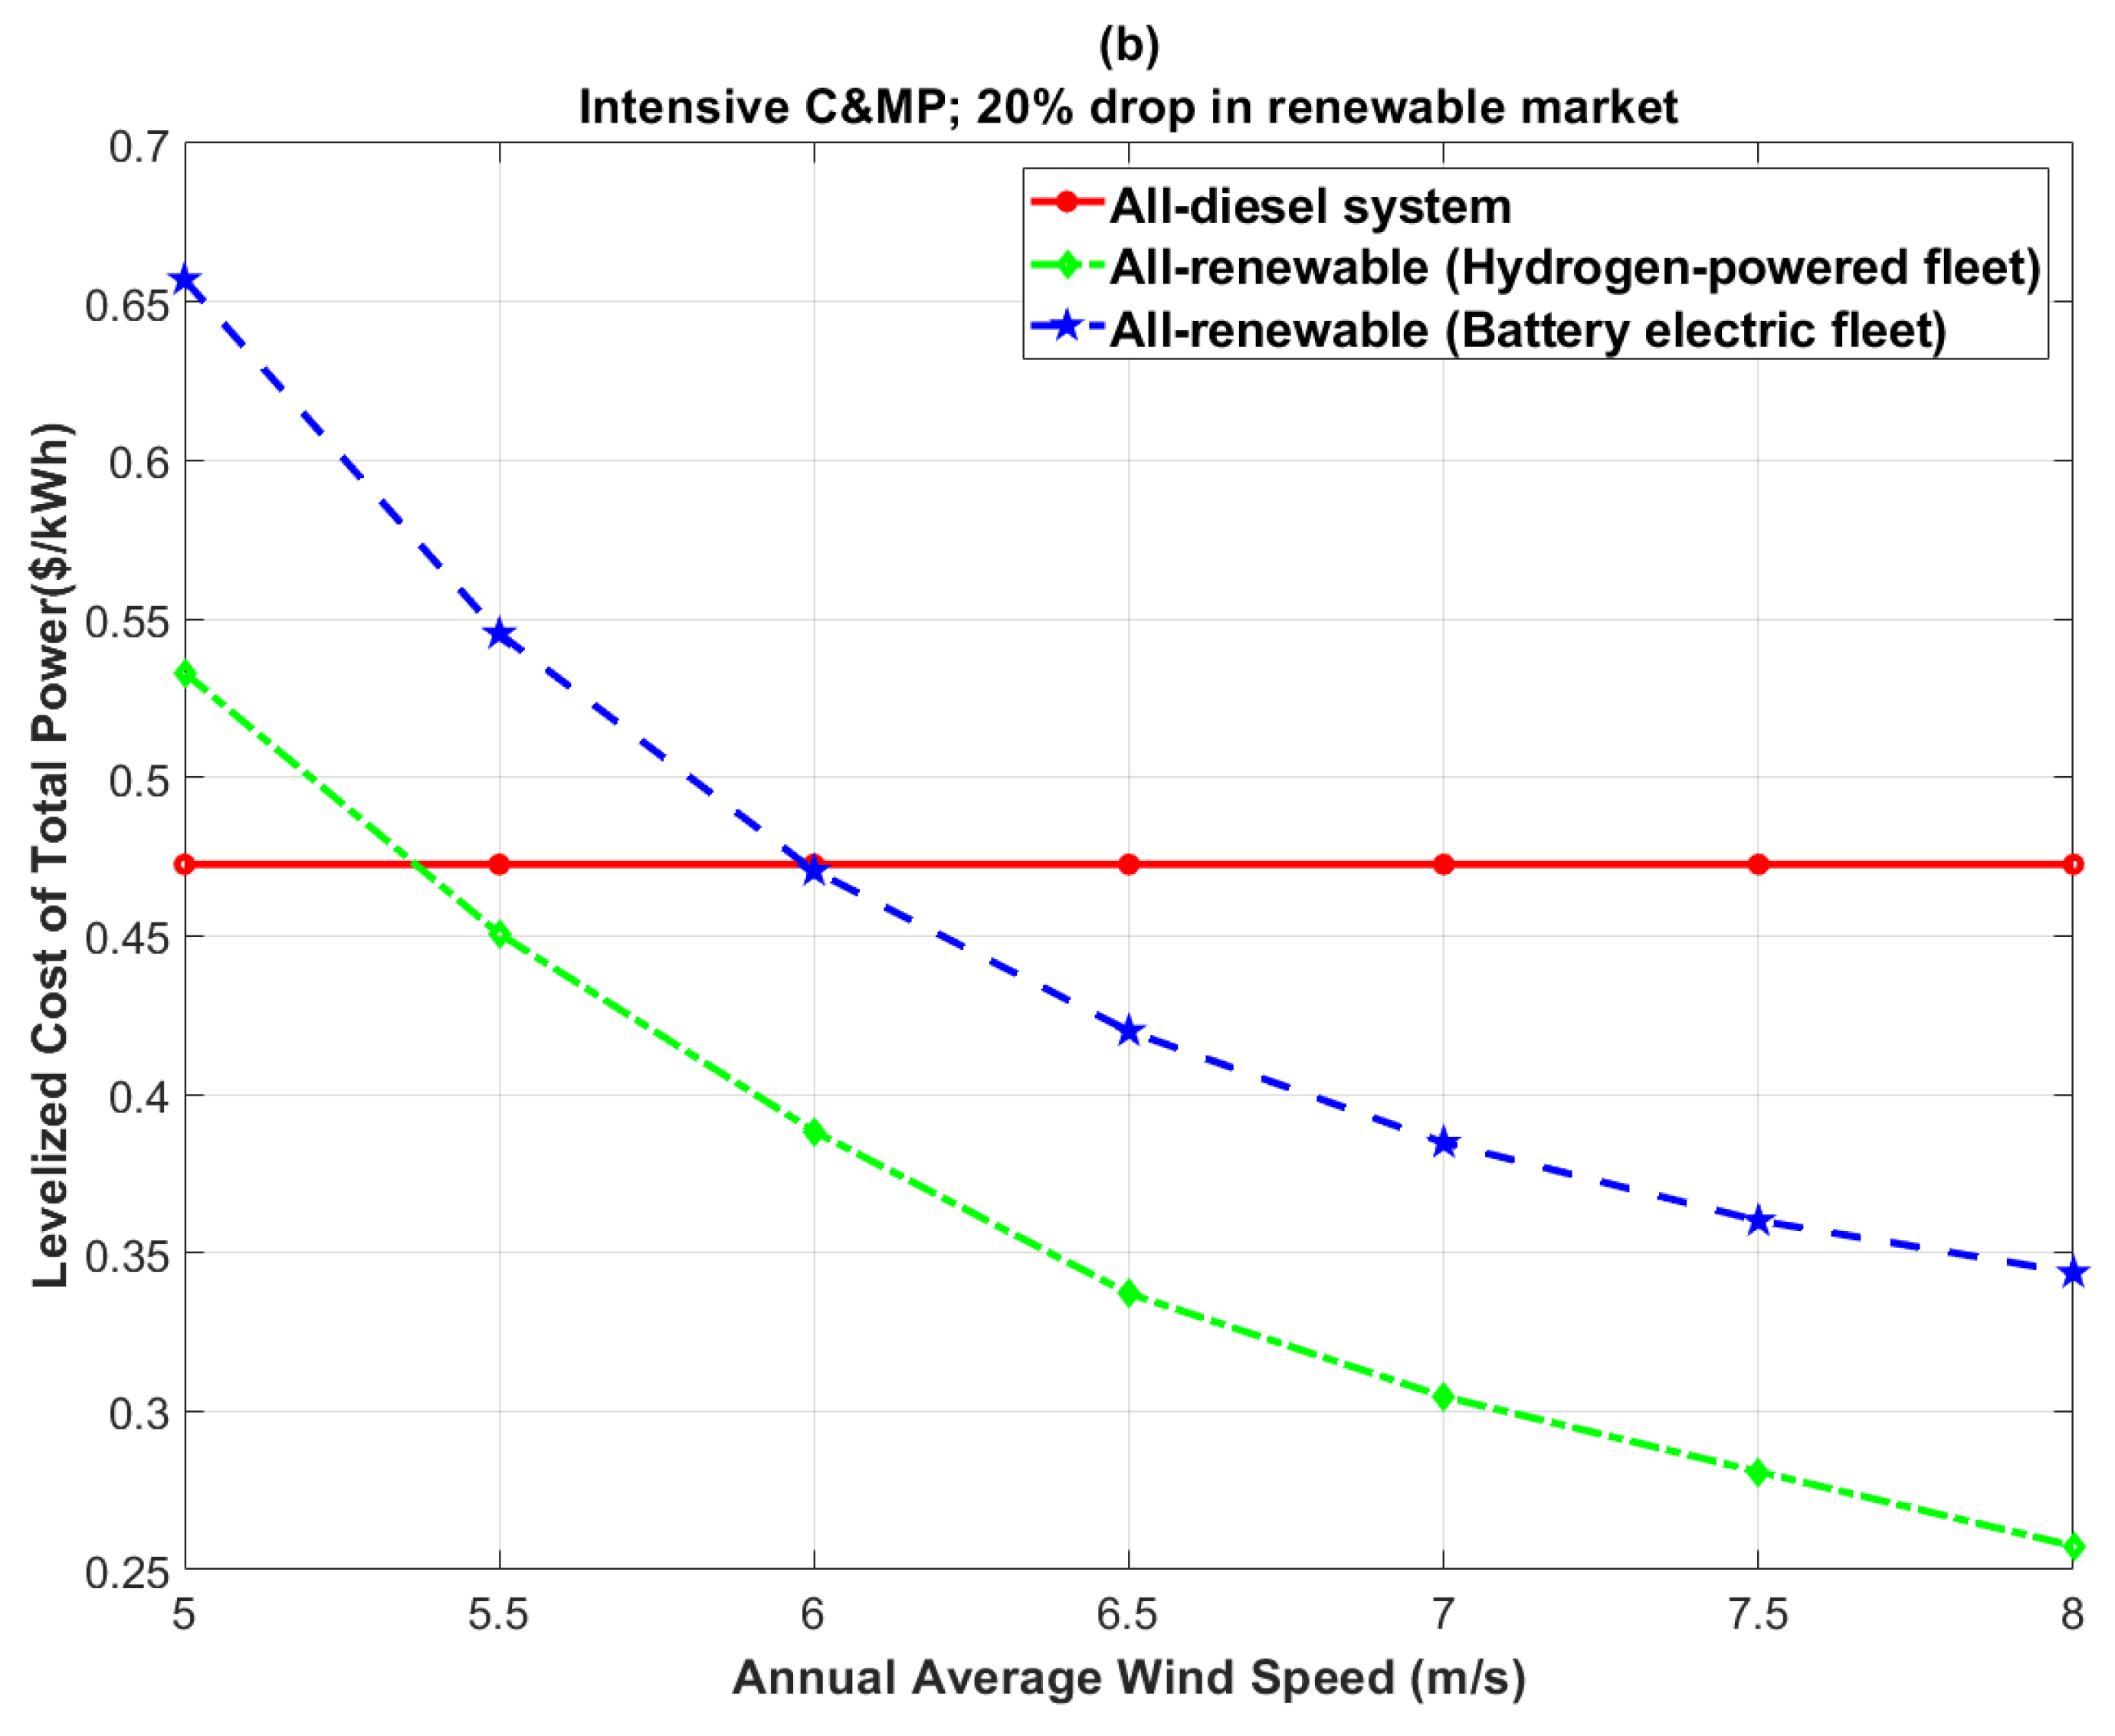
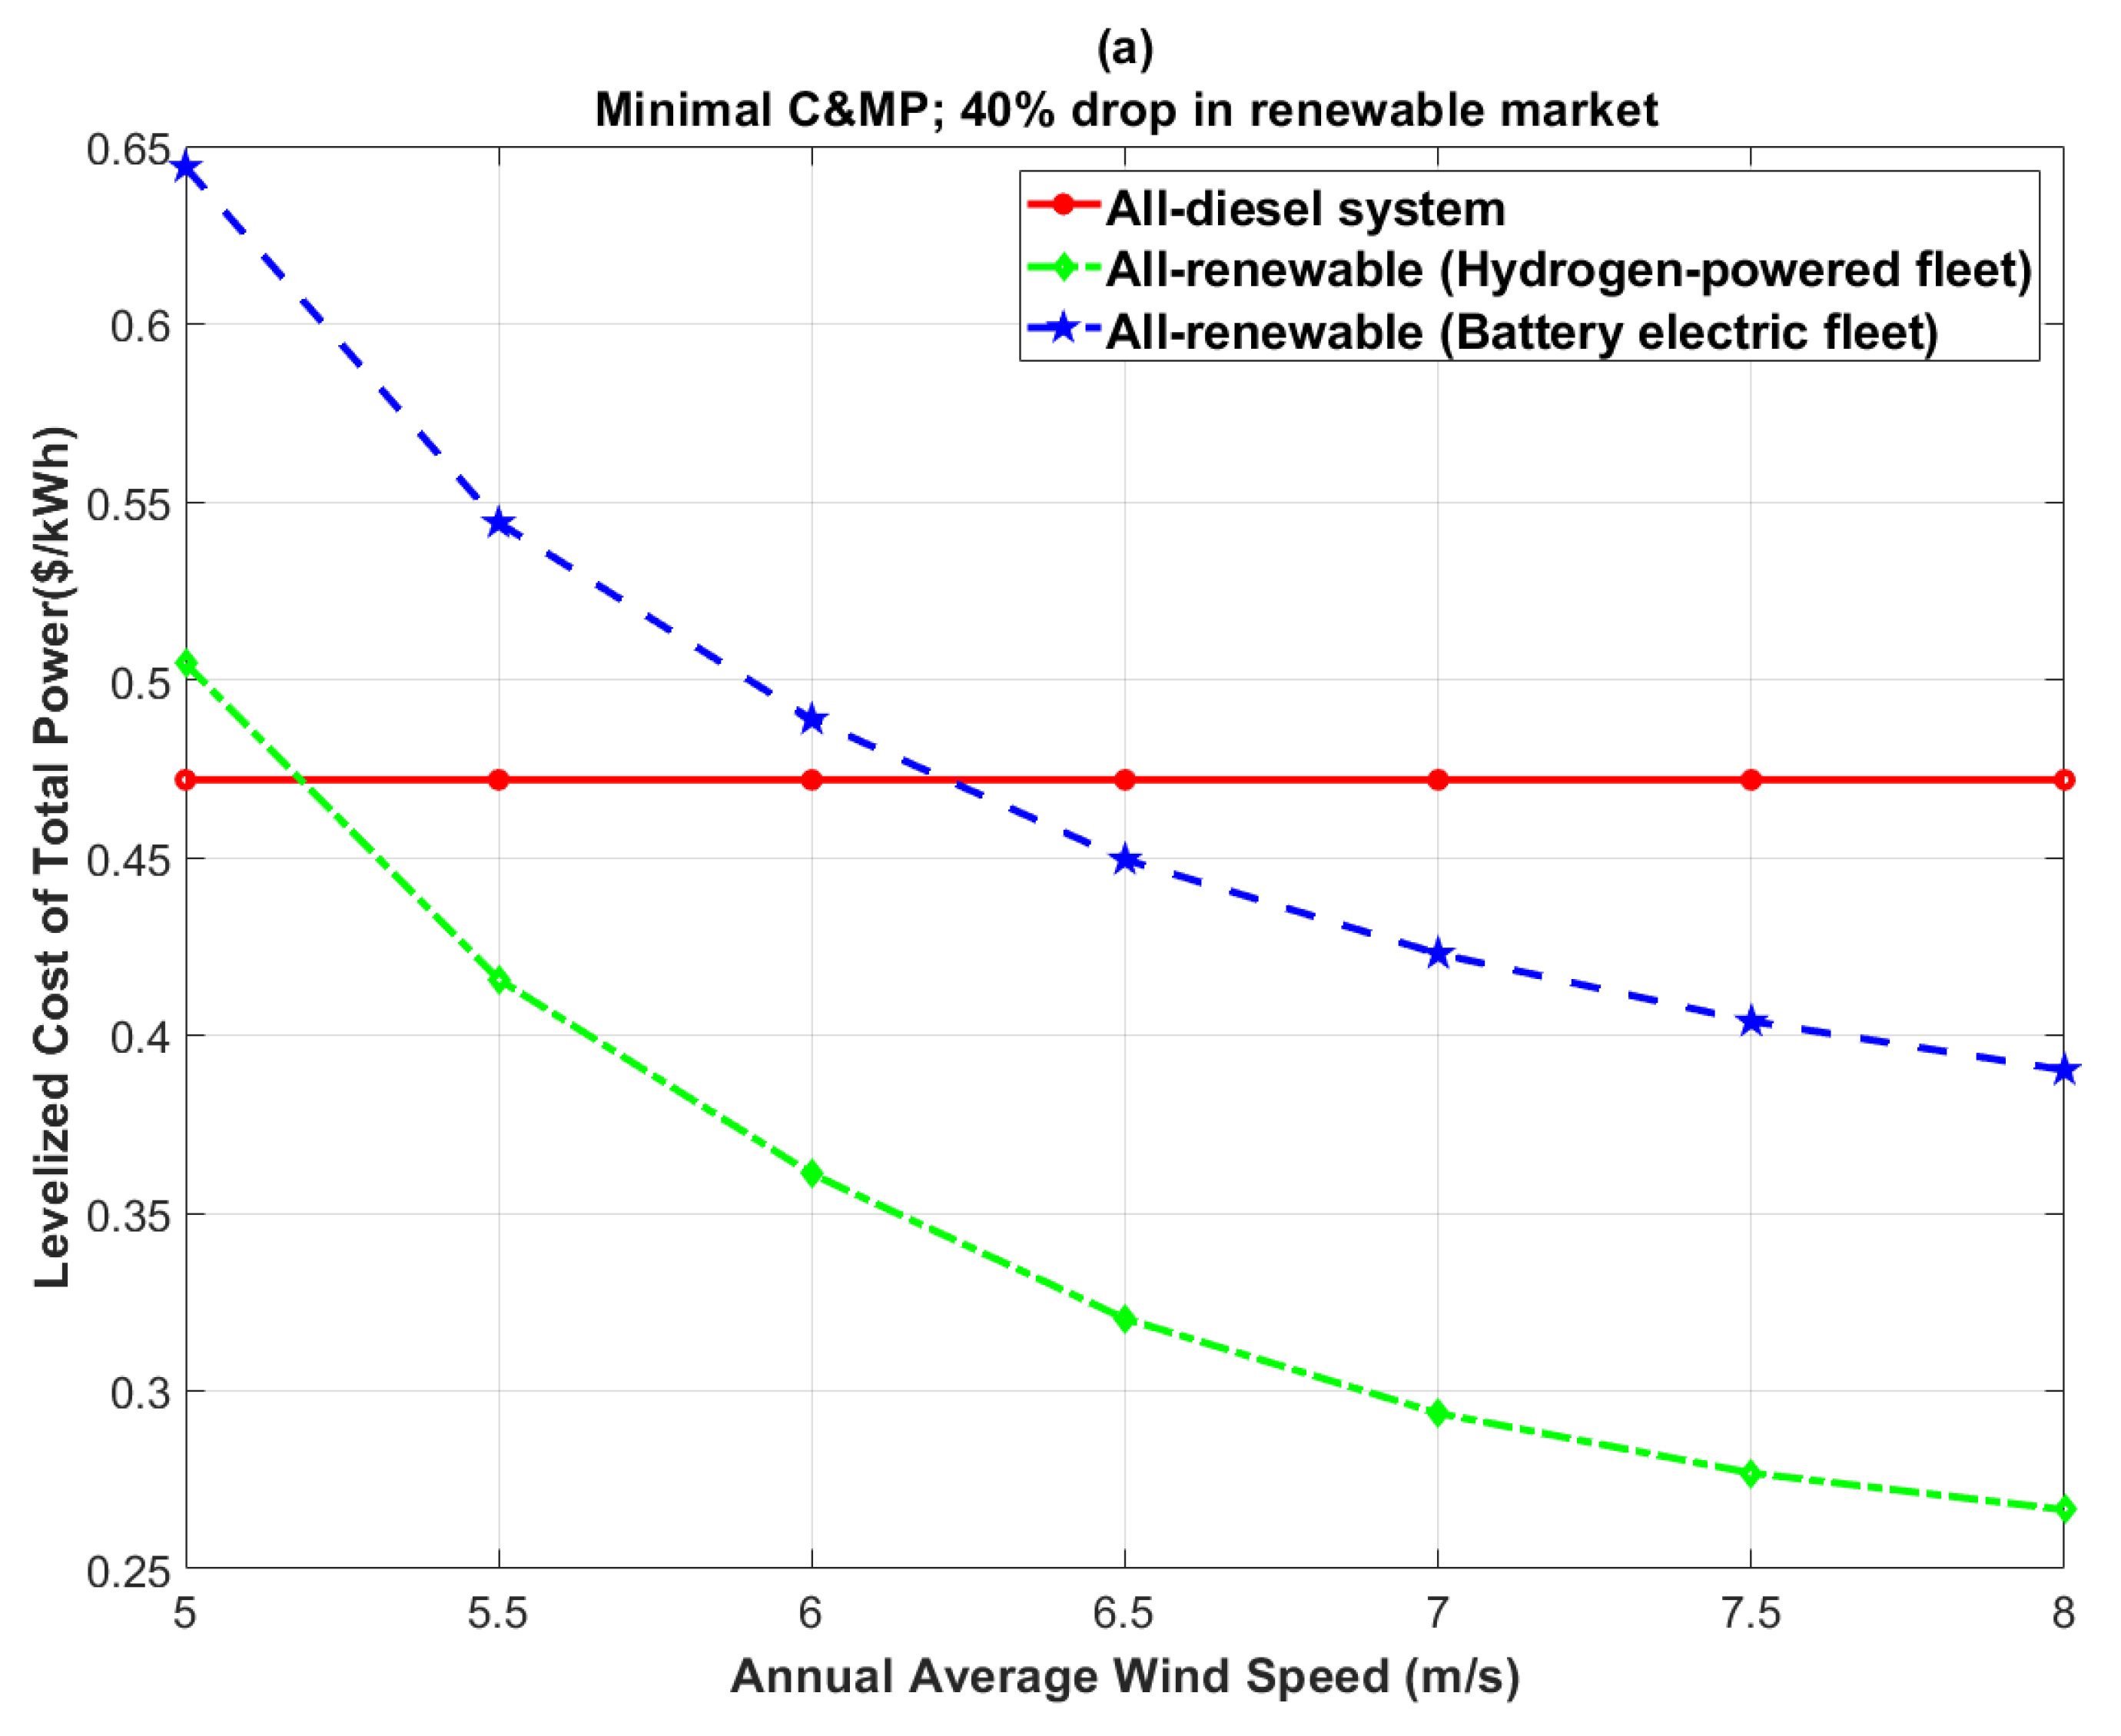
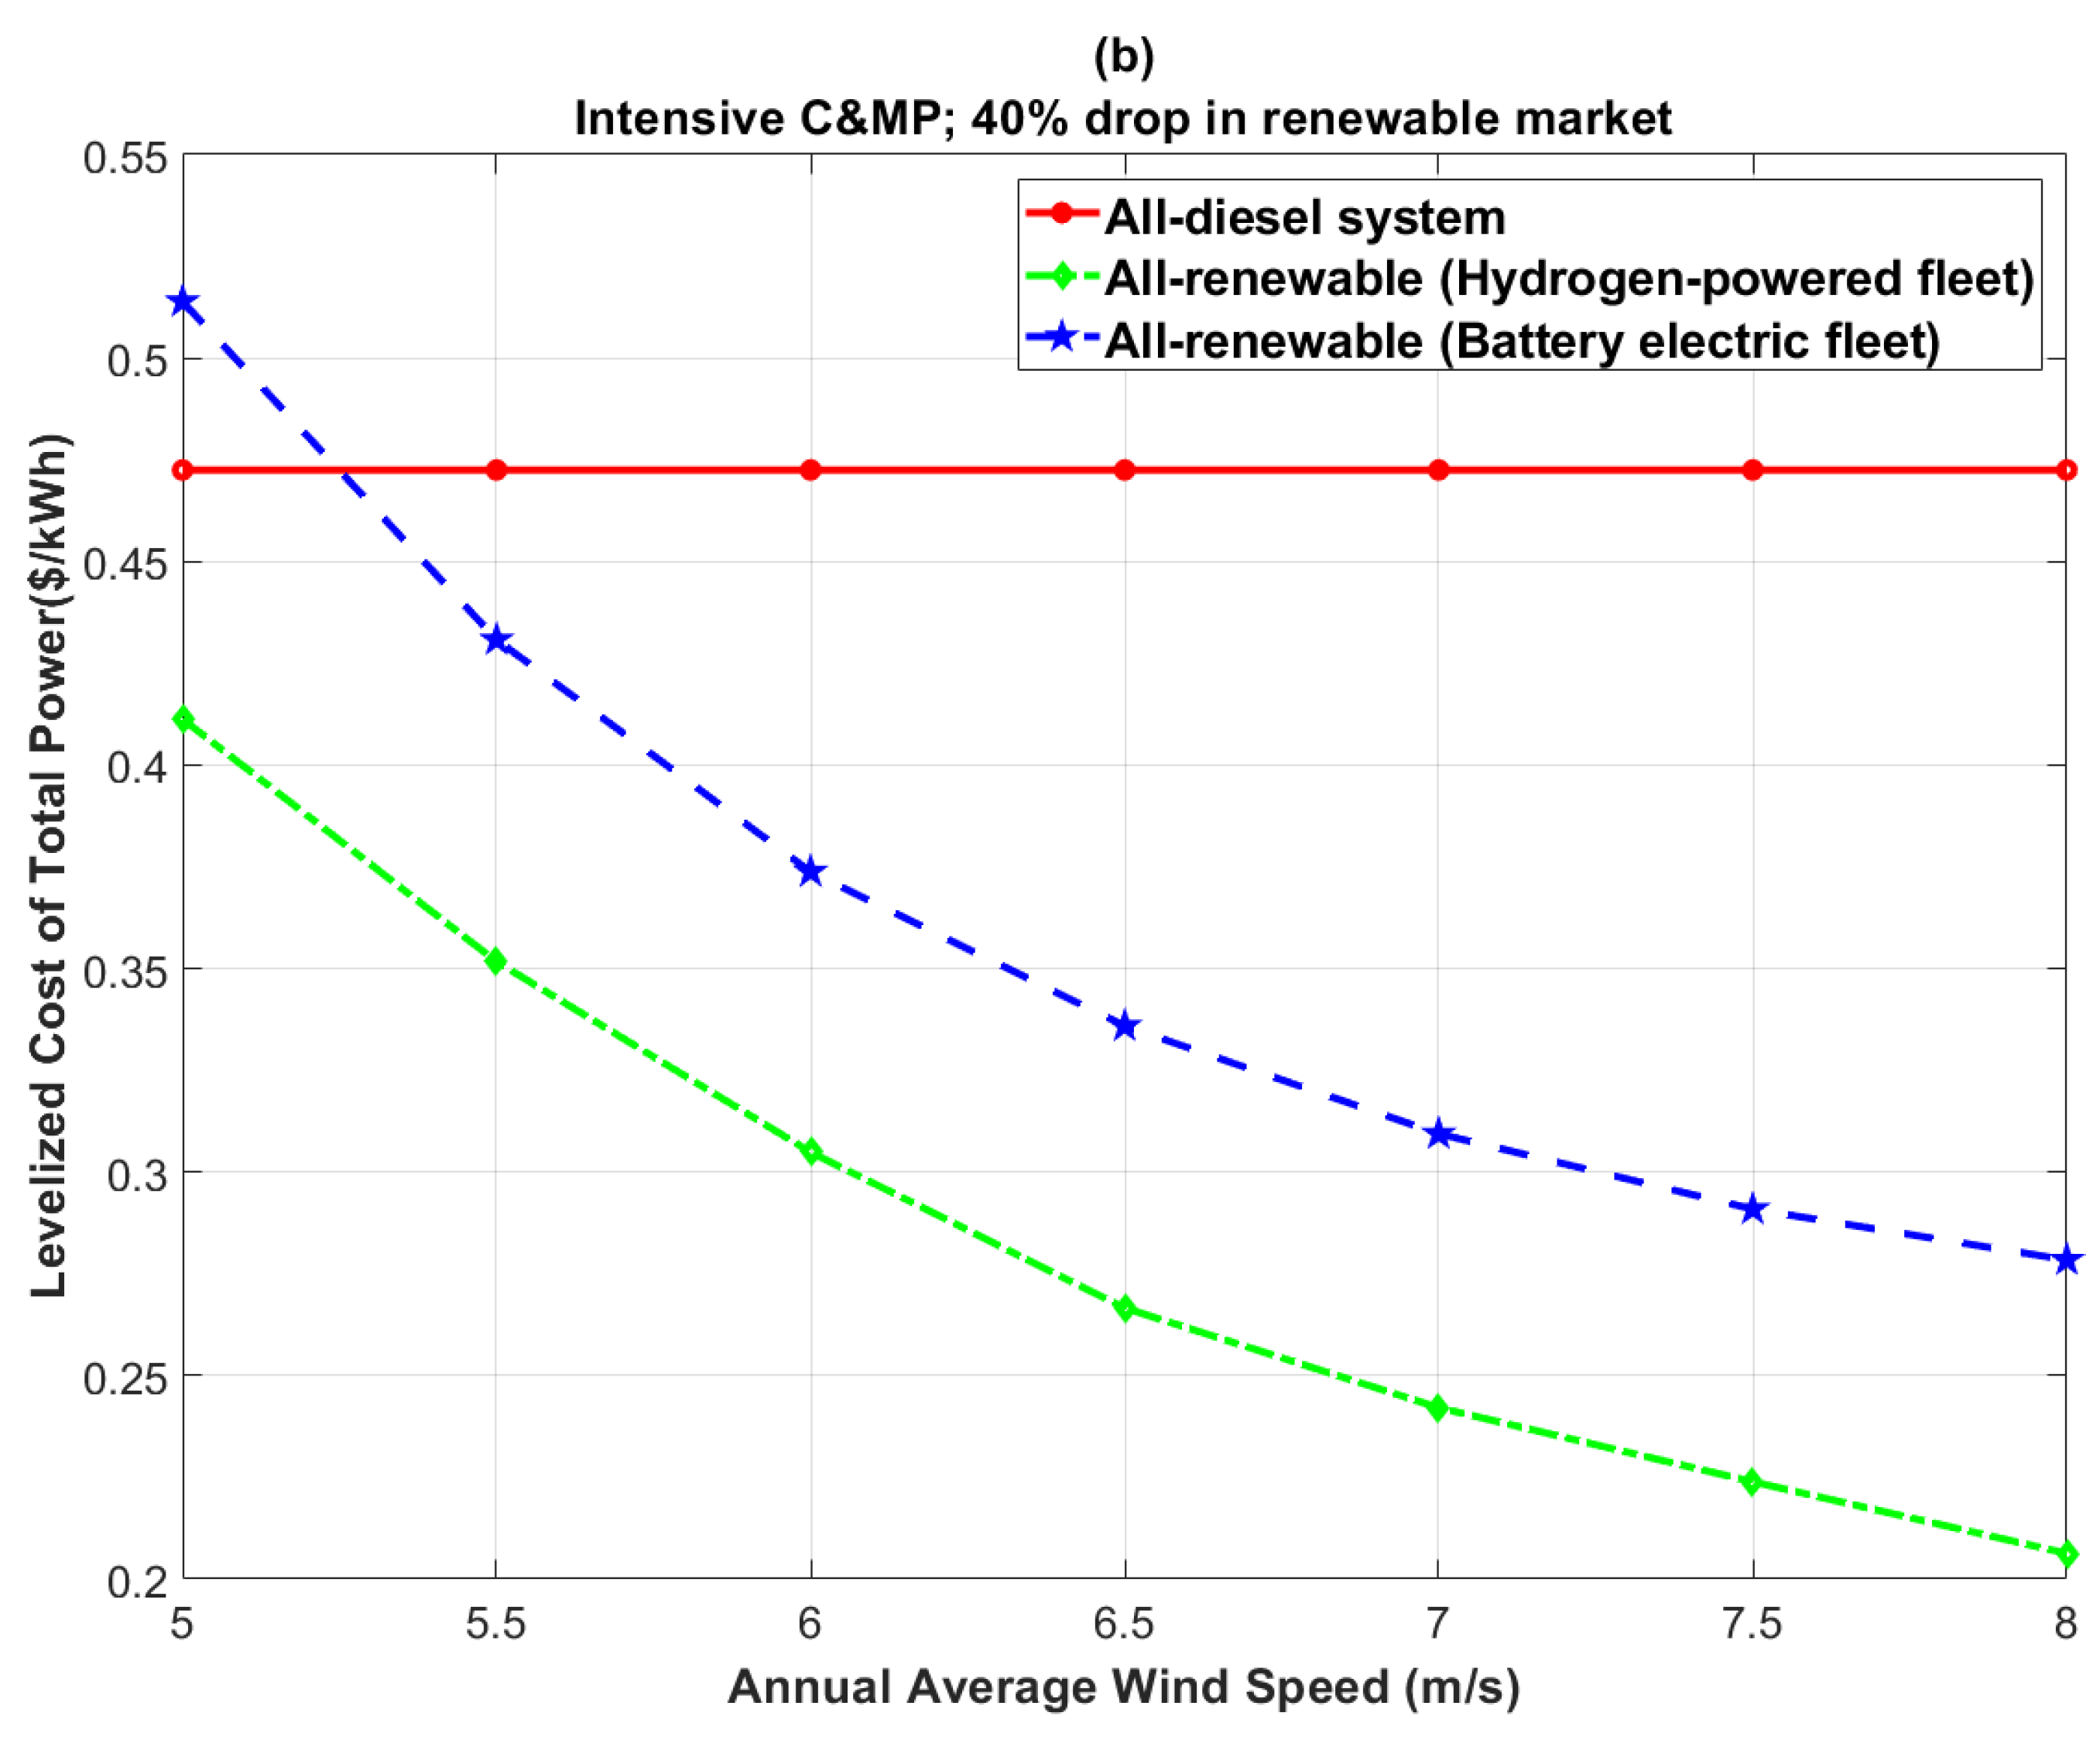
3.3. Parametric Analysis
4. Conclusions
Author Contributions
Funding
Institutional Review Board Statement
Informed Consent Statement
Data Availability Statement
Conflicts of Interest
References
- Bharathan, B.; Sasmito, A.P.; Madiseh, S.A.G. Analysis of energy consumption and carbon footprint from underground haulage with different power sources in typical Canadian mines. J. Clean. Prod. 2017, 166, 21–31. [Google Scholar] [CrossRef]
- Climate Risk and Decarbonization: What Every Mining CEO Needs to Know|McKinsey. Available online: https://www.mckinsey.com/business-functions/sustainability/our-insights/climate-risk-and-decarbonization-what-every-mining-ceo-needs-to-know (accessed on 3 June 2022).
- Diavik Diamond Mine Made a Wind Farm for Power|Mining & Energy. Available online: https://www.miningandenergy.ca/sustainability/article/diavik_diamond_mine_turns_to_wind/ (accessed on 17 August 2021).
- Glencore RAGLAN Mine Renewable Electricity Smart-Grid Pilot Demonstration. Available online: https://www.nrcan.gc.ca/science-and-data/funding-partnerships/funding-opportunities/current-investments/glencore-raglan-mine-renewable-electricity-smart-grid-pilot-demonstration/16662 (accessed on 17 August 2021).
- Rieussec, E. Greenhouse Gas Emissions Canadian Environmental Sustainability Indicators. Available online: https://www.canada.ca/content/dam/eccc/documents/pdf/cesindicators/ghg-emissions/2022/ghg-emissions-en.pdf/ (accessed on 11 June 2022).
- Hlal, M.I.; Ramachandaramurthy, V.K.; Sarhan, A.; Pouryekta, A.; Subramaniam, U. Optimum battery depth of discharge for off-grid solar PV/battery system. J. Energy Storage 2019, 26, 100999. [Google Scholar] [CrossRef]
- Journal, T.; Salkuti, S.R. Comparative analysis of electrochemical energy storage technologies for smart grid. TELKOMNIKA Telecommun. Comput. Electron. Control. 2020, 18, 2118–2124. [Google Scholar] [CrossRef]
- Uyar, T.S.; Beşikci, D. Integration of hydrogen energy systems into renewable energy systems for better design of 100% renewable energy communities. Int. J. Hydrogen Energy 2017, 42, 2453–2456. [Google Scholar] [CrossRef]
- Calderón, M.; Calderón, A.J.; Ramiro, A.; González, J.F.; González, I. Evaluation of a hybrid photovoltaic-wind system with hydrogen storage performance using exergy analysis. Int. J. Hydrogen Energy 2011, 36, 5751–5762. [Google Scholar] [CrossRef]
- Kalinci, Y.; Dincer, I.; Hepbasli, A. Energy and exergy analyses of a hybrid hydrogen energy system: A case study for Bozcaada. Int. J. Hydrogen Energy 2017, 42, 2492–2503. [Google Scholar] [CrossRef]
- Marchenko, O.V.; Solomin, S.V. Modeling of hydrogen and electrical energy storages in wind/PV energy system on the Lake Baikal coast. Int. J. Hydrogen Energy 2017, 42, 9361–9370. [Google Scholar] [CrossRef]
- Dursun, B. Determination of the optimum hybrid renewable power generating systems for Kavakli campus of Kirklareli University, Turkey. Renew. Sustain. Energy Rev. 2012, 16, 6183–6190. [Google Scholar] [CrossRef]
- Khalid, F.; Dincer, I.; Rosen, M.A. Analysis and assessment of an integrated hydrogen energy system. Int. J. Hydrogen Energy 2016, 41, 7960–7967. [Google Scholar] [CrossRef]
- Lundh, M.; Dalenbäck, J.O. Swedish solar heated residential area with seasonal storage in rock: Initial evaluation. Renew. Energy 2008, 33, 703–711. [Google Scholar] [CrossRef]
- Amiri, L.; De Brito, M.A.R.; Baidya, D.; Kuyuk, A.F.; Ghoreishi-Madiseh, S.A.; Sasmito, A.P.; Hassani, F.P. Numerical investigation of rock-pile based waste heat storage for remote communities in cold climates. Appl. Energy 2019, 252, 113475. [Google Scholar] [CrossRef]
- Kalantari, H.; Ghoreishi-Madiseh, S.A.; Sasmito, A.P. Hybrid Renewable Hydrogen Energy Solution for Application in Remote Mines. Energies 2020, 13, 6365. [Google Scholar] [CrossRef]
- Benchmarking Guides. Available online: https://www.nrcan.gc.ca/energy-efficiency/energy-efficiency-industry/energy-management-industry/energy-benchmarking-industry/benchmarking-guides/5171#ll (accessed on 17 August 2021).
- HOMER—Hybrid Renewable and Distributed Generation System Design Software. Available online: https://www.homerenergy.com/ (accessed on 17 August 2021).
- Mora, M.A.M.; Vergara, F.C.P.; Delgadillo, S.A.M.; Leiva, M.A. Comparison of carbon balance measuring tools in an enhanced oil recovery project based on the carbon dioxide from the ammonia production process streams. J. Clean. Prod. 2017, 144, 540–552. [Google Scholar] [CrossRef]
- Genç, M.S.; Çelik, M.; Karasu, I. A review on wind energy and wind–hydrogen production in Turkey: A case study of hydrogen production via electrolysis system supplied by wind energy conversion system in Central Anatolian Turkey. Renew. Sustain. Energy Rev. 2012, 16, 6631–6646. [Google Scholar] [CrossRef]
- Al-Sharafi, A.; Sahin, A.Z.; Ayar, T.; Yilbas, B.S. Techno-economic analysis and optimization of solar and wind energy systems for power generation and hydrogen production in Saudi Arabia. Renew. Sustain. Energy Rev. 2017, 69, 33–49. [Google Scholar] [CrossRef]
- Diaf, S.; Diaf, D.; Belhamel, M.; Haddadi, M.; Louche, A. A methodology for optimal sizing of autonomous hybrid PV/wind system. Energy Policy 2007, 35, 5708–5718. [Google Scholar] [CrossRef]
- Anoune, K.; Bouya, M.; Astito, A.; Ben Abdellah, A. Sizing methods and optimization techniques for PV-wind based hybrid renewable energy system: A review. Renew. Sustain. Energy Rev. 2018, 93, 652–673. [Google Scholar] [CrossRef]
- Hakimi, S.M.; Moghaddas-Tafreshi, S.M. Optimal sizing of a stand-alone hybrid power system via particle swarm optimization for Kahnouj area in south-east of Iran. Renew. Energy 2009, 34, 1855–1862. [Google Scholar] [CrossRef]
- Flamm, B.; Peter, C.; Büchi, F.N.; Lygeros, J. Electrolyzer modeling and real-time control for optimized production of hydrogen gas. Appl. Energy 2021, 281, 116031. [Google Scholar] [CrossRef]
- Hydrogen and Fuel Cell Technologies Office Multi-Year Research, Development, and Demonstration Plan|Department of Energy. Available online: https://www.energy.gov/eere/fuelcells/downloads/hydrogen-and-fuel-cell-technologies-office-multi-year-research-development (accessed on 17 August 2021).
- Fathy, A. A reliable methodology based on mine blast optimization algorithm for optimal sizing of hybrid PV-wind-FC system for remote area in Egypt. Renew. Energy 2016, 95, 367–380. [Google Scholar] [CrossRef]
- Caterpillar 797. Available online: https://www.caranddriver.com/reviews/a15140071/caterpillar-797-specialty-file/ (accessed on 17 August 2021).
- Harrison, K.; Peters, M. Renewable Electrolysis Integrated System Development & Testing. In Proceedings of the 2014 DOE Hydrogen and Fuel Cells Program Review, Washington, DC, USA, 16–20 June 2014. [Google Scholar]
- Krishan, O.; Suhag, S. Techno-economic analysis of a hybrid renewable energy system for an energy poor rural community. J. Energy Storage 2019, 23, 305–319. [Google Scholar] [CrossRef]
- Varaschin, J.; De Souza, E. Economics of diesel fleet replacement by electric mining equipment. In Proceedings of the 15th North American Mine Ventilation Symposium, Blacksburg, VA, USA, 20–25 June 2015. [Google Scholar]
- Esposito, D.V. Membraneless Electrolyzers for Low-Cost Hydrogen Production in a Renewable Energy Future. Joule 2017, 1, 651–658. [Google Scholar] [CrossRef]
- Gabbar, H.A.; Abdussami, M.R.; Adham, M.I. Techno-Economic Evaluation of Interconnected Nuclear-Renewable Micro Hybrid Energy Systems with Combined Heat and Power. Energies 2020, 13, 1642. [Google Scholar] [CrossRef]
- Transportation Fuel Prices. Available online: https://www.nrcan.gc.ca/our-natural-resources/domestic-and-international-markets/transportation-fuel-prices/4593 (accessed on 17 August 2021).
- Garcia, R.S.; Weisser, D. A wind–diesel system with hydrogen storage: Joint optimisation of design and dispatch. Renew. Energy 2006, 31, 2296–2320. [Google Scholar] [CrossRef]
- Chi, J.; Yu, H. Water electrolysis based on renewable energy for hydrogen production. Chin. J. Catal. 2018, 39, 390–394. [Google Scholar] [CrossRef]
- Luta, D.N.; Raji, A.K. Optimal sizing of hybrid fuel cell-supercapacitor storage system for off-grid renewable applications. Energy 2019, 166, 530–540. [Google Scholar] [CrossRef]
- Ahmad, J.; Imran, M.; Khalid, A.; Iqbal, W.; Ashraf, S.R.; Adnan, M.; Ali, S.F.; Khokhar, K.S. Techno economic analysis of a wind-photovoltaic-biomass hybrid renewable energy system for rural electrification: A case study of Kallar Kahar. Energy 2018, 148, 208–234. [Google Scholar] [CrossRef]
- Finding Data to Run HOMER. Available online: https://www.homerenergy.com/products/pro/docs/latest/finding_data_to_run_homer.html (accessed on 17 August 2021).
- Khojasteh-Salkuyeh, Y.; Ashrafi, O.; Mostafavi, E.; Navarri, P. CO2 utilization for methanol production; Part I: Process design and life cycle GHG assessment of different pathways. J. CO2 Util. 2021, 50, 101608. [Google Scholar] [CrossRef]
- NASA. Power Data Access View. 2019. Available online: https://power.larc.nasa.gov/data-access-viewer/ (accessed on 17 August 2019).
- CIM Magazine February 2022 by CIM-ICM Publications—Issuu. Available online: https://issuu.com/cim-icm_publications/docs/february2022_full (accessed on 3 June 2022).


| Storage Type | Application | Summary | Reference |
|---|---|---|---|
| Hydrogen storage | Wind/solar renewable energy system | Their results confirm the positive impact of hydrogen and fuel cells for storage and transportation applications. | Uyar et al. [8] |
| Hydrogen storage | Hybrid solar/wind energy system | The results of their tests showed a fair exergy efficiency for electrolyzer (68.75%) and quite low for fuel cell (35.9%). The lowest efficiency is reported to be the PV modules (8.39%). | Calderon et al. [9] |
| Hydrogen storage | Hybrid solar/wind energy system for a residential application in Bozcaada Island, Turkey | The energy and exergy efficiency of PV array were found to be 13.31% and 14.26%, respectively. Similarly, these efficiencies for wind turbine and electrolyzer were, respectively, reported to be 46%, 50.12%, 59.68% and 60.26%. | Kalinci et al. [10] |
| Multi-storage (battery-hydrogen) | Hybrid solar/wind energy system for a residential application in the Lake Baikal coast | According to the results of their study, integrating hydrogen storage to the system substantially improves the economic performance of the system. | Marchenko et al. [11] |
| Hydrogen storage | Solar renewable energy system for application in Kirklareli university campus in Turkey | The optimal scenario was reported to be the grid-connected PV hybrid system with USD0.256/kWh levelized cost of electricity. | Dursun [12] |
| Hydrogen storage | Hybrid solar/wind energy system for residential application in Oshawa, Canada | The exergy and energy efficiencies of the proposed renewable system are calculated to be 26.8% and 26%, respectively. Additionally, the levelized cost of electricity supplied by the renewable system was reported to be USD0.862/kWh. | Khalid et al. [13] |
| Borehole thermal storage | Solar renewable energy system for residential applications in Anneberg, Sweden | Despite low efficiencies of some of the studies scenarios, the idea was found to be feasible for the case study. | Lundh and Dalenbäck [14] |
| Rock-pile seasonal thermal storage | Waste thermal energy from diesel generator exhaust in arctic regions | The thermal storage system was revealed to be feasible for the investigated case study with less than 5 years of payback period. | Amiri et. al. [15] |
| Multi-storage (battery-hydrogen-thermal storage) | Wind renewable energy system for application in underground mines | According to the results of the study, renewable system with battery electric vehicles and multi-storage (battery-hydrogen-thermal storage) configuration was revealed to be the most favorable scenario for application in underground mines. | Kalantari et al. [16] |
| Parameters | Value | Ref | Parameters | Value | Ref |
|---|---|---|---|---|---|
| Rate of nominal discount (i’) | [26] | The mine lifetime (years) | - | ||
| Rate of inflation (f) | [26] | Efficiency of fuel cell | [27] | ||
| Capital cost of fuel cell (USD/kW) * | [28] | Efficiency of electrolyzer | [29,30] | ||
| Replacement cost of fuel cell (USD/kW) * | [28] | Efficiency of convertor Battery lifetime (years) | 10 | [21] [30] | |
| Capital cost of battery (USD/kWh) * | [30] | Fuel cell lifetime (years) | [27] | ||
| Replacement cost of battery (USD/kWh) * | [30] | Diesel truck lifetime (years) | [28] | ||
| Capital cost of diesel truck (USD/kW) | [28] | Hydrogen-powered truck lifetime (years) Battery electric truck lifetime (years) | 2 | [28,31] [28,31] | |
| Replacement cost of diesel truck (USD/kW) | [28] | Electrolyzer lifetime (years) | [32] | ||
| Capital cost of hydrogen-powered truck (USD/kW) | [28,31] | Turbine lifetime (years) | [33] | ||
| Replacement cost of hydrogen-powered truck (USD/kW) | [28,31] | Convertor lifetime (years) | [21] | ||
| Capital cost of battery electric truck (USD/kW) | [28,31] | HTank lifetime (years) | [27] | ||
| Replacement cost of battery electric truck (USD/kW) | [28,31] | Price of diesel (USD/L) Capital cost of diesel generator (USD/kW) | 900 | [34] [35] | |
| Capital cost of electrolyzer (USD/kW) * | [30,36] | Replacement cost of diesel generator (USD/kW) | [35] | ||
| Replacement cost of electrolyzer (USD/kW) * | [30,36] | Capital cost of thermal storage (USD/MWh) | [15] | ||
| Capital cost of HTank (USD/kg) | [37] | Carbon emission penalty (USD/tonne) | [17] | ||
| Replacement cost of HTank (USD/kg) | [37] | Convertor capital cost (USD/kw) | [21] | ||
| Capital cost of wind turbine (USD/kW) | [38] | Replacement cost of convertor (USD/kW) | [21] | ||
| Replacement cost of wind turbine (USD/kW) | [38] | Swapping batteries lifetime | 1 | [28] | |
| Lower heating value of diesel (MJ/kg) | 43.2 | [39] | Fuel cell heat recovery ratio | 60 | [39] |
| Density of diesel (kg/m3) | 820 | [39] | Thermal storage efficiency | 90 | [15] |
| Density of H2 (kg/m3) (MJ/kg) | 0.09 | [39] | Electric boiler efficiency | 95 | [40] |
| Lower heating value of H2 (MJ/kg) | 120 | [39] | Battery bank roundtrip efficiency | 90 | [39] |
| Installation | Scenario: Minimal C&MP | ||||||
|---|---|---|---|---|---|---|---|
| DPF | HPF | BEF | |||||
| Batt. and FC | FC | Batt. | Batt. and FC | FC | Batt. | ||
| Diesel generator (MW) | 4.5 | - | - | - | - | ||
| Diesel boiler (kW) | 1400 | - | - | - | - | ||
| Wind turbine (MW) | - | 31.5 | 33 | 30 | 28.5 | 31.5 | 31.5 |
| Battery (MWh) | - | 11 | - | 31 | 19 | - | 146 |
| Converter (MW) | - | 26 | 30 | 25 | 19 | 19 | 19 |
| Fuel cell (MW) | - | 1.2 | 3 | - | 5.5 | 7 | - |
| Electrolyzer (MW) | - | 26 | 27 | 24 | 15 | 14 | - |
| H2 tank (tonne) | - | 23 | 24 | 24 | 11 | 14 | - |
| Thermal storage (MWh) | - | 130 | 80 | 90 | 80 | 70 | 50 |
| Electric heater (kW) | - | 2000 | 3100 | 3400 | 1300 | 1200 | 1100 |
| Mobile fleet (kW) | 2700 | 2700 | 2700 | 2700 | 4800 | 4800 | 4800 |
| CO2 emissions (tonne/yr) | 26,000 | - | - | - | - | - | - |
| LCOE (USD/kWh) | 0.47 | 0.47 | 0.48 | 0.48 | 0.66 | 0.68 | 0.77 |
| Installation | Scenario: Intensive C&MP | ||||||
|---|---|---|---|---|---|---|---|
| DPF | HPF | BEF | |||||
| Batt. and FC | FC | Batt. | Batt. and FC | FC | Batt. | ||
| Diesel generator (MW) | 7 | - | - | - | - | - | - |
| Diesel boiler (kW) | 800 | - | - | - | - | - | - |
| Wind turbine (MW) | - | 27 | 30 | 25.5 | 28.5 | 31.5 | 27 |
| Battery (MWh) | - | 22 | - | 64 | 10 | - | 157 |
| Converter (MW) | - | 21 | 19 | 15 | 18 | 14 | 17 |
| Fuel cell (MW) | - | 1.8 | 5 | - | 6 | 7 | - |
| Electrolyzer (MW) | - | 20 | 20 | 15 | 12.5 | 12 | - |
| H2 tank (tonne) | - | 20 | 25 | 20 | 11 | 13 | - |
| Thermal storage (MWh) | - | 60 | 50 | 60 | 50 | 40 | 30 |
| Electric heater (kW) | - | 1000 | 750 | 1100 | 700 | 650 | 700 |
| Mobile fleet (kW) | 1600 | 1600 | 1600 | 1600 | 2800 | 2800 | 2800 |
| CO2 emissions (tonne/yr) | 28,000 | - | - | - | - | - | - |
| LCOE (USD/kWh) | 0.47 | 0.41 | 0.43 | 0.44 | 0.51 | 0.53 | 0.62 |
Publisher’s Note: MDPI stays neutral with regard to jurisdictional claims in published maps and institutional affiliations. |
© 2022 by the authors. Licensee MDPI, Basel, Switzerland. This article is an open access article distributed under the terms and conditions of the Creative Commons Attribution (CC BY) license (https://creativecommons.org/licenses/by/4.0/).
Share and Cite
Kalantari, H.; Ghoreishi-Madiseh, S.A. Hybrid Renewable Hydrogen Energy Solution for Remote Cold-Climate Open-Pit Mines. Hydrogen 2022, 3, 312-332. https://doi.org/10.3390/hydrogen3030019
Kalantari H, Ghoreishi-Madiseh SA. Hybrid Renewable Hydrogen Energy Solution for Remote Cold-Climate Open-Pit Mines. Hydrogen. 2022; 3(3):312-332. https://doi.org/10.3390/hydrogen3030019
Chicago/Turabian StyleKalantari, Hosein, and Seyed Ali Ghoreishi-Madiseh. 2022. "Hybrid Renewable Hydrogen Energy Solution for Remote Cold-Climate Open-Pit Mines" Hydrogen 3, no. 3: 312-332. https://doi.org/10.3390/hydrogen3030019
APA StyleKalantari, H., & Ghoreishi-Madiseh, S. A. (2022). Hybrid Renewable Hydrogen Energy Solution for Remote Cold-Climate Open-Pit Mines. Hydrogen, 3(3), 312-332. https://doi.org/10.3390/hydrogen3030019