Article

Spontaneous Ignition of Cryo-Compressed Hydrogen in a T-Shaped Channel System

Hydrogen Safety Engineering and Research Centre (HySAFER), Ulster University, Shore Road, Newtownabbey BT37 0QB, UK
*
Author to whom correspondence should be addressed.
Hydrogen 2022, 3(3), 348-360; https://doi.org/10.3390/hydrogen3030021
Submission received: 6 July 2022 / Revised: 2 August 2022 / Accepted: 17 August 2022 / Published: 20 August 2022

Abstract

:
Sudden releases of pressurised hydrogen may spontaneously ignite by the so-called “diffusion ignition” mechanism. Several experimental and numerical studies have been performed on spontaneous ignition for compressed hydrogen at ambient temperature. However, there is no knowledge of the phenomenon for compressed hydrogen at cryogenic temperatures. The study aims to close this knowledge gap by performing numerical experiments using a computational fluid dynamics model, validated previously against experiments at atmospheric temperatures, to assess the effect of temperature decrease from ambient 300 K to cryogenic 80 K. The ignition dynamics is analysed for a T-shaped channel system. The cryo-compressed hydrogen is initially separated from the air in the T-shaped channel system by a burst disk (diaphragm). The inertia of the burst disk is accounted for in the simulations. The numerical experiments were carried out to determine the hydrogen storage pressure limit leading to spontaneous ignition in the configuration under investigation. It is found that the pressure limit for spontaneous ignition of the cryo-compressed hydrogen at temperature 80 K is 9.4 MPa. This is more than 3 times larger than pressure limit for spontaneous ignition of 2.9 MPa in the same setup at ambient temperature of 300 K.

1. Introduction

A sudden hydrogen release from a high-pressure vessel or equipment through the piping with air can be spontaneously ignited at comparatively low pressures of about 3 MPa for hydrogen storage at ambient temperature. The “diffusion mechanism” of spontaneous ignition was postulated in 1973 by Wolanski and Wojcicki [1], following their observations on ignition occurrence when high-pressure hydrogen was admitted to a shock tube filled with air or oxygen. The authors suggested that ignition was caused by the high-temperature gradient at the contact surface where the oxygen heated by the primary shock wave, mixed and reacted with hydrogen due to diffusion. Experiments conducted by Bazhenova et al. [2] showed that an increase of the fuel initial temperature may cause an earlier ignition or ignition at lower pressures. Similar conclusions were reached by Golub et al. [3]. The authors investigated experimentally the effect of hydrogen pressure, temperature, and shock tube characteristics on the occurrence of spontaneous ignition. For example, it was found that a shock tube diameter should be larger than 3 mm to obtain the ignition at hydrogen pressure below 40 MPa and ambient storage temperature [3]. The authors observed a strong dependence of spontaneous ignition parameters on the initial temperature. For hydrogen pressure equal to 20 MPa, an increase of temperature from 300 K to 400 K caused a decrease in minimum shock tube diameter leading to ignition from 3 mm to 2 mm. In the study by Dryer et al. [4] it was observed that the minimum gas pressure leading to the occurrence of spontaneous ignition is dictated by the reflected shock and shock-shock interactions. These are in turn greatly affected by geometrical details and dynamics of the burst disk failure. Similar conclusions were reached in the experimental work [5,6], as it was found that the potential for spontaneous ignition is determined by both the initial hydrogen pressure and by the rupture rate of the burst disk. Faster rupture rate of the diaphragm causes the faster ignition of hydrogen. The mechanism of spontaneous ignition of pressurised hydrogen release by means of 2D numerical simulations was investigated in [7,8]. Numerical work was in line with experimental observations that a slower rupture time of the burst disk increases the ignition delay time and reduces the likelihood of spontaneous ignition for a given release pressure. Further experiments were conducted by Golub et al. in 2008 [9] to find the limiting pressure for ignition in tubes of different lengths and cross-sectional shapes. The test on a tube with 5 mm diameter and 65 mm extension in [9] was selected by Bragin and Molkov [10] for 3D CFD simulations using a Large Eddy Simulation (LES) with Eddy Dissipation Concept (EDC) for combustion modelling capable to account for interaction of turbulence with chemical reactions. The minimum storage pressure leading to spontaneous ignition was found to be 2.04 MPa. In the following 3D CFD study of Bragin et al. [11] the experiments conducted by Golub et al. [12] on the sudden release of hydrogen from a high-pressure system into a T-shaped channel following the inertial flat burst disk rupture were simulated. The numerical simulations demonstrated significant difference of hydrogen and air mixing in simulations with and without accounting of the burst disk inertia, i.e., gradual (inertial) versus idealised (instantaneous) opening of the burst disk (diaphragm), respectively. These 3D simulations confirmed that the dynamics of the flat burst disk rupture process affects the potential for hydrogen spontaneous ignition and follow-up combustion. Using experimental results and similitude analysis, Gong et al. [13] found that the shock pressure in a tube is a function of not only the storage to ambient pressures ratio, but depends also on the ratio of the characteristic shock propagation time to the burst disk (diaphragm) opening time. Studies [9,10,13,14] investigated the impact of varying burst pressure and release geometry on the spontaneous ignition mechanism. Numerical models [10,14,15,16,17] employed a similar LES approach. Overall, the mentioned experimental and numerical studies demonstrated that the pressure limit of hydrogen storage leading to spontaneous ignition depends on the hydrogen temperature, the geometry of a system, the opening time of a rupture disk, etc. The mechanism of spontaneous ignition was investigated thoroughly in previous studies. However, no work has been carried out for hydrogen at cryogenic temperatures and its effect on the pressure limit for the spontaneous ignition by the “diffusion mechanism”.
Hydrogen can be stored at cryo-compressed conditions, i.e., storage temperature below 120 K, as generally considered for cryogenics [18], and pressures up to 35 MPa [19]. Cryo-compressed hydrogen (CcH2) storage at pressures below 20 MPa is considered to provide a better gain in gravimetric and volumetric capacities against the energy required for the compression and cooling down of the hydrogen gas [20]. Storage systems investigated in [21,22,23] involved insulated pressure vessels refuelled with cryogenic hydrogen at 80 K pressurised up to 30 MPa. This temperature of 80 K is considered in the present study as a representative for the cryogenic releases. Following the trends observed in experimental studies on spontaneous ignition for hydrogen at temperatures higher than ambient [3], it would be expected that a decrease of temperature of compressed hydrogen to cryogenic values would require a higher pressure to obtain spontaneous ignition. However, the impact of increased density of cryogenic releases on the shock ignition process and the trade-off against the increased difficulty of igniting colder gas is unclear. A better understanding of this phenomenon is crucial for hydrogen safety engineering and the inherently safer design and deployment of CcH2 systems and fuelling infrastructure. To the best of the authors’ knowledge, neither experimental nor numerical studies are available on the spontaneous ignition of sudden CcH2 releases. The present study aims to close this knowledge gap by using the 3D CFD simulations to assess the effect of temperature decrease from ambient to cryogenic 80 K on the pressure limit for spontaneous ignition and combustion dynamics in a T-shaped channel filled with air following a flat burst disk rupture.

2. Problem Formulation and Numerical Details

2.1. Problem Formulation

The numerical simulations of the sudden release of hydrogen from a high-pressure system into a T-shaped channel following the flat burst disk rupture reproduce the experimental setup of [12]. These experiments were used to validate the 3D CFD model against spontaneous ignition tests conducted at ambient temperature prior to applying it to the cryogenic scenario. The geometry of the system is shown in Figure 1a. The high-pressure system is composed of a 210 mm long tube with 16 mm internal diameter (ID), connected to a 280 mm long tube with ID = 10 mm. The flat burst disk is located at the end of the latter pressurised tube and, once ruptured, allows hydrogen flow into the mock-up pressure relief device (PRD) open to the atmosphere. The PRD consists of an axial channel with a length of 48 mm and a diameter of 6.5 mm. The PRD has a flat end where two radial channels are located. These two radial channels vent hydrogen into the open atmosphere and have 6.25 mm length and ID = 4 mm. Further details on the hydrogen release system used in the simulations can be found in [11]. Light sensors were located along the axis of the PRD’s radial channels in the experiments [12] to register the occurrence of spontaneous ignition. Ignition was recorded for test at pressure 2.9 MPa, whereas the test at pressure 1.2 MPa did not register light at the sensors. Based on communication with the experimentalists [12] it is reported in [11] that light was registered also for test at pressure 2.43 MPa, though it did not result in development of a sustained jet flame. In this study the simulations are performed for both ambient and cryogenic temperature to find the pressure limit leading to spontaneous ignition. Table 1 shows the matrix of numerical experiments. The pressure limits found from simulations for ambient temperature of hydrogen are then compared to the experimental results [12].

2.2. CFD Model and Numerical Details

The LES model employed in this study is validated against tests on spontaneous ignition in different release geometries (see [10,11]). The choice of the sub-models was aimed to better represent the physical phenomena to exclude dependence from the specific features of the test geometry. In the present study, the approach was updated by using a different combustion sub-model compared to our previous studies. Simulations were carried out using ANSYS Fluent Release 17.2(ANSYS, Canonsburg, PA, USA) as a computational platform. The model solves the conservation equations for mass, momentum, energy and species. The renormalization group (RNG) theory [24] is applied to model sub-grid scale turbulence, given its capability to reproduce turbulent, transitional and laminar flows. The Arrhenius reaction rate model was used for combustion instead of previously applied EDC model. This choice is justified by the small control volume size throughout the numerical grid of 200–400 μm. Hydrogen combustion in the air was simulated by a chemical kinetics mechanism that includes 37 elementary reactions and 18 species [25].
Figure 1a shows details of the numerical calculation domain. A control volume (CV) size equal to 250 μm was employed at the burst disk area and CV size of 400 μm was maintained along the axial channel. A hexahedral mesh was employed in the axial channel, as in this portion of the PRD it could be expected a reasonable alignment of the flow with the structured mesh and thus limitation of the eventual “numerical diffusion”. CV size of 200 μm was used in the zone of intersection between the axial and radial channels. A tetrahedral mesh with smaller CV size was implemented at the intersection, as deemed to better represent the expected more complex structure of the flow and the shock in comparison to the axial channel. CV size was gradually increased to 10 mm in the far-field from the PRD. The total number of CVs in the domain was 417,685.
The external domain boundaries were modelled as a non-reflecting pressure far-field boundary. Tube walls were modelled as non-slip isothermal surfaces for the case with ambient temperature hydrogen, whereas they were modelled as coupled walls made of steel for the case with cryogenic hydrogen. The specific heat for hydrogen at cryogenic temperatures was defined according to the NIST database [26], as a polynomial function of temperature: c p , H 2 = 6.97 · 10 6 T 4 5.23 · 10 3 T 3 + 1.31 T 2 107 T + 13,300 . The initial air composition in the PRD (to the right from the burst disk in Figure 1a) was composed of oxygen and nitrogen with mass fractions 0.23 and 0.77, respectively. At the initial moment, the ambient temperature and pressure were equal to 300 K and Pa, respectively. The pipe walls initial temperature was equal to ambient air. The high-pressure tube was modelled as filled with hydrogen (mass fraction 1.0), and pressure and temperature as given in Table 1. An explicit method was used to solve the governing equations and a four-steps Runge-Kutta algorithm was employed for the time advancement of simulations. The time step was determined from an imposed Courant Friedrichs Lewy (CFL) number of 0.3. A second-order upwind scheme with Advection Upstream Splitting Method (AUSM) was applied for discretisation of convective terms.
Bragin et al. [11] highlighted the importance of modelling the inertial opening of the burst disk as it was found to generate more intense mixing between hydrogen and air and affect the temperature of the heated by shock air. The simulation in [11] of the non-instantaneous diaphragm opening was carried out by subdividing the flat burst disk area into 10 segments (see Figure 1b) and by opening them in sequence. The same technique was employed in this study. The opening time, t, was calculated as suggested in [27]:
t = k ( ρ b d P ) 1 2 ,
where k is a constant equal to 0.92 (range 0.91–0.93), ρ is the density of the diaphragm material, assumed to be annealed copper (8900 kg/m3); b and d are the thickness and diameter of the diaphragm, equal to 5 × 10⁻⁵ and 6.5 × 10⁻³ m, respectively; P is the burst pressure (Pa). The diaphragm section opening time for each of the ten sections for 11 simulated burst pressure scenarios is given in Table 2.
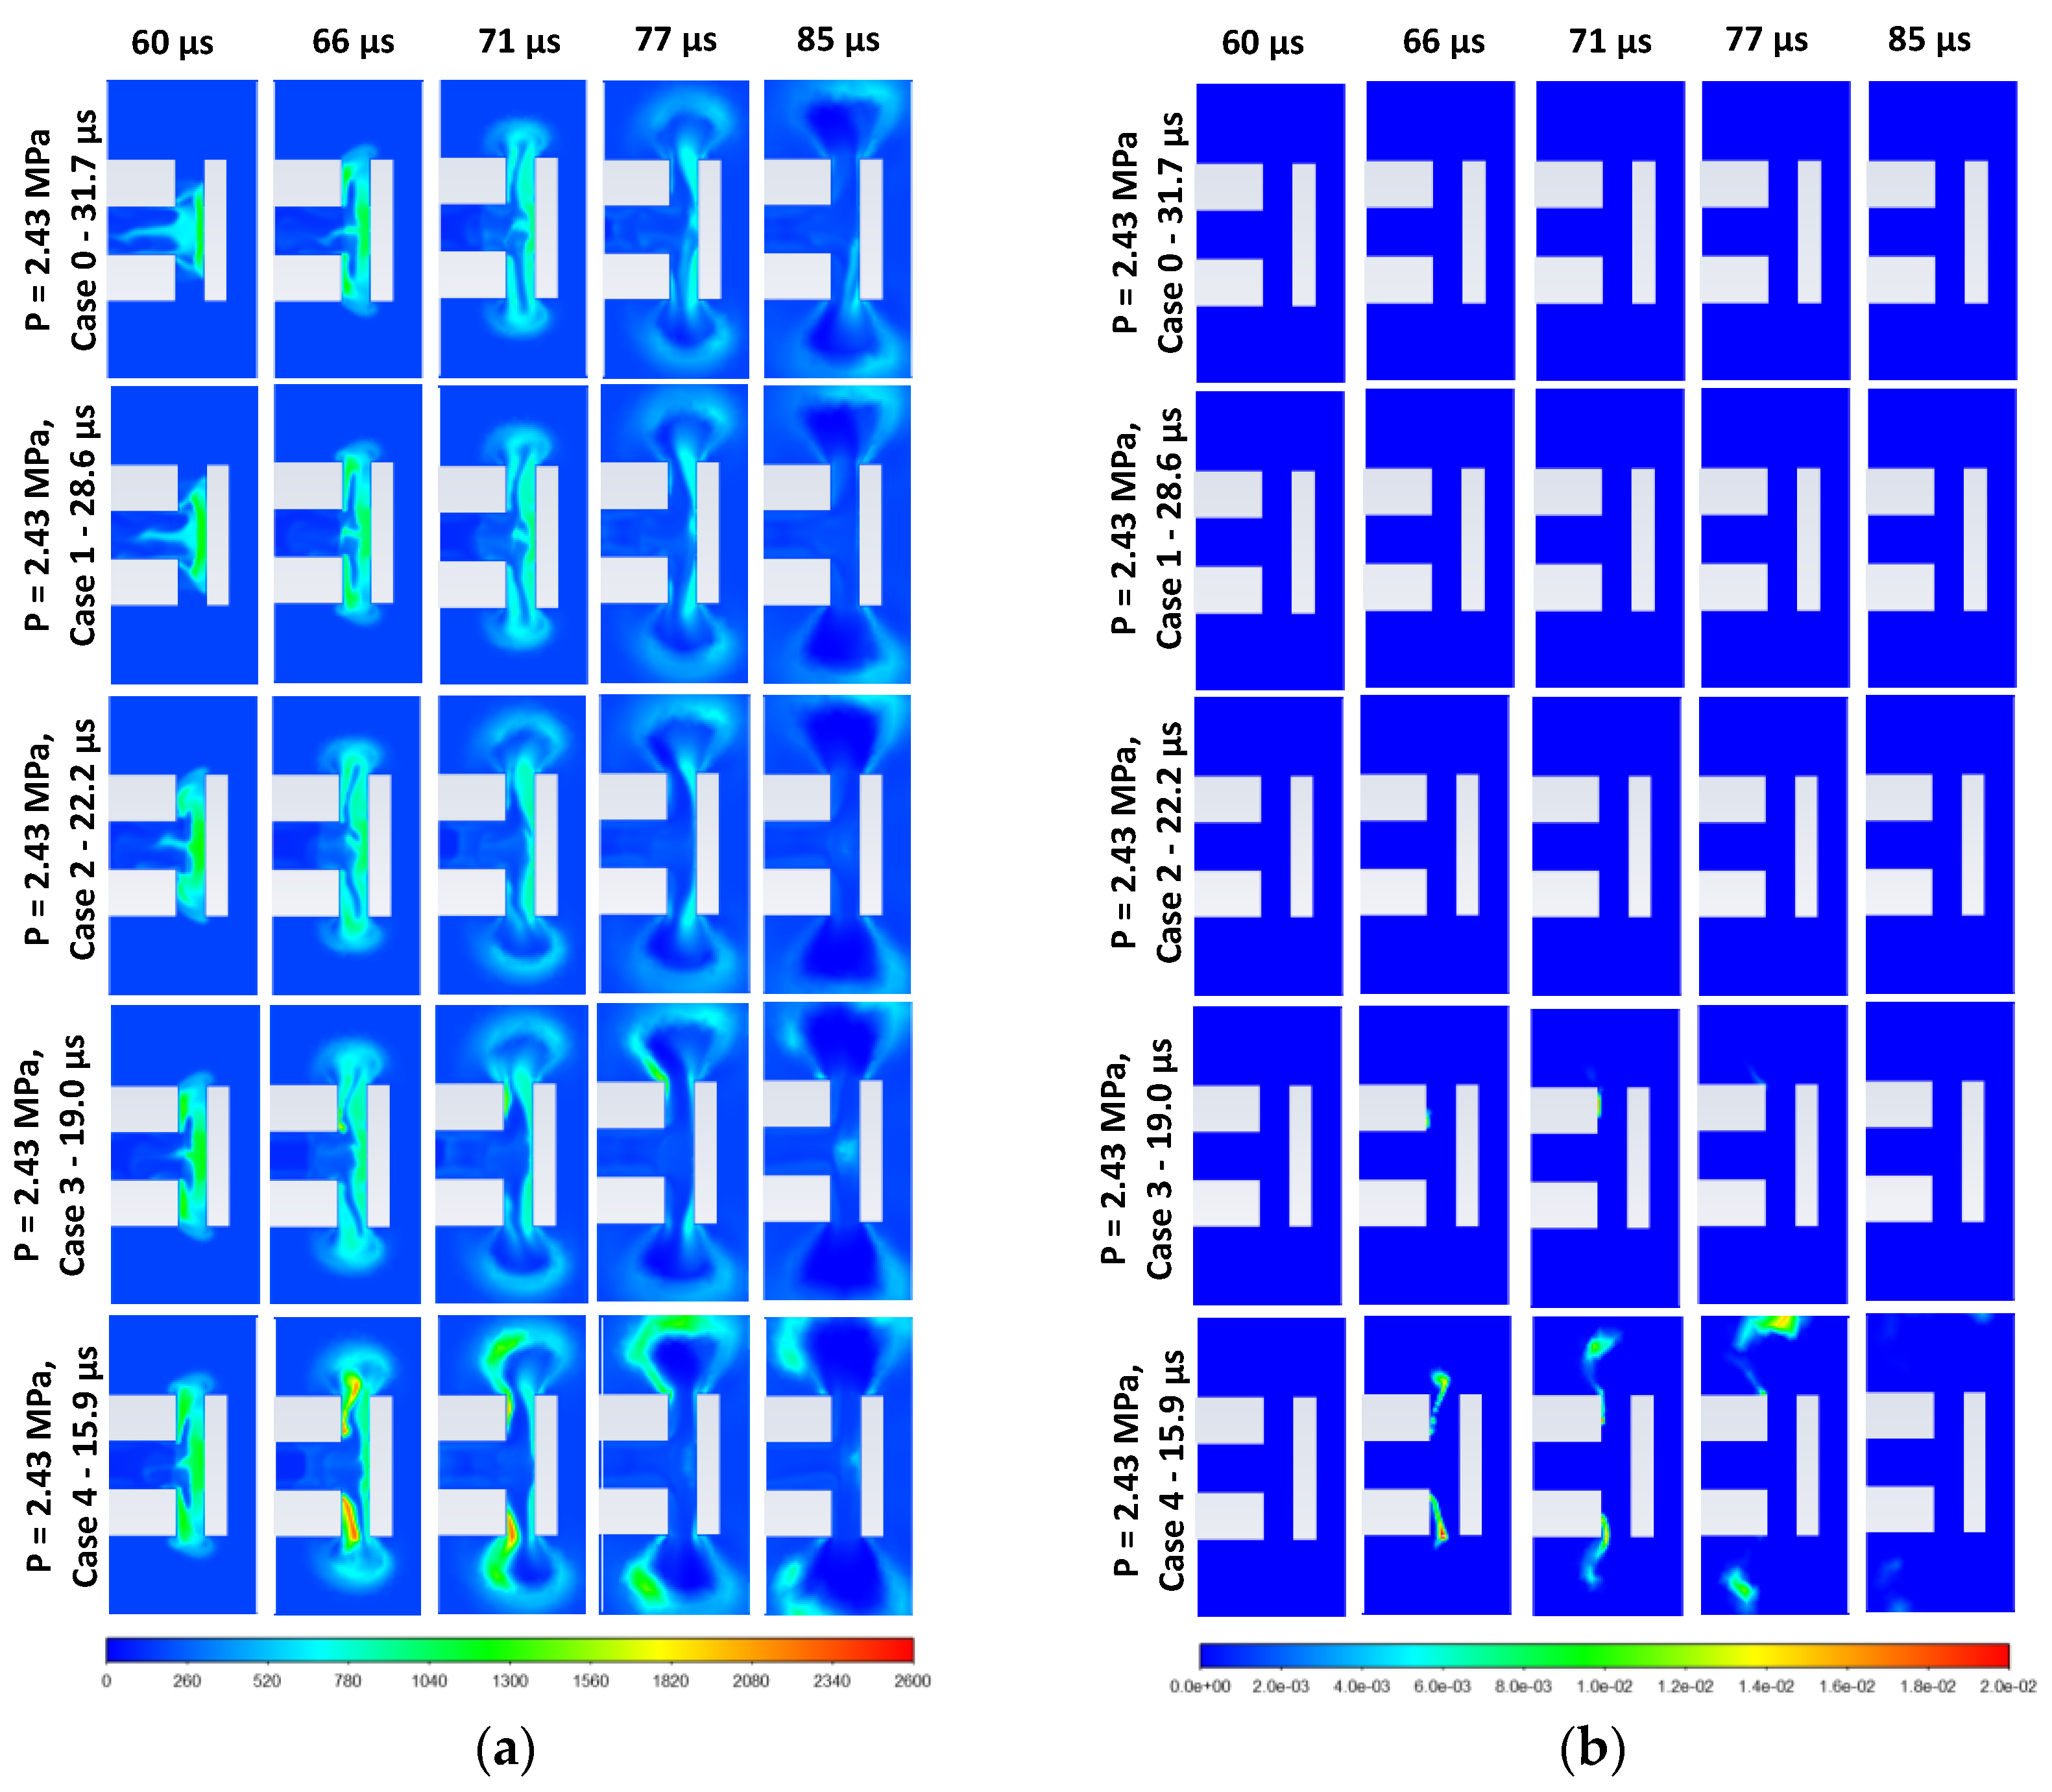
Further simulations were conducted to assess the effect of the diaphragm opening time on the pressure limit leading to spontaneous ignition of compressed hydrogen at pressure equal to 2.43 MPa. As shown in Table 3, four more cases (1–4) were investigated with a gradually thinner membrane, thus resulting in a faster membrane opening by, respectively, 10%, 30%, 40% and 50%. The obtained results are reported in Section 3.1.

3. Results and Discussion

This computational study aims to find the pressure limit which still provides spontaneous ignition and leads to sustained combustion of the hydrogen jet for cryogenic temperature. Results are compared with the limit for spontaneous ignition of hydrogen stored at ambient temperatures. Temperature, hydrogen and hydroxyl (OH) mole fraction profiles are analysed to gain insights into the ignition dynamics. The mole fraction of OH is usually used as an indicator of the location of chemical reactions.
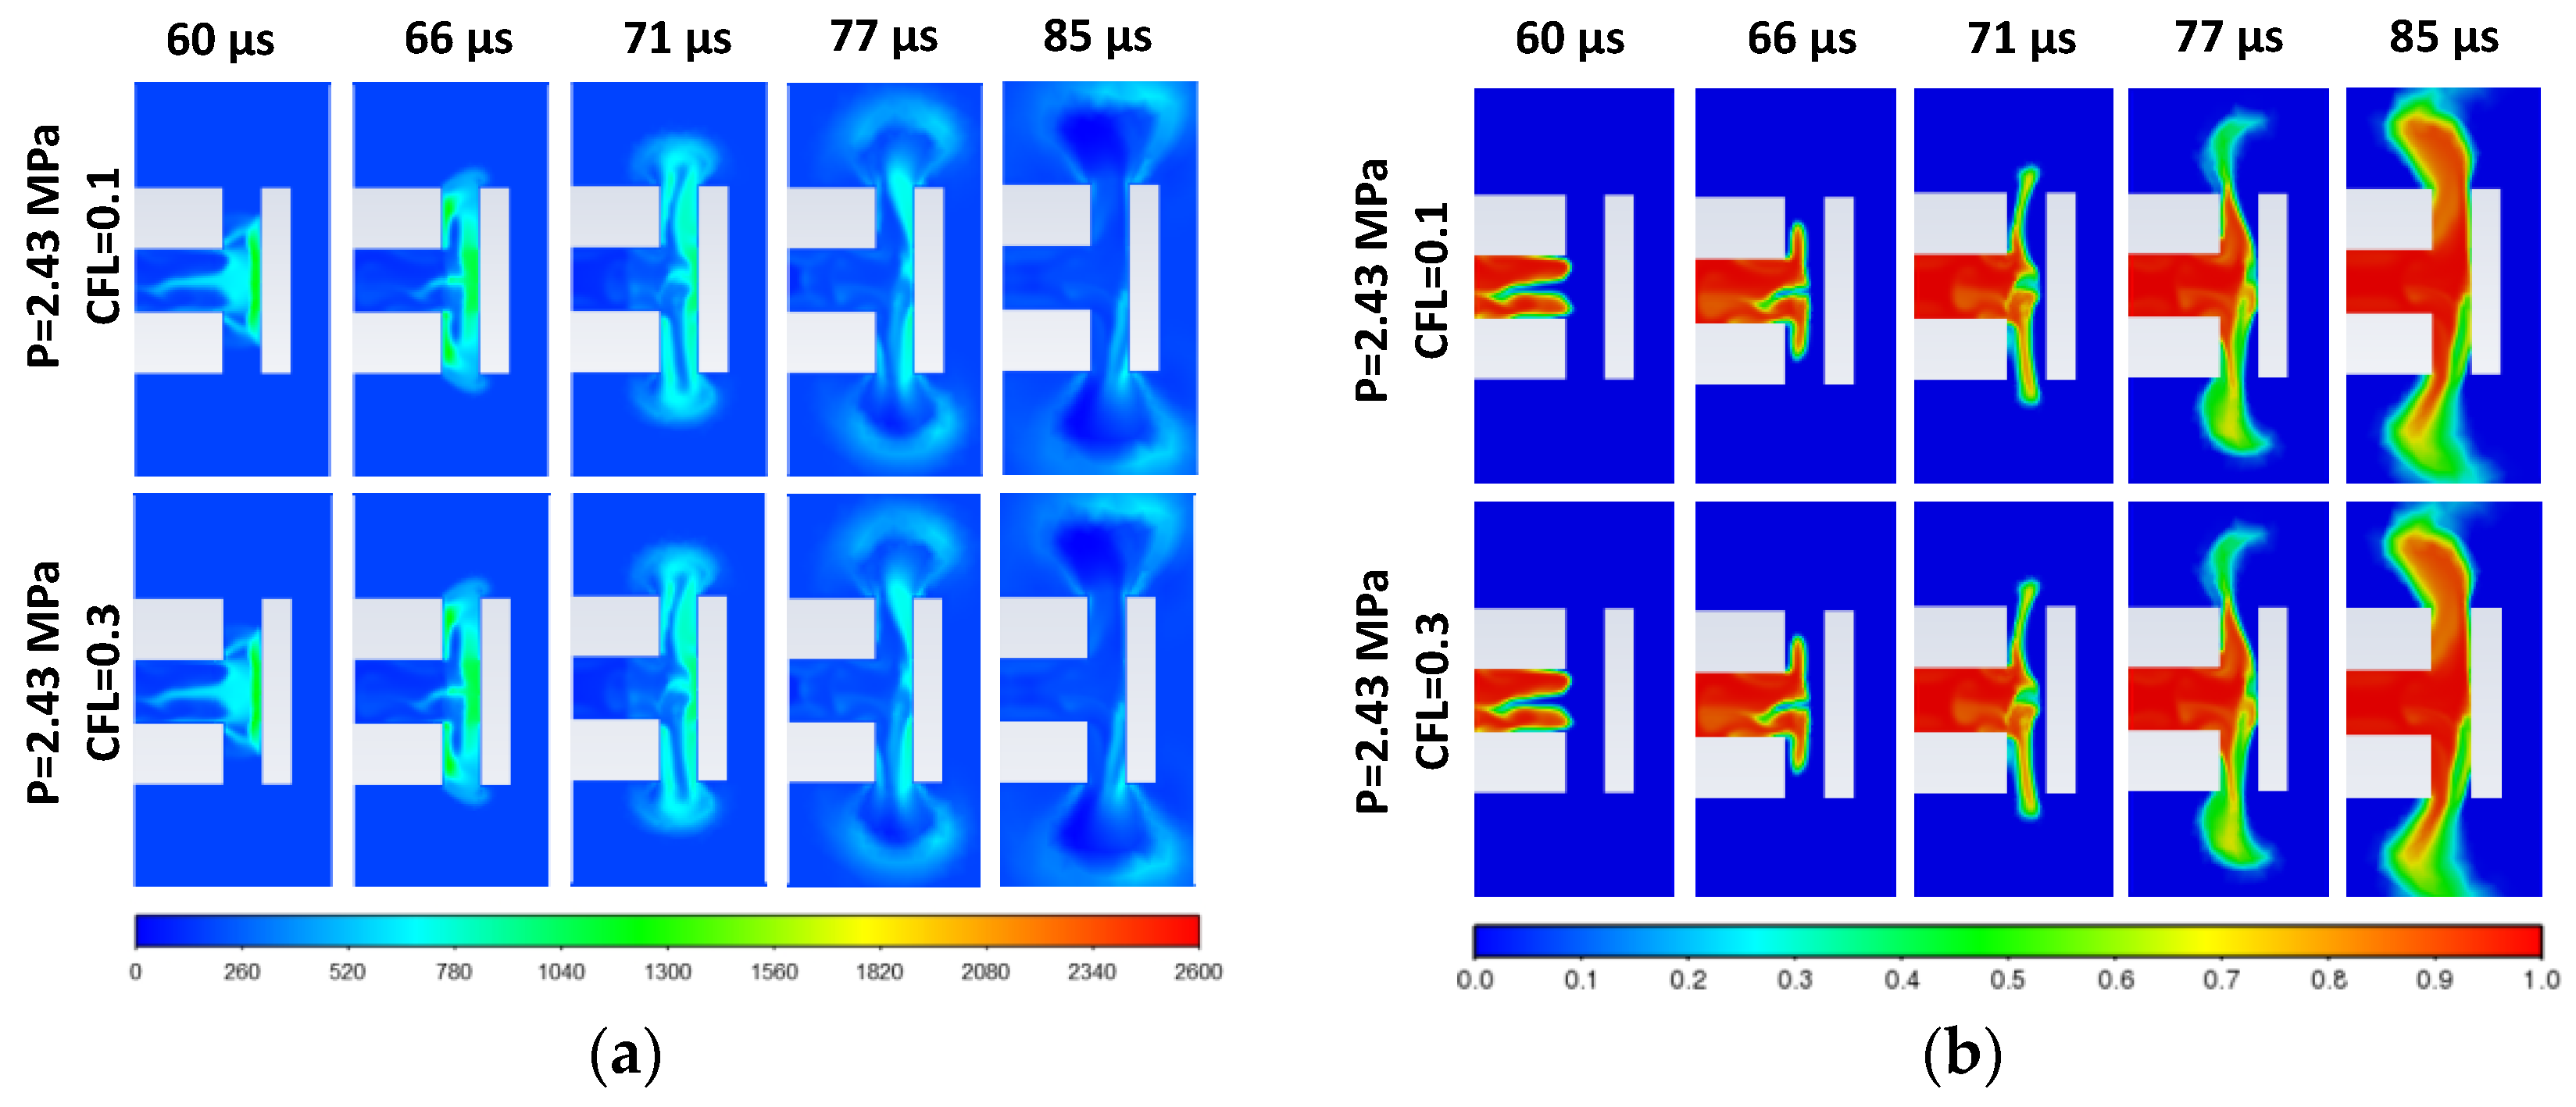
For hydrogen at ambient temperature, an initial storage pressure in the range 1.35 MPa–2.9 MPa has been investigated. Pressure equal to 2.43 MPa is observed to not lead to the ignition. Figure 2a shows the temperature profile across the symmetry plane of the axial channel. Maximum temperature reaches approximately 1500 K in the area of shock wave reflection where no hydrogen is present, see Figure 2b. Temperatures in areas of hydrogen mixed with air are not sufficient to lead to the ignition. This is confirmed by the maximum hydroxyl mole fraction dynamics in time, which, as shown in Figure 3, is rather negligible (horizontal line) during the entire process time when the ignition is expected (up to 90 μs). Results for storage pressures 1.35 MPa and 1.65 MPa are not shown here as they are leading to similar results as 2.43 MPa storage pressure. The absence of ignition for pressure 2.43 MPa somehow differs from the numerical study [11] where ignition was observed, even being rather weak and later self-extinguished. Experiments also confirmed the observations of the numerical study in [11], by recording ignition for this pressure even if then self-extinguished. This non-critical difference could be associated with the employed diaphragm opening time of 31.7 μs. For this reason, the effect of the diaphragm opening time on the ignition occurrence is investigated and reported in the dedicated Section 3.1.
Simulations are performed with CFL = 0.3 and CFL = 0.1 to assess time step convergence of the results. Figure 2 shows that the dynamics of temperature (a) and OH mole fraction (b) distributions for CFLs equal to 0.1 and 0.3 do not present any relevant and detectable difference, proving the time convergence of simulation results. Therefore, CFL = 0.3 is used for the following simulations.
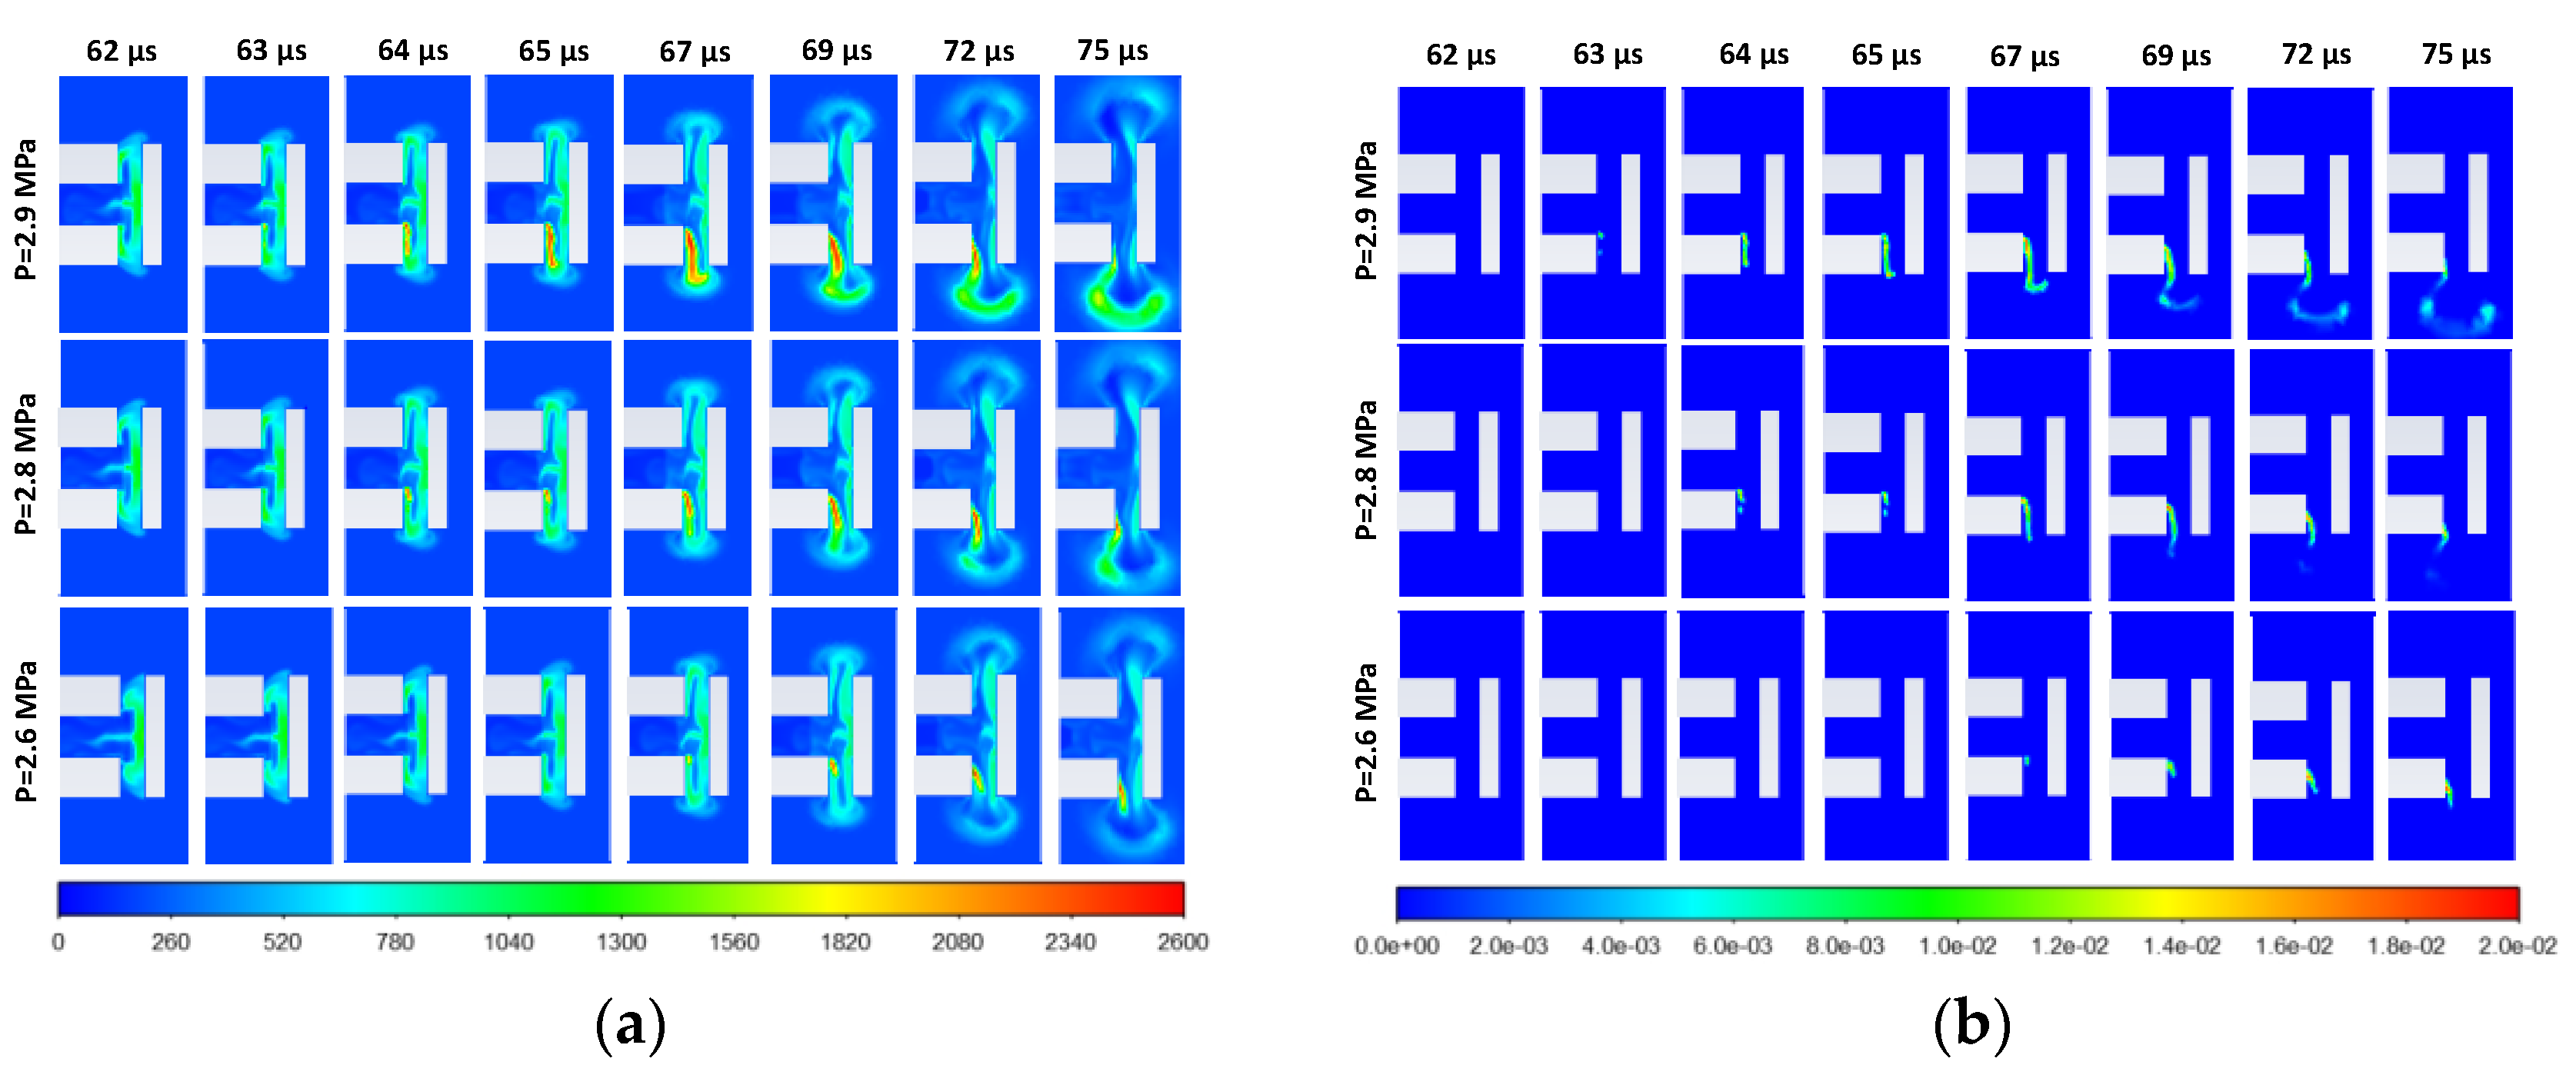
To find the pressure limit providing ignition, the hydrogen pressure is increased from 2.43 MPa to 2.6 MPa. Figure 4 shows the temperature and hydroxyl mole fraction in the time range 62–75 μs. Temperatures up to 2600 K are reached in the radial channels of the PRD. In the high-temperature zone, an OH mole fraction is starting to manifest local ignition at about 67 μs.
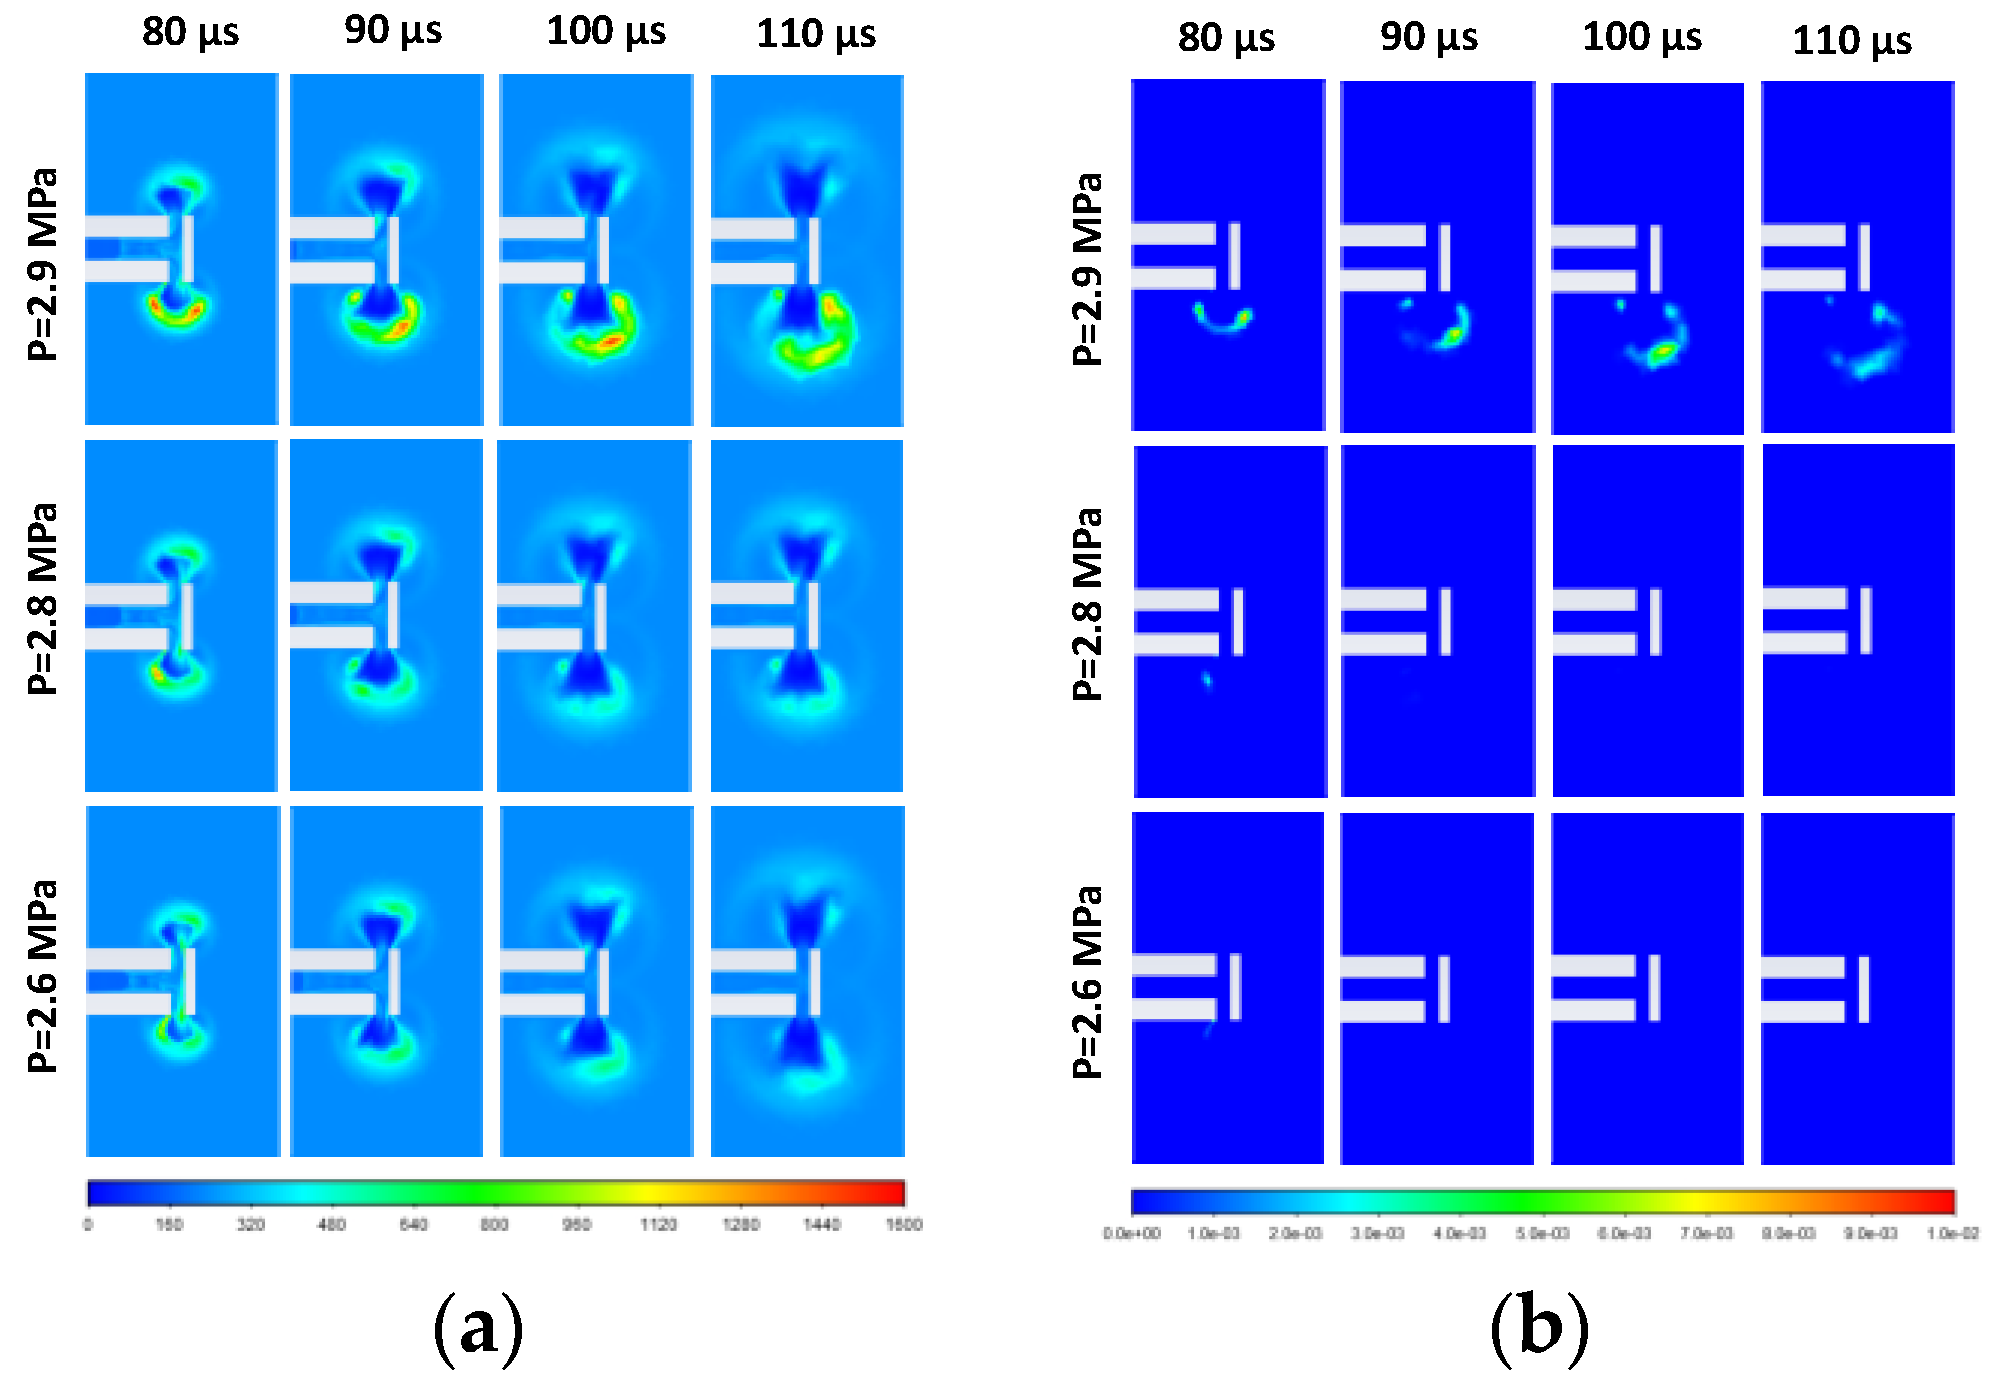
Figure 5 focuses on the combustion dynamics outside the PRD and shows how the OH mole fraction has completely disappeared from the symmetry plane by 90 μs for storage pressure 2.6 MPa.
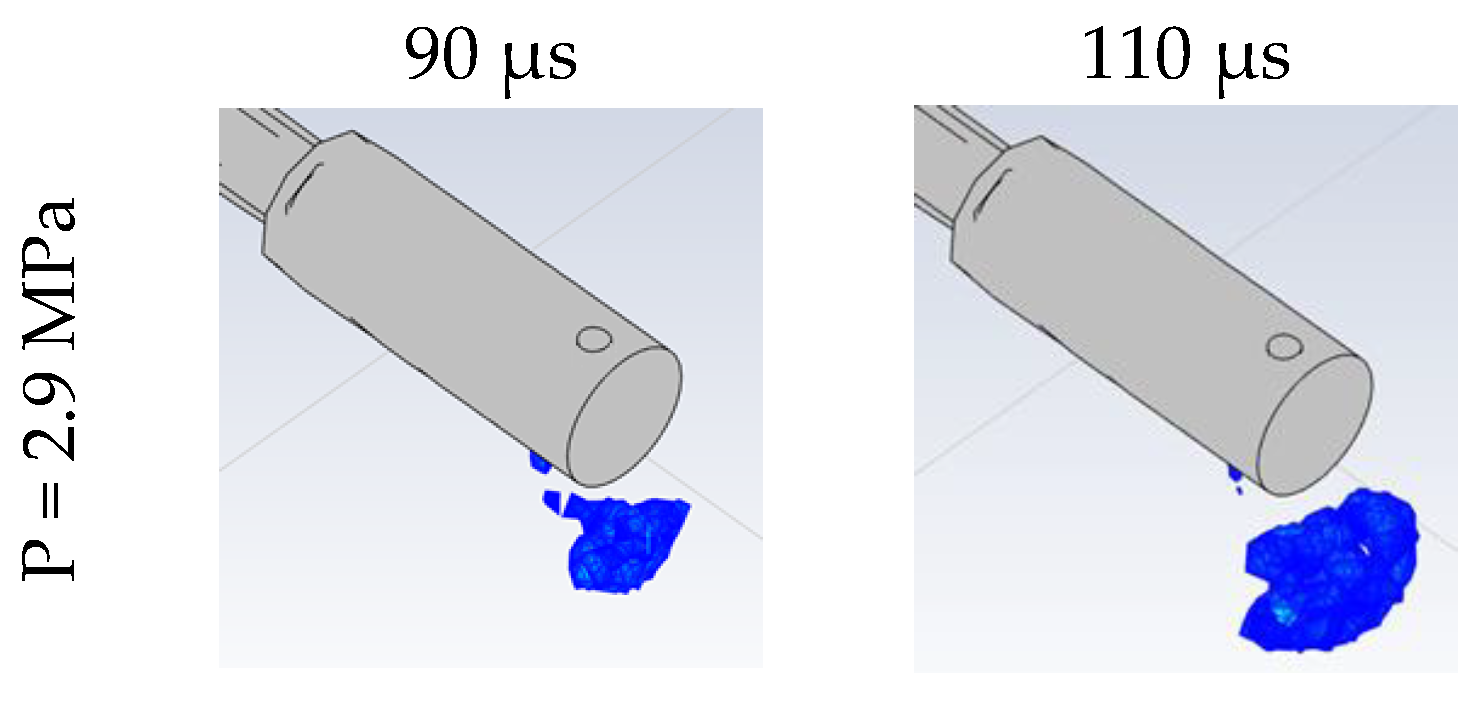
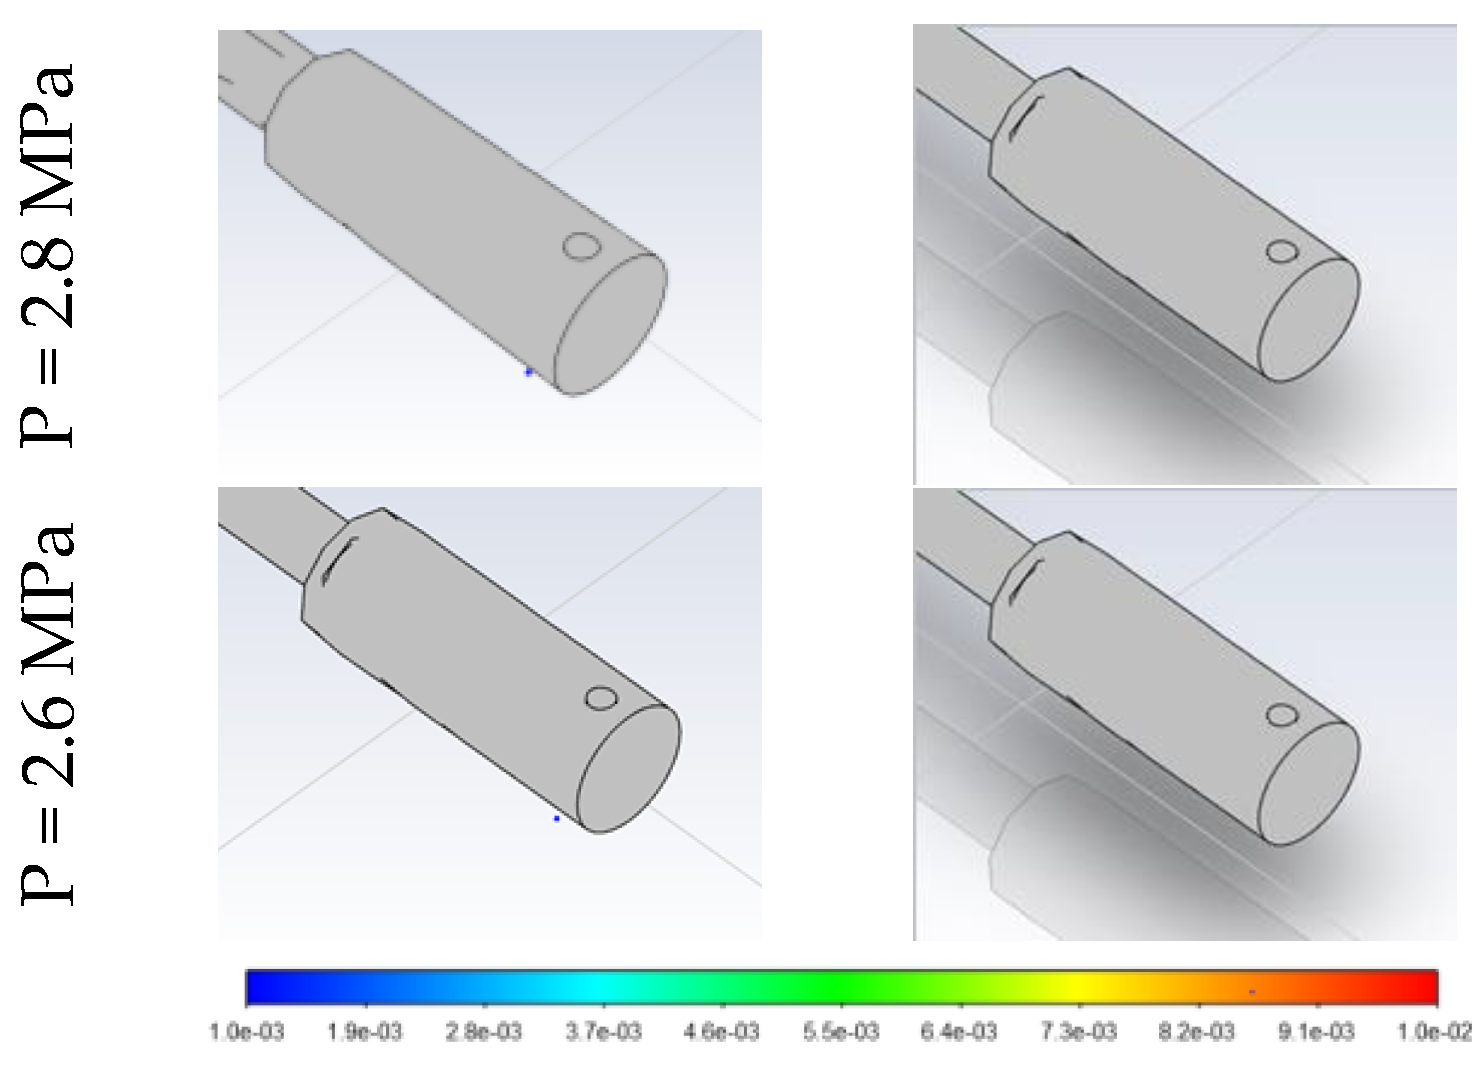
Figure 6 provides a view of the reacting zone in the whole domain. It shows the volumetric distribution of OH mole fraction above the limit of 0.001, which is generally accepted as an indicator of a reacting zone in hydrogen-air flames [28]. This view gives insight into the location of any reacting zone beyond the symmetry plane. For storage pressure 2.6 MPa, at 90 μs reaction is present in a small zone just outside the bottom radial channel, and at 110 μs this has completely disappeared. This is fully in line with the maximum OH mole fraction recorded in the calculation domain and presented in Figure 3a, which shows a peak at about 75 μs, to then decrease to zero within the following 20 μs except the case of 2.9 MPa.
Therefore, numerical simulations demonstrate ignition at a pressure of 2.6 MPa, followed by disappearance (self-extinction) of the reaction. The authors believe that the 7% relative difference from the pressure limit for ignition of 2.43 MPa observed in experiments is due to the opening time assumed for the burst disk. Section 3.1 focuses on the results of simulations for varying opening time, to assess its effect on the pressure limit and to confirm the authors’ hypothesis. Numerical simulation for initial pressure equal to 2.8 MPa demonstrates a slightly larger and longer presence of ignition and combustion zones, but also in this case there is self-extinction of the reaction. For the initial storage pressure of 2.9 MPa, the combustion is initiated in the bottom radial channel of the PRD (see Figure 4 and Figure 5). A larger high-temperature zone can be observed for 2.9 MPa, with combustion initiated in a few localised spots as shown by the OH mole fraction in Figure 4b. These mainly depend on the hydrogen concentration in the air in those locations, which is deemed to be closer to the stoichiometric concentration. Combustion develops with time into a cocoon outside the PRD, leading to sustained combustion and likely transition into a jet fire (see Figure 5). Combustion is confirmed by the continuous presence of OH and the increase of water vapour mass in the domain (see Figure 3). It can be observed that for all pressures in the range 2.6–2.9 MPa, the ignition process is asymmetrical and that the ignition spots are mainly concentrated in the lower radial channel. For a pressure of 2.9 MPa, external combustion is seen to be more enhanced towards the bottom side of the PRD. The asymmetry of the ignition and combustion process is deemed to be caused by the inertial and asymmetrical opening of the burst disk (see Figure 1b). The simulation results well agree with the experimental evidence in [12] and numerical study in [11] demonstrating ignition and sustained reaction at initial storage pressure of 2.9 MPa.

3.1. Effect of Diaphragm Opening Time on Spontaneous Ignition for Pressure 2.43 MPa

Simulation for a storage pressure of 2.43 MPa showed no occurrence of spontaneous ignition for a diaphragm rupture time of 31.7 μs. As observed in experimental (see [5,6]) and numerical studies (see [7,8]) a faster diaphragm opening reduces the ignition delay time and increases the likelihood of ignition. Experimental study [5] recorded that the rupture time of a diaphragm with thickness within the range 0.1–1.0 mm with 5 mm diameter can be between 5 and 20 μs. A lower thickness of the membrane would cause a decrease of its opening time (see Equation (1)). Thus, a further analysis has been conducted to assess the effect of the diaphragm opening time on the occurrence of ignition for values similar to those observed in [5]. The time to achieve the full opening of the burst disk was gradually decreased from the original by 10% (28.6 μs), 30% (22.2 μs), 40% (19.0 μs) and 50% (15.9 μs) as shown in Table 3. Figure 7 shows the resulting temperature and OH mole fraction distributions on the symmetry plane. The lack of OH mole fraction for a diaphragm opening time in the range 22.2–31.7 μs indicates that there is no occurrence of ignition. For a diaphragm opening time equal to 19.0 μs, the snapshots of OH mole fraction show an ignition spot on the top radial channel at 66 μs and 71 μs, which then disappears by the time 77 μs. Analysis of the maximum OH mole fraction in the domain recorded a decrease below 0.001 within 92 μs, indicating the self-extinction following the recorded ignition. This is fully in line with experiments recording light in the radial channel but not sustained jet flame. For a shorter diaphragm opening time equal to 15.9 μs, temperature larger than 2000 K is produced at the T-shaped intersection and ignition is recorded at 66 μs. The ignition zone enlarges with time and gradually moves outside the T-shaped channel, however without forming a fully developed flame as observed for storage pressure equal to 2.9 MPa and diaphragm opening time of 29.1 μs. These numerical evaluations highlight the importance to have available precise diaphragm parameters or direct measurement of the diaphragm opening time for each experimental test, to provide a more accurate comparison of experimental and numerical results.

3.2. Effect of Stored Hydrogen Temperature on Pressure Limit for Spontaneous Ignition

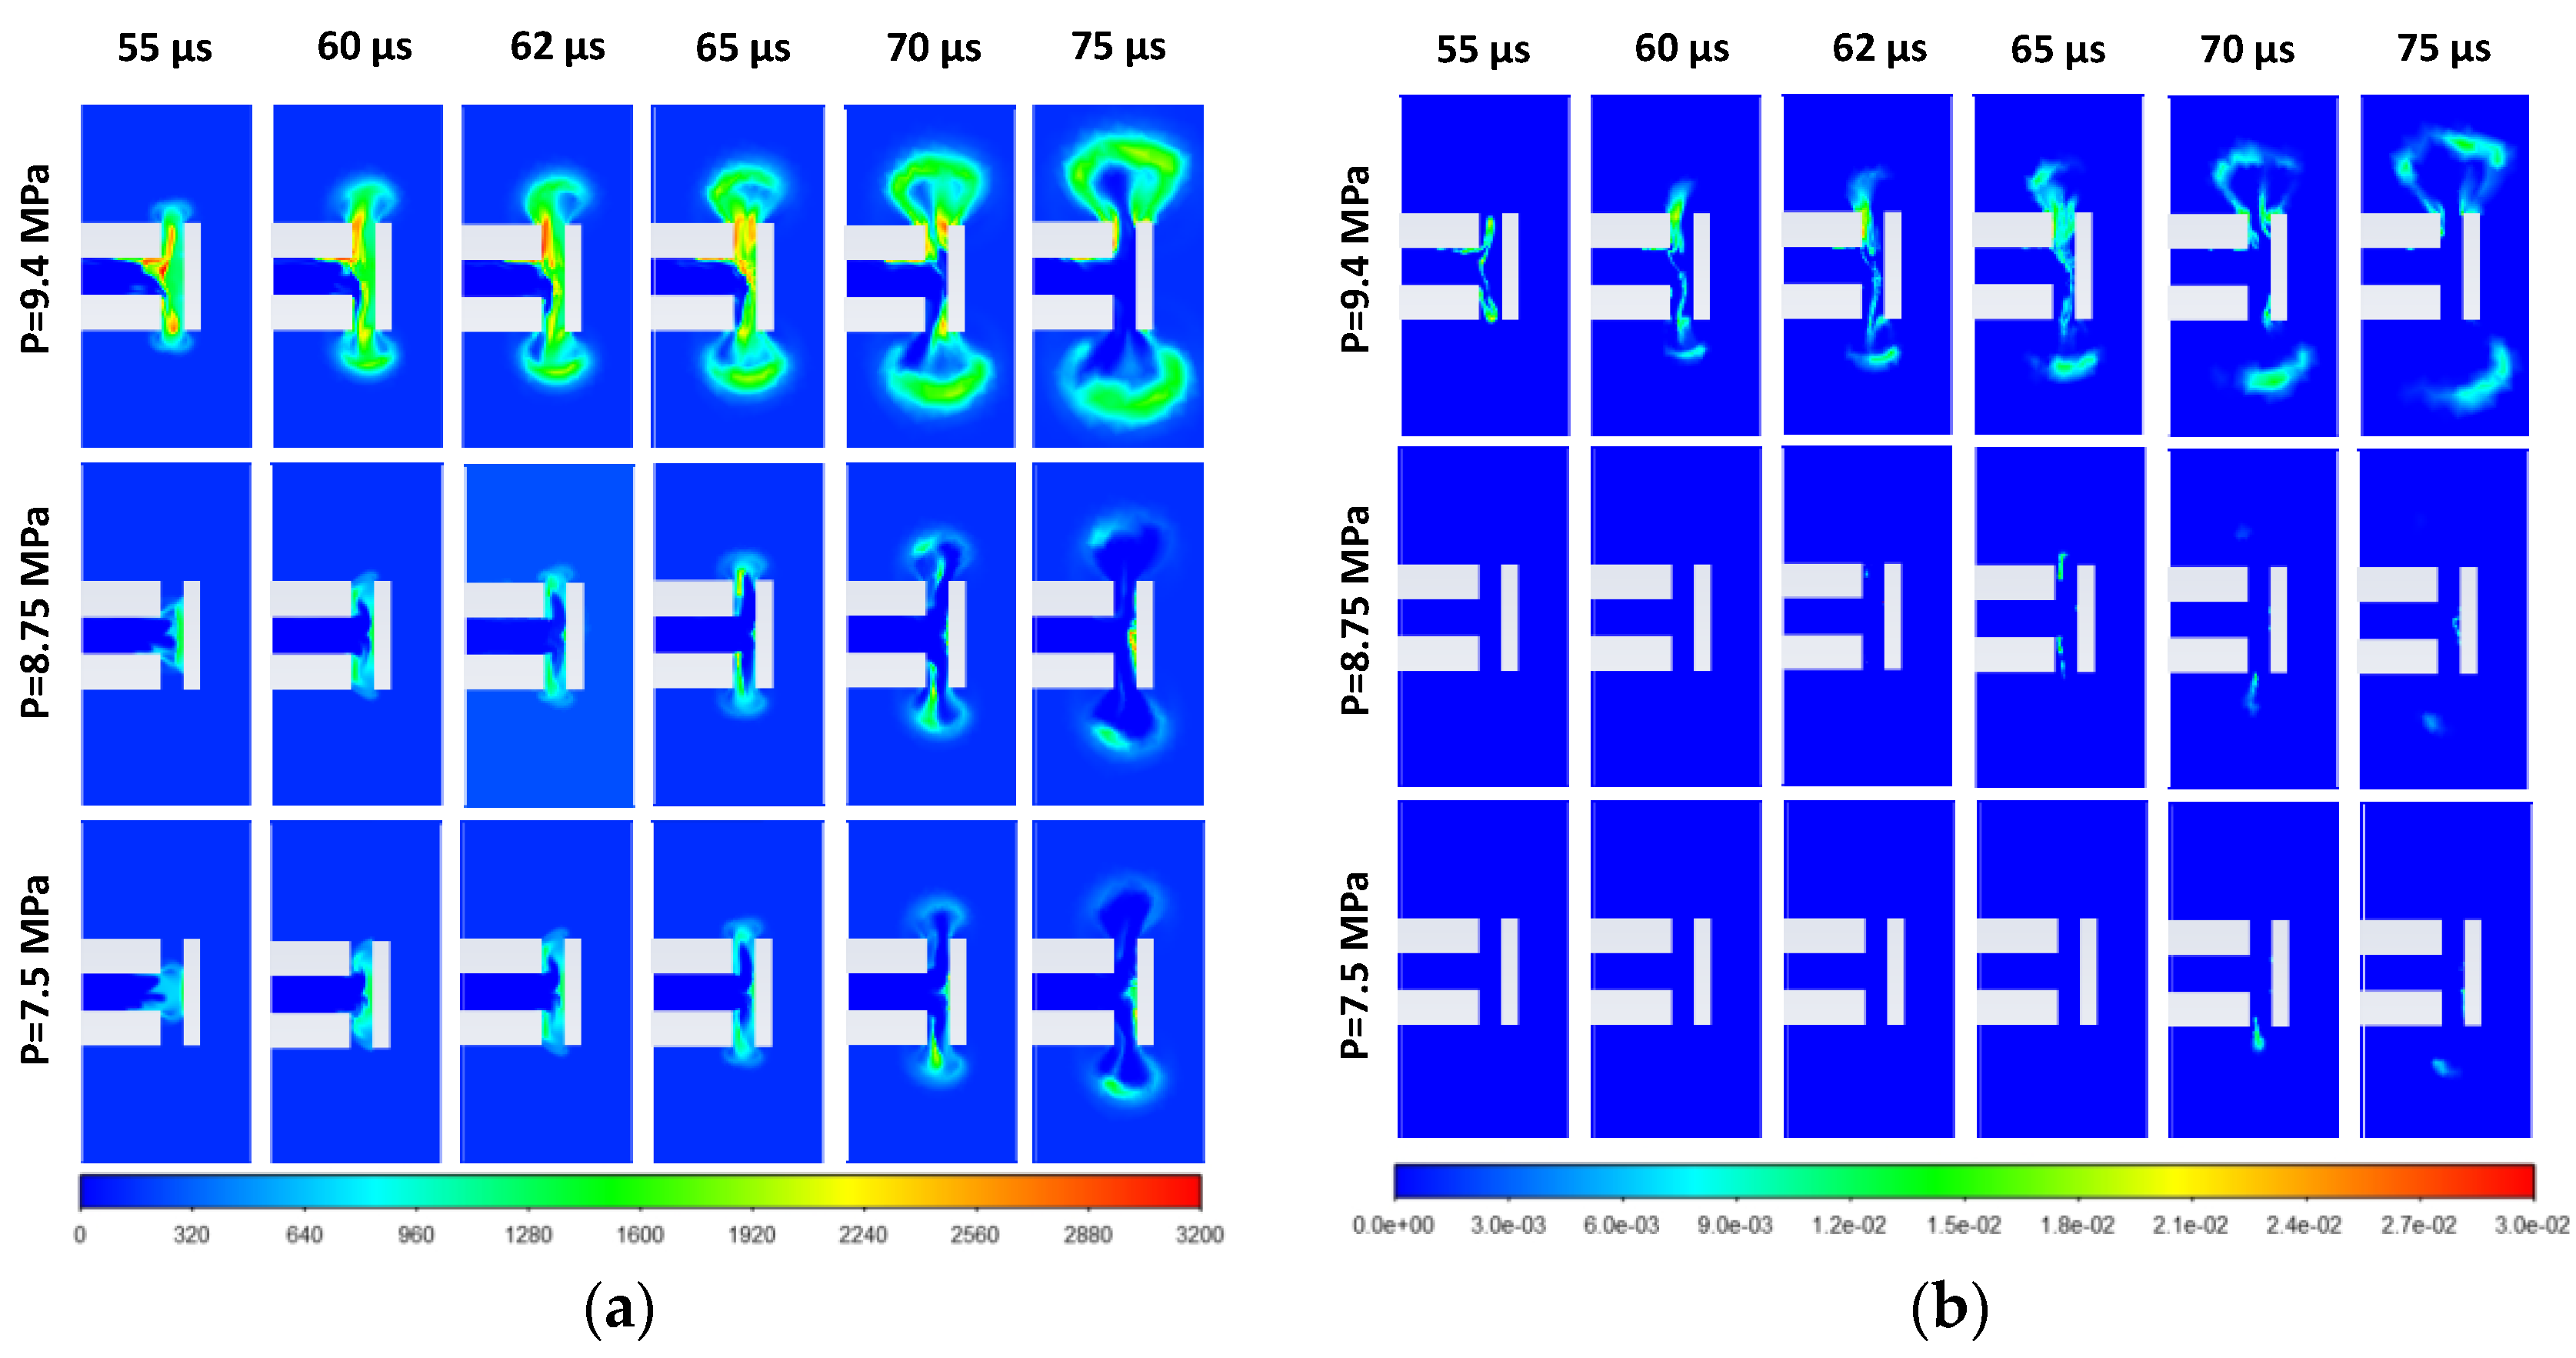
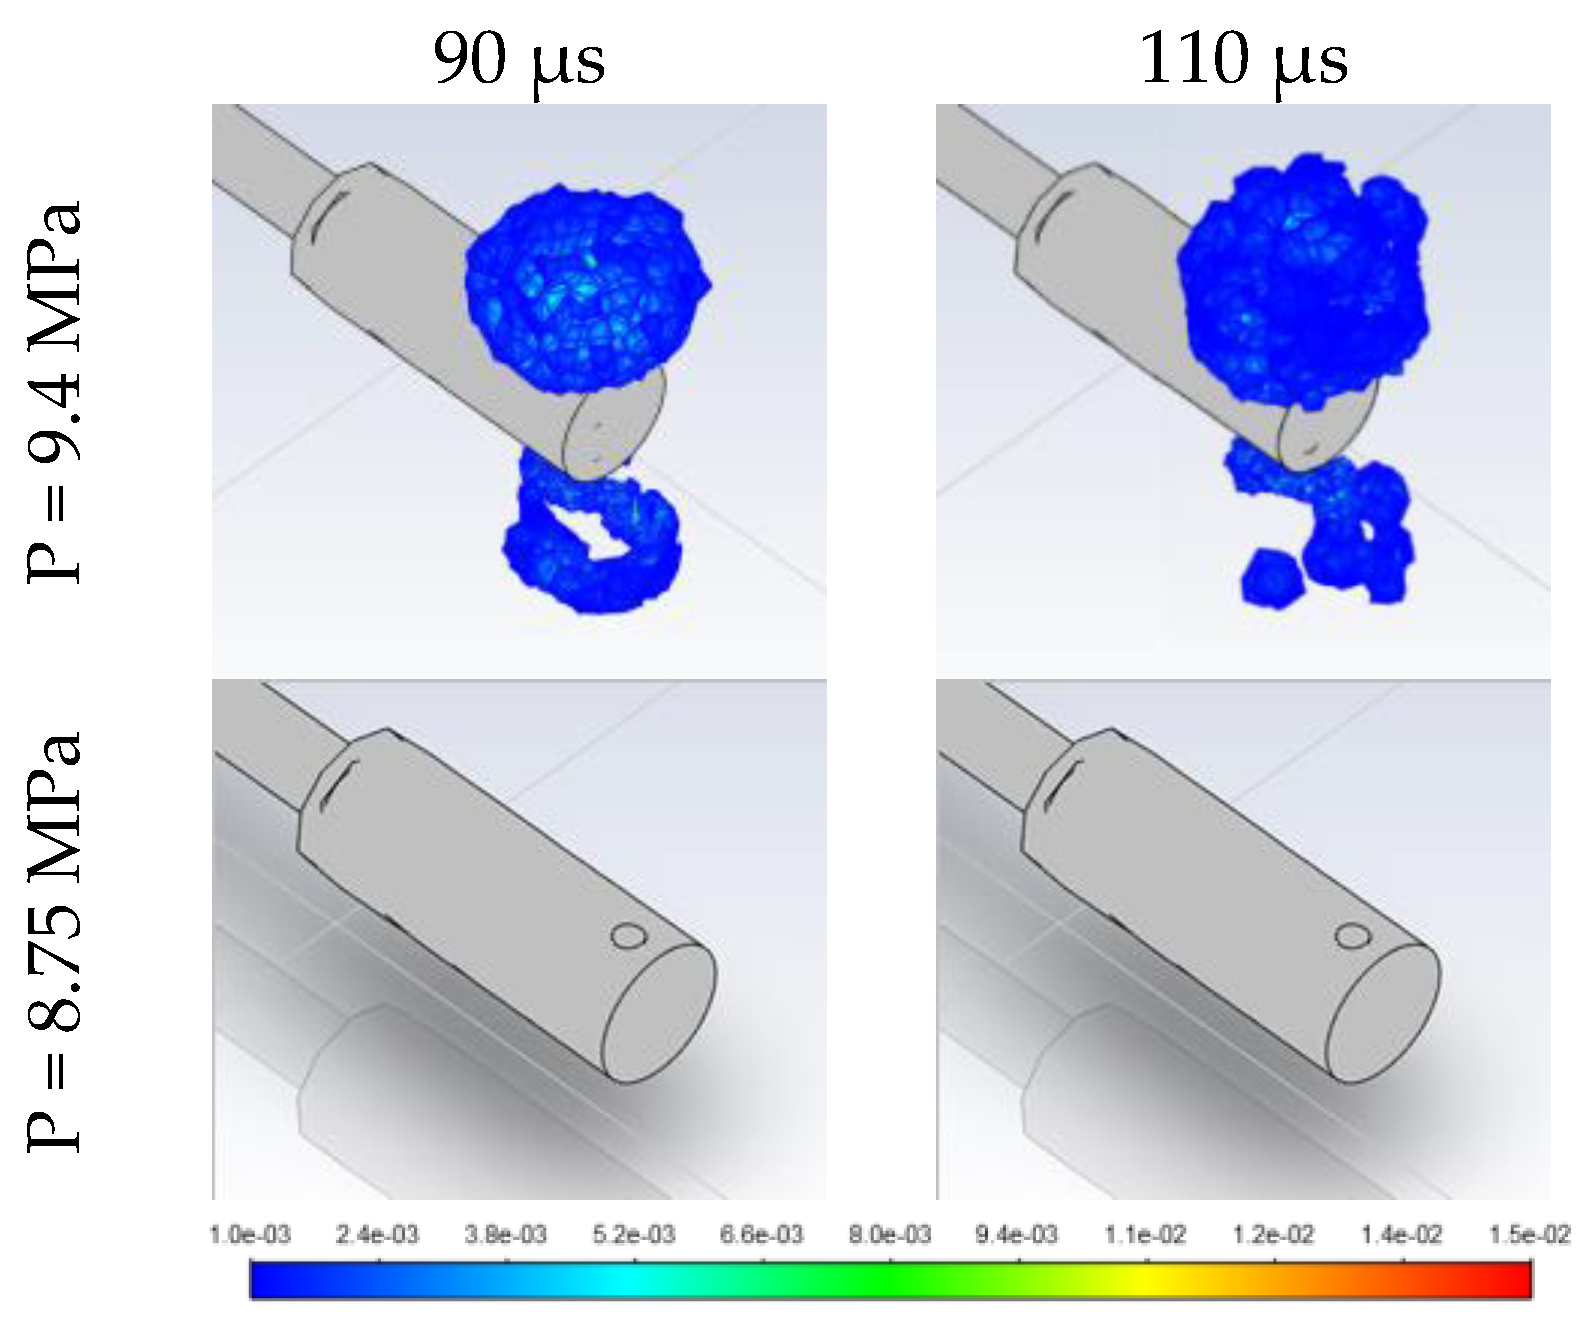
The procedure described above is applied in this section to determine the pressure limit of spontaneous ignition for hydrogen stored at a cryogenic temperature 80 K. The initial storage pressure was changed in the range 5–10 MPa. Figure 8 shows the temperature and hydroxyl profiles across the symmetry plane for pressures 7.5, 8.75 and 9.4 MPa. Asymmetrical distribution of temperature at 55 μs reflects the stronger shock wave and effect of the inertial and not fully symmetrical opening of the burst disk. The higher shock wave pressure results in a higher temperature of the heated by shock air over 2000 K. For storage pressures of 7.5 MPa and 8.75 MPa, triggering of ignition in the radial channel can be observed at 70 μs and 62 μs, respectively. However, the further mixing of hot temperature air with the cryogenic temperature hydrogen leads to self-extinction of combustion by the time of 90 μs. This is confirmed by the absence of hydroxyl on the symmetry plane (Figure 9) and in the 3D domain (Figure 10). For a storage pressure of 9.4 MPa, ignition happens much earlier in the axial channel of the PRD. Larger high-temperature zones can be observed in this case, as a consequence of the higher pressure of the shock wave and earlier development of combustion reactions.
Figure 9 shows a combustion cocoon formed externally to the PRD. The reaction is enhanced outside the top radial channel, which is different to what was observed for atmospheric temperature hydrogen at pressure 2.9 MPa. The authors believe that this behaviour is a consequence of the different opening dynamics of the burst disk (larger storage pressure is associated with lower hydrogen temperature to acquire ignition). The opening time for a pressure of 9.4 MPa (16.1 μs) is almost half of the time required for burst disk opening at storage pressure of 2.9 MPa (29.1 μs, see Table 2). This causes the interval of time between the opening of one burst disk section to another (see Figure 1b) to be shortened by the same proportion. The burst disk sections are asymmetrical and can induce combustion towards the top channel for cryogenic hydrogen rather than towards the lower channel as observed for ambient temperature hydrogen. Comparing Figure 4 and Figure 8, it is possible to observe a larger combustion and high temperature zone for storage temperature 80 K and storage pressure 9.4 MPa (Figure 8) in comparison to the case with ambient hydrogen storage temperature and hydrogen storage pressure 2.9 MPa (Figure 4). This is a direct consequence of the higher storage pressure, which does not only compensate but overcomes the decrease in combustion rate associated with the lower hydrogen temperature. The combined effect of higher pressure and lower temperature causes the hydrogen density to be up to 12 kg/m3 for storage temperature 80 K. This value is similar to the density of the air compressed by the shock at the intersection of the PRD in the ambient temperature case. Velocity of the flow is particularly enhanced for the cryogenic case, creating zones with flow velocity up to 2400 m/s at the exits from the radial channels of the PRD.
Figure 10 shows the volumetric development of the reaction zone identified using the hydroxyl mole fraction distribution. It is concluded that pressure of 9.4 MPa leads to spontaneous ignition and likely transition into a hydrogen jet flame. It follows that for cryogenic hydrogen at 80 K temperature, the pressure limit of spontaneous ignition is more than 3 times larger than for ambient temperature hydrogen for the considered system of the T-shaped channel. Table 4 reports and compares the pressure limits obtained for hydrogen at ambient and cryogenic temperatures. It should be underlined that these conclusions are valid for the T-shaped channel with a copper burst disk. The storage pressure limit leading to spontaneous ignition strongly depends on the geometry and characteristics of the release system and burst disk. Furthermore, the potential for ignition occurrence at a certain pressure is affected by the behaviour and timing of the burst disk opening, as it will affect the primary and reflected shock, and the shock-shock interactions ([4,5,6]). A faster rupturing rate can increase the likelihood of spontaneous ignition occurrence given the storage pressure is close to the observed limit 9.4 MPa.

4. Conclusions

The originality of this research is in the numerical investigation of the spontaneous ignition for cryo-compressed hydrogen in a T-shaped channel. Ignition and combustion dynamics were assessed in terms of temperature and hydroxyl mole fraction evolution in time.
The significance of the study is in the development of contemporary 3D CFD tool for hydrogen safety engineering to determine the pressure limits leading to spontaneous ignition of compressed hydrogen at both ambient and cryogenic temperatures.
The rigour of the undertaken study is in the consistent investigation of the model sensitivity to the parameters of hydrogen storage (temperature and pressure), the burst disk opening time, and numerical details (CFL number, etc.). For ambient hydrogen storage temperature 300 K, the 3D CFD model reproduced experimentally observed spontaneous ignition and its likely transition to a jet fire outside the T-shaped channel at 2.9 MPa. Storage pressures in the range 2.6–2.8 MPa were found to trigger ignition that later is followed by self-extinction. Simulations with a reduced diaphragm opening time equal to 19.0 μs reproduced the experimentally observed pressure limit of 2.43 MPa sufficient to provide ignition but not sustained jet flame.
The pressure limit of 9.4 MPa was found to lead to ignition and sustained jet fire in the T-shaped channel for cryogenic hydrogen storage temperature of 80 K. This limit is approximately 3 times larger compared to hydrogen stored at ambient temperature. Simulations showed that below this pressure, e.g., at 8.75 and 7.5 MPa, there was an ignition in the T-shaped channel which then undergone self-extinction.

Author Contributions

Conceptualization, D.C., D.M. and V.M.; methodology, D.C., D.M. and V.M.; software, D.C.; validation, D.C., D.M. and V.M.; formal analysis, D.C., D.M. and V.M.; investigation, D.C., D.M. and V.M.; resources, D.C., D.M. and V.M.; data curation, D.C., D.M. and V.M.; writing—original draft preparation, D.C.; writing—review and editing, D.C., D.M. and V.M.; visualization, D.C., D.M. and V.M.; supervision, V.M. and D.M.; project administration, D.C., D.M. and V.M.; funding acquisition, V.M. All authors have read and agreed to the published version of the manuscript.

Funding

This research has received funding from the Fuel Cells and Hydrogen 2 Joint Undertaking (now Clean Hydrogen Partnership) under grant agreement No. 779613 (PRESLHY). The JU receives support from the European Union’s Horizon 2020 research and innovation programme and the United Kingdom, Germany, Greece, Denmark, Spain, Italy, Netherlands, Belgium, France, Norway, Switzerland. The authors want to acknowledge EPSRC for funding the project Kelvin-2 “Tier 2 High-Performance Computing Services”, EP/T022175/1 and Innovate UK for funding the project “Northern Ireland Green Seas” (ID: 397841).

Institutional Review Board Statement

Not Applicable.

Informed Consent Statement

Not Applicable.

Conflicts of Interest

The authors declare no conflict of interest.

Nomenclature

b thickness of the diaphragm (m)
d diameter of the diaphragm (m)
k constant (0.92)
P diaphragm burst pressure (Pa)
t diaphragm opening time (s)
ρ density of the diaphragm material (kg/m3)

References

  1. Wolanski, P.; Wojcicki, S. Investigation into the Mechanism of Diffusion Ignition of a Combustible Gas Flowing into Oxidizing Atmosphere. In Proceedings of the Fourteenth Symposium (International) on Combustion, Pittsburgh, PA, USA, 20–25 August 1972; pp. 1217–1223. [Google Scholar]
  2. Bazhenova, T.; Bragin, M.; Golub, V.; Ivanov, M. Self-ignition of a fuel gas upon pulsed efflux into an oxidative medium. Tech. Phys. Lett. 2006, 32, 269–271. [Google Scholar] [CrossRef]
  3. Golub, V.V.; Baklanov, D.I.; Bazhenova, T.V.; Bragin, M.V.; Golovastov, S.V.; Ivanov, M.F.; Volodin, V.V. Shock-induced ignition of hydrogen gas during accidental or technical opening of high-pressure tanks. J. Loss Prev. Process Ind. 2007, 20, 439–446. [Google Scholar] [CrossRef]
  4. Dryer, F.L.; Chaos, M.; Zhao, Z.; Stein, J.N.; Alpert, J.Y.; Homer, C.J. Spontaneous ignition of pressurized releases of hydrogen and natural gas into air. Combust. Sci. Technol. 2007, 179, 663–694. [Google Scholar] [CrossRef]
  5. Golovastov, S.; Bocharnikov, V. The influence of diaphragm rupture rate on spontaneous self-ignition of pressurized hydrogen: Experimental investigation. Int. J. Hydrogen Energy 2012, 37, 10956–10962. [Google Scholar] [CrossRef]
  6. Kaneko, W.; Ishii, K. Effects of diaphragm rupturing conditions on self-ignition of high-pressure hydrogen. Int. J. Hydrogen Energy 2016, 41, 10969–10975. [Google Scholar] [CrossRef]
  7. Xu, B.P.; El Hima, L.; Wen, J.X.; Dembele, S.; Tam, V.H.Y.; Donchev, T. Numerical study on the spontaneous ignition of pressurized hydrogen release through a tube into air. J. Loss Prev. Process Ind. 2008, 21, 205–213. [Google Scholar] [CrossRef]
  8. Xu, B.P.; Wen, J.X.; Dembele, S.; Tam, V.H.Y.; Hawksworth, S.J. The effect of pressure boundary rupture rate on spontaneous ignition of pressurized hydrogen release. J. Loss Prev. Process Ind. 2009, 22, 279–287. [Google Scholar] [CrossRef]
  9. Golub, V.V.; Baklanov, D.I.; Golovastov, S.V.; Ivanov, M.F.; Laskin, I.N.; Saveliev, A.S.; Semin, N.V.; Volodin, V.V. Mechanisms of high-pressure hydrogen gas self-ignition in tubes. J. Loss Prev. Process Ind. 2008, 21, 185–198. [Google Scholar] [CrossRef]
  10. Bragin, M.V.; Molkov, V.V. Physics of spontaneous ignition of high-pressure hydrogen release and transition to jet fire. Int. J. Hydrogen Energy 2011, 36, 2589–2596. [Google Scholar] [CrossRef]
  11. Bragin, M.V.; Makarov, D.V.; Molkov, V.V. Pressure limit of hydrogen spontaneous ignition in a T-shaped channel. Int. J. Hydrogen Energy 2013, 38, 8039–8052. [Google Scholar] [CrossRef]
  12. Golub, V.; Volodin, V.; Baklanov, D.; Golovastov, S.; Lenkevich, D. Experimental investigation of hydrogen ignition at the discharge into channel filled with air. Phys. Extrem. States Matter 2010, 110–113. [Google Scholar]
  13. Gong, L.; Duan, Q.; Suna, J.; Molkov, V. Similitude analysis and critical conditions for spontaneous ignition of hydrogen release into the atmosphere through a tube. Fuel 2019, 245, 413–419. [Google Scholar] [CrossRef]
  14. Gong, L.; Li, Z.; Jin, K.; Gao, Y.; Duan, Q.; Zhang, Y.; Sun, J. Numerical study on the mechanism of spontaneous ignition of high-pressure hydrogen during its sudden release into a tube. Saf. Sci. 2020, 129, 104807. [Google Scholar] [CrossRef]
  15. Gong, L.; Jin, K.; Yang, S.; Yang, Z.; Li, Z.; Gao, Y.; Zhang, Y. Numerical study on the mechanism of spontaneous ignition of high-pressure hydrogen in the L-shaped tube. Int. J. Hydrogen Energy 2020, 45, 32730–32742. [Google Scholar] [CrossRef]
  16. Jin, K.; Yang, S.; Gong, L.; Han, Y.; Yang, X.; Gao, Y.; Zhang, Y. Numerical study on the spontaneous ignition of pressurized hydrogen during its sudden release into the tube with varying lengths and diameters. J. Loss Prev. Process Ind. 2021, 72, 104592. [Google Scholar] [CrossRef]
  17. Jin, K.; Yang, S.; Gong, L.; Mo, T.; Gao, Y.; Zhang, Y. Mechanism of spontaneous ignition of high-pressure hydrogen during its release through a tube with local contraction: A numerical study. Int. J. Hydrogen Energy 2022, 47, 6421–6436. [Google Scholar] [CrossRef]
  18. Radebaugh, R. Cryogenics. MacMillan Encycl. Chem. 2002, 1–3. [Google Scholar]
  19. Ahluwalia, R.K.; Peng, J.K.; Hua, T.Q. Cryo-Compressed Hydrogen Storage. In Compendium of Hydrogen Energy; Gupta, R.B., Basile, A., Veziroğlu, T.N., Eds.; Woodhead Publishing: Sawston, Cambridge, UK, 2016; pp. 119–145. [Google Scholar]
  20. Stetson, N.T.; McWhorter, S.; Ahn, C.C. Introduction to Hydrogen Storage. In Compendium of Hydrogen Energy; Gupta, R.B., Basile, A., Veziroğlu, T.N., Eds.; Woodhead Publishing: Sawston, Cambridge, UK, 2016; pp. 3–25. [Google Scholar]
  21. Aceves, S.M.; Berry, G.D.; Rambach, G.D. Insulated pressure vessels for hydrogen storage on vehicles. Int. J. Hydrogen Energy 1998, 23, 583–591. [Google Scholar] [CrossRef]
  22. Petitpas, G.; Bénard, P.; Klebanoff, L.E.; Xiao, J.; Aceves, S. A comparative analysis of the cryo-compression and cryo-adsorption hydrogen storage methods. Int. J. Hydrogen Energy 2014, 39, 10564–10584. [Google Scholar] [CrossRef]
  23. Brunner, T. BMW Hydrogen. In Hydrogen Storage Workshop; Cryo-compressed Hydrogen Storage: Washington, DC, USA, 2011. [Google Scholar]
  24. Yakhot, V.; Orszag, S. Renormalization group analysis of turbulence. I. Basic theory. J. Sci. Comput. 1986, 1, 3–51. [Google Scholar] [CrossRef]
  25. Gutheil, E.; Balakrishnan, G.; Williams, F. Structure and Extinction of Hydrogen-Air Diffusion Flames. In Reduced Kinetic Mechanisms for Applications in Combustion Systems; Peters, N., Rogg, B., Eds.; Springer: New York, NY, USA, 1993; p. 179. [Google Scholar]
  26. Bell, I.H.; Wronski, J.; Quoilin, S.; Lemort, V. Pure and Pseudo-pure Fluid Thermophysical Property Evaluation and the Open-Source Thermophysical Property Library CoolProp. Ind. Eng. Chem. Res. 2014, 53, 2498–2508. [Google Scholar] [CrossRef] [PubMed] [Green Version]
  27. Spence, D.; Woods, B. A review of theoretical treatments of shock-tube attenuation. J. Fluid Mech. 1964, 19, 161–174. [Google Scholar] [CrossRef]
  28. Bulewicz, E.M.; Sugden, T.M. The recombination of hydrogen atoms and hydroxyl radicals in hydrogen flame gases. Trans. Faraday Soc. 1958, 54, 1855–1860. [Google Scholar] [CrossRef]
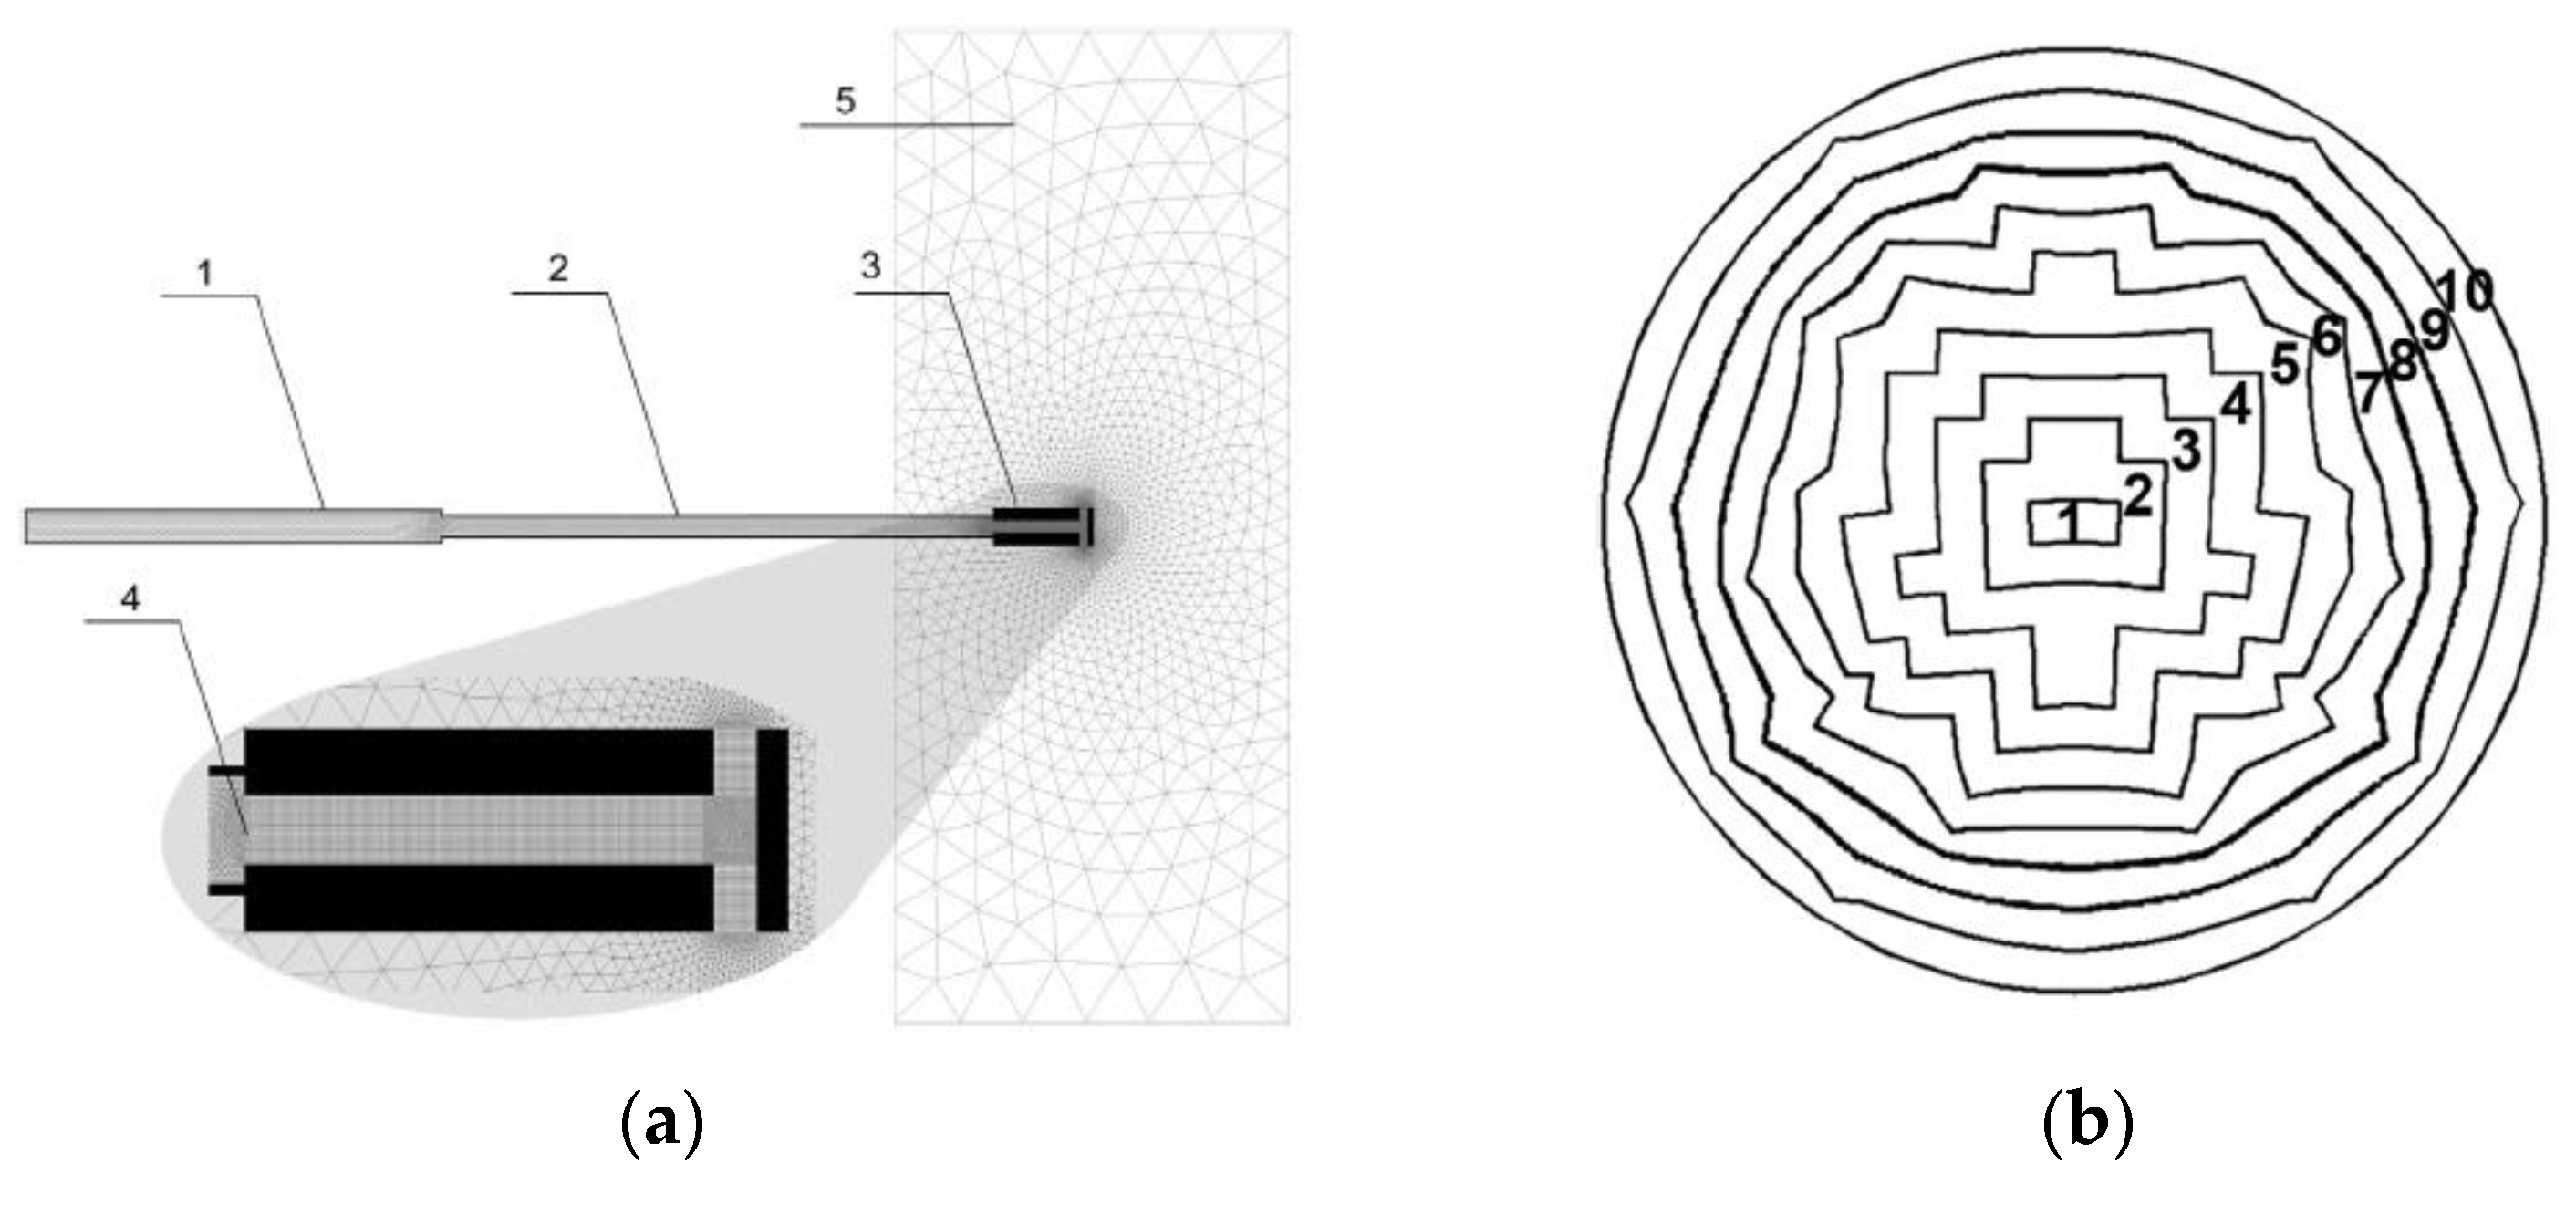
Figure 1. (a) Central cross-section of the computational domain and numerical grid: 1—high-pressure tube ID = 16 mm, 2—high-pressure tube ID = 10 mm, 3—PRD, 4—burst disk, 5—external domain [11]; (b) Geometry of the burst disk sections; numbers indicate sequence of the sections opening to imitate the burst disk rupture dynamics (opening in time) [11].
Hydrogen 03 00021 g001
Figure 2. Profiles on the symmetry plane for storage pressure 2.43 MPa in time range 60–85 μs: (a) temperature, (b) hydrogen mole fraction. CFL number equal to 0.1 and 0.3. Initial hydrogen storage temperature is 300 K.
Hydrogen 03 00021 g002
Figure 3. Dynamics in time across the computational domain: (a) maximum hydroxyl mole fraction, (b) integral of water vapour mass. Initial hydrogen storage temperature is 300 K.
Hydrogen 03 00021 g003
Figure 4. Profiles on the symmetry plane for storage pressures 2.6, 2.8 and 2.9 MPa in time range 62–75 μs: (a) temperature, (b) hydroxyl mole fraction. Initial hydrogen storage temperature is 300 K.
Hydrogen 03 00021 g004
Figure 5. Profiles on the symmetry plane for storage pressures 2.6, 2.8 and 2.9 MPa in time range 80–110 μs: (a) temperature, (b) hydroxyl mole fraction. Initial hydrogen storage temperature is 300 K.
Hydrogen 03 00021 g005
Figure 6. Hydroxyl mole fraction 3D distribution for storage pressures 2.6, 2.8 and 2.9 MPa. Initial hydrogen storage temperature is 300 K.
Hydrogen 03 00021 g006aHydrogen 03 00021 g006b
Figure 7. Profiles for storage pressure of 2.43 MPa and varying diaphragm opening time according to Table 3: (a) temperature, (b) hydroxyl mole fraction. Initial hydrogen storage temperature is 300 K.
Hydrogen 03 00021 g007
Figure 8. Profiles for storage pressures of 7.5, 8.75 and 9.4 MPa in time range 55–75 μs: (a) temperature, (b) hydroxyl mole fraction. Initial hydrogen storage temperature is 80 K.
Hydrogen 03 00021 g008
Figure 9. Profiles for storage pressures of 7.5, 8.75 and 9.4 MPa in time range 80–110 μs: (a) temperature, (b) hydroxyl mole fraction. Initial hydrogen storage temperature is 80 K.
Hydrogen 03 00021 g009
Figure 10. Hydroxyl mole fraction 3D distribution for storage pressures of 8.75 MPa and 9.4 MPa. Initial hydrogen storage temperature is 80 K.
Hydrogen 03 00021 g010
Table 1. Storage pressure and temperature for performed numerical experiments.
Number of SimulationsStorage Temperature, KStorage Pressure, MPa
63001.35, 1.65, 2.43, 2.60, 2.80, 2.90
5805.00, 7.50, 8.75, 9.40, 10.00
Table 2. Opening times of ten burst disk sections for 11 scenarios (see Figure 1b).
Burst Disk Section No.12345678910
Pressure, MPaOpening Times, μs
1.3504.79.514.218.923.728.433.137.942.6
1.6504.28.612.817.121.425.729.934.338.5
2.4303.57.110.614.117.721.224.728.331.7
2.603.46.910.213.617.120.523.827.330.7
2.803.36.69.913.116.519.723.026.329.6
2.903.26.59.712.916.219.422.625.929.1
5.002.44.97.49.812.314.817.219.722.1
7.502.04.06.08.010.112.014.016.118.1
8.7501.83.75.67.49.311.213.014.916.7
9.401.83.65.47.29.010.812.514.416.1
10.001.73.55.26.98.710.412.213.915.6
Table 3. Opening times of ten burst disk sections (see Figure 1b) for hydrogen at 2.43 MPa pressure.
Burst Disk Section No.12345678910
CaseThickness, m Opening Times, μs
05.0 × 10−503.57.110.614.117.721.224.728.331.7
14.1 × 10−503.16.49.512.715.919.022.225.428.6
22.5 × 10−502.45.07.49.812.414.817.319.822.2
31.8 × 10−502.14.36.38.410.612.714.817.019.0
41.3 × 10−501.73.55.37.08.810.612.314.115.9
Table 4. Pressure limits leading to spontaneous ignition of compressed hydrogen at ambient and cryogenic temperatures.
Storage Temperature, K80300
Storage pressure leading to spontaneous ignition followed by self-extinction, MPa8.752.60
Storage pressure leading to spontaneous ignition and likely transition into a hydrogen jet flame, MPa9.402.90
Publisher’s Note: MDPI stays neutral with regard to jurisdictional claims in published maps and institutional affiliations.