
Article

Testing Climatic Stability–Endemism Relationships Using Western Balkan Endemic Beetles’ Localities and Paleoclimate Reconstructions

1
Institute of Biodiversity and Ecosystem Research, Bulgarian Academy of Sciences, 1000 Sofia, Bulgaria
2
Independent Researcher, 1505 Sofia, Bulgaria
*
Author to whom correspondence should be addressed.
Ecologies 2026, 7(2), 38; https://doi.org/10.3390/ecologies7020038
Submission received: 27 March 2026 / Revised: 20 April 2026 / Accepted: 22 April 2026 / Published: 26 April 2026
(This article belongs to the Special Issue Advances in Community Ecology: Interactions, Dynamics, and Diversity)

Abstract

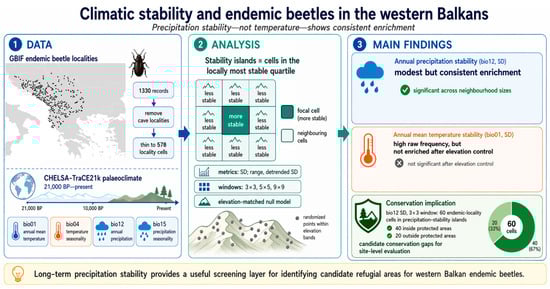
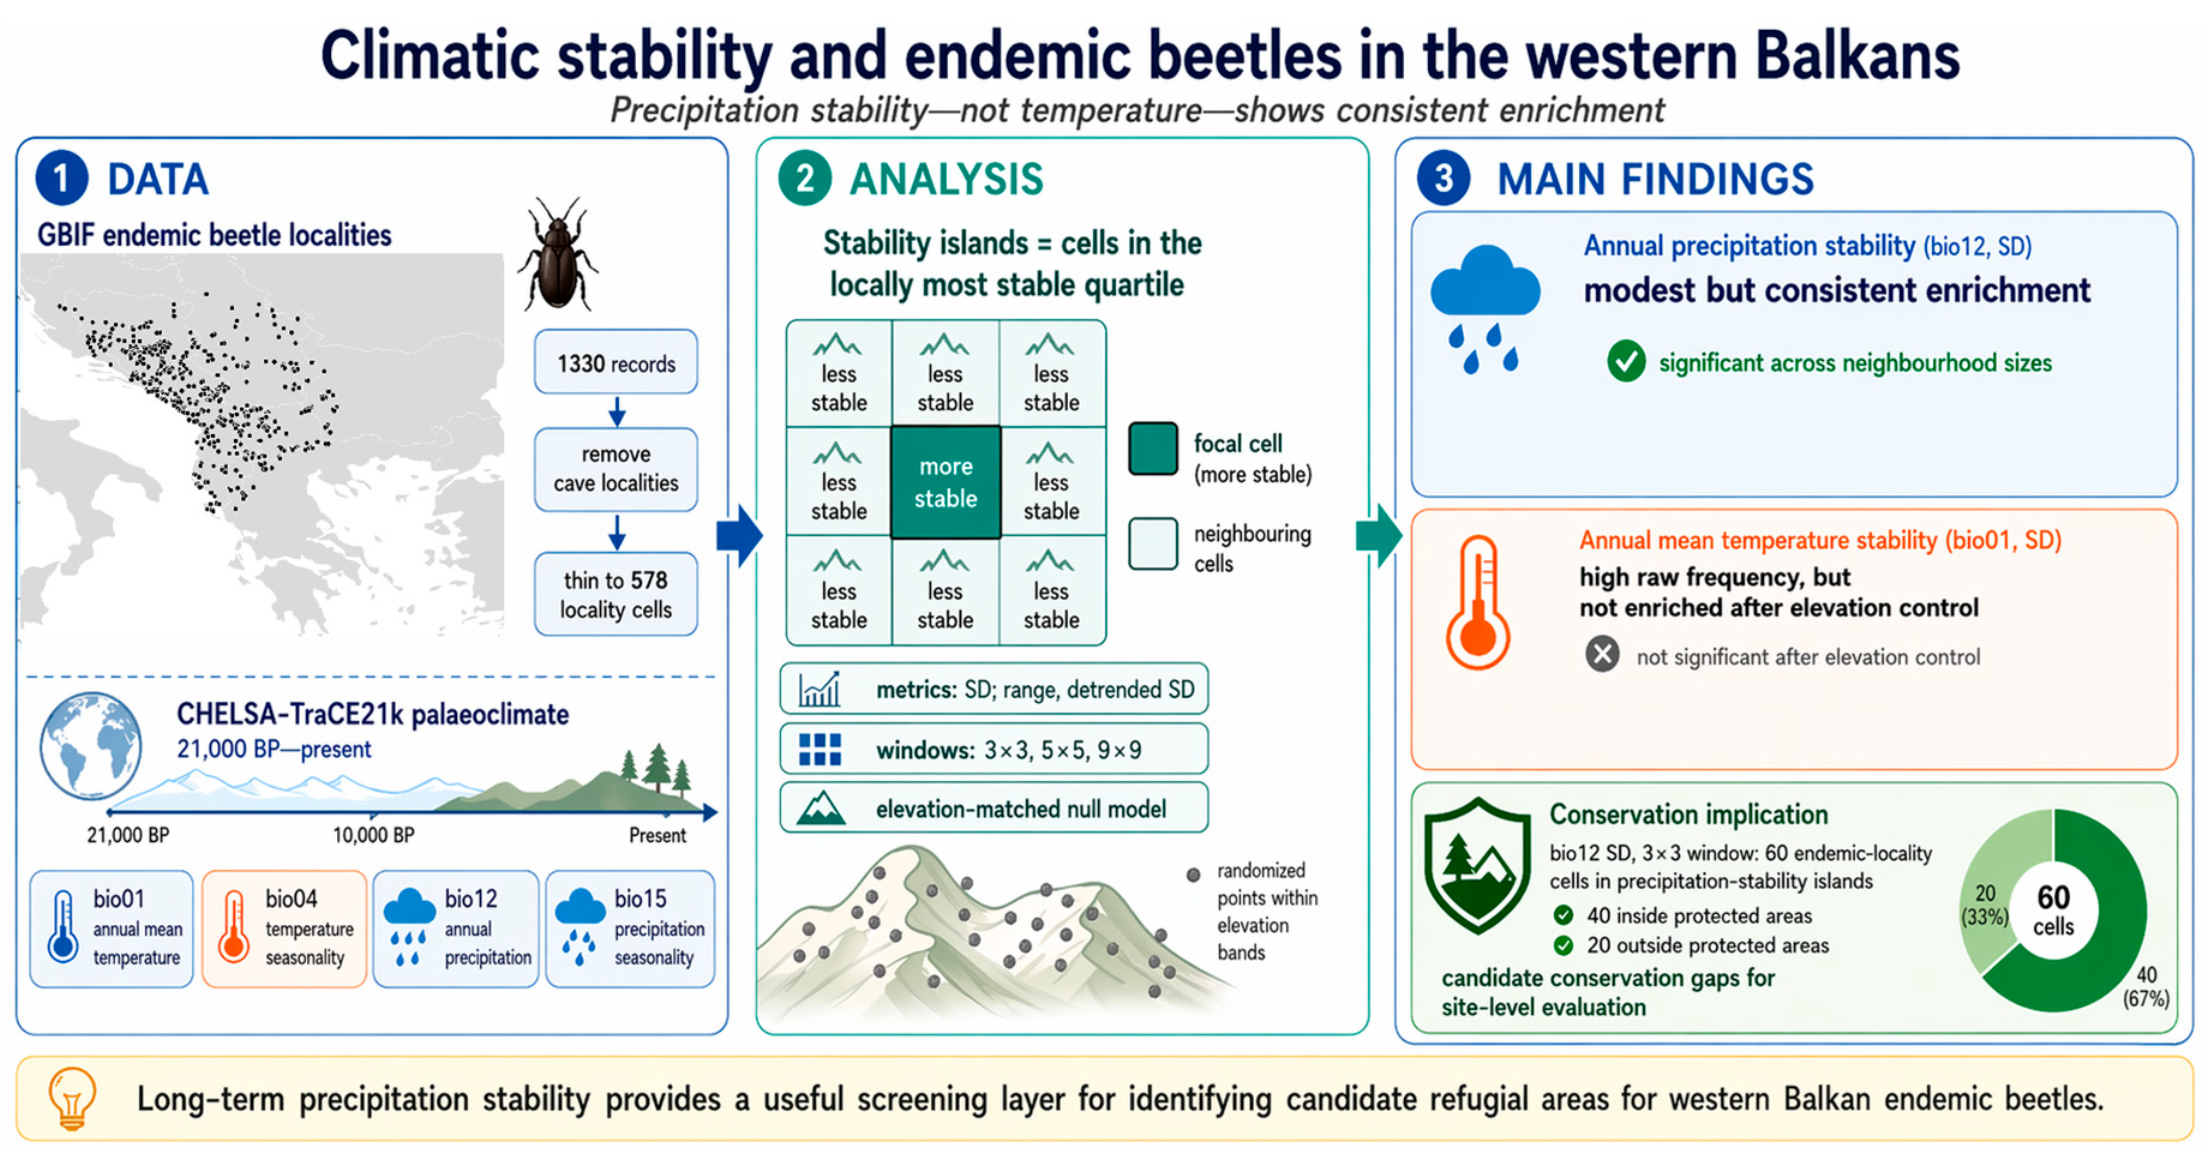
An association between long-term climatic stability and endemism has been suggested, but it has been tested in plants and vertebrates rather than invertebrates. Using high-resolution paleoclimate reconstructions (CHELSA-TraCE21k; 21,000 BP–present), we tested whether non-cave localities of endemic beetles in the western Balkans are non-randomly associated with local climatic stability. For four bioclimatic variables, we quantified temporal variability using three metrics (SD, range, detrended SD) and defined stability islands as cells in the most stable quartile relative to their neighbourhood at three spatial scales (3 × 3, 5 × 5, 9 × 9). We tested whether 578 endemic-locality cells were enriched in stability islands, against elevation-matched null models. Annual mean temperature produced the highest raw frequency of endemic localities in stability islands, but this pattern was not significant after elevation control. In contrast, endemic localities showed a modest but consistent enrichment in annual precipitation stability islands (observed 9.7–10.7% vs. null 7.3–8.5%; p = 0.01–0.03) across neighbourhood sizes. At the 3 × 3 scale, 60 endemic localities fell within precipitation-stability islands; of them, 20 were outside current protected areas—indicating conservation gaps where minor boundary revisions could enable protection of endemic beetles’ habitats in precipitation-stable sites.

Graphical Abstract

1. Introduction

Identifying climate-change refugia—areas where locally favorable conditions enable populations to persist through periods of otherwise unfavorable regional climate—has become a practical focus in conservation planning [1,2,3,4,5], with conservation priorities increasingly directed toward areas of higher refugial potential [3,4,5]. Climate-change refugia do not constitute a uniform category; rather, their character depends on the particular climatic factors they buffer—for example, thermal and hydric, and their identification requires evaluating sites with respect to variation in specific climatic factors [3,4,5]. A prerequisite for applying the refugia concepts is the evidence that the taxa of interest actually occur where climatic conditions have been stable over relevant timescales. Such evidence exists for several groups of organisms. For example, Sandel et al. [6] showed that Late Quaternary climate-change velocity is associated with endemism patterns in amphibians, mammals, and birds, with low-velocity areas acting as essential refuges for small-ranged species. A similar pattern has also been documented in plants: using a global dataset of grasses, Sandel et al. found that grass endemism is strongly concentrated in regions with historically stable climates [7]. These relationships have been demonstrated primarily for vertebrates and plants, however, and it remains unclear to what extent similar patterns apply to invertebrates, which are widely described as neglected or underrepresented in conservation studies, assessments, and policy frameworks [8,9,10,11,12]. Similarly to the stability-endemism relationships studies, conservation prioritization, particularly in hotspot-based frameworks, has been shaped largely by the better-studied groups—vertebrates and plants [13]. In this context, extending research on stability-endemism relationships to invertebrates is necessary and requires taxon-specific tests rather than transfer from existing assessments of other organism groups. Particularly suitable for research on stability-endemism relationships might be topographically complex regions, where endemic invertebrate diversity is expected to be high. Southeast Europe, and the Balkan Peninsula might be suitable regions in this respect—the Balkans have been repeatedly recognised as important refugial territory in the European Quaternary record [14,15], and Tzedakis [16] argued that where local environmental settings have supported survival through multiple glacial-interglacial oscillations, such areas can be treated as conservation priorities. The mountain landscapes in the region are central to this recognition, since high topographic variability can reduce the distance a species is required to move to track its climatic envelope and therefore might provide effective climate-change refugia [17]. The Balkan Peninsula includes not only extensive mountain terrain, but also high endemic diversity in several invertebrate groups has been documented for the region [18,19,20,21,22,23]. Specifically, in Carabidae (Coleoptera), Gueorguiev [24] has documented remarkable local endemism in the region, revealing that the central and eastern Balkan Peninsula harbor at least 385 species and subspecies classified as Balkan endemics, subendemics, or local endemics. Later, an occurrence dataset comprising localities of endemic beetles (Coleoptera) from the Western Balkans includes more than 1000 species whose present distributions are restricted to these parts of the Balkan Peninsula [25]. Despite the convergence of recognized refugial importance, high endemism, and topographic complexity, no study has tested whether endemic invertebrate distributions in the region are spatially associated with long-term climatic stability. Doing so requires both spatially explicit paleoclimatic data at sufficient resolution to capture topographic buffering and a method for distinguishing locally stable sites from their surroundings. Combined standardized scores for climatic stability, isolation from the matrix, and extreme conditions have been used in previous studies for identifying microrefugia as small patches climatically distinct from their surroundings [2]. In the present study, we chose a similar approach in order to screen for locations where long-term temporal variability is lower relative to the surrounding landscape. We use high-resolution palaeoclimate reconstructions (CHELSA-TraCE21k [26]) spanning the last 21,000 years to derive stability surfaces (temporal SD, range, and detrended SD) and define “stability islands” as cells that are more stable relative to their local neighbourhood at several window sizes. This approach is very close in rationalization to neighbourhood-contrast methods applied by Ashcroft et al. [2], but here we applied it as a screening test rather than as a global microrefugia classification. We test whether endemic, non-cave beetle localities in the western Balkans are non-randomly associated with these stability islands and evaluate robustness using an elevation-matched null model to control for the strong altitudinal structure of both climate and mountain endemism. Specifically, we ask: (i) which climatic variables (temperature vs. precipitation, mean vs. seasonality) produce the most pronounced stability islands at endemic beetle localities; (ii) whether endemic localities are significantly enriched in stability islands compared to elevation-matched random expectations; and (iii) whether any such associations are robust across spatial scales.
By identifying the association between long-term climatic stability and endemic distributions, we aim to provide an evidence base for spatially targeting conservation efforts toward areas most likely to continue functioning as refugia for beetle species considered Balkan endemics under future climate change.

2. Materials and Methods

2.1. Occurrence Data
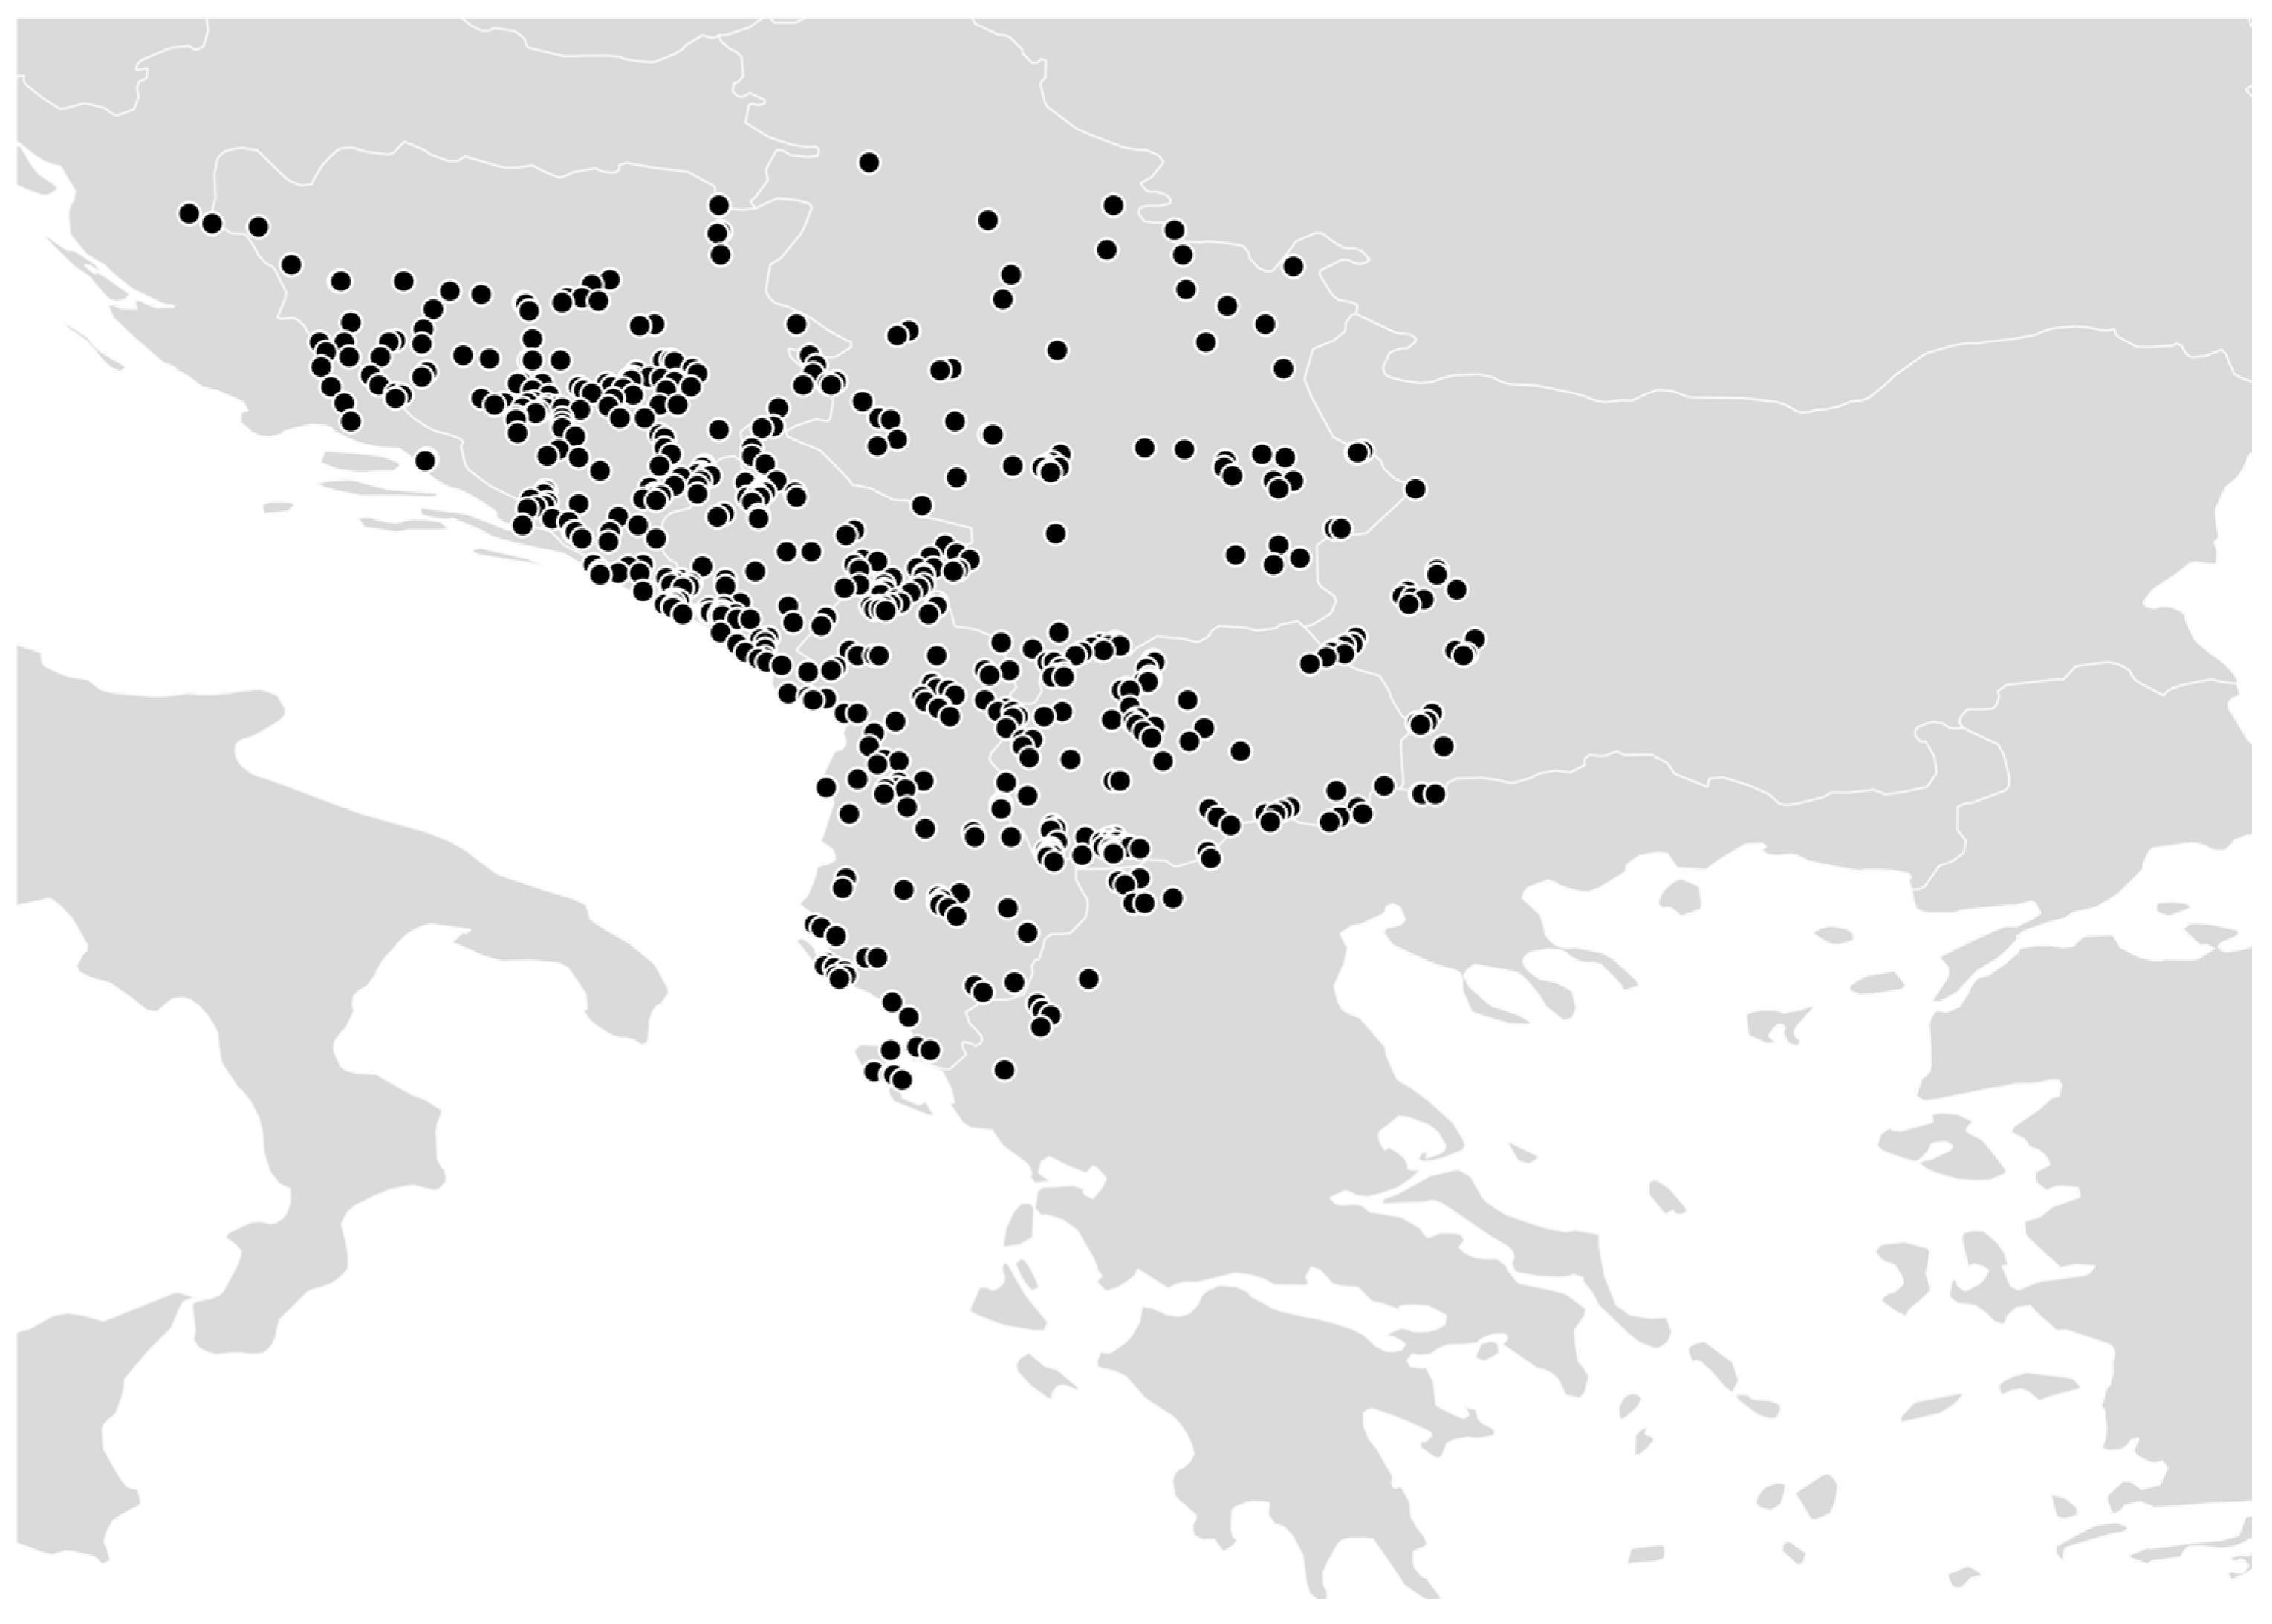
As focal taxa, we considered non-flying, terrestrial, endemic beetles (Coleoptera) from the Western Balkans. Occurrence data were obtained from the dataset “Classic localities of endemic beetles (Coleoptera) from the Western Balkans”—GBIF Occurrence Download. Available online: https://doi.org/10.15468/89yerk (accessed on 15 January 2026) [25]. This resource compiles georeferenced “classical localities” (type localities and associated sites) for beetle taxa whose present distributions are restricted to the Western Balkans region, based on an extensive review of the taxonomic and faunistic literature [25].
We downloaded the full occurrence table as a Darwin Core archive and processed it in R version 4.4.3 [27]. After import, we retained only records with valid decimal latitude and longitude and filtered to strictly non-cave localities following the annotations and locality information provided in the original dataset [25]. Records flagged as cave localities were removed.
After removing cave records, the dataset comprised 1330 georeferenced occurrence records. To account for sampling bias, the records were thinned to one record per cell. The final (thinned) dataset comprised 578 non-cave localities (Figure 1, Table S1) within the climatic study window (14–25° E, 37–46° N). These localities (Table S1) were used in all subsequent climate-stability and null-model analyses.
For the spatial operations, we used the packages sf version 0.1-21 [28] and terra version 1.8-50 [29], while for data handling, we used data.table version 1.18.2.1 [30] and dplyr version 1.1.4 [31].
Figure 1. Localities of western Balkan endemic beetle species, from the dataset “Classic localities of endemic beetles (Coleoptera) from the Western Balkans” [25] after removing cave records, and after thinning the records to one record per cell. The administrative boundary layers of the relevant countries are obtained from the geoBoundaries resource [32].
Ecologies 07 00038 g001

2.2. Study Area

To describe in detail the geographic scope of the study, we used the Mountain region names and boundaries following the GMBA Mountain Inventory v2.0 (broad) [33]. In the dataset we used, there were records from: the Dinaric Alps (maritime to high-alpine sectors), the Balkan Mountains, the Rila–Rhodope Massif (including Rila, Osogovo–Belasitsa and associated ranges), the Pindus Mountains and the Western/Eastern Hellenides, and a dense set of intermediate massifs and basin-edge uplands (e.g., Šumadija and Stari Vlah–Raška–Kopaonik belts, Peri-Pannonian “island” mountains).

2.3. Paleoclimate Data Climate Stability Metrics

We used four bioclimatic variables: two temperature variables, annual mean temperature (bio01), temperature seasonality (bio04); and two precipitation variables, annual precipitation (bio12); and precipitation seasonality (bio15). These variables were selected to represent two broad climatic axes relevant to refugial persistence, thermal and hydric conditions, while also distinguishing between mean conditions and seasonal variability. Given the aim of the study, it was therefore more appropriate to use a focused subset rather than all 19 bioclimatic variables, many of which are strongly correlated and would have added substantial redundancy.
The bioclimatic variables data was obtained from the CHELSA-TraCE21k paleoclimate dataset (version 1.0) [26]. This dataset represents a downscaled TraCE-21ka climate simulation to 30-arcsec resolution for the global land surface at 100-year time steps from 21,000 years before present (BP) to 0 BP [26]. Each slice was cropped to a window encompassing all of the localities in the dataset: 14–25° E, 37–46° N.
For each variable, we quantified temporal variability at each grid cell over the full 21 ka period using three complementary metrics, conceptually similar to multi-metric approaches used for identifying refugia [2] or for studying the influence of climate-change velocity on species endemism [6]. Namely, temporal standard deviation (SD); temporal range (RANGE); Detrended standard deviation (DETSD), which emphasizes short-term fluctuations after removing the linear component of warming or cooling.
For each variable and metric, the resulting stability surface was written to a GeoTIFF (e.g., bio01_sd_0_21000BP_full100.tif) representing 21,000 years of temporal variability at 30-arcsec resolution. Lower values correspond to higher climatic stability through time.

2.4. Local Stability Islands

To test whether the endemic beetle localities are preferentially localized within islands of climatic stability relative to their immediate surroundings, we compared the stability metric at each endemic locality cell against that of its neighboring cells. For each stability raster and each endemic locality, we: (1) located the corresponding grid cell; (2) compiled a list of endemic locality cells—cells with at least one endemic beetle record (no duplicate cells); (3) defined a square neighbourhood around it with windows of 3 × 3; 5 × 5, and 9 × 9 cells (excluding the focal cell); (4) extracted stability values from all neighbouring cells; (5) computed the neighbourhood mean, standard deviation and lower quartile (25th percentile) of those values; (6) calculated a local isolation score
z iso = v focal μ neigh σ neigh ,
where v focal is the stability metric at the endemic cell (SD, RANGE or DETSD), and μ neigh , σ neigh are the mean and SD of this stability metric among the neighbours.
An endemic locality cell was classified as a climatic stability island (for a given variable, metric and window size) if its temporal variability metric (SD, range or detrended SD) was lower than or equal to the 25th percentile of the surrounding neighbourhood, i.e., if it fell within the locally most stable quartile of cells. For each combination of bioclimatic variable, metric and window, we then summarised: (1) the proportion of endemic localities in stability islands (prop_islands); (2) the mean isolation score (mean_z) across all endemic localities.
These summaries quantify, respectively, how often endemic beetles occur in locally stable cells (with respect to the given climatic variable) and how much, on average, their cells deviate from the neighbourhood stability distribution.
For neighbourhood extractions and per-point statistics, we used terra 1.8-50 [29] and sf 1.0-21 [28], and for tabular summaries we used dplyr 1.1.4 [31], tibble 3.2.1 [34] and readr 2.1.5 [35].
Additionally, we used shapefiles with protected areas [36] and checked if the endemic locality cells are located within protected areas, using the Join Attributes by Location tool in QGIS 3.44.3-Solothurn [37].

2.5. Elevation-Matched Null-Model Test

We tested whether the observed proportions of endemic localities in stability islands exceeded expectations under spatially random placement, with elevation constraints. For that purpose, we constructed a null model that preserves the marginal elevation distribution of endemic localities. To define the study area for null model comparisons, we constructed a bounding polygon around the endemic beetle localities. First, a convex hull was generated around all occurrence points in QGIS 3.44.3-Solothurn [37]. This convex hull was then intersected with administrative boundary layers of the relevant countries obtained from the geoBoundaries resource [32]. The resulting polygon circumscribed the extent of the endemic beetle localities used in the following analysis, while excluding sea cells.
All CHELSA-TraCE21k bioclimatic rasters of the four variables and elevation raster (orog—CHELSA-TraCE21k surface altitude: variable orog, present-day time slice 0000) [26] were clipped to this polygon prior to stability metric calculation and null model sampling. After cropping orog to the target area polygon (and confirming that temporal changes in orography across time slices were negligible in the region), we assigned each grid cell to 100 m elevation bins and, for each endemic locality, restricted candidate null cells to bins within ±200 m of its elevation (using the present-day time slice 0000). In each replicate, we drew one replacement cell per endemic locality from the corresponding band and computed prop_islands as above. For each bioclimatic variable SD and window size, we generated 999 null replicates.
For the null model, we summarised the null distributions by their mean and standard deviation and estimated empirical one-sided p-values as the proportion of null replicates with prop_islands greater than or equal to, or less than or equal to, the observed value. Multiple testing was controlled for separately within each bioclimatic variable across the three window sizes using the Benjamini–Hochberg false discovery rate (FDR) procedure. This correction was applied separately to the one-sided enrichment tests (p (≥obs.)) and the complementary one-sided depletion tests (p (≤obs.)), and adjusted p-values are reported as q-values.
The analyses described above were conducted in R version 4.4.3 [27] using the packages terra v1.0-21 [29], sf v1.0-21 [28], data.table v1.18.2.1 [30], dplyr v1.1.4 [31], tibble v3.2.1 [34], readr v2.1.5 [35], and stringr 1.6.0 [38].

2.6. Landform Classes Distribution Analysis

To characterize the topographic setting of endemic beetle localities, we derived landform classes from the EuroDEM 2023 [39] digital elevation model in QGIS 3.44.3-Solothurn [37]. EuroDEM is a pan-European bare-earth elevation dataset distributed as a raster GeoTIFF in the ETRS89 geographic coordinate system, with a grid width of 2 arc seconds (approximately 60 m in the north–south direction); coverage for Bulgaria and several other Balkan countries is provided through MERIT DEM infill. The EuroDEM raster was clipped to the study-area polygon and reprojected to WGS84 to match the coordinate reference system of the thinned endemic-locality dataset. Landform classes were then generated from the clipped DEM using the GRASS GIS algorithm r.geomorphon as implemented in QGIS. Raster values were extracted to locality points with the QGIS Sample raster values tool, assigning each locality to its corresponding geomorphon class. Frequencies of localities per landform class were subsequently summarized for the full thinned endemic-locality dataset and for the subset of localities falling in precipitation-stability island cells.

3. Results

3.1. Frequency and Isolation of Stability Islands

For the temporal SD, the proportion of endemic localities falling within stability islands ranged from approximately 1% to 22%, depending on variable and window size (Table 1, Table S2). Mean annual temperature (bio01) consistently showed the highest fraction of beetle localities in stability islands (20%), followed by annual precipitation (10%), precipitation seasonality (9%), and temperature seasonality (2%). The results for the other two metrics show similar ordering by frequency, with bio01 always showing the highest frequency of stability islands (Table 1).
Isolation scores calculated for stability-island cells were consistently negative across all variables and metrics (Islands_mean_z; Table 1, Table S3), and indicated that when endemic localities fall within the cell’s neighborhood most stable quartile, their cells are 0.62–1.12 neighbourhood standard deviations more stable than surrounding cells. The weakest neighbourhood contrast occurred for annual mean temperature under the RANGE metric (Islands_mean_z = −0.62), whereas the strongest contrast was observed for temperature seasonality under RANGE (Islands_mean_z = −1.12). For precipitation variables, island cells showed a similarly consistent contrast to their neighbourhoods across metrics: annual precipitation was between −0.95 and −0.97, while precipitation seasonality was between −1.01 and −1.07.

3.2. Elevation-Matched Null-Model Test of Stability-Island Enrichment

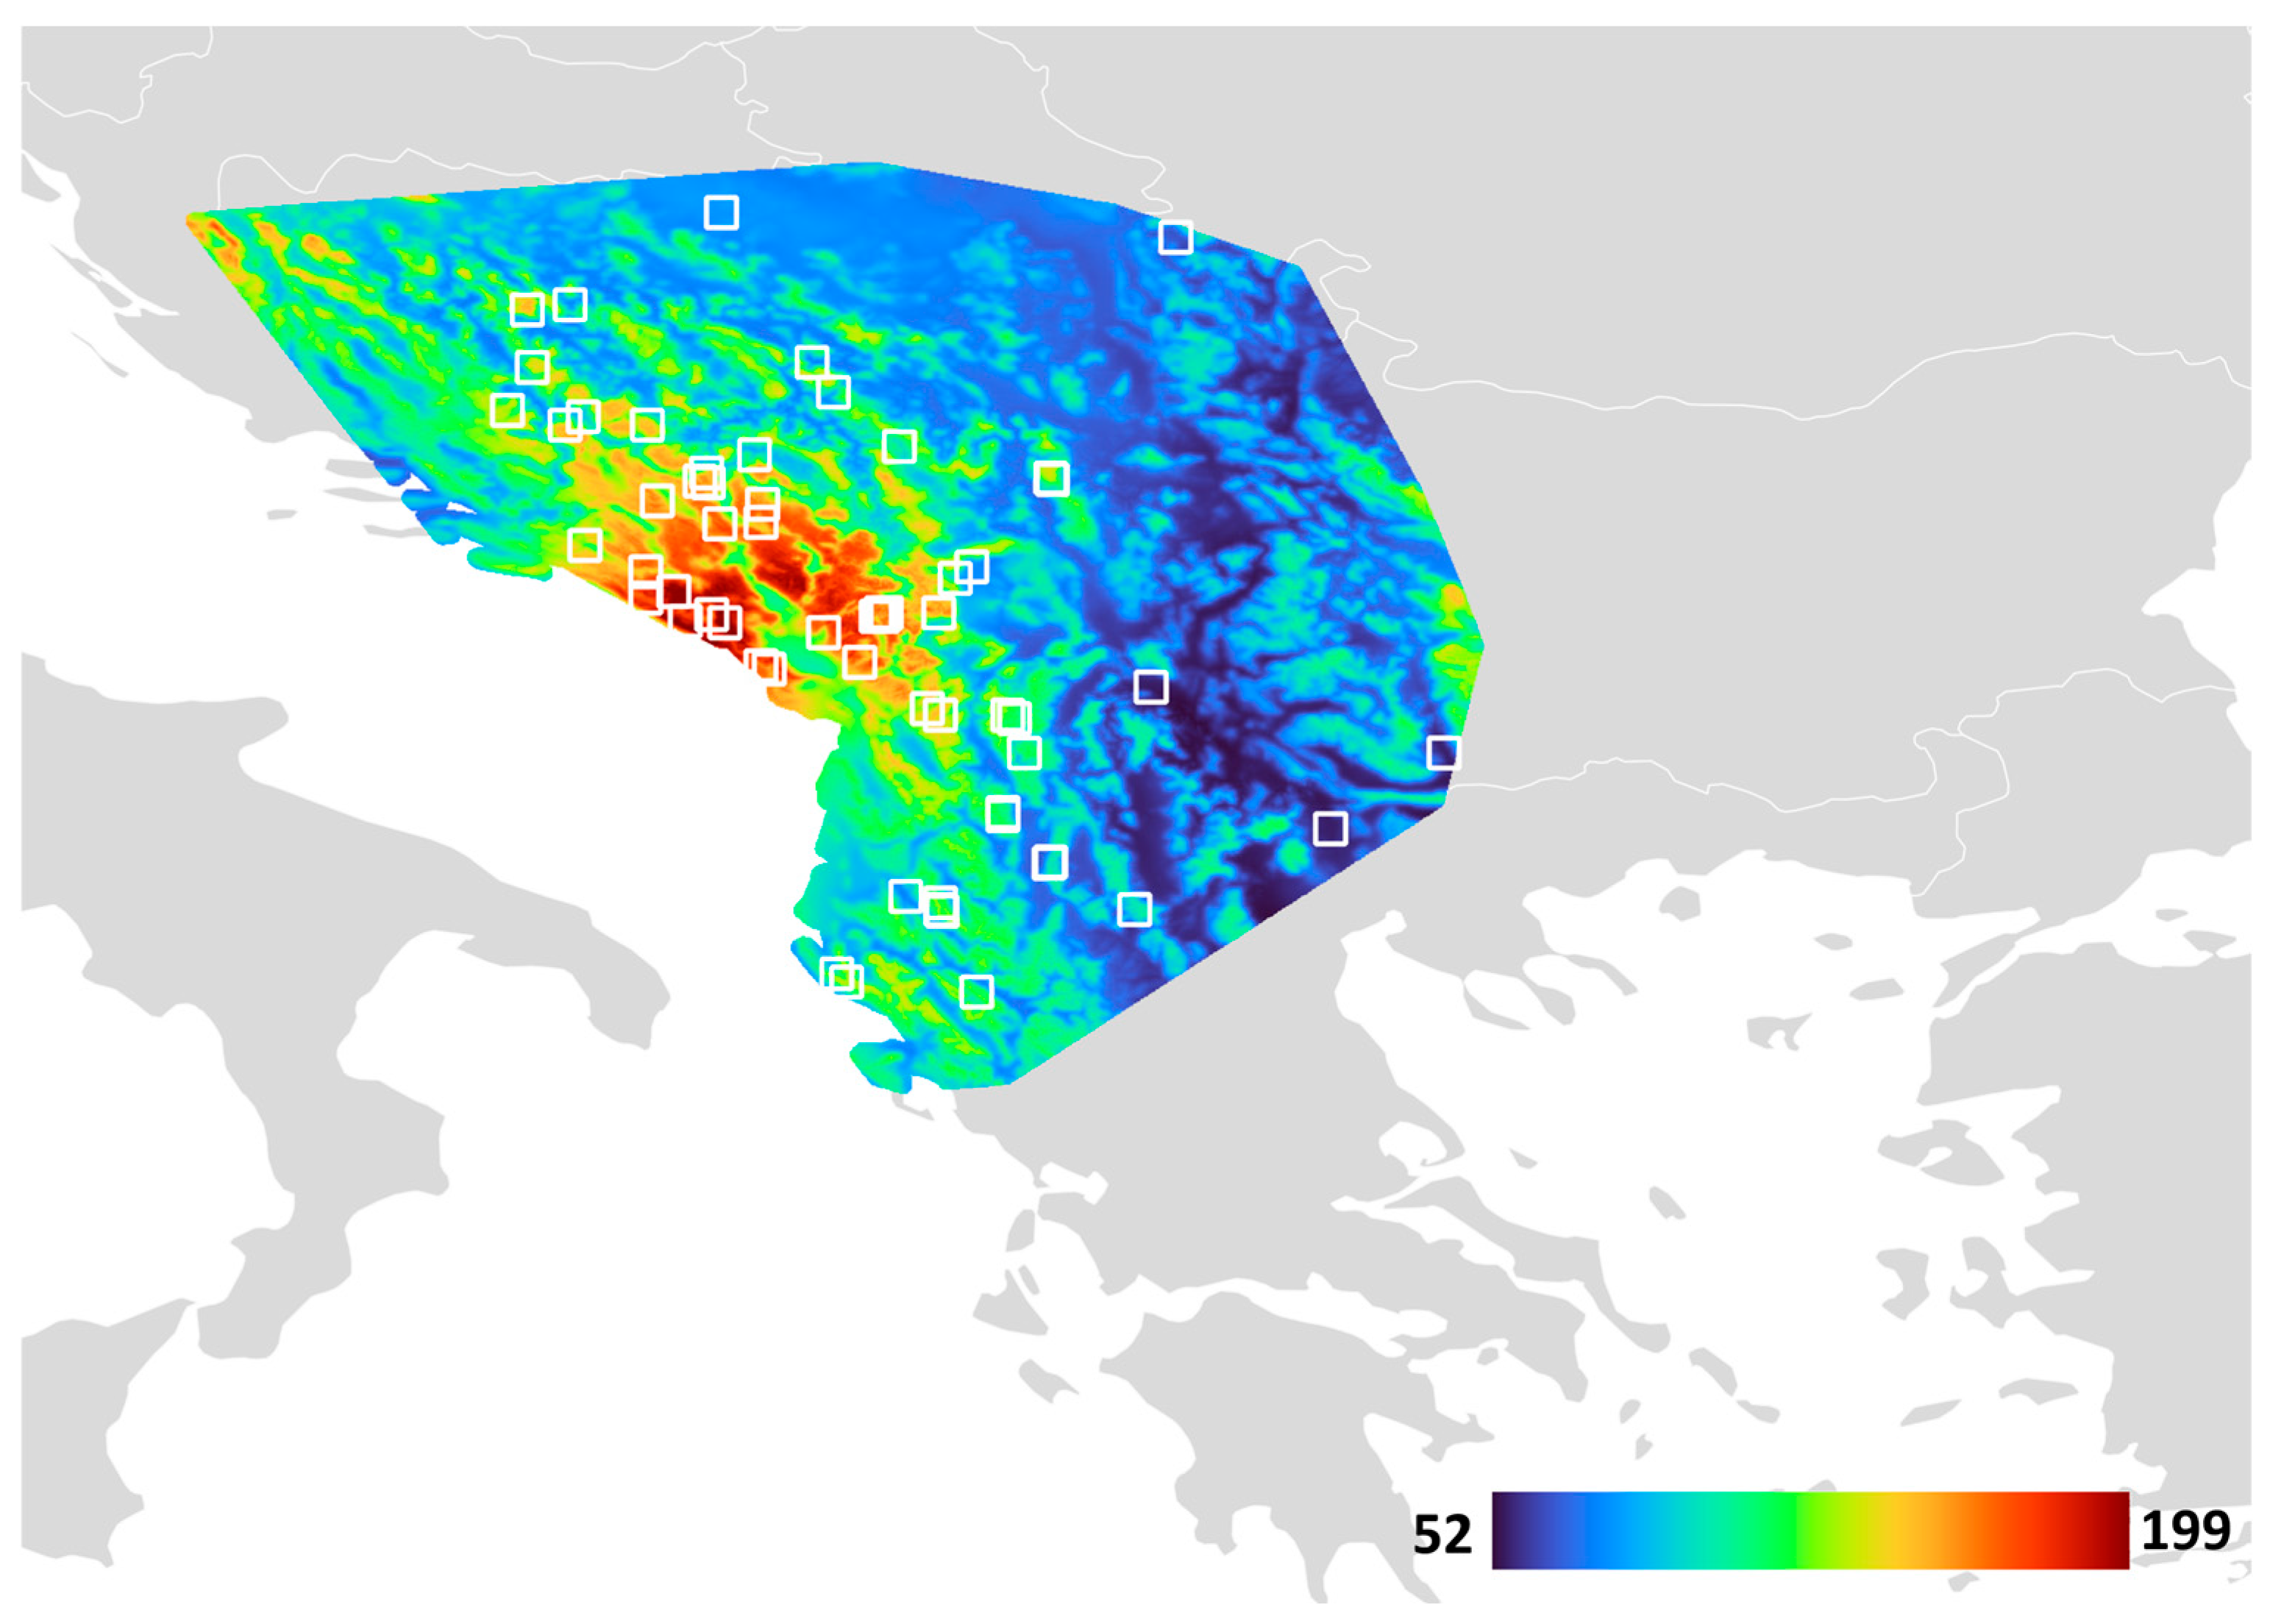
Under the elevation-matched null model, endemic localities showed consistent enrichment in annual precipitation stability islands (bio12; SD) (Table 2, Figure 2). The observed percentages of endemic localities in islands were 9.7–10.7%, compared with null means of 7.3–8.5% across the neighborhood sizes (k = 3, 5, 9). Importantly, the observed values were at the extreme upper end of what would be expected by chance under the null models for k = 3 and 5—the observed percentages exceeded the 97.5% null quantile (9.5% and 9.2%, respectively), meaning that in 97.5% of the elevation-matched randomization the percentage of random points falling in stability islands was lower than these thresholds, and only 2.5% of null runs reached higher values. Consistent with this, empirical one-sided p-values p (null ≥ obs) ranged from 0.01 to 0.03. After Benjamini–Hochberg correction, this enrichment remained significant for all neighbourhoods sizes (q_BH = 0.02– 0.03).
In contrast, annual mean temperature stability islands (bio01; SD) showed no enrichment: observed percentages (19.2–22.4%) were below null means (21.2–25.3%). This tendency was not supported after Benjamini–Hochberg correction (q_BH = 0.05, for each of k = 3, 5, and 9, respectively). The remaining variables (bio04, bio15) showed weaker and less consistent deviations from null expectations across neighbourhood sizes.

3.3. Stability Islands in Protected Areas

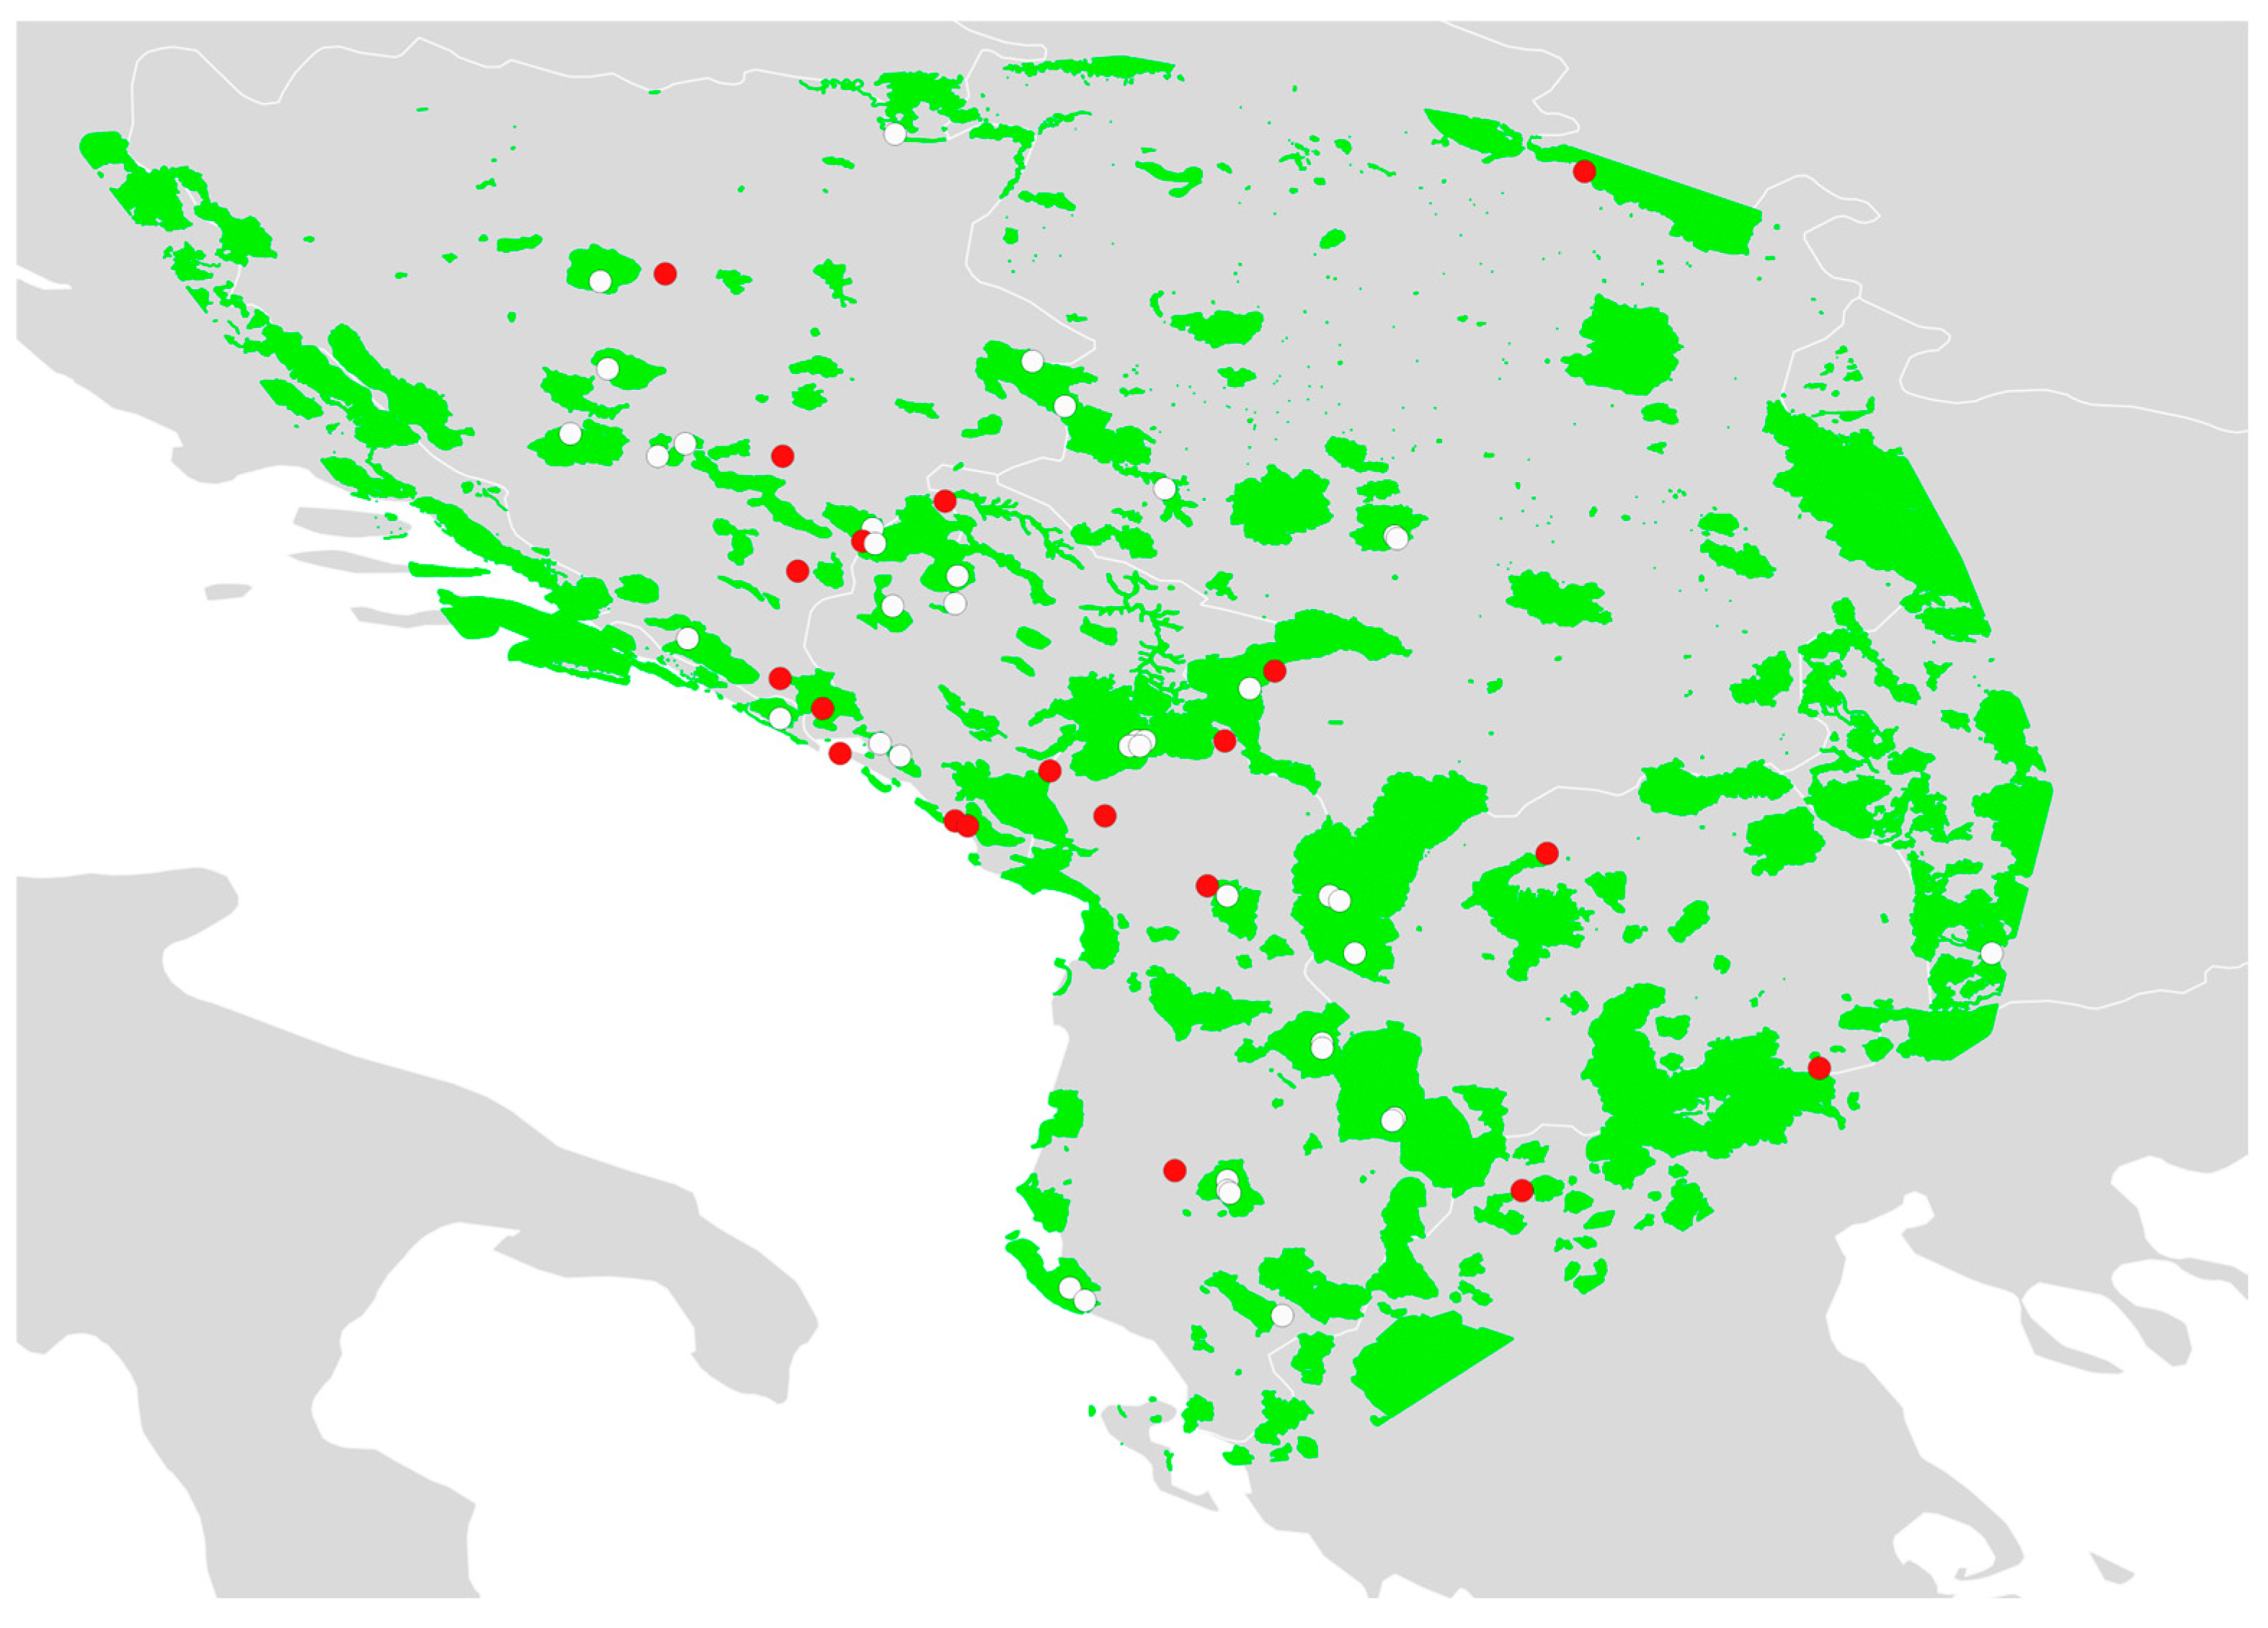
In total, 60 endemic locality cells were identified as stability islands, based on SD of bio12 for a window of 3 × 3 cells (Table S3); of them, 40 were within protected areas, with the remaining 20, while located often close to the border, but outside the protected areas (Figure 3, Table S4).
Of the endemic-beetle localities that fall within bio12 SD precipitation-stability islands (3 × 3 window) but outside protected-area borders, the sites were distributed across the western Balkan region and adjacent Greece, the highest number of them were in Bosnia and Herzegovina (7 localities) and a second concentration in Albania (5 localities), alongside smaller sets in Montenegro (3 localities), North Macedonia (2 localities), and single localities in Serbia, Kosovo, and Greece, respectively. Of the localities in precipitation-stability islands that fall outside current protected-area boundaries, the cases most relevant for site-level assessment were those situated close to named protected areas. In Bosnia and Herzegovina, these include a locality in the Volujak mountain massif, near Piva Nature Park; a locality near Trebinje Town, adjacent to Orjen Nature Park; and Dobri Do, a locality on the northern slope of Orjen that is likewise close to the same protected area. Vučja Bara, a high-elevation locality on Bjelašnica Mt., should be noted separately, since Bjelašnica has been identified in national planning documents as an area of significant natural value and a candidate for further protection [40].
In Albania, the relevant cases were Mali i Shkëlzenit, a mountain locality close to the protected area Lumi i Gashit, and Grykë-Orosh, a locality close to the protected area Bjeshka e Oroshit. In North Macedonia, a locality near Gevgelija Town, on the border with Greece, lies close to the protected area Eidomeni (also referred to as Altsakiou). In Greece, a locality in the Verno mountain range (also referred to as Vitsi)—close to the Natura 2000 site Oros Vernon–Koryfi Vitsi. In Kosovo, a locality near Novo Selo Village (also referred to as Fierza), in the Peja Municipality—close to the protected Prokletije mountain area (also referred to as Bjeshkët e Nemuna); In Serbia, a locality near Požeženo Village, in the Veliko Gradište area—close to Romania’s Iron Gates Natural Park (also referred to as Parcul Natural Porțile de Fier).

3.4. Landform Classes Analysis

To briefly characterize the topographic settings of the 582 localities (non-cave localities of endemic beetles) used in the analysis (see previous sections), we extracted geomorphon landform classes for all localities, including those classified as annual precipitation-stability islands (based on SD, 3 × 3 window). Among localities with an assigned landform class, the full dataset was distributed across the following geomorphon types, with slopes (174 localities), spurs (138), hollows (105), and valleys (61) being the most frequent; smaller numbers occurred in ridges (49), flats (24), footslopes (7), pits (6), shoulders (4), and peaks (3). Among the localities situated in annual precipitation-stability islands, slopes were again the most frequent class (23 localities), followed by spurs (11), hollows (10), and valleys (4), whereas flats (3), footslopes (3), and ridges (3) were less common, and only one locality fell in a peak geomorphon landform cell. Seven localities in the full dataset, of which two belonged to the precipitation-stability subset, fell in cells without landform-classification data.

4. Discussion

4.1. Endemic Beetle Localities Association with Precipitation Stability Islands

Our analyses show that western Balkan endemic beetle localities are non-randomly associated with long-term precipitation stability as mapped by the CHELSA-TraCE21k reconstructions, specifically stability islands based on low temporal variability in annual precipitation (bio12 SD) over the last 21,000 years. This enrichment is consistent across neighborhood sizes in the elevation-matched null model, although the effect size is modest. In contrast, apparent associations with temperature-stability islands are not supported by the elevation-matched null-model test results, suggesting that temperature stability patterns at this spatial grain largely reflect the shared altitudinal structure of climate and endemic occurrences rather than preferential association with thermally stable cells. One plausible explanation is that organisms in high topographic variability regions can exploit microclimatic variation over short distances [17], effectively decoupling experienced thermal conditions from what coarse-grained (about 1 km resolution) stability surfaces capture. Additionally, organism-scale microclimates are often not represented in GIS layers [1,41]. Therefore, the lack of a temperature-stability signal after elevation control does not exclude fine-scale thermal buffering (microrefugia) in the landscape.
At the same time, the clearer precipitation signal may indicate that precipitation-related stability is better captured at the resolution used here. Additionally, the precipitation signal is plausible in the broader Mediterranean context, where Quaternary change involved not only temperature shifts but pronounced variation in aridity and moisture availability [16,42]. Keppel et al. [3] note that increasing aridity in some ice-free areas during glacial periods may result in the formation of mesic refugia. The pattern we document is also consistent with the notion of hydric refugia (sensu [4]), proposed as important for biota whose persistence is sensitive to water availability and moisture-related habitat structure. Although the association between endemic beetle localities and precipitation stability observed here is modest, it aligns with broader syntheses linking climatic stability with high endemism, including quantitative evidence from climate-change velocity analyses [6] and support from reviews on the endemism–stability relationship [43]. In this sense, precipitation stability islands may be viewed as one measurable expression of that relationship at the spatial grain and for the climatic dimension examined here.
With respect to topographic setting, although endemic localities in precipitation-stability islands were most often situated on slopes, they also occurred in hollows and other landforms, indicating a broad but uneven representation of topographic positions rather than confinement to a single geomorphon class. Comparing the landform distribution of the full endemic-locality dataset with that of the precipitation-stability-island subset reveals a shift in relative composition that may be informative. It should be noted that seven localities in the full dataset, including two in the precipitation-stability subset, fell in cells without landform-classification data and were excluded from percentage calculations. In the full dataset, slopes accounted for approximately 30.5% of classified localities, spurs for 24.2%, hollows for 18.4%, and valleys for 10.7%. In the precipitation-stability-island subset, slopes increased to 39.7%, whereas spurs declined to 19.0%, hollows to 17.2%, and valleys to 6.9%. Footslopes, by contrast, represented only 1.2% of the full dataset but 5.2% of the stability-island subset. These proportional shifts suggest that the precipitation-stability signal does not filter endemic localities uniformly across landforms—certain topographic positions, particularly valleys, appear to be under-represented in the stability-island subset relative to the full dataset, whereas slopes are slightly more over-represented.
A possible interpretation is that different topographic settings buffer moisture in different ways, and that the relative importance of broad-scale, long-term precipitation stability for species persistence depends on the degree of intrinsic hydric buffering provided by local topography. Endemic localities situated in hollows and valleys may benefit from local hydric buffering through topographic convergence and moisture accumulation—mechanisms that can maintain mesic conditions largely independently of broader precipitation trends. Such sites would be expected to support endemic populations, whether or not the enclosing ~1 km grid cell qualifies as a precipitation-stability island in the paleoclimate layers, which could explain why valleys are proportionally less common in the stability-island subset than in the full dataset. By contrast, localities on slopes lack the topographic geometry that funnels and retains water, and may therefore depend more strongly on broader-scale long-term precipitation stability for maintaining the moisture conditions under which resident lineages have persisted, which could contribute to the more pronounced predominance of slope positions among precipitation-stability-island localities.
This pattern is consistent with the refugia typology proposed by Médail and Diadema [44] for the Mediterranean region, who distinguished three types of refugia suited to different ecological contexts: moist mid-altitude refugia allowing altitudinal shifts or in situ persistence, deep gorges and closed valleys around watercourses with continuous moisture, and low-altitude locally moist sites such as valley bottoms, coastal plains, and wetlands. The second and third of these types—gorges and closed valleys, and moist low-altitude sites—correspond broadly to the hollow and valley positions in the geomorphon classification, settings where topographically mediated moisture persistence may reduce dependence on regional precipitation stability. The first type—mid-altitude refugia enabling altitudinal tracking—may be more relevant to slope and spur positions, where the absence of local moisture convergence would make persistence more contingent on sustained broad-scale precipitation input. In this context, the shift in landform composition between the full dataset and the stability-island subset may reflect the coexistence of functionally distinct refugial mechanisms operating across different topographic settings within the study region: locally buffered hydric refugia in convergent landforms and stability-dependent refugia on exposed slopes.
This interpretation remains inferential, however, because the present analyses do not directly quantify local moisture retention or topographic hydric buffering, and the geomorphon classification captures landform geometry at a single spatial grain rather than the full complexity of hydrological processes. The small absolute numbers of localities in several landform classes (e.g., footslopes, peaks, flats) also limit the robustness of proportional comparisons for those categories. Resolving these questions would require integrating direct measurements or very fine resolution proxies of local moisture availability with the paleoclimatic stability layers, an approach beyond the scope of the present study but one that could clarify whether the topographic patterns observed here reflect genuine functional differences in moisture buffering

4.2. Implications of the Results for Conservation Planning

When we overlaid precipitation-stability islands (bio12 SD; 3 × 3 window) with protected-area boundaries, 20 of the 60 island cells containing endemic localities fell outside protected areas, often close to existing borders. Of these 20 localities, at least 10, as listed in the Results section, merit targeted evaluation as potential conservation gaps, particularly where minor boundary revisions or complementary management measures could extend protection to precipitation-stable localities supporting endemic species. Our results also provide further support for the conservation importance of Bjelašnica Mt., because the occurrence of a locality on this mountain within a precipitation-stability island, but outside current protected-area boundaries, suggests that Bjelašnica may contain climatically buffered sites relevant to the persistence of western Balkan endemic beetles that are not fully captured by the existing protection network. This interpretation is consistent with national conservation-planning documents in Bosnia and Herzegovina, which list the broader Igman–Bjelašnica–Treskavica–Visočica–Rakitnica area among planned protected areas and note earlier feasibility work for protection in this mountain complex [40]. Because some recorded localities may have undergone habitat alteration or fragmentation since the time of collection, not all candidate sites highlighted here can be assumed to retain the same present-day conservation value. The identified precipitation-stability localities should therefore be treated as a screening layer for targeted re-evaluation rather than as a definitive set of current priority sites.

4.3. Data and Methodology Limitations and Future Directions

Several limitations should be considered when interpreting these results. The approximately 1 km resolution of CHELSA-TraCE21k cannot resolve fine-scale microrefugia conditions, and as emphasised in refugia and endemism syntheses, microrefugia can depend on fine-scale topography and microclimate not captured in typical gridded layers [1,41]. Our occurrence dataset reflects historical collecting effort and is unlikely to be spatially uniform or random. The elevation-matched null model controls for the dominant altitudinal gradient but does not account for heterogeneity in geology, soils, or vegetation. Mapped stability features should therefore be interpreted as coarse screening rather than direct representations of organism-scale refugia, and the precipitation-stability islands we identify here are best understood as a starting point for targeted ecological evaluation rather than as a definitive map of refugial locations. Additionally, it should be noted that our analysis does not directly test moisture dependence, demographic stability, dispersal barriers, or historical persistence, and the precipitation-stability association should therefore be treated as a spatial correlation rather than as evidence of a mechanism. Follow-up work could evaluate whether endemic populations in precipitation-stability islands show genetic or demographic signatures consistent with long-term persistence or isolation, as has been done in other refugia contexts [14].

5. Conclusions

Using CHELSA-TraCE21k reconstructions and an elevation-matched null model, we found a modest but consistent enrichment of western Balkan endemic beetle localities in annual precipitation stability islands (based on SD) across neighbourhood sizes (2–3 percentage points above null expectations). In contrast, associations with temperature-stability islands did not persist after controlling for elevation. These results indicate that precipitation-based stability mapping can provide a useful, open-data screening layer for identifying candidate areas where endemic localities coincide with locally buffered long-term climate variability in the specific region of the study. When intersected with protected-area boundaries, a substantial fraction of precipitation-stability island cells containing endemic localities lay outside existing protection, highlighting specific gaps that merit site-level assessment and follow-up surveys.

Supplementary Materials

The following supporting information can be downloaded at: https://www.mdpi.com/article/10.3390/ecologies7020038/s1, Table S1: The dataset used in the analysis, comprising 582 non-cave localities of endemic beetles (Coleoptera) with data on the landform they belong to; Table S2: Proportion of endemic localities in stability islands by variable, metric and window sizes (k = 3, 5, 9); Table S3: Endemic localities occurrence in stability-island cells identified by each of the variable-metric-window size combinations tested; Table S4: Endemic localities occurring in stability-island cells identified from the SD of bio12 using a 3 × 3 cell window, with indication of whether each locality falls inside or outside protected area.

Author Contributions

Conceptualization, D.S.; Software, I.T.; Validation, D.S.; Formal analysis, D.S.; Investigation, D.S.; Resources, I.T.; Data curation, I.T.; Writing—original draft, D.S.; Writing—review and editing, D.S.; Visualization, D.S.; Supervision, D.S. All authors have read and agreed to the published version of the manuscript.

Funding

National Science Fund, Ministry of Education, Youth and Science of the Republic of Bulgaria under the “Vihren” program, Grant KП-06-ДB/4 from 16 December 2024.

Institutional Review Board Statement

Not applicable, the study did not involve handling animals.

Data Availability Statement

The analyzed locality data and results of the analysis are available within the main text of the paper or in the supporting information (Supplementary Materials).

Acknowledgments

We gratefully acknowledge the colleagues who have compiled and published the dataset of classic localities of endemic beetles from the Western Balkans and making it available through GBIF, GBIF Occurrence Download. Available online: https://doi.org/10.15468/89yerk (accessed on 15 January 2026) [25] which we used in the present study. This study used EuroDEM data. This dataset includes Intellectual Property from European National Mapping and Cadastral Authorities and is licensed on behalf of these by EuroGeographics. The original dataset is available free of charge from Maps for Europe. The terms of the licence are available from Maps for Europe. Original dataset is available for free at https://www.mapsforeurope.org (accessed on 4 March 2026). The literature review on climatic stability and refugia in the Balkan Peninsula, which provided background for the present study, was prepared within the framework of the project “The Evolutionary Role of the South-Eastern European Mountain System (SEEMS) as a Center of Speciation, Dispersal, and Refugium for European Terrestrial Invertebrates and its Conservation Importance as a Biodiversity Hotspot”, funded by the National Science Fund, Ministry of Education, Youth and Science of the Republic of Bulgaria under the “Vihren” program, Grant KП-06-ДB/4 from 16 December 2024.

Conflicts of Interest

The authors declare no conflicts of interest.

References

  1. Ashcroft, M.B. Identifying Refugia from Climate Change. J. Biogeogr. 2010, 37, 1407–1413. [Google Scholar] [CrossRef] [Scilit]
  2. Ashcroft, M.B.; Gollan, J.R.; Warton, D.I.; Ramp, D. A novel approach to quantify and locate potential microrefugia using topoclimate, climate stability, and isolation from the matrix. Glob. Change Biol. 2012, 18, 1866–1879. [Google Scholar] [CrossRef] [Scilit]
  3. Keppel, G.; Van Niel, K.P.; Wardell-Johnson, G.W.; Yates, C.J.; Byrne, M.; Mucina, L.; Schut, A.G.T.; Hopper, S.D.; Franklin, S.E. Refugia: Identifying and understanding safe havens for biodiversity under climate change. Glob. Ecol. Biogeogr. 2012, 21, 393–404. [Google Scholar] [CrossRef] [Scilit]
  4. Reside, A.E.; Welbergen, J.A.; Phillips, B.L.; Wardell-Johnson, G.W.; Keppel, G.; Ferrier, S.; Williams, S.E.; van der Wal, J. Characteristics of climate change refugia for Australian biodiversity. Austral Ecol. 2014, 39, 887–897. [Google Scholar] [CrossRef] [Scilit]
  5. Keppel, G.; Stralberg, D.; Morelli, T.L.; Bátori, Z. Managing Climate-Change Refugia to Prevent Extinctions. Trends Ecol. Evol. 2024, 39, 800–808. [Google Scholar] [CrossRef] [Scilit]
  6. Sandel, B.; Arge, L.; Dalsgaard, B.; Davies, R.G.; Gaston, K.J.; Sutherland, W.J.; Svenning, J.-C. The influence of Late Quaternary climate-change velocity on species endemism. Science 2011, 334, 660–664. [Google Scholar] [CrossRef] [Scilit]
  7. Sandel, B.; Monnet, A.-C.; Govaerts, R.; Vorontsova, M. Late Quaternary climate stability and the origins and future of global grass endemism. Ann. Bot. 2017, 119, 279–288. [Google Scholar] [CrossRef] [Scilit] [PubMed]
  8. Cardoso, P.; Erwin, T.L.; Borges, P.A.V.; New, T.R. The Seven Impediments in Invertebrate Conservation and How to Overcome Them. Biol. Conserv. 2011, 144, 2647–2655. [Google Scholar] [CrossRef] [Scilit]
  9. Haslett, J.R. European Strategy for the Conservation of Invertebrate Animals (Excluding Marine Species); Document T-PVS (2006) 2; Council of Europe/Bern Convention (Standing Committee): Strasbourg, France, 2006. [Google Scholar]
  10. Jenkins, C.N.; Guénard, B.; Diamond, S.E.; Weiser, M.D.; Dunn, R.R. Conservation Implications of Divergent Global Patterns of Ant and Vertebrate Diversity. Divers. Distrib. 2013, 19, 1084–1092. [Google Scholar] [CrossRef] [Scilit]
  11. Schuldt, A.; Assmann, T. Invertebrate Diversity and National Responsibility for Species Conservation across Europe–A Multi-Taxon Approach. Biol. Conserv. 2010, 143, 2747–2756. [Google Scholar] [CrossRef] [Scilit]
  12. Eisenhauer, N.; Bonn, A.; Guerra, C.A. Recognizing the Quiet Extinction of Invertebrates. Nat. Commun. 2019, 10, 50. [Google Scholar] [CrossRef] [Scilit] [PubMed]
  13. Myers, N.; Mittermeier, R.A.; Mittermeier, C.G.; da Fonseca, G.A.B.; Kent, J. Biodiversity hotspots for conservation priorities. Nature 2000, 403, 853–858. [Google Scholar] [CrossRef] [Scilit]
  14. Hewitt, G.M. The Genetic Legacy of the Quaternary Ice Ages. Nature 2000, 405, 907–913. [Google Scholar] [CrossRef] [Scilit] [PubMed]
  15. Schmitt, T. Molecular Biogeography of Europe: Pleistocene Cycles and Postglacial Trends. Front. Zool. 2007, 4, 11. [Google Scholar] [CrossRef] [Scilit]
  16. Tzedakis, P.C. The Balkans as Prime Glacial Refugial Territory of European Temperate Trees. In Balkan Biodiversity; Springer: Dordrecht, The Netherlands, 2004. [Google Scholar] [CrossRef] [Scilit]
  17. Tzedakis, P.C.; Lawson, I.T.; Frogley, M.R.; Hewitt, G.M.; Preece, R.C. Buffered tree population changes in a Quaternary refugium: Evolutionary implications. Science 2002, 297, 2044–2047. [Google Scholar] [CrossRef] [Scilit]
  18. Ćurčić, B.P.M.; Jovanović, V.M. The Cave-Dwelling Fauna of the Balkan Peninsula: Its Origin and Diversification. Acta Entomol. Slov. 2004, 12, 35–56. [Google Scholar]
  19. Wiktor, A. Endemism of Slugs within the Balkan Peninsula and Adjacent Islands (Gastropoda: Pulmonata: Arionidae, Milacidae, Limacidae, Agriolimacidae). Genus 1997, 8, 205–221. [Google Scholar]
  20. Trakić, T.; Valchovski, H.; Stojanović, M. Endemic Earthworms (Oligochaeta: Lumbricidae) of the Balkan Peninsula: A Review. Zootaxa 2016, 4189, 251–274. [Google Scholar] [CrossRef] [Scilit]
  21. Carosi, A.; Lorenzoni, F.; Oneto, F.; Capurro, M.; Ovčina, J.; Rezzoagli, D.; Petroselli, C.; Selvaggi, R.; Cappelletti, D.; Sanz, N.; et al. The Role of Protected Areas in the Balkan Freshwater Biodiversity Conservation: The Case of Blidinje Nature Park (Southwestern Bosnia-Herzegovina). J. Nat. Conserv. 2024, 82, 126739. [Google Scholar] [CrossRef] [Scilit]
  22. Stelbrink, B.; Shirokaya, A.A.; Föller, K.; Wilke, T.; Albrecht, C. Origin and Diversification of Lake Ohrid’s Endemic acroloxid limpets: The role of geography and ecology. BMC Evol. Biol. 2016, 16, 273. [Google Scholar] [CrossRef] [Scilit]
  23. Hlebec, D.; Podnar, M.; Kučinić, M.; Harms, D. Molecular Analyses of Pseudoscorpions in a Subterranean Biodiversity Hotspot Reveal Cryptic Diversity and Microendemism. Sci. Rep. 2023, 13, 430. [Google Scholar] [CrossRef] [Scilit]
  24. Guéorguiev, B. Biogeography of the Endemic Carabidae in the Central and Eastern Balkan Peninsula. In Biogeography and Ecology of Bulgaria; Springer: Dordrecht, The Netherlands, 2007. [Google Scholar]
  25. GBIF Occurrence Download. Available online: https://doi.org/10.15468/89yerk (accessed on 15 January 2026).
  26. Karger, D.N.; Nobis, M.P.; Normand, S.; Graham, C.H.; Zimmermann, N.E. CHELSA-TraCE21k v1.0: Downscaled Transient Temperature and Precipitation Data since 21,000 BP. Clim. Past 2023, 19, 439–456. [Google Scholar] [CrossRef] [Scilit]
  27. R Core Team. R version 4.4.3: A Language and Environment for Statistical Computing; R Foundation for Statistical Computing: Vienna, Austria, 2025; Available online: https://www.R-project.org (accessed on 20 February 2026).
  28. Pebesma, E. Simple features for R: Standardized support for spatial vector data. R J. 2018, 10, 439–446. [Google Scholar] [CrossRef] [Scilit]
  29. Hijmans, R.J. terra: Spatial Data Analysis, R Package Version 1.8-50; 2025. Available online: https://CRAN.R-project.org/package=terra (accessed on 20 February 2026).
  30. Barrett, T.; Dowle, M.; Srinivasan, A.; Gorecki, J.; Chirico, M.; Hocking, T.; Schwendinger, B.; Krylov, I.; Stetsenko, P.; Short, T.; et al. data.table: Extension of ‘data.frame’, R Package Version 1.18.2.1; 2026. Available online: https://CRAN.R-project.org/package=data.table (accessed on 20 February 2026).
  31. Wickham, H.; François, R.; Henry, L.; Müller, K.; Vaughan, D. dplyr: A Grammar of Data Manipulation, R Package Version 1.1.4; 2026. Available online: https://cran.r-project.org/web/packages/dplyr/index.html (accessed on 20 February 2026). [CrossRef] [Scilit]
  32. Runfola, D.; Anderson, A.; Baier, H.; Crittenden, M.; Dowker, E.; Fuhrig, S.; Goodman, S.; Grimsley, G.; Layko, R.; Melville, G.; et al. geoBoundaries: A global database of political administrative boundaries. PLoS ONE 2020, 15, e0231866. [Google Scholar] [CrossRef] [Scilit]
  33. Snethlage, M.A.; Geschke, J.; Ranipeta, A.; Jetz, W.; Yoccoz, N.G.; Körner, C.; Spehn, E.M.; Fischer, M.; Urbach, D. A Hierarchical Inventory of the World’s Mountains for Global Comparative Mountain Science. Sci. Data 2022, 9, 149. [Google Scholar] [CrossRef] [Scilit]
  34. Müller, K.; Wickham, H. tibble: Simple Data Frames, R Package Version 3.2.1; 2025. Available online: https://CRAN.R-project.org/package=tibble (accessed on 20 February 2026).
  35. Wickham, H.; Hester, J.; Bryan, J. readr: Read Rectangular Text Data, R Package Version 2.1.5; 2026. Available online: https://cran.r-project.org/web/packages/readr/index.html (accessed on 20 February 2026). [CrossRef] [Scilit]
  36. UNEP-WCMC; IUCN. Protected Planet: The World Database on Other Effective Area-Based Conservation Measures, [February 2026]; UNEP-WCMC and IUCN: Cambridge, UK; Available online: www.protectedplanet.net (accessed on 20 February 2026).
  37. QGIS Development Team. QGIS Geographic Information System, Version 3.44.3-Solothurn. Open Source Geospatial Foundation. 2025. Available online: https://qgis.org (accessed on 20 February 2026).
  38. Wickham, H. stringr: Simple, Consistent Wrappers for Common String Operations, R Package Version 1.6.0; 2025. Available online: https://CRAN.R-project.org/package=stringr (accessed on 20 February 2026).
  39. EuroGeographics AISBL. EuroDEM: Pan-European Height Dataset at Medium Scale. Specification–Version for EuroDEM 2023; EuroGeographics AISBL: Brussels, Belgium, 2023; Available online: https://www.mapsforeurope.org (accessed on 20 February 2026).
  40. The Strategy and Action Plan for Protection of Biological Diversity of Bosnia and Herzegovina for the Period 2015–2020. Available online: https://www.cbd.int/doc/world/ba/ba-nbsap-v2-en.pdf (accessed on 4 March 2026).
  41. Keppel, G.; Robinson, T.P.; Wardell-Johnson, G.W.; Yates, C.J.; van Niel, K.P.; Byrne, M.; Schut, A.G. A low-altitude mountain range as an important refugium for two narrow endemics in the Southwest Australian Floristic Region biodiversity hotspot. Ann. Bot. 2017, 119, 289–300. [Google Scholar] [CrossRef] [Scilit] [PubMed]
  42. Gömöry, D.; Zhelev, P.; Brus, R. The Balkans: A Genetic Hotspot but Not a Universal Colonization Source for Trees. Plant Syst. Evol. 2020, 306, 5. [Google Scholar] [CrossRef] [Scilit]
  43. Harrison, S.; Noss, R. Endemism Hotspots Are Linked to Stable Climatic Refugia. Ann. Bot. 2017, 119, 207–214. [Google Scholar] [CrossRef] [Scilit] [PubMed]
  44. Médail, F.; Diadema, K. Glacial Refugia Influence Plant Diversity Patterns in the Mediterranean Basin. J. Biogeogr. 2009, 36, 1333–1345. [Google Scholar] [CrossRef] [Scilit]
Figure 2. Standard deviation metric (SD) of annual precipitation (bio12). Localities cells identified as stability islands (based on SD of bio12 for a window of 3 × 3 cells) are indicated by white squares.
Ecologies 07 00038 g002
Figure 3. Protected areas (in green); the endemic locality cells identified as stability islands (based on SD of bio12 for a window of 3 × 3 cells): within protected areas—white dots; outside of protected areas borders—red dots.
Ecologies 07 00038 g003
Table 1. Mean proportion of endemic localities in stability islands and mean isolation score of the stability islands (mean_z) by variable and metric. Values are averaged over window sizes k = 3, 5, 9 for each combination of variable and metric.
VariableMetricMean Prop. (%)Islands_Mean_z
bio01DETSD20−1.02
bio04DETSD2−0.88
bio12DETSD10−0.95
bio15DETSD10−1.04
bio01RANGE54−0.62
bio04RANGE14−1.12
bio12RANGE10−0.97
bio15RANGE27−1.01
bio01SD20−1.04
bio04SD2−0.89
bio12SD10−0.96
bio15SD9−1.07
Table 2. Elevation-matched null-model test of stability-island enrichment across variables and window sizes (k). Empirical one-sided p-values were estimated as p = (r + 1)/(n + 1), where r is the number of null replicates with prop_islands ≥ Observed (obs.); “null 2.5%” and “null 97.5%” represent, respectively, the 2.5% and 97.5% quantiles of the null distribution, which define a 95% null reference interval for the percentage of elevation-matched random points expected to fall in stability islands. Observed percentages above this interval indicate unusually strong enrichment relative to null expectations, whereas values below indicate depletion. q_BH—the Benjamini–Hochberg false-discovery-rate-adjusted p-value.
Var.kobs. %Null MeanNull SDNull 2.5%Null 97.5%p (≥ obs.)q_BH (≥obs.)p (≤obs.)q_BH (≤obs.)
bio01319.222.21.718.925.80.9530.9620.0480.048
bio01519.222.41.719.225.80.9620.9620.0390.048
bio01922.425.31.722.128.70.9540.9620.0470.048
bio0433.52.80.71.54.20.1320.1320.8690.957
bio0452.31.40.50.52.40.0440.0930.9570.957
bio0491.60.90.40.21.70.0620.0930.9390.957
bio12310.47.71.15.79.90.0120.0180.9890.990
bio1259.77.31.05.49.30.0110.0180.9900.990
bio12910.78.51.16.410.90.0270.0270.9740.990
bio1538.59.61.27.312.10.8000.8000.2010.603
bio1558.38.41.26.110.70.4900.7350.5110.693
bio15910.710.31.28.012.80.3080.7350.6930.693
Disclaimer/Publisher’s Note: The statements, opinions and data contained in all publications are solely those of the individual author(s) and contributor(s) and not of MDPI and/or the editor(s). MDPI and/or the editor(s) disclaim responsibility for any injury to people or property resulting from any ideas, methods, instructions or products referred to in the content.