
Article

Environmental Drivers of Zooplankton Communities in the Tropical Low-Latitude Northwestern Pacific Ocean

Third Institute of Oceanography, Ministry of Natural Resources, Xiamen 361005, China
*
Authors to whom correspondence should be addressed.
Ecologies 2026, 7(2), 36; https://doi.org/10.3390/ecologies7020036
Submission received: 18 March 2026 / Revised: 14 April 2026 / Accepted: 15 April 2026 / Published: 16 April 2026
(This article belongs to the Special Issue Advances in Community Ecology: Interactions, Dynamics, and Diversity)

Abstract

This study investigates the spatiotemporal dynamics of zooplankton communities in the tropical low-latitude Northwestern Pacific Ocean based on field surveys conducted in August 2021 and November 2022. Redundancy analysis identified nitrate, silicate, temperature, and salinity as the primary factors influencing community structure. The distribution of dominant zooplankton groups exhibited close correlations with key environmental gradients, showing distinct habitat preferences corresponding to different hydrographic conditions. Zooplankton abundance in August 2021 was significantly higher than that in November 2022, which is presumably attributed to eddy-induced nutrient upwelling and enhanced primary productivity. Comparisons with adjacent marine regions reveal general consistency in overall zooplankton abundance and community species composition, while the observed seasonal discrepancies are closely associated with local unique hydrographic characteristics. These results highlight the role of nutrient–temperature–salinity interactions in structuring zooplankton communities and underscore their sensitivity to environmental variability. The findings provide a scientific basis for understanding pelagic ecosystem dynamics in oligotrophic waters and for developing management strategies under changing climate and oceanographic conditions.

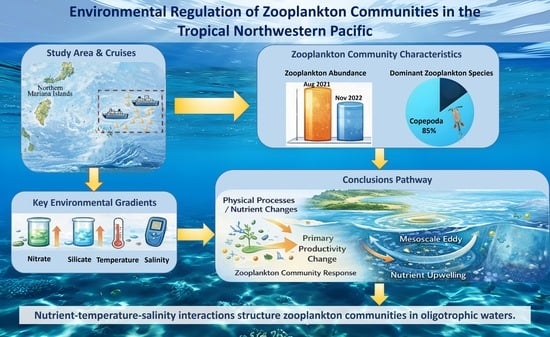
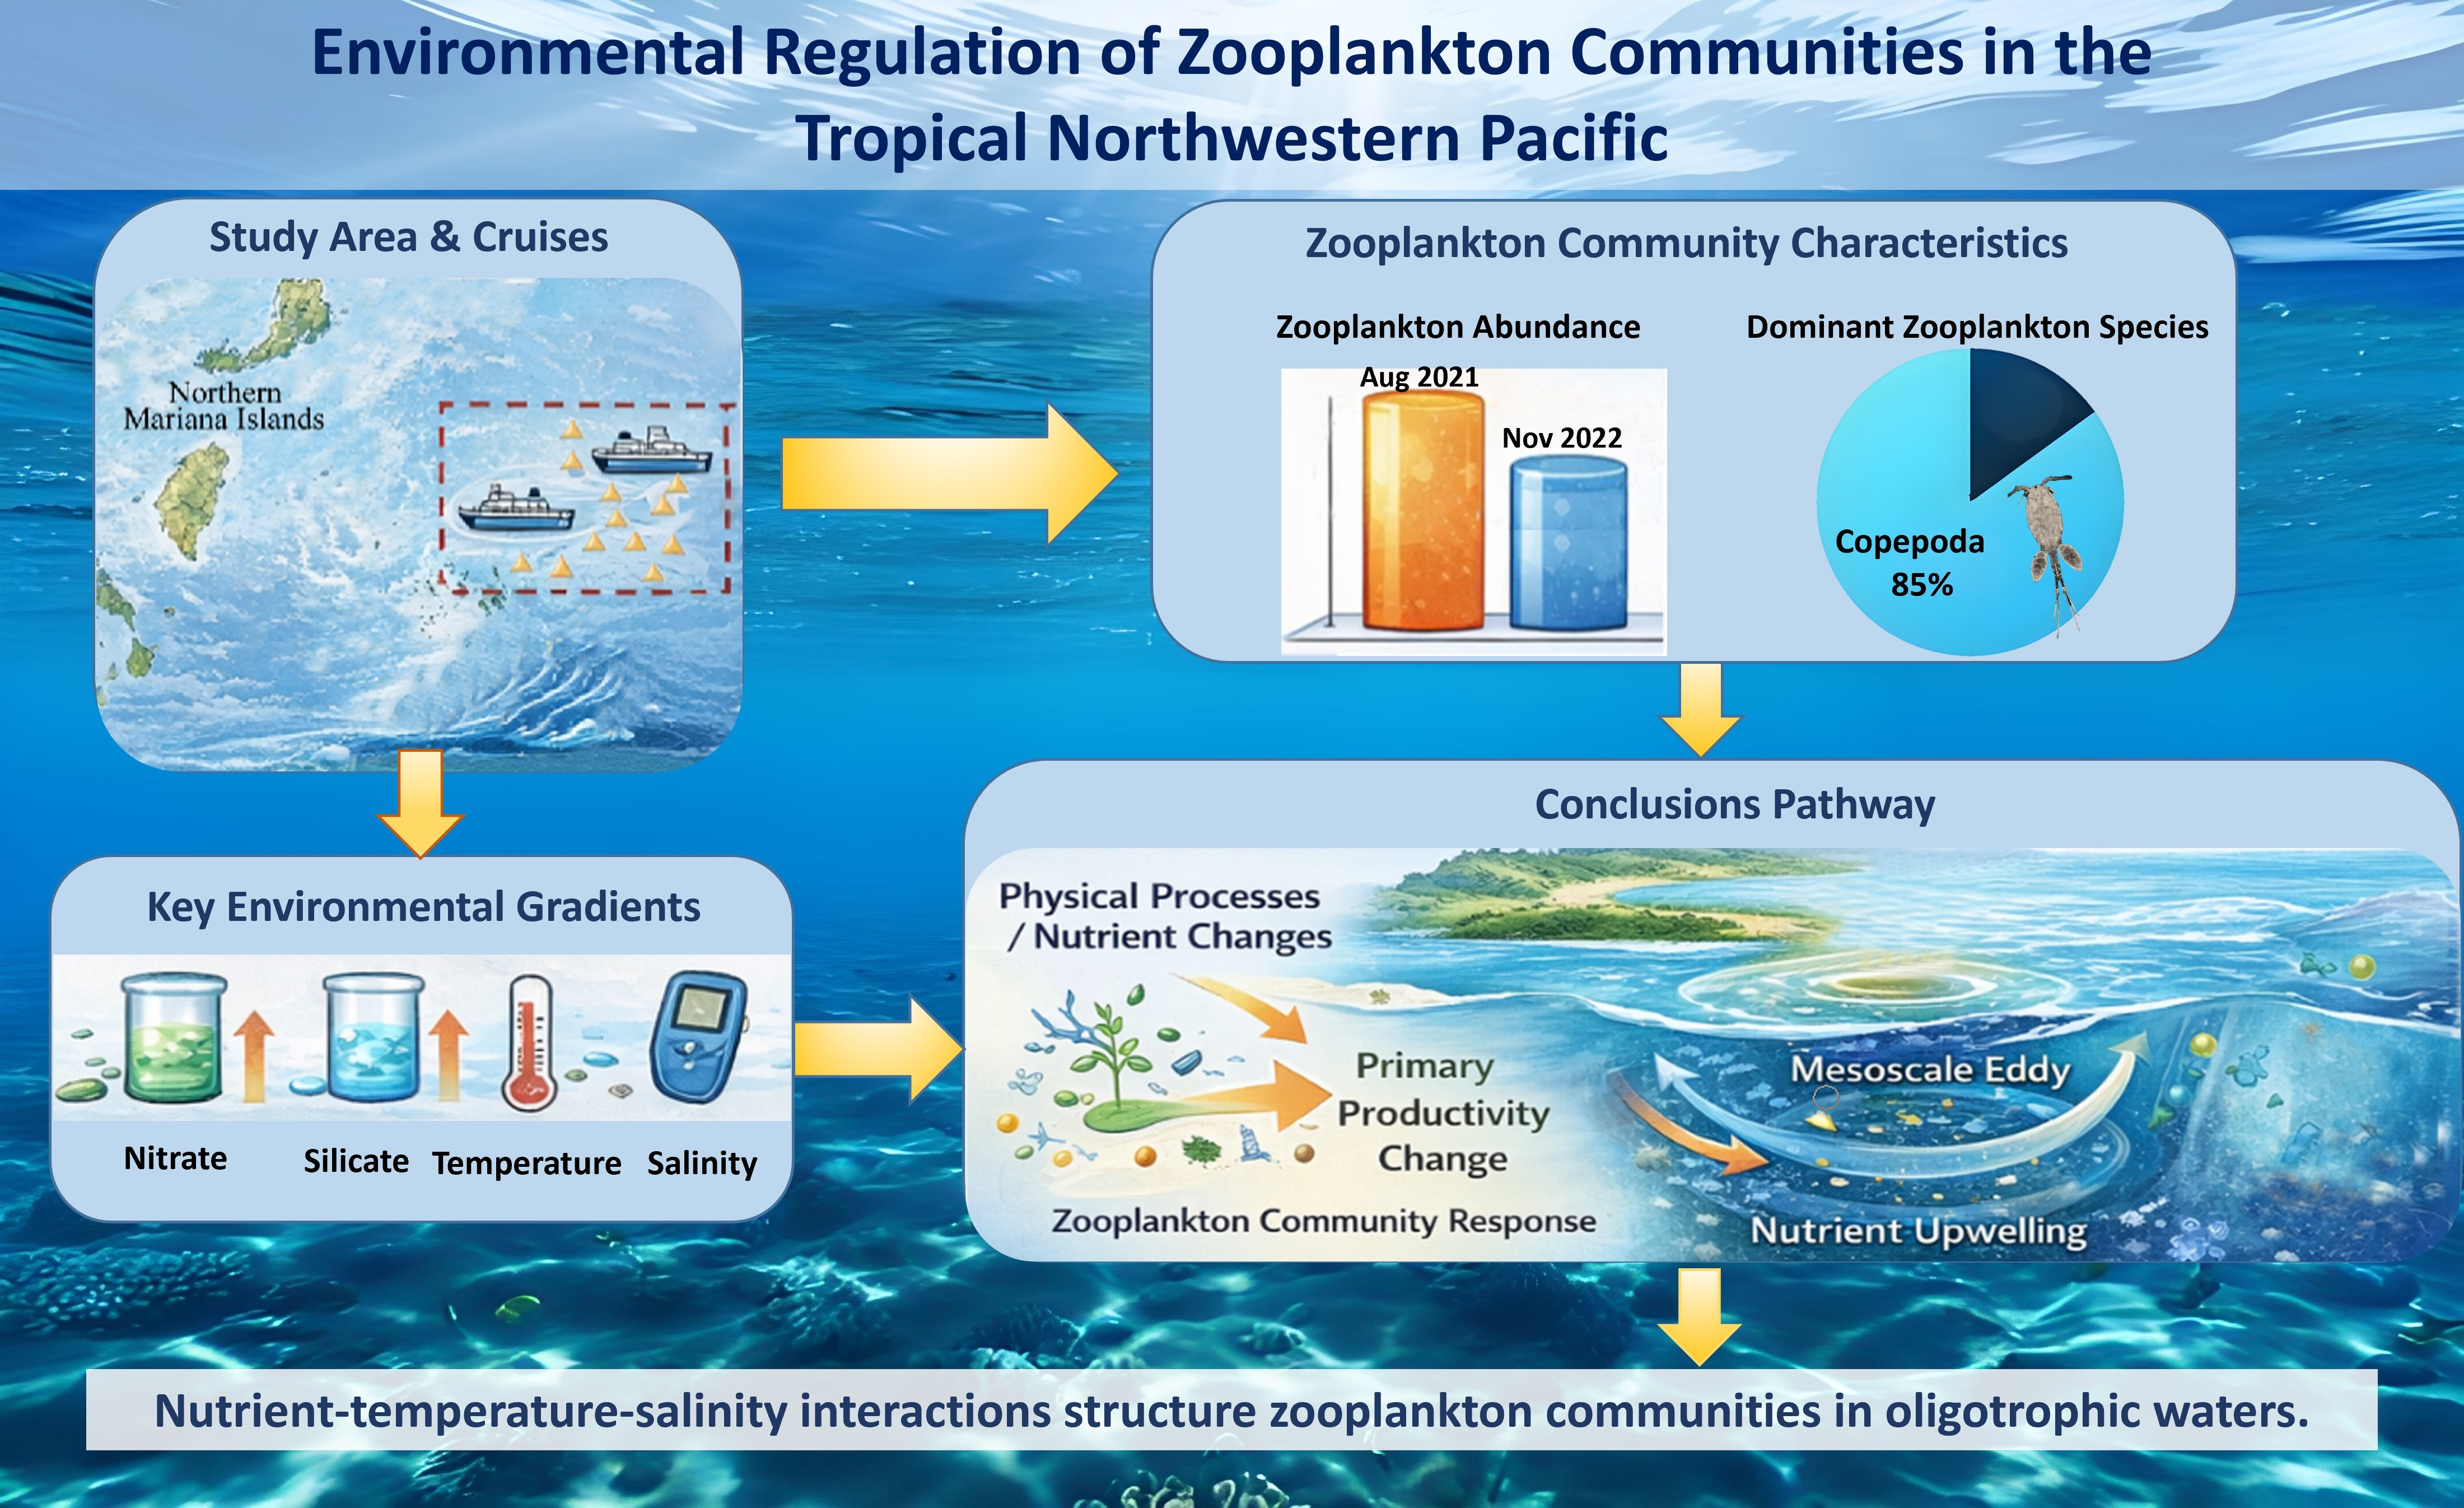
Graphical Abstract

1. Introduction

The Northwestern Pacific Ocean is globally recognized as one of the most complex and biologically diverse marine regions, characterized by the intersection of numerous ocean basins, island chains, and complex deep-sea geomorphological features [1]. Situated at the junction of the westerly drift and equatorial countercurrent, this region is influenced by dynamic hydrodynamic conditions and strong mesoscale and submesoscale processes [2]. The area serves not only as a critical reservoir of zooplankton biomass and spawning ground for economically significant fish species [3], but also as a climate-sensitive zone, playing a pivotal role in global ocean-atmosphere interactions [4]. The combined effects of hydrographic complexity and biodiversity have shaped a highly heterogeneous marine environment, making the Northwestern Pacific a natural laboratory for addressing a wide array of fundamental questions in ocean ecology and biogeochemistry.
Zooplankton, occupying intermediate trophic levels in marine food webs, serve as essential conduits for transferring energy from primary producers to higher consumers, such as fish and marine mammals [5]. Their community structure and distribution patterns are susceptible to environmental variability and therefore serve as indicators of oceanic ecosystem health [6,7]. As primary grazers of phytoplankton and prey for secondary consumers, zooplankton not only regulate biological production but also influence carbon export and nutrient cycling in the upper ocean [8]. Variations in zooplankton abundance and composition can thus directly reflect spatiotemporal changes in environmental conditions, such as temperature, salinity, nutrient availability, and oxygen concentration [9,10].
Environmental gradients, particularly in oligotrophic open-ocean systems, play a fundamental role in shaping zooplankton community dynamics [11]. In such nutrient-poor environments, physical mechanisms such as mesoscale eddies, upwelling, and vertical mixing are critical for transporting deep, nutrient-rich waters into the euphotic zone, thereby stimulating primary production and supporting secondary productivity [12,13]. For example, in the tropical Eastern Pacific, studies have shown that coastal upwelling and equatorial divergence zones drive seasonal peaks in both phytoplankton and zooplankton biomass [14]. Similarly, in the Kuroshio-Oyashio transition zone of the Northwestern Pacific, strong thermal and salinity fronts, coupled with nutrient inputs, have been associated with high biological productivity and zooplankton abundance [15].
However, while much of the existing research has focused on mid- to high-latitude waters [16]—particularly subarctic and temperate zones [17,18]—there remains a paucity of systematic studies on zooplankton ecology in tropical seamount and deep-ocean regions of the Northwestern Pacific. These low-latitude regions are increasingly recognized for their ecological importance, as they often harbor unique planktonic assemblages and are subject to different physical and biogeochemical constraints than continental shelf waters [19]. Moreover, the role of underwater topographic features such as seamounts in modifying current flow, nutrient upwelling, and biological aggregation remains underexplored, particularly in the context of their influence on pelagic zooplankton communities [20,21]. Given that seamount-induced processes can enhance local productivity and biodiversity, understanding how zooplankton respond to such physical-biogeochemical coupling is critical for filling major knowledge gaps in oceanic ecology.
In addition to physical drivers, biological and ecological factors such as species-specific life history traits, reproductive timing, and trophic interactions also influence zooplankton distribution [22,23]. For instance, copepods and euphausiids often exhibit distinct seasonal reproductive strategies and vertical migration behaviors that are tightly linked to water temperature, food availability, and predation pressure [24,25]. These complex life cycle dynamics further highlight the need for region-specific investigations that integrate physical, chemical, and biological data to uncover the mechanisms underpinning zooplankton community variability.
To address these gaps, this study analyzes data collected during oceanographic cruises in the tropical Northwestern Pacific (18.5–19.5° N, 152.5–154° E) in August 2021 and November 2022. Our objectives are to (1) document the species composition and temporal variation between August and November in zooplankton communities; (2) assess the spatial distribution patterns of environmental parameters, including temperature, salinity, nutrients, and dissolved oxygen; and (3) identify key environmental drivers and dominant species that characterize ecological responses to oceanographic gradients. By integrating taxonomic and environmental analyses, this work aims to elucidate the physical and ecological mechanisms regulating zooplankton in oligotrophic waters.
The findings contribute not only to a better understanding of pelagic biodiversity and biogeographic patterns in the Northwestern Pacific but also provide a scientific basis for evaluating ecosystem function and resilience under changing climatic and oceanographic conditions. Moreover, the results offer valuable insights for regional biodiversity assessments, resource management, and conservation planning in deep-sea and open-ocean habitats.

2. Materials and Methods

2.1. Study Area and Sample Collection

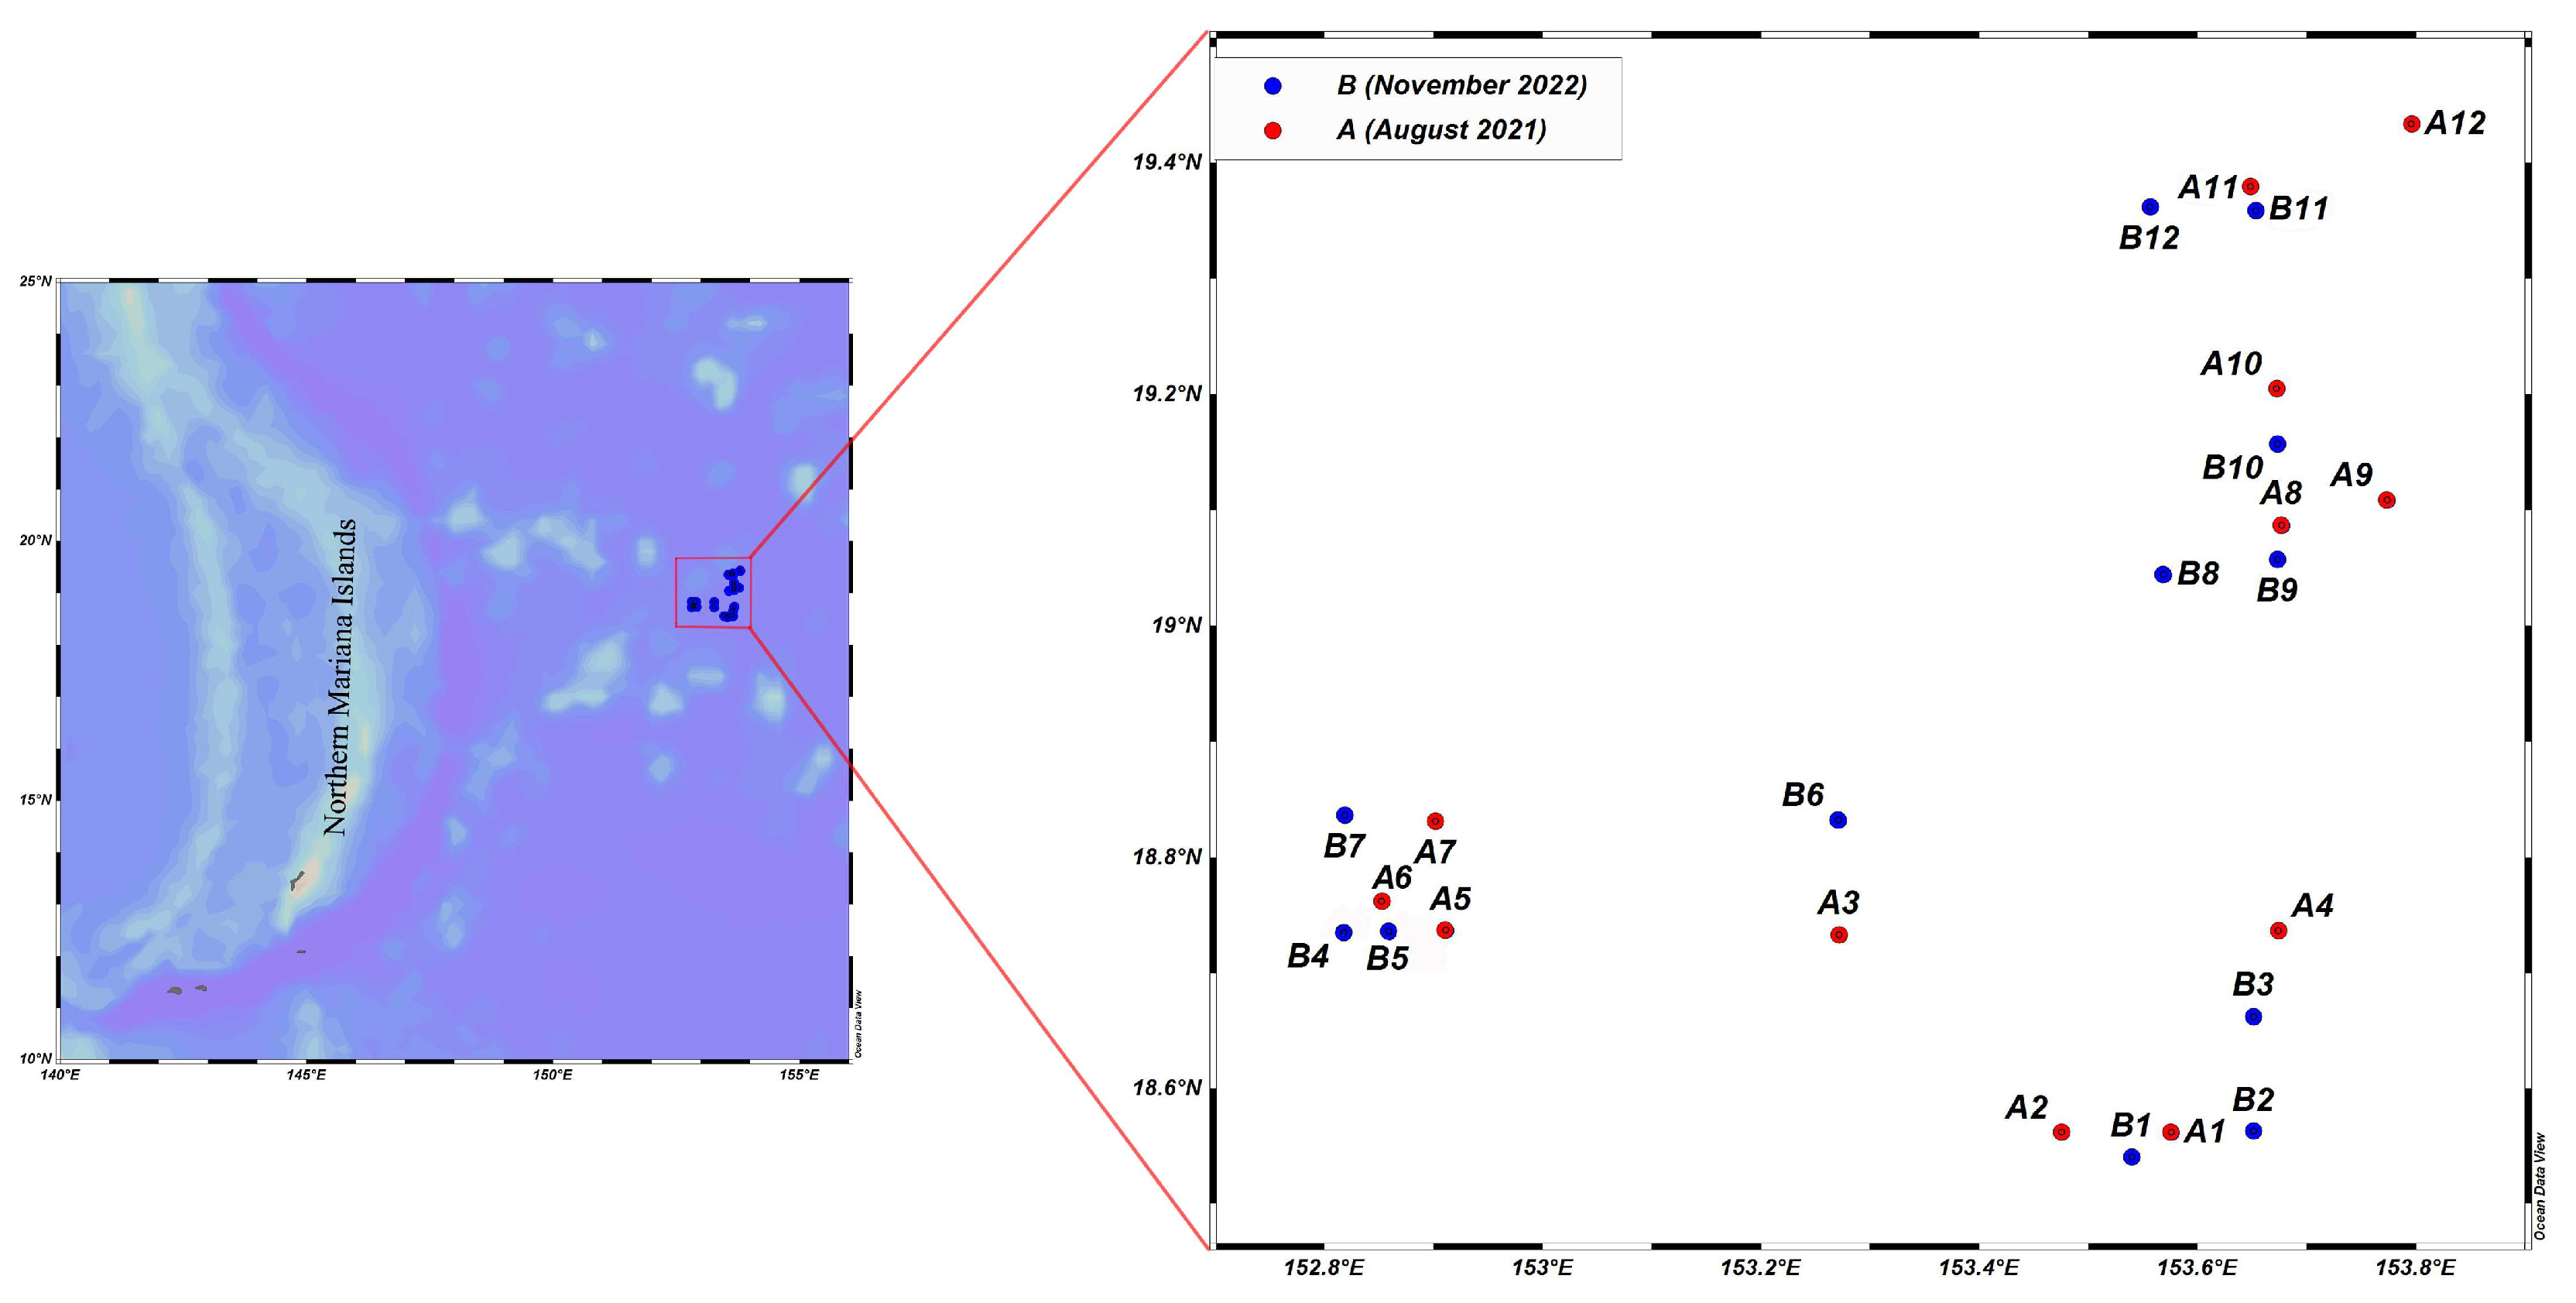
The study area (18.5–19.5° N, 152.5–154° E) is situated in the tropical northwestern Pacific, adjacent to the northern Mariana Islands. Characterized by typical seamount and deep-ocean geomorphology, the region has a water depth mostly exceeding 3000 m and falls within the North Pacific Subtropical Gyre (NPSG), a classic oligotrophic open-ocean environment with low nutrient availability [26,27]. Zooplankton samples were collected during two oceanographic surveys conducted in August 2021 and November 2022. In each survey, 12 sampling stations were established: stations A1–A12 during the August 2021 cruise, and stations B1–B12 during the November 2022 cruise (Figure 1).
Sampling was performed using WP2 zooplankton net with a total length of 2.71 m, an internal mouth diameter of 57 cm, and a mesh size of approximately 198 μm. Vertical hauls were conducted from a depth of 200 m to the surface, one vertical haul per station. Collected zooplankton samples were immediately fixed onboard in a neutral buffered formalin solution at a final concentration of 5% (v/v). The preserved samples were then transported to the laboratory for subsequent taxonomic identification and analysis.
This study adopted vertical trawling sampling from 0 to 200 m, mainly based on the following research objectives and regional characteristics: the study focuses on the overall characteristics of zooplankton communities from the entire euphotic zone to the subsurface layer. The area above 200 m in this region is the main distribution layer of zooplankton, and vertical trawling can comprehensively capture the composition of zooplankton communities within this depth range. Meanwhile, the diel vertical migration amplitude of zooplankton in this region is small, and the community data integrated by vertical trawling can represent the average community characteristics within this depth range.

2.2. Sample Analysis Methods

Subsamples of zooplankton samples were collected using a Folsom sampler; anatomical analysis of the samples was conducted in the laboratory using a stereomicroscope (Leica M205 A, Leica Microsystems, Wetzlar, Germany). Reference books for the identification of zooplankton samples include “Marine Plankton Biology” [28], “ Species diversity of marine planktonic copepods in China’s seas” [29], “The superclass Hydrozoa of the Phylum Cnidaria in China” [30], and “ Pelagic Ostracoda in China Seas” [31]. Abundance (individuals per cubic meter, ind/m3) was calculated based on the filtered water volume.
Zooplankton abundance was defined as the number of individuals per cubic meter of seawater (ind/m3).
Dominant species were determined based on the dominance index (Y), species with Y ≥ 0.02 were considered dominant [32].
The diversity index of zooplankton utilizes species diversity (Shannon-Wiener index, H′) and species evenness (Pielou’s evenness, J′).

2.3. Environmental Parameters

The measurements and acquisition of environmental parameters such as temperature and salinity at the survey station were all completed on-site using a CTD (SBE-911 plus, SEA-BIRD ELECTRONICS INC., Bellevue, WA, USA). The pH was measured on-site using a pH meter after water sampling by the CTD, and dissolved oxygen (DO) was immediately measured using the Winkler titration method after the CTD reached the deck. Additionally, nutrient salt parameters were measured using flow analysis. Environmental parameters (temperature, salinity, nutrients, dissolved oxygen) were measured at 5 m, 30 m, 50 m, 100 m, 150 m and 200 m, and their average values were calculated. And the depth-averaged environmental values were used in the environmental comparisons, Pearson correlation analyses and RDA.

2.4. Statistical Analyses

Pearson correlation analysis between zooplankton abundance and environmental variables was performed using SPSS 19.0. Bonferroni correction was used for multiple test correction for Pearson correlation analysis between multiple groups of dominant species and environmental factors. The corrected significance level α = 0.05/n (n is the number of correlation analysis groups), ensuring the robustness of statistical results and avoiding false positive results.
Redundancy analysis (RDA) was conducted using Canoco 5 to assess the relationships between zooplankton community composition and environmental factors.
Ocean Data View (ODV 5.5.2) software was used to plot the spatial distribution of zooplankton abundance and diversity indices.
Data normality was tested using Shapiro–Wilk test prior to parametric statistical analysis.

3. Results

3.1. Zooplankton Species Composition

A total of 288 zooplankton species (excluding unidentified taxa and larval stages) were identified across the two cruises, belonging to 13 taxonomic groups from 6 phyla. In the August 2021 cruise, 230 species from 11 major groups were identified. Copepods were the most diverse, with 85 species (36.96%), followed by siphonophores (26 species, 11.30%).
During the November 2022 cruise, 246 species were identified, with copepods again dominating the assemblage (106 species, 43.09%) and siphonophores ranking second (25 species, 10.16%). Additionally, 16 euphausiid species were recorded in the November 2022 survey (Table 1).

3.2. Zooplankton Abundance and Distribution

In terms of community composition, copepods were the overwhelmingly dominant taxonomic group during both surveys. In the August 2021 cruise, copepods accounted for 88.77% of the total zooplankton abundance, with an average abundance of 64.59 ind/m3. The second most abundant group was chaetognaths, comprising 4.57% of the total, with an average abundance of 3.33 ind/m3. Similarly, in the November 2022 cruise, copepods dominated the assemblage with a proportion of 90.72% and an average abundance of 52.50 ind/m3, followed by tunicates, which accounted for 4.31% with an average abundance of 2.49 ind/m3. Copepods were thus the dominant group in both seasons.
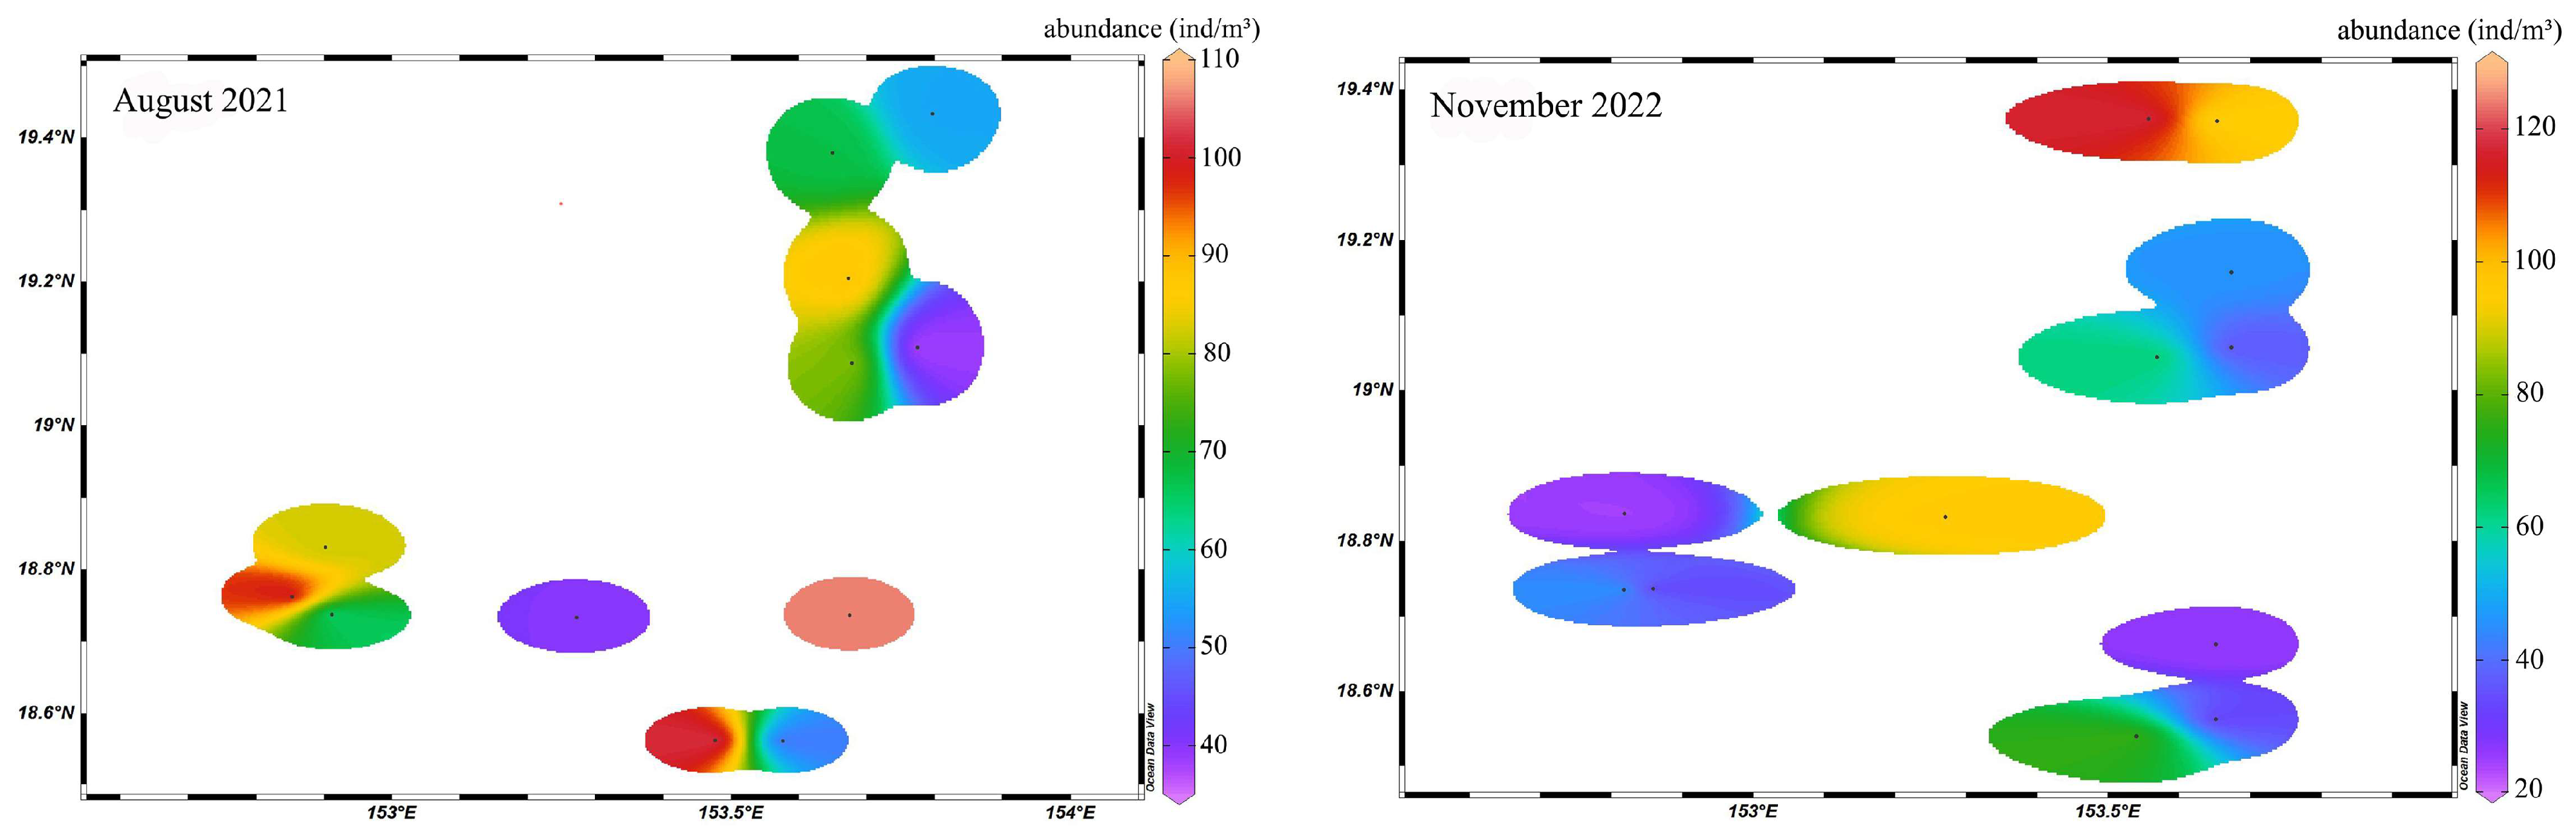
Regarding horizontal distribution, the mean zooplankton abundance during the August 2021 cruise was 72.76 ind/m3. The highest abundance was recorded at station A4, reaching 106.40 ind/m3, while the lowest was observed at station A9, with only 36.81 ind/m3. The highest concentrations of zooplankton were mainly distributed in the southern and western parts of the study area during August 2021, although no clear spatial gradient was observed.
In contrast, the mean zooplankton abundance during the November 2022 cruise was lower, at 57.88 ind/m3. The highest abundance was found at station B12 (120.08 ind/m3), and the lowest at station B7 (24.94 ind/m3). High zooplankton abundance in November 2022 was concentrated in the northern and central parts of the study area (Figure 2).

3.3. Dominant Zooplankton Species

A total of 13 dominant zooplankton species were identified across both cruises, with copepods overwhelmingly dominating the community. Eight dominant species were recorded in the August 2021 cruise, and ten in the November 2022 cruise. Five species were shared between the two seasons: Oithona setigera, Oncaea media, Lucicutia flavicornis, Oithona tenuis, and Oncaea venusta.
Among them, Oithona setigera exhibited the highest dominance in both cruises. In the August 2021 cruise, its mean abundance was 3.21 ind/m3, followed by Oncaea media at 2.45 ind/m3. In the November 2022 cruise, Oithona setigera also had the highest mean abundance at 3.05 ind/m3, followed by Oncaea venusta at 1.91 ind/m3 (Table 2).

3.4. Diversity Index

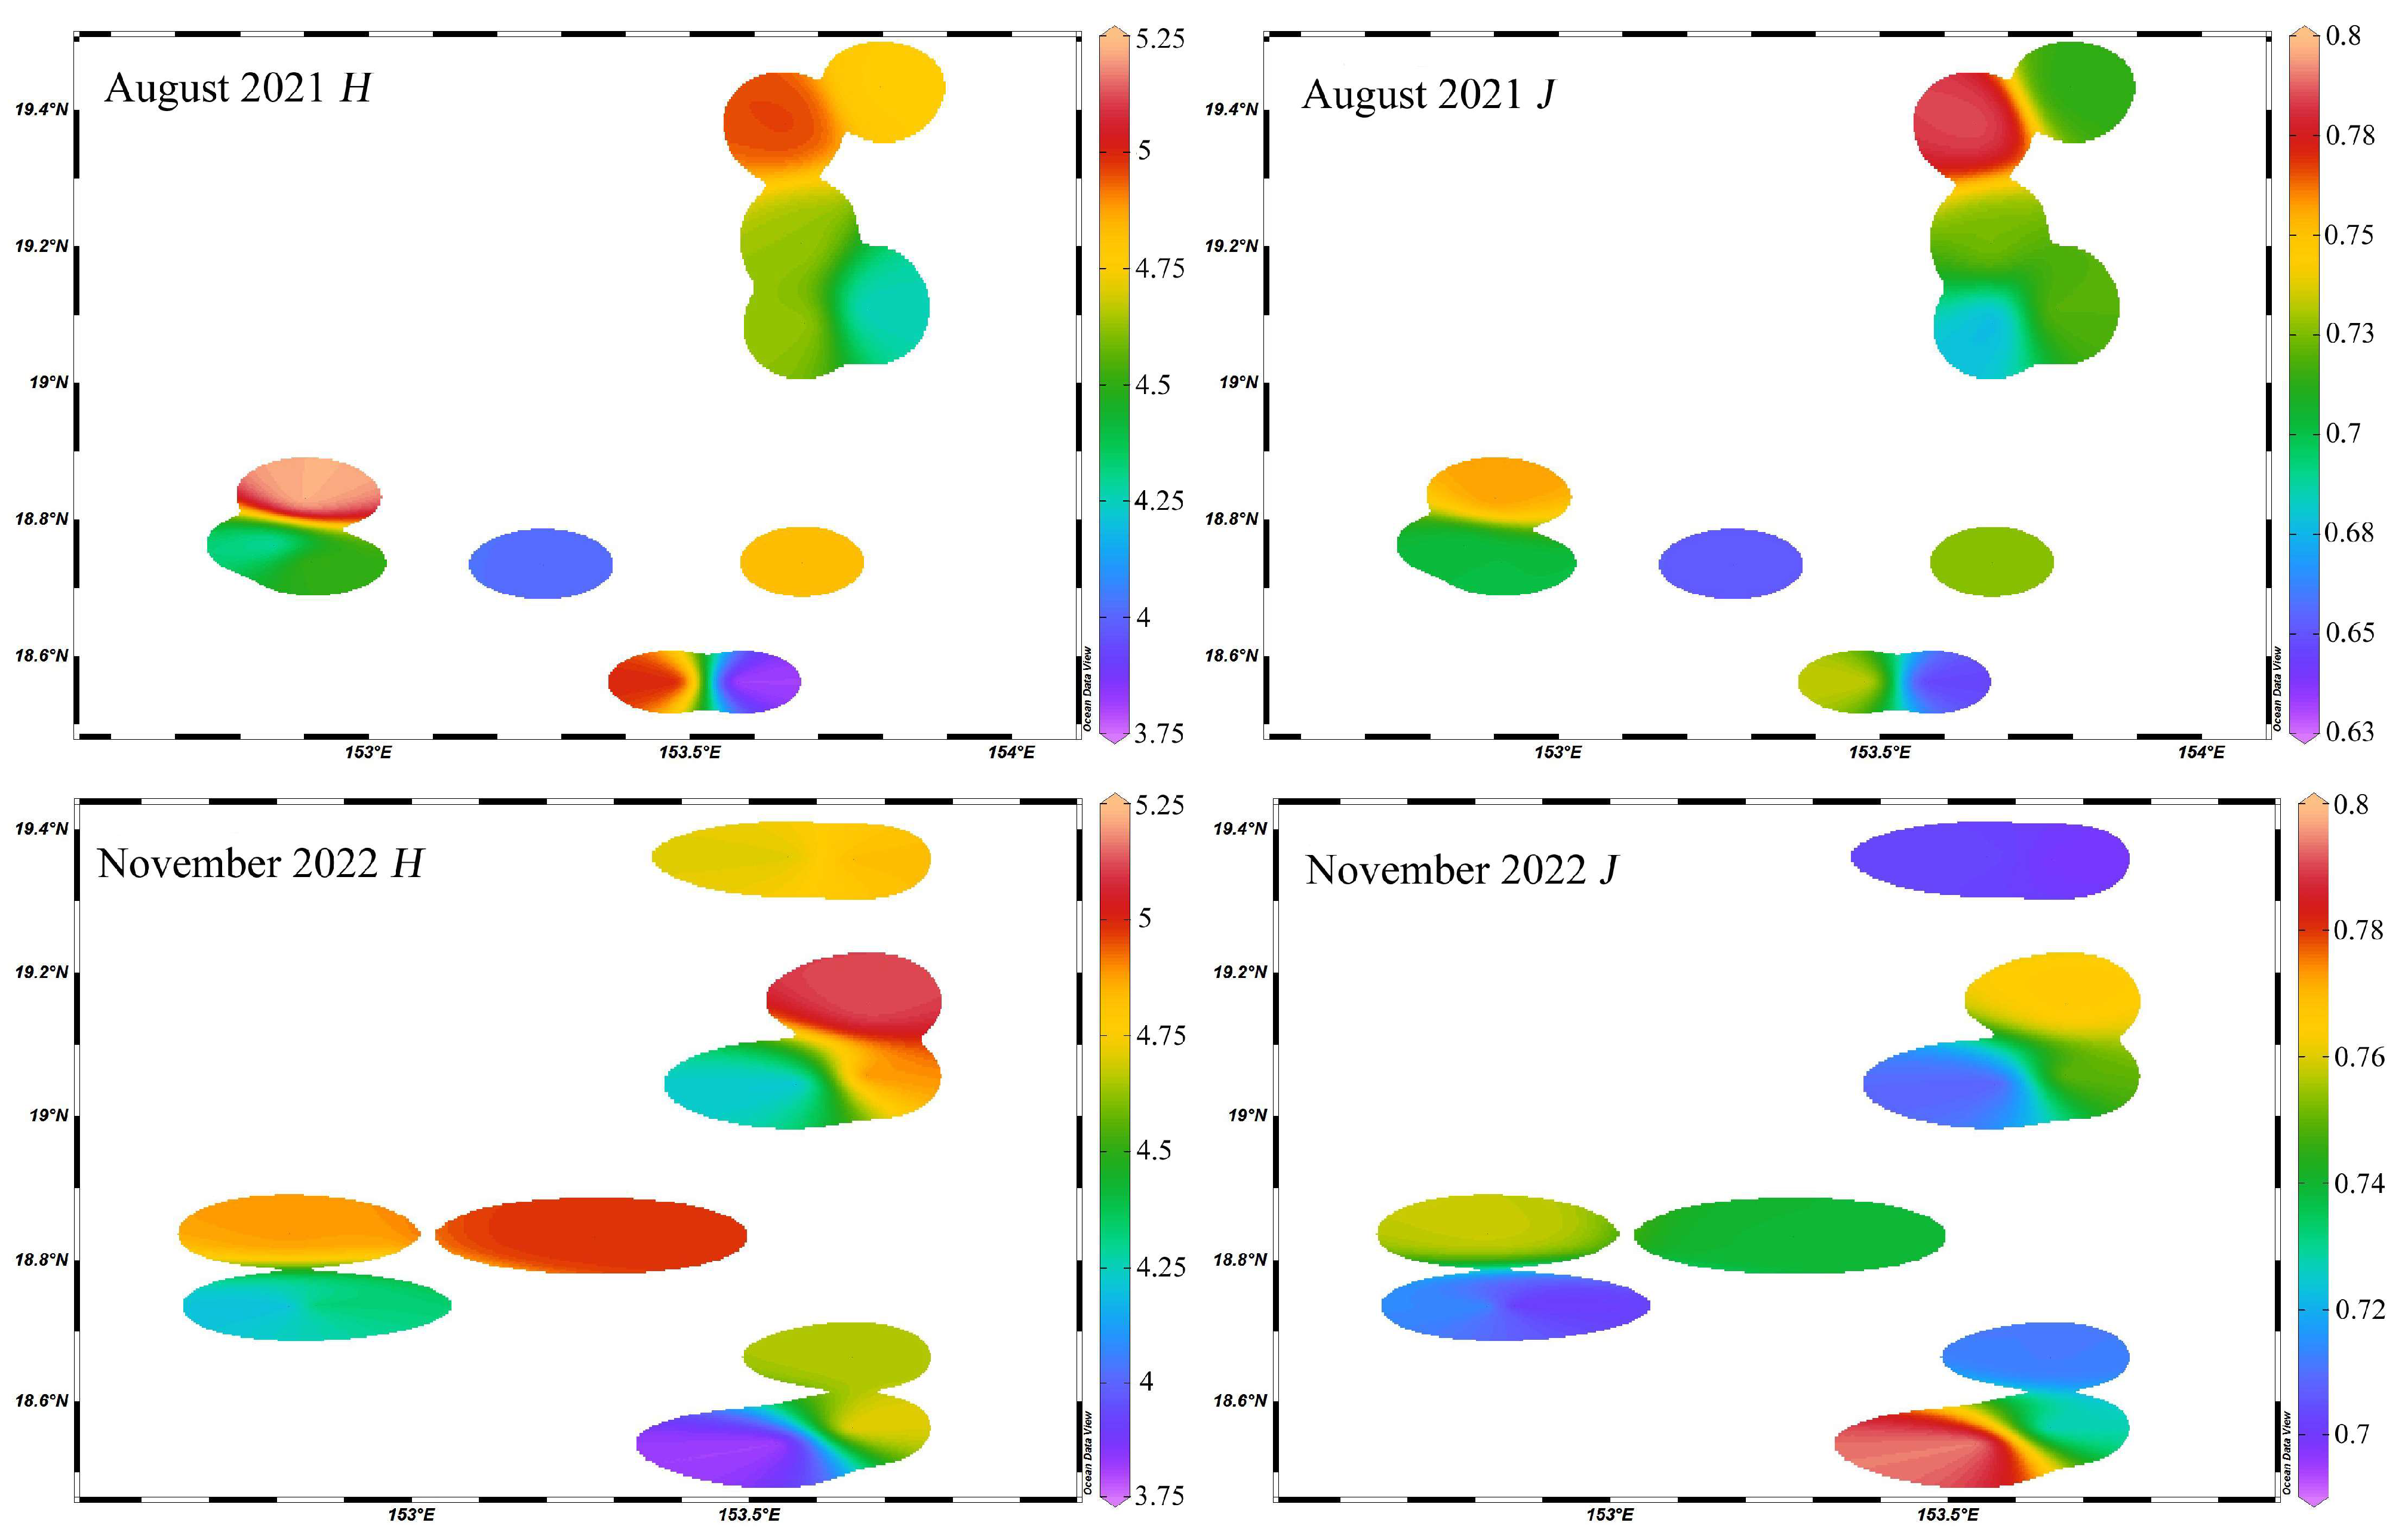
In the surveyed region, the Shannon–Wiener diversity index (H′) for zooplankton during the August 2021 cruise ranged from 3.77 to 5.24, with an average value of 4.58. The highest diversity was observed at Station A7 in the western part of the study area, while the lowest was recorded at Station A1 in the southeastern area. Pielou’s evenness index (J′) ranged from 0.64 to 0.79, with an average of 0.71. The highest evenness was observed at Station A11 in the northern region, and the lowest at Station A1 in the southeast. The spatial distribution patterns of the Shannon–Wiener index and the evenness index were generally consistent in August 2021, while high-value areas were concentrated in the northeastern part of the study area, and low-value areas appeared in the southeastern part (Figure 3).
During the November 2022 cruise, the Shannon–Wiener index ranged from 3.75 to 5.13, with an average of 4.61. The highest value was recorded at Station B10 in the northern region, and the lowest at Station B1 in the southeast. The evenness index ranged from 0.69 to 0.80, with an average of 0.73. Interestingly, Station B1 showed the highest evenness but the lowest diversity. This discrepancy was due to the relatively low species richness at this station; however, the few species present exhibited a fairly uniform distribution in abundance, resulting in a high evenness score but a low diversity index (Figure 3).

3.5. Environmental Data

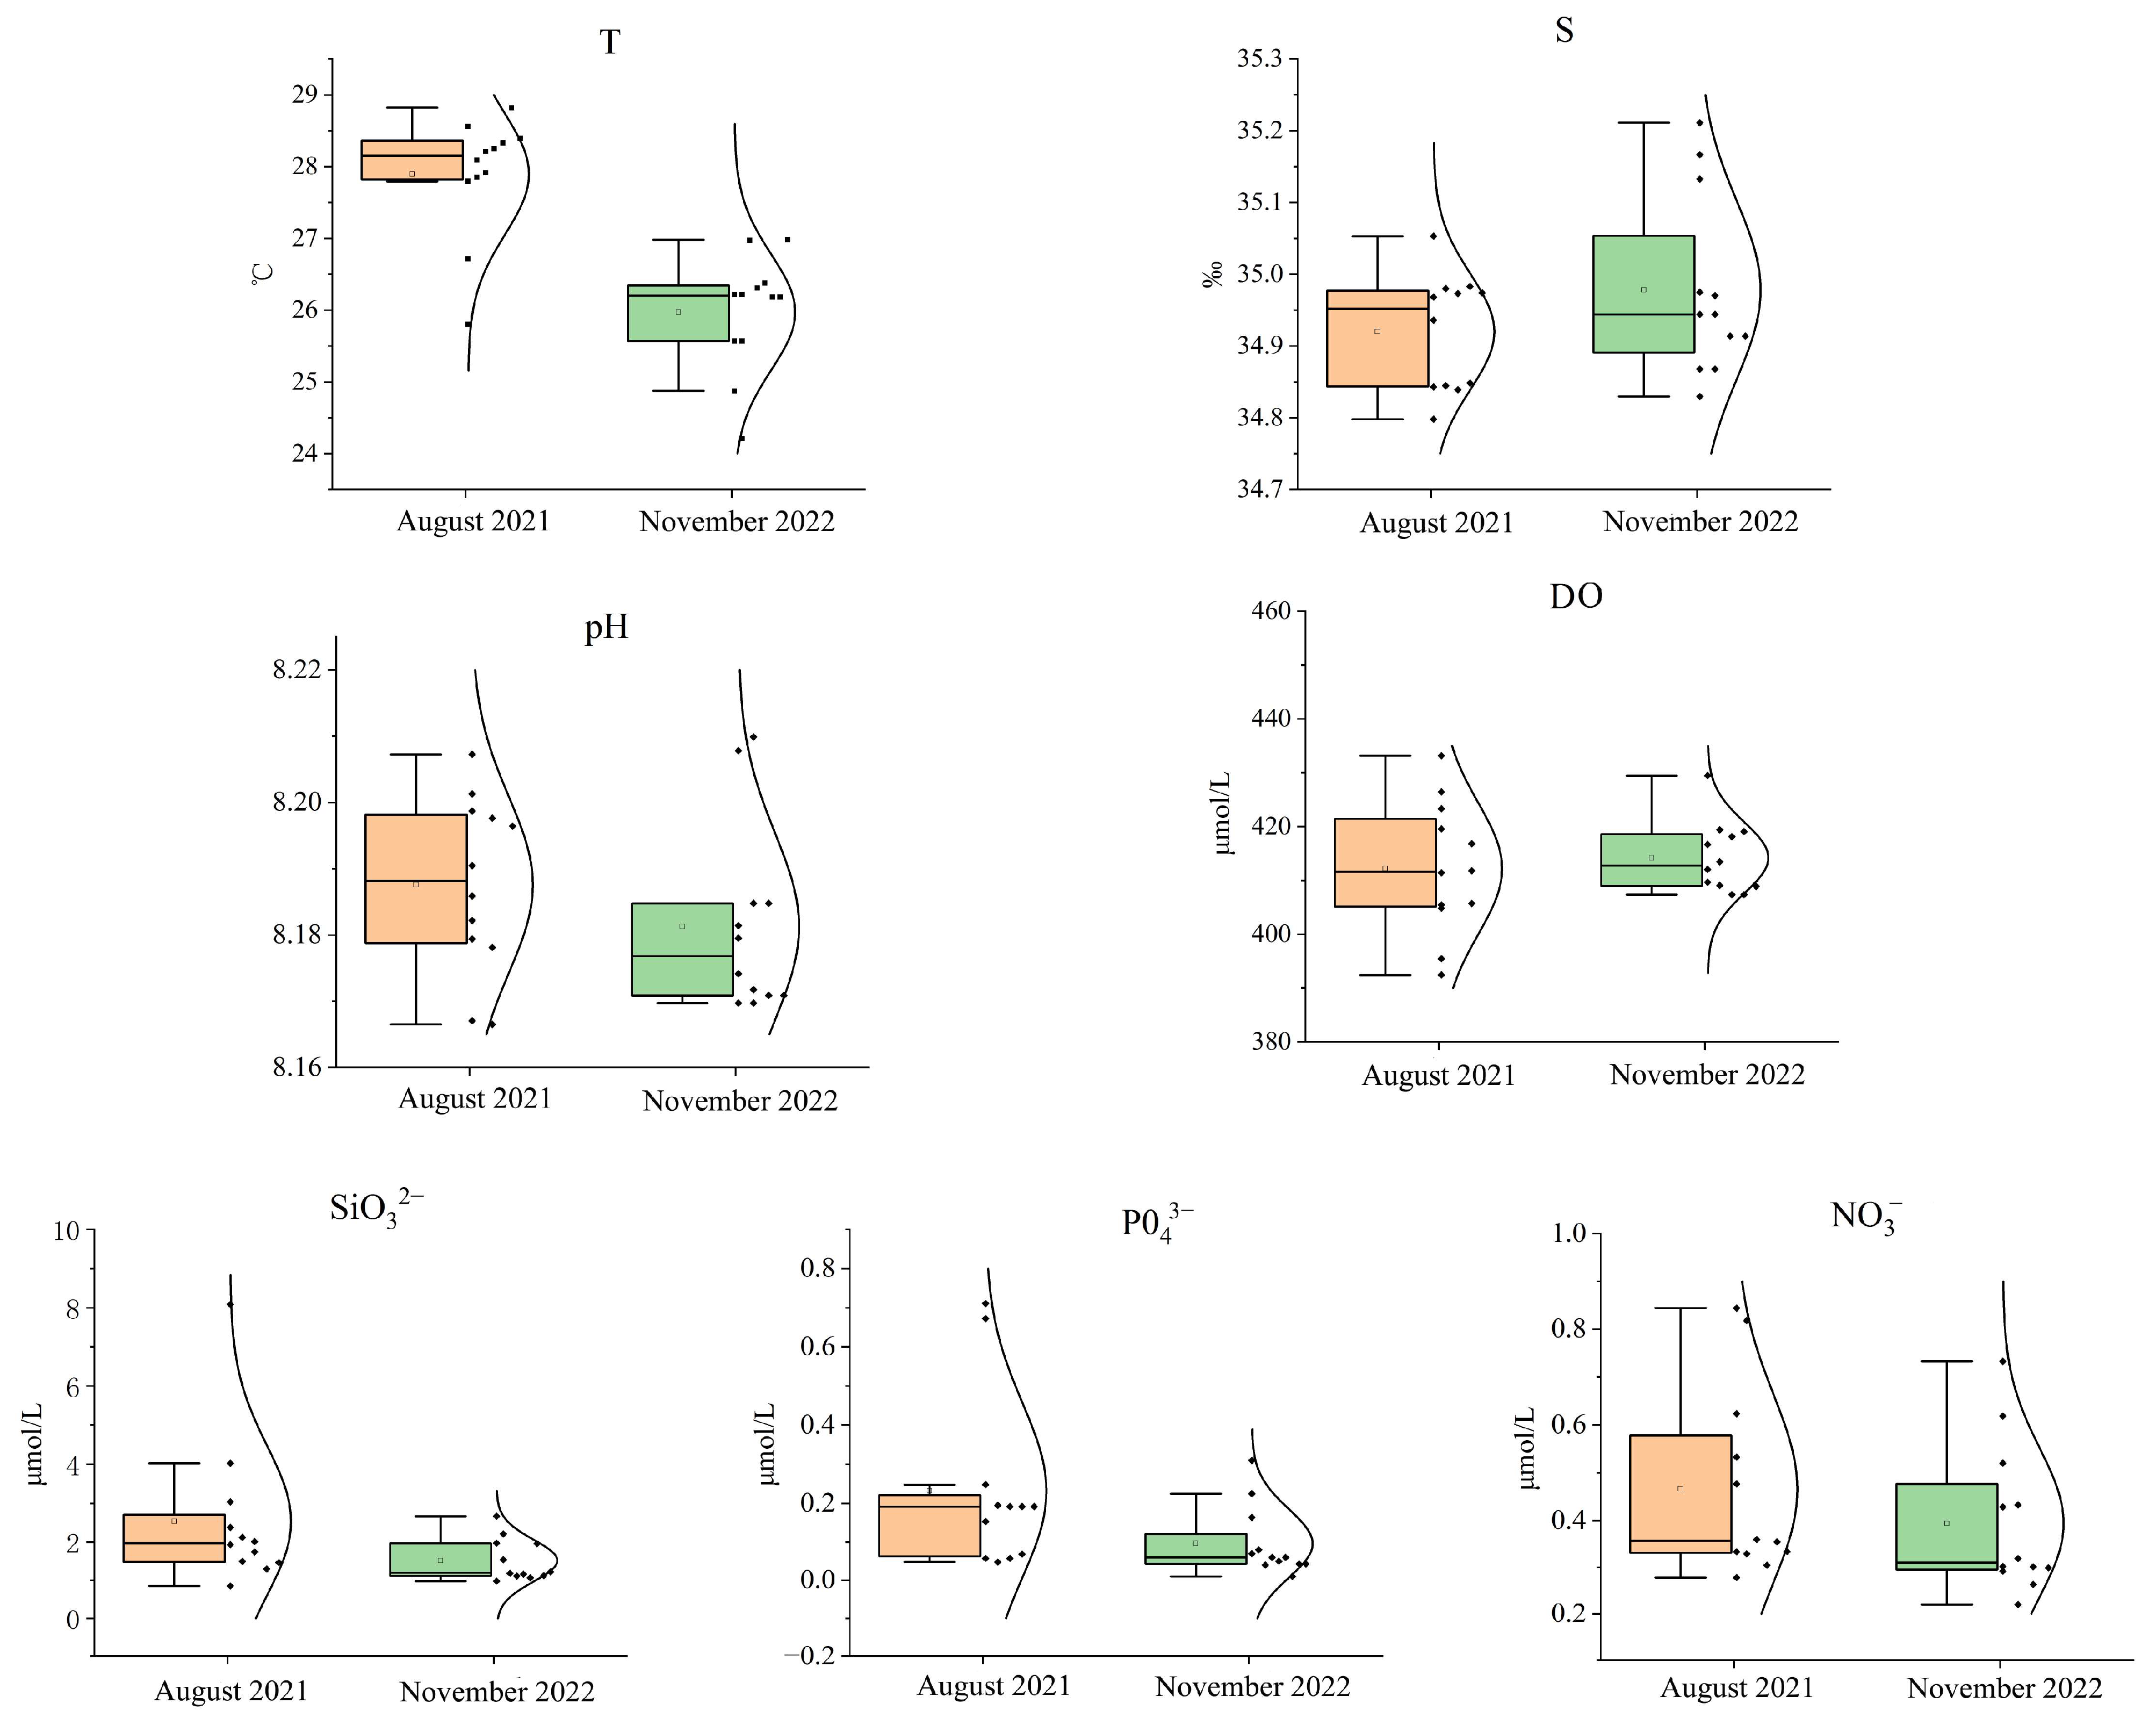
During the August 2021 cruise, the depth-averaged temperature across 0–200 m in the study area ranged from 25.80 °C to 28.82 °C, with an average of 27.89 °C. In contrast, the November 2022 cruise recorded a lower depth-averaged water temperature range of 24.21 °C to 26.98 °C, averaging 25.97 °C. As shown in the boxplot, the temperature distributions between the two cruise were completely separated with no overlap. Despite an average temperature difference of approximately 2 °C, there are significant variations between different months.
Other depth-averaged water parameters across 0–200 m, including salinity, pH, and dissolved oxygen (DO), showing only minor variations across different months. However, the mean depth-averaged concentrations of silicate, phosphate, and nitrate in August 2021 are 2.54, 0.23, and 0.47, respectively, while those in November 2022 are 1.52, 0.10, and 0.39, respectively. The mean values in August 2021 are all higher than those in November 2022 (Figure 4). This seasonal nutrient enrichment may be linked to enhanced vertical mixing or mesoscale eddy activity during August 2021, which can bring nutrient-rich deeper waters to the surface, thereby influencing the primary productivity and subsequent zooplankton dynamics in the region.

3.6. Correlation Analysis Between Zooplankton and Environmental Factors

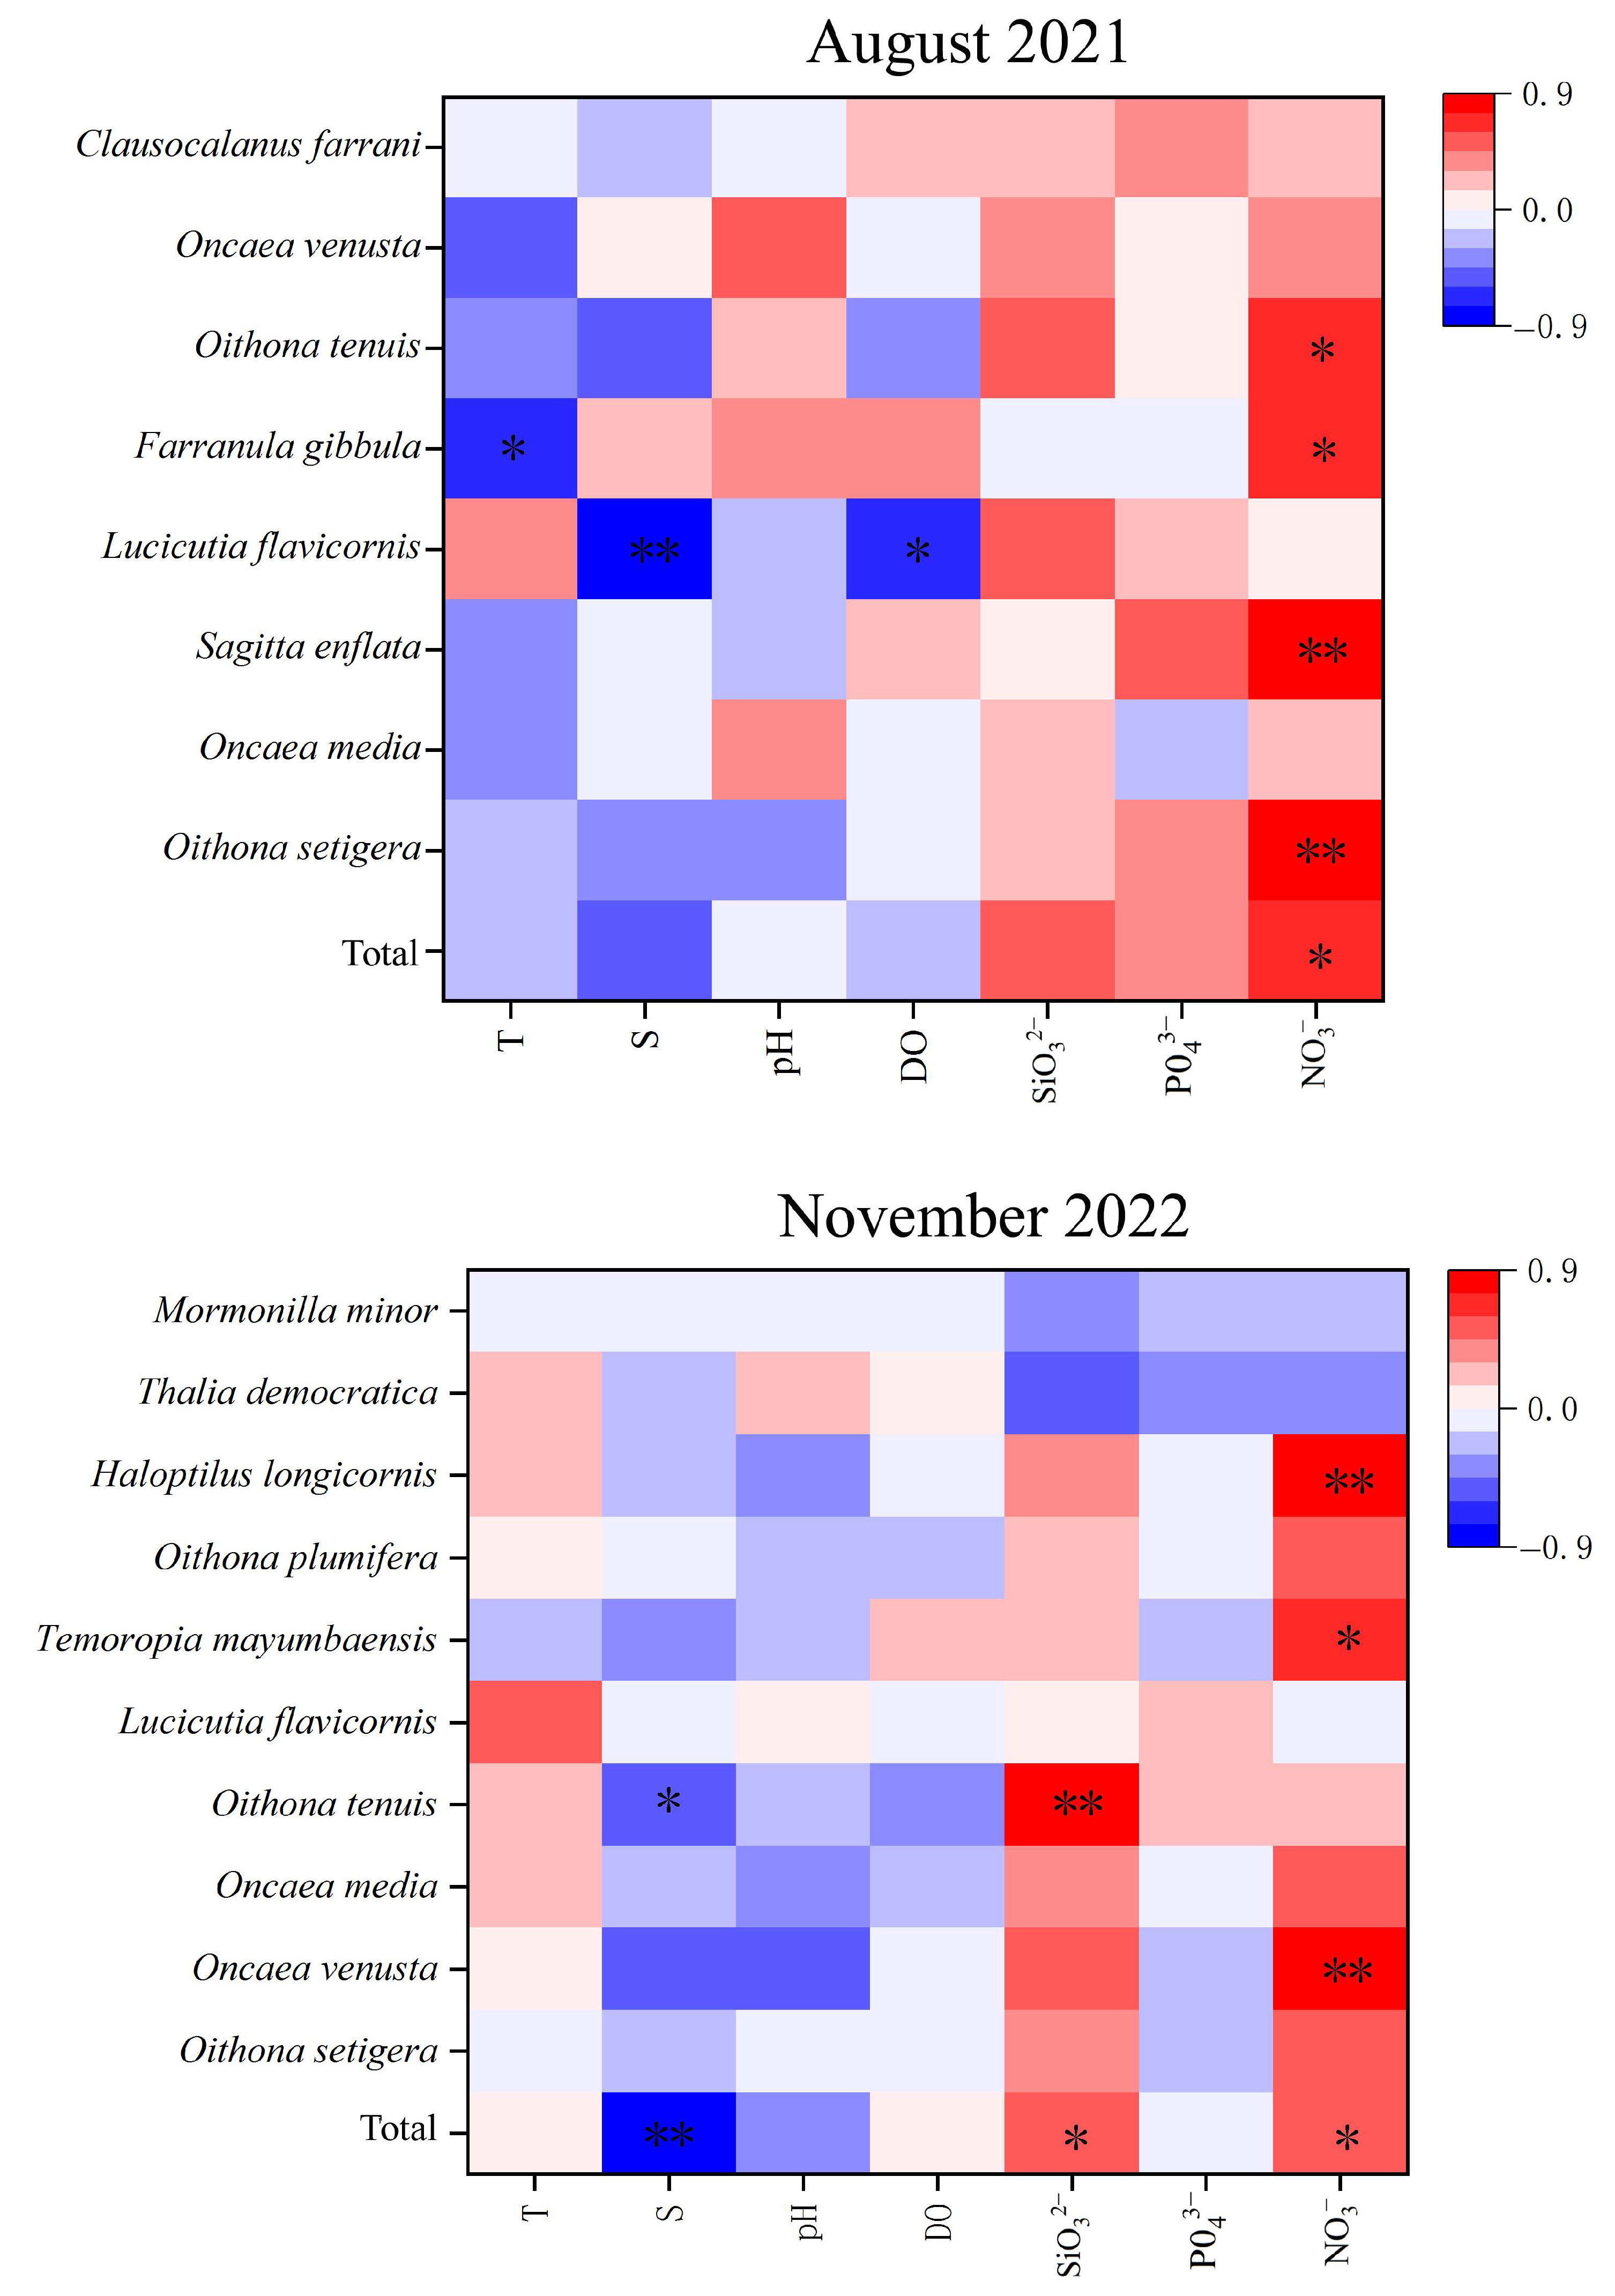
The results of correlation analysis between dominant zooplankton species and environmental factors for both August 2021 and November 2022 cruises are presented in Figure 5.
In the August 2021 cruise, several significant correlations were observed:
  • Farranula gibbula abundance showed a significant negative correlation with temperature (p < 0.05) and a significant positive correlation with nitrate levels.
  • Lucicutia flavicornis abundance exhibited a highly significant negative correlation with salinity (p < 0.01) and a significant negative correlation with dissolved oxygen.
  • The total zooplankton abundance as well as abundance of Oithona setigera, O. tenuis and Sagitta enflata all show positive correlation with nitrate, indicating a broad community-level response to nutrient availability.
In the November 2022 cruise, the following relationships were detected:
  • Total zooplankton abundance, Oncaea venusta, Temoropia mayumbaensis and Haloptius longicornis abundances all were significant positively correlated with nitrate, reinforcing the role of nitrate in promoting certain copepod populations.
  • Total zooplankton abundance and Oithona tenuis exhibited significant negative correlation with salinity, and significant positive correlations with silicate concentrations.
These correlation patterns suggest that nutrient availability, especially nitrate and silicate, is a key driver of zooplankton distribution and abundance in the Northwest Pacific, with varying sensitivities among species. In contrast, parameters such as temperature and salinity appear to exert more species-specific effects, reflecting differences in ecological preferences and physiological tolerances among zooplankton taxa.
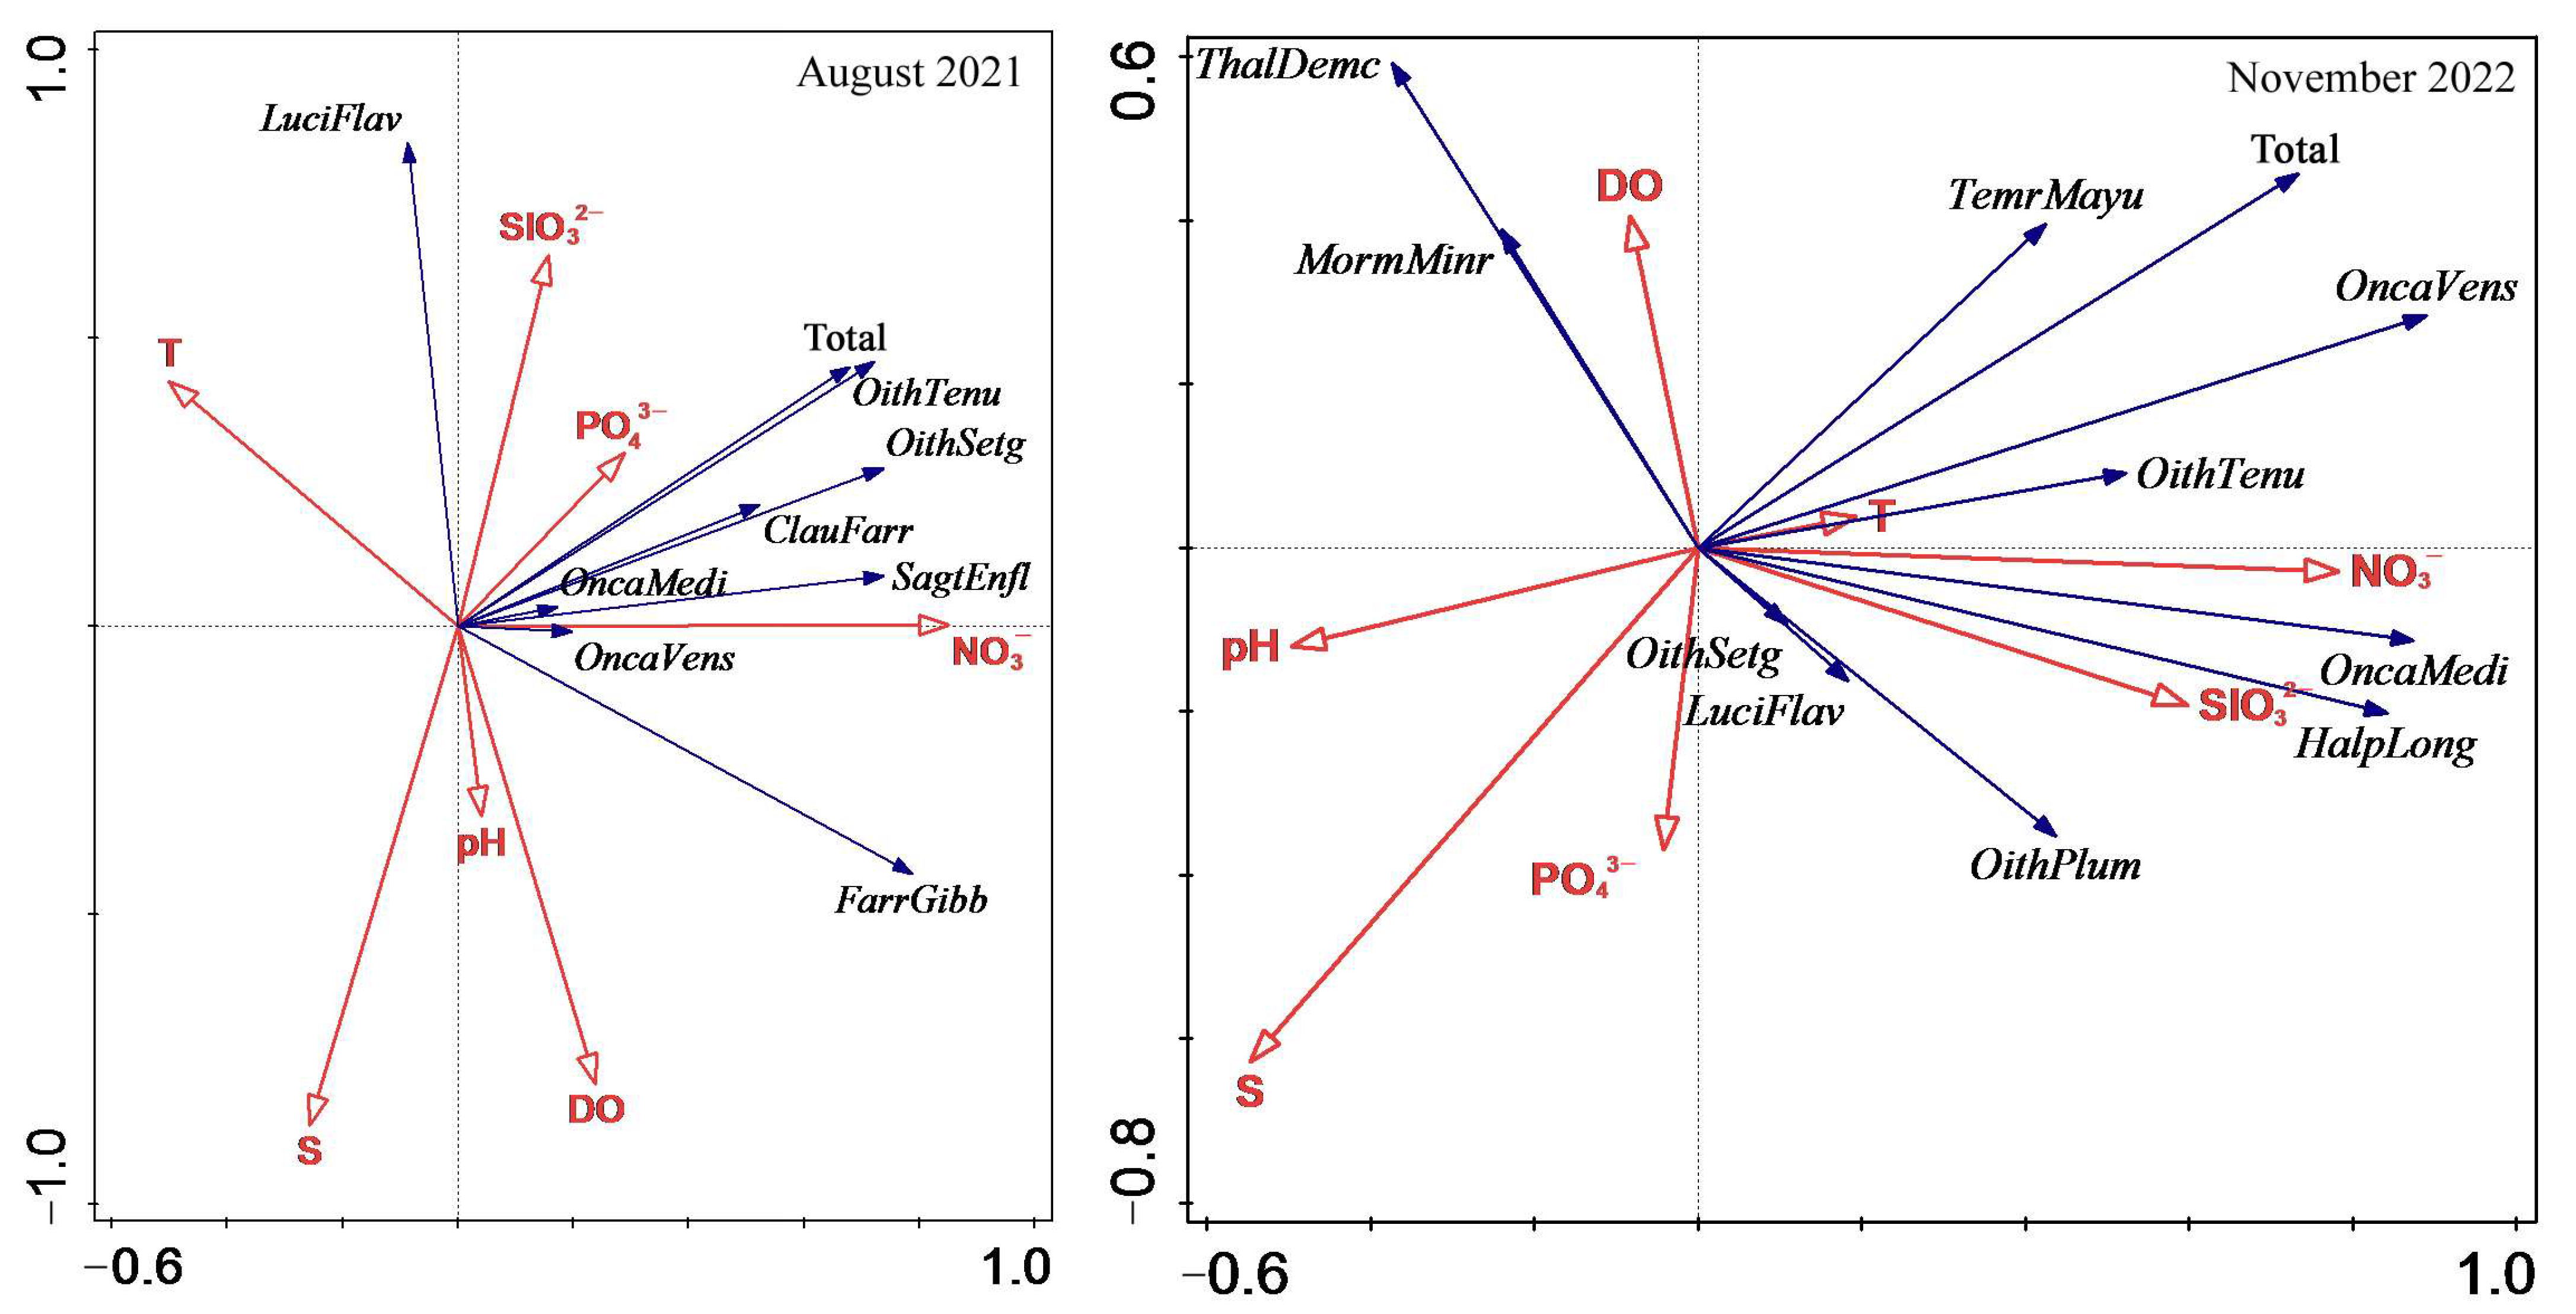
Environmental variability is one of the primary drivers influencing changes in zooplankton abundance within marine ecosystems. To further investigate the relationships between zooplankton and environmental factors, a redundancy analysis (RDA) was conducted (Figure 6).
The RDA results revealed the following patterns:
  • In August 2021, the overall zooplankton abundance and the most dominant species showed a positive correlation with nitrate and phosphate, with nitrate having a stronger effect. At the same time, salinity is negatively correlated with most zooplankton.
  • In November 2022, nitrate and phosphate remained the primary environmental drivers, with most zooplankton taxa displaying positive correlations with both nutrients.
These findings underscore the importance of nutrient dynamics, particularly nitrate and phosphate concentrations, in regulating zooplankton assemblages in the oligotrophic waters of the Northwest Pacific.
The redundancy analysis (RDA) ordination of August 2021 shows Axis 1 and Axis 2 are the primary canonical axes, representing the linear relationship between environmental variables and zooplankton community composition. Axis 1 explains 32.68% of the variance in zooplankton abundance, and Axis 2 explains 17.39%, with a cumulative explanation of 50.07% for the first two axes. And NO3 (p = 0.02) and Salinity (p = 0.044) were the significant driving factors (Table 3).
The RDA ordination of November 2022 shows Axis 1 and Axis 2 explained 37.48% and 10.66% of the total variation, respectively, with a cumulative explanation of 48.14%. And NO3 (p = 0.028) was the significant driving factor (Table 3).
Environmental data were standardized before analysis to eliminate dimensional differences. Multicollinearity was assessed using the variance inflation factor (VIF); all variables had VIF < 10, indicating no significant multicollinearity.

4. Discussion

Previous studies on zooplankton ecology in the Northwestern Pacific have mainly focused on coastal waters, continental shelves, or more productive temperate and subarctic regions, whereas comparable evidence from oligotrophic low-latitude deep-ocean environments remains limited. Against this background, the present study contributes a region specific dataset from the tropical low-latitude Northwestern Pacific, a hydrographically complex but nutrient-poor open-ocean setting that has been much less represented in the existing literature.

4.1. Temporal Variation Between August and November in Zooplankton Abundance and Distribution

In this nutrient-depleted study area, mesoscale eddies play a crucial role in enhancing vertical mixing and redistributing nutrients from deeper waters to the euphotic zone, thus supporting biological productivity [33,34]. In this study, zooplankton abundance was significantly higher in August 2021 compared to November 2022. Real-time merged AVISO satellite data, coupled with underway ADCP current field analyses, indicated the presence of active mesoscale eddies during the August 2021 cruise. These eddy-induced upwelling events facilitated the upward transport of nutrient-rich deep water to the surface, contributing to the formation of a subsurface chlorophyll maximum (SCM). This process enhanced primary productivity, thereby providing a more abundant food base for zooplankton populations [34].
This physical-biological coupling mechanism has been widely reported in other tropical and subtropical oligotrophic regions worldwide [33,35]. For instance, Long et al. [36] found that in the equatorial western Pacific, upwelling systems driven by the summer monsoon significantly increased diatom abundance, which subsequently led to the aggregation of zooplankton communities, particularly copepods. Similarly, research in the equatorial eastern Pacific has shown that nutrient enrichment from upwelling events triggers seasonal phytoplankton blooms, which are a major driver of rapid increases in zooplankton biomass [9].
In addition to physical processes, the response of different groups of zooplankton to environmental factors such as temperature, nutrients, and light varies greatly. For example, most copepods exhibit higher metabolic and reproductive rates under high temperature conditions [3,37], making them more ecologically advantageous in summer environments; Some large crustaceans, such as euphausiids, may be more prone to reproduction in environments with lower water temperatures and moderate primary productivity [38]. In this study, the dominant species during the August 2021 were mainly small and medium-sized copepods (e.g., Oithona spp., and Oncaea spp.), while in November 2022, more large species such as euphausiids and chaetognaths appeared, reflecting the differences in response of different ecological groups to resource spatiotemporal heterogeneity.

4.2. Relationship Between Zooplankton Taxa and Environmental Factors

The abundance and spatial distribution patterns of zooplankton are closely linked to a suite of physical and chemical environmental variables. Redundancy analysis (RDA) conducted in this study identified nitrate, silicate, temperature, and salinity as the dominant ecological drivers shaping zooplankton community structure in the surveyed region. These factors influence zooplankton populations directly. Thus, they affect population dynamics and community assemblages through physiological impacts or indirectly by altering food availability or habitat conditions.
Nitrate and silicate are key nutrients limiting phytoplankton productivity in marine ecosystems. As primary producers, phytoplankton biomass directly determines the resource base for zooplankton communities. Surveys in the Western Pacific showed that elevated nutrient concentrations significantly increased the abundance of dominant phytoplankton such as diatoms [39], which in turn promoted rapid population growth of zooplankton like copepods. Similarly, Fernández-Álamo and Färber-Lorda [9] reported that zooplankton abundance in the Eastern Pacific was highly dependent on nitrate input from upwelling, with regulatory effects on community structure exhibiting strong spatiotemporal heterogeneity. This explains why nitrate and silicate emerged as the primary drivers in the present study.
The study area is a typical oligotrophic region where nitrate is the main limiting nutrient for phytoplankton growth, while silicate restricts diatom development [40]. In contrast, phosphate concentrations remained relatively stable across seasons and showed no significant limiting effect, consistent with the nutrient characteristics of the tropical Northwestern Pacific characterized by co-limitation of nitrogen and silicate and non-limitation of phosphorus [41]. Nitrate input directly enhances phytoplankton primary productivity and cascades through the food web to influence zooplankton communities. Silicate enrichment supports diatom-dominated phytoplankton assemblages, providing a food base for herbivorous zooplankton [40,42],. Taken together, these patterns suggest two plausible trophic linkages in the study area: a nitrate-associated pathway potentially supporting overall phytoplankton production and zooplankton abundance, and a silicate-associated pathway potentially linked to diatom production and herbivorous zooplankton. However, because phytoplankton biomass and composition were not directly measured in this study, these pathways should be regarded as hypotheses requiring further validation.
Temperature, as a key regulator of metabolic rates, exerts a dual effect on zooplankton. On one hand, moderate temperatures accelerate developmental and reproductive processes, enhancing population growth. On the other hand, excessively high temperatures may exceed the physiological tolerance of certain species, resulting in reduced survival and fecundity [43]. In our study, the observed negative correlation between zooplankton abundance and temperature in August 2021 suggests that localized thermal anomalies may have surpassed the thermal optima for some copepod species, thereby suppressing their population size. Moreover, temperature indirectly affects zooplankton by influencing water column stratification and mixing intensity, which govern nutrient distributions and phytoplankton assemblages—thereby altering the spatial structure of zooplankton communities [44,45].
Salinity reflects the mixing and movement of water masses and is a key indicator of hydrographic conditions [46]. In the present study, the distribution of certain species (e.g., Lucicutia flavicornis) was negatively correlated with salinity, indicating a preference for fresher or more mixed waters. Similar trends have been observed in the Indian Ocean [47] and the Northern China Sea [48], where lower salinity environments were associated with increased diversity and abundance of certain zooplankton taxa. These findings underscore the importance of water mass characteristics and horizontal advection in shaping biogeographic patterns of zooplankton.
Rather than simply documenting species composition, this study links zooplankton community variation to spatial changes in nitrate, salinity, silicate, and temperature, thereby extending previous descriptive work toward a more integrated interpretation of community–environment relationships in an oligotrophic deep-sea setting. In particular, the results show that nitrate was consistently associated with community variation across both cruises, while silicate and salinity were related to the distribution of specific dominant taxa, suggesting that zooplankton responses in this region are shaped by both general nutrient conditions and species specific ecological preferences.

4.3. Regulatory Mechanisms of Environmental Factors on the Distribution of Dominant Species

Zooplankton communities are often dominated by a few ecologically superior species, which not only contribute significantly to total biomass but also play crucial roles in energy transfer, nutrient cycling, and trophic structure. Understanding the environmental drivers influencing these dominant taxa is essential for unraveling community assembly processes and the functioning of marine ecosystems. In this study, we examined the correlations between representative dominant species and key environmental parameters, revealing how these factors regulate spatial patterns of zooplankton distribution.
In our study region, Oithona setigera and Oncaea media exhibited significant positive correlations with nitrate concentrations. This pattern aligns with their ecological adaptability. Both species are small-sized, filter-feeding copepods that primarily consume bacteria, pico-phytoplankton, and detritus, making them well-suited to nutrient-rich waters with elevated primary productivity [49]. Turner [50] noted that such small copepods can rapidly respond to nutrient enrichment and undergo population booms. For instance, Hwang et al. [51] reported explosive growth of Oithona populations in the South China Sea in response to nitrate input from equatorial upwelling. Their rapid reproductive cycles and low resource thresholds allow them to capitalize efficiently on short-lived nutrient pulses [49,52], giving them a competitive advantage in dynamic environments.
Lucicutia flavicornis showed negative correlations with both salinity and dissolved oxygen, suggesting an ecological preference for low-salinity, low-oxygen conditions. This species is commonly found in mesopelagic to deep waters and is known for its tolerance to hypoxic environments [53]. Studies by Wishner et al. [54] demonstrated that species of the Lucicutia genus are abundant within oxygen minimum zones (OMZs) in the eastern tropical Pacific, where they exhibit physiological adaptations, including reduced metabolic rates and enhanced oxygen storage. Additionally, their ability to migrate vertically and occupy broad depth ranges enables their persistence in low-oxygen layers, often near seamounts, slopes, and mid-depth waters.
Oithona tenuis showed a strong and significant positive correlation with silicate concentrations, indicating its potential dependence on diatom-dominated primary production systems. Silicate is a key limiting factor for diatom reproduction; once diatoms bloom abundantly, they provide rich nutritional resources for copepods, thereby driving rapid population growth of certain copepod species. Studies have shown that some species of the genus Oithona exhibit selective feeding preferences for small diatoms and chrysophytes. In aquatic environments where diatoms dominate the phytoplankton community, populations of Oithona gain a competitive advantage [55]. Globally, surveys in regions such as the North Pacific and the Southern Ocean have revealed that Oithona copepods typically achieve higher abundances in areas with diatom-dominated primary productivity [49], which is highly consistent with the findings of the present study.
Essentially, the positive response of O. tenuis to silicate reflects its high dependence on the diatom-based food web. As a small herbivorous copepod, O. tenuis possesses mouthparts structurally adapted for feeding on small diatoms [56]. In phytoplankton communities with high silicate levels and dominant diatom populations, O. tenuis can secure sufficient food resources, leading to a significant increase in its abundance [57]. This pattern is consistent with the hypothesis that silicate may influence dominant zooplankton distribution indirectly through diatom-based food web processes. Nevertheless, this interpretation remains inferential because phytoplankton community composition was not directly quantified in the present dataset.
Conversely, Oncaea venusta did not show strong correlations with specific nutrients or physical parameters, indicating a broader ecological tolerance and more generalized resource use. Species of the Oncaea genus are often detritivorous or epizoic feeders, capable of attaching to marine snow aggregates, organic particles, or the surfaces of larger zooplankton, thus exhibiting flexible feeding strategies [58]. This ecological plasticity allows O. venusta to maintain stable populations even under fluctuating nutrient regimes and frequent water mass mixing.
The contrasting responses of dominant copepod species indicate that even within broadly oligotrophic open-ocean systems, dominant taxa may occupy different environmental niches. This provides a useful comparison with earlier studies from shelf and coastal ecosystems, where zooplankton dynamics are often interpreted mainly in relation to broader productivity gradients. Although the trophic linkages inferred here require further verification using direct phytoplankton data, the present study offers a regional ecological framework for understanding how nutrient structure and hydrographic variability may jointly regulate zooplankton communities in tropical deep-sea oligotrophic waters.

4.4. Comparison with Adjacent Regions

Comparing the results of this study with recent surveys conducted in neighboring areas of the Northwest Pacific contributes to a broader understanding of the spatiotemporal patterns and ecological characteristics of zooplankton communities in this region. For instance, Xin et al. [59] conducted a summer survey in 2020 in the northeastern sector of our study area (41°11′–48°06′ N, 162°15′–169°34′ E), reporting an average zooplankton abundance of 66.6 ind/m3. This value closely aligns with our August 2021 survey result (65.4 ind/m3), suggesting that summer zooplankton abundance and community structure in this region remain relatively stable over certain temporal and spatial scales.
In contrast, Fu et al. [60] recorded 456 species during a March survey at slightly higher latitudes (28–35° N, 147–154° E), markedly more than the number found in our study. This discrepancy may be attributed to two factors: first, their survey included a large number of larval and unidentified taxa, broadening the species count; second, early spring corresponds to the initial stage of thermocline formation, when nutrients have not yet been depleted, providing favorable conditions for phytoplankton growth and thus supporting higher zooplankton species richness. However, their reported average abundance was only 22.2 ind/m3—much lower than our observations—likely due to weaker water column stability and lower primary productivity during early spring.
From a seasonal perspective, zooplankton abundance in our study was notably higher in August 2021 than in November 2022, a pattern consistent with other investigations in the subtropical Northwest Pacific. Ge et al. [61] suggested that summer wind-induced mesoscale eddies and enhanced vertical mixing promote upward nutrient transport, boosting primary productivity. Such seasonal biomass pulses, driven by upwelling dynamics, have also been widely reported in the tropical Pacific [62] and Indian Ocean [63], reflecting strong trophic coupling between phytoplankton and zooplankton.

5. Conclusions

Based on comprehensive field surveys conducted in the Northwest Pacific during August 2021 and November 2022, this study analyzed the seasonal dynamics and spatial distribution characteristics of zooplankton species composition and their relationships with key environmental factors. The results revealed that zooplankton abundance was higher in August 2021. Zooplankton abundance and community composition were significantly correlated with nitrate, silicate, salinity, and temperature. Different dominant species exhibited distinct responses to environmental gradients: for example, Oithona setigera and Oncaea media were associated with higher nutrient concentrations, while Lucicutia flavicornis was more frequently observed under lower salinity and dissolved oxygen conditions. These patterns reflect the ecological preferences of dominant zooplankton species and their potential adaptation to environmental variability.
This study had two main limitations. First, 0–200 m vertical trawling, while characterizing average community features, may overlook vertical heterogeneity in zooplankton distribution. Second, our analysis was restricted to two discrete cruises, which limited our ability to capture interannual variability and long-term spatiotemporal trends of zooplankton communities in this region. The impacts of extreme marine events, such as intense mesoscale eddies and El Niño episodes, could not be fully evaluated. Furthermore, the 15-month interval between the two surveys did not constitute a continuous seasonal series, and subtle shifts in background environmental conditions may have introduced some uncertainty into the seasonal comparison.
Despite these limitations, comparisons with regional and global oceanographic studies indicate that our findings on zooplankton abundance, species composition, and seasonal variability are broadly consistent with previously documented patterns. These results advance our understanding of zooplankton dynamics in oligotrophic pelagic ecosystems and provide a scientific foundation for the conservation and management of open-ocean ecosystems.
Future research should conduct long-term continuous observations (≥3 years) with monthly/quarterly sampling to resolve interannual variations, and implement stratified sampling (0–50 m, 50–100 m, 100–200 m) to clarify vertical distribution and diel migration. Integrating satellite remote sensing and numerical models will help elucidate the climate change (ocean warming, acidification) impacts. Incorporating phytoplankton dynamics, microzooplankton, and high-resolution nutrient data to develop a coupled “environment–primary producers–zooplankton” framework will further improve the research on spatiotemporal dynamics of zooplankton in tropical deep-sea areas of the Northwest Pacific.

Author Contributions

Conceptualization, R.S. and B.X.; methodology, Y.W.; software, Y.C.; validation, X.S., Y.Y. and P.X.; formal analysis, R.S.; investigation, C.W.; resources, B.X.; data curation, R.S.; writing—original draft preparation, R.S.; writing—review and editing, B.X.; visualization, Y.Y.; supervision, X.S.; project administration, B.X.; funding acquisition, B.X. All authors have read and agreed to the published version of the manuscript.

Funding

This research was funded by: 1. National Key Research and Development Program of China, grant number 2022YFC2804003. 2. National Key Research and Development Program of China, grant number 2022YFC2804001. 3. Natural Science Foundation of Fujian Province: 2023J011373.

Institutional Review Board Statement

Not applicable.

Data Availability Statement

The original contributions presented in this study are included in the article. Further inquiries can be directed to the corresponding authors.

Conflicts of Interest

The authors declare no conflicts of interest.

References

  1. Therriault, T.; Park, C.; Rice, J. North Pacific Ocean. In The First Global Integrated Marine Assessment: World Ocean Assessment I; Inniss, L., Simcock, A., United Nations, Eds.; Cambridge University Press: Cambridge, UK, 2016. [Google Scholar]
  2. McWilliams, J.C. Submesoscale currents in the ocean. Proc. R. Soc. A Math. Phys. Eng. Sci. 2016, 472, 20160117. [Google Scholar] [CrossRef] [Scilit]
  3. Mackas, D.L.; Batten, S.; Trudel, M. Effects on zooplankton of a warmer ocean: Recent evidence from the Northeast Pacific. Prog. Oceanogr. 2007, 75, 223–252. [Google Scholar] [CrossRef] [Scilit]
  4. Lyle, M.; Barron, J.; Bralower, T.J.; Huber, M.; Olivarez Lyle, A.; Ravelo, A.C.; Rea, D.K.; Wilson, P.A. Pacific Ocean and Cenozoic evolution of climate. Rev. Geophys. 2008, 46, RG2002. [Google Scholar] [CrossRef] [Scilit]
  5. Bettinetti, R.; Manca, M. Understanding the role of zooplankton in transfer of pollutants through trophic food webs. In Zooplankton: Species Diversity, Distribution and Seasonal Dynamics; Nova Science Publishers: Hauppauge, NY, USA, 2013; pp. 17–36. [Google Scholar]
  6. Jakhar, P. Role of phytoplankton and zooplankton as health indicators of aquatic ecosystem: A review. Int. J. Innov. Res. Study 2013, 2, 489–500. [Google Scholar]
  7. Bisinicu, E.; Lazar, L. Exploring Mesozooplankton Insights by Assessing the Ecological Status of Black Sea Waters Under the Marine Strategy Framework Directive. Oceans 2024, 5, 923–950. [Google Scholar] [CrossRef] [Scilit]
  8. Steinberg, D.K.; Landry, M.R. Zooplankton and the ocean carbon cycle. Annu. Rev. Mar. Sci. 2017, 9, 413–444. [Google Scholar] [CrossRef] [Scilit]
  9. Fernández-Álamo, M.A.; Färber-Lorda, J. Zooplankton and the oceanography of the eastern tropical Pacific: A review. Prog. Oceanogr. 2006, 69, 318–359. [Google Scholar] [CrossRef] [Scilit]
  10. Ratnarajah, L.; Abu-Alhaija, R.; Atkinson, A.; Batten, S.; Bax, N.J.; Bernard, K.S.; Canonico, G.; Cornils, A.; Everett, J.D.; Grigoratou, M.; et al. Monitoring and modelling marine zooplankton in a changing climate. Nat. Commun. 2023, 14, 1286. [Google Scholar] [CrossRef] [Scilit] [PubMed]
  11. Kenitz, K.M.; Visser, A.W.; Ohman, M.D.; Landry, M.R.; Andersen, K.H. Community trait distribution across environmental gradients. Ecosystems 2019, 22, 968–980. [Google Scholar] [CrossRef] [Scilit]
  12. Williams, R.G.; Follows, M.J. Physical transport of nutrients and the maintenance of biological production. In Ocean Biogeochemistry: The Role of the Ocean Carbon Cycle in Global Change; Springer: Berlin/Heidelberg, Germany, 2003; pp. 19–51. [Google Scholar]
  13. Malone, T.; Azzaro, M.; Bode, A.; Brown, E.; Duce, R.; Kamykowski, D.; Kang, S.; Kedong, Y.; Thorndyke, M.; Wang, J. Primary Production, Cycling of Nutrients, Surface Layer and Plankton. In The First Global Integrated Marine Assessment; Centro Oceanográfico de A Coruña: Coruña, Spain, 2017; pp. 119–147. [Google Scholar]
  14. Chavez, F.P.; Buck, K.R.; Service, S.K.; Newton, J.; Barber, R.T. Phytoplankton variability in the central and eastern tropical Pacific. Deep Sea Res. Part II Top. Stud. Oceanogr. 1996, 43, 835–870. [Google Scholar] [CrossRef] [Scilit]
  15. Isada, T.; Kuwata, A.; Saito, H.; Ono, T.; Ishii, M.; Yoshikawa-Inoue, H.; Suzuki, K. Photosynthetic features and primary productivity of phytoplankton in the Oyashio and Kuroshio–Oyashio transition regions of the northwest Pacific. J. Plankton Res. 2009, 31, 1009–1025. [Google Scholar] [CrossRef] [Scilit]
  16. Rautio, M.; Bayly, I.A.; Gibson, J.A.; Nyman, M. Zooplankton and zoobenthos in high-latitude water bodies. In Polar Lakes and Rivers; Oxford University Press: New York, NY, USA, 2008; pp. 231–247. [Google Scholar]
  17. Mackas, D.; Tsuda, A. Mesozooplankton in the eastern and western subarctic Pacific: Community structure, seasonal life histories, and interannual variability. Prog. Oceanogr. 1999, 43, 335–363. [Google Scholar] [CrossRef] [Scilit]
  18. Weydmann, A.; Walczowski, W.; Carstensen, J.; Kwaśniewski, S. Warming of Subarctic waters accelerates development of a key marine zooplankton Calanus finmarchicus. Glob. Change Biol. 2018, 24, 172–183. [Google Scholar] [CrossRef] [Scilit] [PubMed]
  19. Chakraborty, S.; Cadier, M.; Visser, A.W.; Bruggeman, J.; Andersen, K.H. Latitudinal variation in plankton traits and ecosystem function. Glob. Biogeochem. Cycles 2020, 34, e2020GB006564. [Google Scholar] [CrossRef] [Scilit]
  20. Genin, A. Bio-physical coupling in the formation of zooplankton and fish aggregations over abrupt topographies. J. Mar. Syst. 2004, 50, 3–20. [Google Scholar] [CrossRef] [Scilit]
  21. Genin, A.; Dower, J.F. Seamount plankton dynamics. In Seamounts: Ecology, Fisheries & Conservation; Cambridge University Press: Cambridge, UK, 2007; pp. 87–100. [Google Scholar]
  22. Ji, R.; Edwards, M.; Mackas, D.L.; Runge, J.A.; Thomas, A.C. Marine plankton phenology and life history in a changing climate: Current research and future directions. J. Plankton Res. 2010, 32, 1355–1368. [Google Scholar] [CrossRef] [Scilit]
  23. Semenchenko, V.P.; Razlutskij, V.I.; Feniova, I.Y.; Aibulatov, D.N. Biotic relations affecting species structure in zooplankton communities. Hydrobiologia 2007, 579, 219–231. [Google Scholar] [CrossRef] [Scilit]
  24. Werner, T.; Buchholz, F. Diel vertical migration behaviour in Euphausiids of the northern Benguela current: Seasonal adaptations to food availability and strong gradients of temperature and oxygen. J. Plankton Res. 2013, 35, 792–812. [Google Scholar] [CrossRef] [Scilit]
  25. Darnis, G.; Fortier, L. Temperature, food and the seasonal vertical migration of key arctic copepods in the thermally stratified Amundsen Gulf (Beaufort Sea, Arctic Ocean). J. Plankton Res. 2014, 36, 1092–1108. [Google Scholar] [CrossRef] [Scilit]
  26. Karl, D.M. A sea of change: Biogeochemical variability in the North Pacific Subtropical Gyre. Ecosystems 1999, 2, 181–214. [Google Scholar] [CrossRef] [Scilit]
  27. Karl, D.M.; Church, M.J. Ecosystem structure and dynamics in the North Pacific Subtropical Gyre: New views of an old ocean. Ecosystems 2017, 20, 433–457. [Google Scholar] [CrossRef] [Scilit]
  28. Zheng, Z.; Li, S.J.; Xu, Z.Z. Marine Plankto Biology; Ocean Press: Beijing, China, 1984; pp. 28–31. [Google Scholar]
  29. Lian, G.S.; Wang, Y.G.; Sun, R.X.; Huang, J.X. Species Diversity of Marine Planktonic Copepods in China’s Seas; Ocean Press: Beijing, China, 2018; pp. 1–835. [Google Scholar]
  30. Xu, Z.Z.; Huang, J.Q.; Lin, M.; Guo, D.H.; Wang, C.G. The Superclass Hydrozoa of the Phylum Cnidaria in China; Ocean Press: Beijing, China, 2014; pp. 1–945. [Google Scholar]
  31. Chen, R.X.; Lin, J.H. Pelagic Ostracoda in China Seas; Ocean Press: Beijing, China, 1995; pp. 1–150. [Google Scholar]
  32. Xu, Z.L.; Chen, Y.Q. Aggregated intensity of dominant species of zooplankton in autumn in the East China Sea and Yellow Sea. Chin. J. Ecol. 1989, 8, 13–15. [Google Scholar]
  33. McGillicuddy, D.J., Jr. Mechanisms of physical-biological-biogeochemical interaction at the oceanic mesoscale. Annu. Rev. Mar. Sci. 2016, 8, 125–159. [Google Scholar] [CrossRef] [Scilit] [PubMed]
  34. Wang, Y.; Zhang, J.H.; Yu, J.C.; Wu, Q.Y.; Sun, D. Anticyclonic mesoscale eddy induces mesopelagic biomass hotspot in the oligotrophic ocean. J. Mar. Syst. 2023, 237, 103831. [Google Scholar] [CrossRef] [Scilit]
  35. Alheit, J.; Bakun, A. Population synchronies within and between ocean basins: Apparent teleconnections and implications as to physical–biological linkage mechanisms. J. Mar. Syst. 2010, 79, 267–285. [Google Scholar] [CrossRef] [Scilit]
  36. Long, Y.; Noman, M.A.; Chen, D.; Wang, S.; Yu, H.; Chen, H.; Wang, M.; Sun, J. Western Pacific zooplankton community along latitudinal and equatorial transects in autumn 2017 (northern hemisphere). Diversity 2021, 13, 58. [Google Scholar] [CrossRef] [Scilit]
  37. Padmavati, G.; Ikeda, T.; Yamaguchi, A. Life cycle, population structure and vertical distribution of Metridia spp. (Copepoda: Calanoida) in the Oyashio region (NW Pacific Ocean). Mar. Ecol. Prog. Ser. 2004, 270, 181–198. [Google Scholar] [CrossRef] [Scilit]
  38. Gómez-Gutiérrez, J.; Martínez-Gómez, S.; Robinson, C.J. Seasonal growth, molt, and egg production rates of Nyctiphanes simplex (Crustacea: Euphausiacea) juveniles and adults in the Gulf of California. Mar. Ecol. Prog. Ser. 2012, 455, 173–194. [Google Scholar] [CrossRef] [Scilit]
  39. Chen, Z.; Sun, J.; Gu, T.; Zhang, G.; Wei, Y. Nutrient ratios driven by vertical stratification regulate phytoplankton community structure in the oligotrophic western pacific ocean. Ocean Sci. 2021, 17, 1775–1789. [Google Scholar] [CrossRef] [Scilit]
  40. Giri, T.; Goutam, U.; Arya, A.; Gautam, S. Effect of nutrients on diatom growth: A review. Trends Sci. 2022, 19, 1752. [Google Scholar] [CrossRef] [Scilit]
  41. Browning, T.J.; Liu, X.; Zhang, R.; Wen, Z.; Liu, J.; Zhou, Y.; Xu, F.; Cai, Y.; Zhou, K.; Cao, Z.; et al. Nutrient co-limitation in the subtropical Northwest Pacific. Limnol Ocean. 2022, 7, 52–61. [Google Scholar] [CrossRef] [Scilit]
  42. Atkinson, A.; Ward, P.; Hunt, B.; Pakhomov, E.; Hosie, G. An overview of Southern Ocean zooplankton data: Abundance, biomass, feeding and functional relationships. Ccamlr Sci. 2012, 19, 171–218. [Google Scholar]
  43. Moore, M.; Folt, C. Zooplankton body size and community structure: Effects of thermal and toxicant stress. Trends Ecol. Evol. 1993, 8, 178–183. [Google Scholar] [CrossRef] [Scilit]
  44. Winder, M.; Sommer, U. Phytoplankton response to a changing climate. Hydrobiologia 2012, 698, 5–16. [Google Scholar] [CrossRef] [Scilit]
  45. Domis, D.S.; Lisette, N.; Elser, J.J.; Gsell, A.S.; Huszar, V.L.; Ibelings, B.; Jeppesen, E.; Kosten, S.; Mooij, W.M.; Roland, F. Plankton dynamics under different climatic conditions in space and time. Freshw. Biol. 2013, 58, 463–482. [Google Scholar] [CrossRef] [Scilit]
  46. Hieronymus, M.; Nilsson, J.; Nycander, J. Water mass transformation in salinity–temperature space. J. Phys. Oceanogr. 2014, 44, 2547–2568. [Google Scholar] [CrossRef] [Scilit]
  47. Garçon, V.C.; Oschlies, A.; Doney, S.C.; McGillicuddy, D.; Waniek, J. The role of mesoscale variability on plankton dynamics in the North Atlantic. Deep Sea Res. Part II Top. Stud. Oceanogr. 2001, 48, 2199–2226. [Google Scholar] [CrossRef] [Scilit]
  48. Chen, Y.; Lin, S.; Wang, C.; Yang, J.; Sun, D. Response of size and trophic structure of zooplankton community to marine environmental conditions in the northern South China Sea in winter. J. Plankton Res. 2020, 42, 378–393. [Google Scholar] [CrossRef] [Scilit]
  49. Gallienne, C.P.; Robins, D.B. Is Oithona the most important copepod in the world’s oceans? J. Plankton Res. 2001, 23, 1421–1432. [Google Scholar] [CrossRef] [Scilit]
  50. Turner, J.T. The importance of small planktonic copepods and their roles in pelagic marine food webs. Zool. Stud. 2004, 43, 255–266. [Google Scholar]
  51. Hwang, J.-S.; Kumar, R.; Dahms, H.-U.; Tseng, L.-C.; Chen, Q.-C. Interannual, seasonal, and diurnal variations in vertical and horizontal distribution patterns of 6 Oithona spp. (Copepoda: Cyclopoida) in the South China Sea. Zool. Stud. 2010, 49, 220–229. [Google Scholar]
  52. Zamora-Terol, S.; Kjellerup, S.; Swalethorp, R.; Saiz, E.; Nielsen, T.G. Population dynamics and production of the small copepod Oithona spp. in a subarctic fjord of West Greenland. Polar Biol. 2014, 37, 953–965. [Google Scholar] [CrossRef] [Scilit]
  53. Wishner, K.F.; Gowing, M.M.; Celia, G. Living in suboxia: Ecology of an Arabian Sea oxygen minimum zone copepod. Limnol. Oceanogr. 2000, 45, 1576–1593. [Google Scholar] [CrossRef] [Scilit]
  54. Wishner, K.F.; Outram, D.M.; Seibel, B.A.; Daly, K.L.; Williams, R.L. Zooplankton in the eastern tropical north Pacific: Boundary effects of oxygen minimum zone expansion. Deep Sea Res. Part I Oceanogr. Res. Pap. 2013, 79, 122–140. [Google Scholar] [CrossRef] [Scilit]
  55. Pond, D.W.; Ward, P. Importance of diatoms for Oithona in Antarctic waters. J. Plankton Res. 2011, 33, 105–118. [Google Scholar] [CrossRef] [Scilit]
  56. Nishida, S. Taxonomy and Distribution of the Family Oithonidae (Copepoda, Cyclopoida) in the Pacific and Indian Oceans. In Bulletin of the Ocean Research Institute; University of Tokyo: Tokyo, Japan, 1985; Volume 20, pp. 1–167. [Google Scholar]
  57. Wang, L.; Du, F.; Wang, X.; Li, Y.; Ning, J. Distribution and role of the genus Oithona (Copepoda: Cyclopoida) in the South China Sea. Oceanologia 2017, 59, 300–310. [Google Scholar] [CrossRef] [Scilit]
  58. Kattner, G.; Albers, C.; Graeve, M.; Schnack-Schiel, S. Fatty acid and alcohol composition of the small polar copepods, Oithona and Oncaea: Indication on feeding modes. Polar Biol. 2003, 26, 666–671. [Google Scholar] [CrossRef] [Scilit]
  59. Xin, Q.; Li, X.; Xiao, X.; Yu, X.; Wang, X.; Chen, J.; Hu, Q.; Jiang, T.; Mu, C. Community structure of zooplankton and its relationship with environmental factors in the surface waters of the Northwest Pacific Ocean. J. Ningbo Univ. (NSEE) 2023, 36, 23–30. [Google Scholar]
  60. Fu, F.Y.; Bu, X.Y.; Shen, A.L.; Liu, B.L. Composition and distribution of zooplankton species in the subtropical areas of the Northwestern Pacific Ocean. Chin. J. Appl. Ecol. 2022, 33, 544–550. [Google Scholar]
  61. Ge, R.; Chen, H.; Wang, W.; Zhuang, Y.; Liu, G. Vertical variations of zooplankton functional traits and diversity in the tropical and subtropical northwestern Pacific. Limnol. Oceanogr. 2025, 70, 1787–1801. [Google Scholar] [CrossRef] [Scilit]
  62. Yang, G.; Li, C.; Wang, Y.; Wang, X.; Dai, L.; Tao, Z.; Ji, P. Spatial variation of the zooplankton community in the western tropical Pacific Ocean during the summer of 2014. Cont. Shelf Res. 2017, 135, 14–22. [Google Scholar] [CrossRef] [Scilit]
  63. Madhupratap, M.; Gauns, M.; Ramaiah, N.; Kumar, S.P.; Muraleedharan, P.; De Sousa, S.; Sardessai, S.; Muraleedharan, U. Biogeochemistry of the Bay of Bengal: Physical, chemical and primary productivity characteristics of the central and western Bay of Bengal during summer monsoon 2001. Deep Sea Res. Part II Top. Stud. Oceanogr. 2003, 50, 881–896. [Google Scholar] [CrossRef] [Scilit]
Figure 1. Sampling stations surveyed during the two cruises in the Northwestern Pacific: (A) August 2021 cruise and (B) November 2022 cruise.
Ecologies 07 00036 g001
Figure 2. Spatial distribution of zooplankton abundance in August 2021 and November 2022. The color bar on the right represents the abundance values ranging from low to high. The gradient indicates that blue and purple colors denote low abundance, while green, yellow, and red colors represent moderate and high abundance, respectively.
Ecologies 07 00036 g002
Figure 3. Zooplankton Diversity index (H) and Pielou’s evenness index (J) in August 2021 (top) and November 2022 (bottom). The color bar on the right represents the magnitude of the indices, where red/orange tones indicate high values and blue/purple tones indicate low values.
Ecologies 07 00036 g003
Figure 4. Depth-averaged (0–200 m) environmental parameters in August 2021 and November 2022. The boxes represent the interquartile ranges, the central lines denote the medians, Dots outside the whiskers are extreme values, and the curved lines reflect the data density distribution. T stands for water temperature, S for salinity, and DO for dissolved oxygen.
Ecologies 07 00036 g004
Figure 5. Heatmap analysis of zooplankton and environmental variables in August 2021 (top) and November 2022 (bottom). Color represents correlation coefficient (r), red for positive correlation, blue for negative correlation; asterisks represent significance (p): * p < 0.05, ** p < 0.01.
Ecologies 07 00036 g005
Figure 6. RDA ordination of zooplankton in August 2021 and November 2022 cruises.
Ecologies 07 00036 g006
Table 1. Zooplankton species composition during the August 2021 and November 2022 cruises.
PhylumGroupAugust 2021November 2022
Species NumberAverage Abundance (ind/m3)Species NumberAverage Abundance
(ind/m3)
CnidariaSiphonophorae260.33250.33
Hydrozoa90.1470.12
Scyphozoa10.01----
ArthropodaCopepoda8564.5910652.50
Ostracoda231.1090.17
Amphipoda150.05150.08
Euphausia----160.26
Sergestidae----10.02
ChaetognathaChaetognatha183.33161.18
ChordataTunicata232.21212.49
MolluscaPteropoda110.21150.20
Heteropoda40.0230.03
AnnelidaPolychaeta150.14120.22
Planktonic larvaePlanktonic larvae120.62100.27
Note: --, non-zooplankton species.
Table 2. Dominant zooplankton species in August 2021 and November 2022 cruises.
GroupSpecies NameAugust 2021November 2022
Dominance
(Y)
Average Abundance (ind/m3)Dominance
(Y)
Average Abundance (ind/m3)
CopepodaOithona setigera0.083.210.083.05
CopepodaOncaea media0.062.450.041.88
CopepodaLucicutia flavicornis0.031.520.031.08
CopepodaOithona tenuis0.031.300.031.07
CopepodaOncaea venusta0.031.300.051.91
ChaetognathaSagitta enflata0.041.76----
CopepodaFarranula gibbula0.031.61----
CopepodaClausocalanus farrani0.021.16----
CopepodaTemoropia
mayumbaensis
----0.031.32
CopepodaOithona plumifera----0.021.66
CopepodaHaloptilus longicornis----0.021.21
TunicataThalia democratica----0.020.91
CopepodaMormonilla minor----0.020.88
Note: --, non-dominant species.
Table 3. Results by RDA ordination with the first two axis and Monte Carlo test in August 2021 and November 2022 cruises.
CruiseAxisExplained Variation (%)Cumulative Explained (%)Significant Environmental FactorExplains (%)p-Value
August 2021Axis 132.6832.68NO324.70.02 *
Axis 217.3950.07S14.50.044 *
November 2022Axis 137.4837.48NO324.10.028 *
Axis 210.6648.14------
Note: * p < 0.05.
Disclaimer/Publisher’s Note: The statements, opinions and data contained in all publications are solely those of the individual author(s) and contributor(s) and not of MDPI and/or the editor(s). MDPI and/or the editor(s) disclaim responsibility for any injury to people or property resulting from any ideas, methods, instructions or products referred to in the content.