1. Introduction
Mixed temperate forests are among the most important ecosystems worldwide [
1], not only due to their capacity to provide essential ecosystem services, such as climate regulation, biodiversity conservation, soil protection, and carbon storage [
2], but also for the sustainable production of timber and non-timber goods [
3]. These ecosystems constitute a fundamental pillar for human well-being, as they represent one of the main sources of income and subsistence for numerous communities that rely on forest use as a key economic activity. Moreover, their appropriate management fosters both ecological resilience and the social and economic sustainability of the regions where they occur [
4,
5]. Pine and oak stand out among the most important tree genera globally, both for their ecological value and for their economic significance, given their use as timber and firewood [
6]. In North America, the genera Quercus and Pinus are the most representative, both in the continental United States and in Mexico, due to their high species richness and their significant contribution to the total woody biomass in the forests where they dominate [
5,
7,
8].
The vertical structure of forests directly influences energy transfer and matter fluxes within forest ecosystems, constituting a fundamental aspect of scientific research in the forestry and ecological domains [
9,
10]. Forest structure in this sense refers to the number of strata or tree layers present, which represents one of the essential attributes of forest organization [
11,
12]. This component is crucial for regulating ecological processes and ensuring the provision of the multiple services that forest ecosystems offer. Likewise, the understory reflects the successional trajectory of natural multi-layered forests, while the trees forming the subcanopy constitute the basis of the future canopy and guarantee the long-term supply of timber [
13]. Likewise, structural parameters such as total height, crown length, and crown diameter provide information on ecosystem functioning: total height describes vertical stratification, gap openness, and the canopy microclimate; crown length is associated with photosynthetic vigor and potential productivity, and anticipates competitive response; and crown diameter represents cover and shading, informing on lateral competition and the modulation of moisture and microhabitats in the understorey [
14].
Silvicultural management of the forest structure directly shapes biodiversity and is closely linked to key functional and productive properties of forest ecosystems [
15,
16,
17,
18]. Proper management of a heterogeneous vertical structure supports increases in the stratified diversity of associated taxa and in forest resilience [
19,
20]. Likewise, the management of complex vertical configurations—characterized by densely distributed crowns—can lead to greater regeneration and forest productivity [
16]. Moreover, canopy height, the size and proportion of gaps, together with foliage density, play a critical role in determining seed-dispersal distances and, consequently, influence recruitment rates and the spatial distribution patterns of individuals within the stand [
21,
22,
23].
Based on the above, this research aimed to analyze the influence of individual selection silvicultural treatment on the configuration of vertical structure in a mixed pine–oak forest in northern Mexico, with the purpose of elucidating the implications of this management regime on the stratified organization of the stand and its subsequent effects on the dynamics of ecological processes, as well as on the functional capacity of the ecosystem to provide both ecosystem services and timber products. This study was based on the hypothesis that the application of individual selection silvicultural treatment promotes a more heterogeneous vertical structure in mixed pine–oak forests, which in turn enhances ecological processes and increases the ecosystem’s capacity to provide both ecosystem services and timber products.
3. Results
3.1. Vertical Profiles and Statistical Analysis of Species Groups
The vertical distribution of conifers and broadleaved species was evaluated at three representative stages of the selection silvicultural system: Residual 2012 (post-harvest), Recruitment 2022 (pre-harvest), and Residual 2023 (post-harvest). To identify significant differences in tree heights among species, the non-parametric Kruskal–Wallis test was applied due to the non-normal distribution of the data. Letters above the boxplots indicate significant differences according to multiple comparisons; species sharing the same letter did not differ statistically from each other (p > 0.05).
Figure 4 shows boxplots where the horizontal lines serve as structural references of the forest canopy. The red line represents the mean total height considering all species. The blue line indicates the mean height distribution of conifers, while the green line corresponds to the mean height of broadleaved species. Finally, the circle on the
Y-axis marks the canopy mode calculated from the total dataset, highlighting the most frequent stratum within the vertical forest profile.
The first scenario (Residual 2012), corresponding to the structural condition of the forest after the 2012 harvest, revealed significant differences in species height (H = 78.28; p < 0.001). Among conifers, Pinus durangensis emerged as the tallest species, forming a statistically distinct group (group c), followed by P. arizonica and Quercus laeta in group bc, confirming their role as dominant canopy species. In contrast, species such as Juniperus deppeana, Arbutus xalapensis, and P. chihuahuana clustered in the lower groups (a–b), suggesting their persistence in the lower or middle canopy.
During recruitment prior to the second harvest (Recruitment 2022), height differences among species became more pronounced (H = 246.38; p < 0.001). Conifers continued to dominate the tallest strata, particularly P. durangensis, which retained its position in group c, and P. arizonica, P. strobiformis, and Q. laeta in groups ab–bc, reflecting the continuity of their vertical development. At this stage, intermediate species such as Alnus acuminata and P. strobiformis showed upward progression, reaching higher canopy positions compared to 2012, indicating active structural regeneration within the forest. Shade-tolerant species such as A. xalapensis, P. chihuahuana, and Q. rugosa remained in group a without significant height increases, confirming their stability in the lower strata under partial canopy cover.
After the second selective harvest (Residual 2023), interspecific height differences remained statistically significant (H = 176.04; p < 0.001), with a stronger functional separation between conifers (group A) and broadleaves (group B). This pattern suggests a management preference for retaining taller conifers, which may serve as seed trees or as structural cover. P. durangensis, P. arizonica, and Q. laeta remained dominant, reinforcing their persistence as residual trees with key structural and ecological roles. Meanwhile, P. strobiformis and A. acuminata consolidated their presence in the mid-canopy (group ab), reflecting successful vertical progression of individuals recruited during the previous period. Low-stature species such as A. xalapensis, J. deppeana, P. chihuahuana, and Q. rugosa retained their positions in the lower strata (group a), representing an advanced regeneration cohort whose dynamics may be critical for future selection cycles.
The persistence of species such as P. durangensis, Q. laeta, and P. arizonica in the upper strata, including the 90th height percentile, highlights their dominant ecological role. These species function as emergent canopy components, noted for their relative tolerance to disturbance, competitive ability for light, and influence on understory microenvironmental conditions. In contrast, species such as A. xalapensis, P. chihuahuana, and Q. rugosa consistently occupied the lower strata throughout the study period, reflecting adaptation to shade conditions and a limited ability to reach the canopy in the absence of major disturbances.
The comparison between 2022 and 2023 further shows that the second harvest cycle did not significantly alter the vertical distribution of species, indicating a carefully planned and executed intervention. On the contrary, a natural progression of individuals into the mid-canopy was observed, particularly among conifers such as P. arizonica and P. strobiformis, pointing to a controlled ecological succession driven by management.
3.2. Dasometric Characteristics of the Vertical Structure of Conifers
The dasometric analysis of the vertical forest structure revealed the structural evolution of conifers at three key stages of selection management. Regarding the height–diameter relationship, the results showed a growing curvilinear relationship between DBH and total height for conifers in each period, with high coefficients of determination (R2 = 0.777–0.803; p < 0.001) and significant correlations (r > 0.85). This indicates a high structural consistency in the growth form of conifers, regardless of harvesting. The dispersion observed in the upper values in 2022 and 2023 reflects the coexistence of residual dominant trees and the incorporation of new growing cohorts, which is consistent with the objectives of the selection method.
Figure 5 shows the height frequency distribution in 2012, characterized by a unimodal asymmetrical distribution with a greater concentration of individuals in intermediate classes, reflecting a recently harvested forest. By 2022, the curve shifted towards higher classes, indicating vertical development of recruited trees. In 2023, bimodality became more evident, reflecting a typical pattern of forests managed under selection: a group of dominant trees was retained while new individuals emerged into the canopy, creating a multi-layered system. Moreover, it can be observed that the vertical structure of conifers did not exhibit distributional changes as a result of the selective treatment, which represents structural balance of the forest and an appropriate application of management, aimed at maintaining stand heterogeneity.
Examination of the vertical structure showed a shift in the center of the height distribution towards greater values between 2012 and 2022, accompanied by a widening of the interquartile range, indicating greater heterogeneity. In parallel, there was a redistribution of density from intermediate classes towards the extremes of the profile (lower strata with recent recruits and upper strata with persistent dominants), while mid-height classes lost weight after intervention. In terms of canopy occupancy, the crown-density envelope suggests an increase in effective vertical overlap between young and dominant cohorts, with a more marked transition zone around 12–18 m. At the species level, tall conifers (e.g., Pinus durangensis, P. arizonica) supported the upper end of the profile, whereas recent cohorts contributed mainly to the subdominant strata, consolidating the stand’s vertical continuity under individual-selection management. Taken together, these patterns reflect greater structural variability and retention of dominance, consistent with the maintenance of canopy functionality and spatial heterogeneity in the forest.
The analysis of conifer crown density using the Kernel function revealed structural transformations associated with selection management across the three evaluated periods. In 2012, a unimodal distribution was observed, with a single density peak concentrated around 15 m in height, corresponding to intermediate residual individuals. This pattern indicates a simplified vertical structure, dominated by mid-sized conifers with limited representation of cohorts in the upper canopy.
By 2022, the crown density curve began to exhibit emerging bimodality, with a second peak defined in the lower classes (~10 m). This pattern suggests the establishment and development of advanced conifer regeneration, likely favored by canopy openings and reduced competition, resulting in increased coverage of the emergent and subdominant strata.
In 2023, the distribution remained bimodal, with a first peak between 9 and 11 m and a second between 19 and 21 m, reflecting structural coexistence between the crowns of younger trees and those of emergent or dominant individuals. This dual-strata crown arrangement is indicative of a functionally efficient multi-layered canopy, shaped by silvicultural management aimed at conserving individuals of high structural value while allowing the progressive incorporation of new conifer cohorts.
3.3. Dasometric Characteristics of the Vertical Structure of Broadleaved Species
The dasometric analysis of the vertical structure of broadleaved species showed the structural changes across three periods of the selection silvicultural treatment, as presented in
Figure 6.
The relationship between DBH and height in broadleaved species showed a positive and significant trend across the three periods (R2 = 0.545–0.571; p < 0.001), although with lower fit compared to conifers. This behavior indicates greater variability in the growth form of broadleaved species, possibly due to interspecific differences, higher morphological plasticity, or disturbance effects. The greater dispersion observed in large-diameter trees suggests a less homogeneous structure within dominant classes.
The height frequency distribution of broadleaved species in 2012 displayed a skewed pattern, with a higher density of individuals in lower classes and a gradual decline toward taller classes. By 2022, a more pronounced asymmetry was observed, although with concentration in intermediate classes (~10–15 m), indicating that recruitment of broadleaved species achieved some degree of vertical development. In 2023, following the second harvest, a similar pattern persisted without clear evidence of progression into the upper canopy, suggesting that these species tend to occupy middle and lower strata, with limited structural dominance within the stand.
Crown density, evaluated through the Kernel function, revealed clear differences among periods. In 2012, a bimodal distribution was observed, with peaks at ~5 m and ~15 m, likely reflecting older regeneration and remaining intermediate trees. In 2022, the curve shifted to a unimodal and symmetrical distribution, with a single dominant peak (~10 m), indicating uniformity in crown cover of broadleaved species, directly associated with canopy openings created by silvicultural treatment. By 2023, this trend persisted, with the profile slightly displaced toward greater heights, although still not reaching the upper strata. This behavior suggests that broadleaved species were adequately managed under the selection treatment as they contributed primarily to the mid-canopy cover, playing a secondary role in the vertical architecture of the forest.
3.4. Pretzsch Verticality Index for All Species
The analysis of vertical structure using Pretzsch’s A index shows that individual selection management favored a stable and functional vertical complexity in the forest. In 2012, following the first harvest, the A index was 2.34, with an Amax of 3.40, resulting in an Arel of 68.75%. By 2022, prior to the second harvest, A increased to 3.50 and Arel to 68.79%, reflecting structural advancement driven by advanced regeneration. In 2023, after the second harvest, A remained at 3.50 with an Arel of 77.53%, indicating that the intervention did not reduce the achieved vertical stratification. These values confirm that selective management allowed for the maintenance of a multi-layered structure, promoting a balance between timber extraction and the conservation of key ecological functions.
Regarding the analysis of stratified vertical structure with the Pretzsch index, it was found that between 2012 and 2023, the upper stratum showed a moderate increase in its structural contribution, rising from 4.77% in 2012 to 7.37% in 2022 and remaining stable in 2023.
P. durangensis consistently emerged as the dominant species, with secondary contributions from
P. strobiformis and
Q. sideroxyla. This pattern demonstrates that selection silviculture has been effective in conserving emergent trees of structural and ecological value without compromising upper canopy cover after harvesting, as shown in
Table 1.
The middle stratum showed a progressive reduction, decreasing from 34.42% in 2012 to 24.08% in both 2022 and 2023. This decline was interpreted as the result of previously intermediate individuals ascending into the upper stratum, particularly conifers such as P. durangensis and P. strobiformis. Despite the reduction in proportion, its composition remained stable, indicating that management promoted vertical development without fragmenting this transitional stratum, which is essential for the structural continuity of the forest.
Finally, the lower stratum was the most representative throughout the three periods, increasing from 60.80% in 2012 to 68.56% in 2022 and remaining stable in 2023. This increase reflects active recruitment and the consolidation of advanced regeneration, with a significant contribution of
P. strobiformis over other species, as shown in the Sankey diagram in
Figure 7. The stability in density and diversity of this stratum suggests that selective management allows for the maintenance of suitable conditions for natural succession, ensuring long-term stand sustainability.
Figure 8 presents a three-dimensional simulation of the vertical structure of the forest evaluated for the years 2012, 2022, and 2023. This tool allows for the visualization of the effects of individual selection management on the vertical organization of the stand; at the same time, it integrates species diversity, height stratification, spatial distribution, and the persistence or recruitment of individuals.
In 2012, following the first harvest, the forest exhibited a less dense structure, with clear dominance of P. durangensis in the upper stratum (E1). The Arel value was 68.75%, indicating an intermediate level of vertical stratification, resulting from a selection treatment that preserved dominant trees while allowing for some development in the lower strata.
By 2022, prior to the second silvicultural intervention, a notable increase in structural diversity was evident, with greater representation of broadleaved species in the lower (E3) and middle (E2) strata, such as A. xalapensis, Q. rugosa, and J. deppeana. This increase in complexity was reflected in an A value of 2.6881 and an Arel of 76.88%, denoting structural improvement generated by natural recruitment between harvests.
In 2023, after the second harvest, the structure remained complex and stratified, with emergent species retained in the upper canopy and advanced regeneration established in the lower strata. Although the A value decreased slightly to 2.7109, Arel increased to 77.53%, showing that the second harvest did not negatively affect vertical organization but instead consolidated the coexistence of different functional groups. These results confirm that the selection method has promoted a balance between timber production and the conservation of the ecological structure of the forest.
3.5. Pretzsch Verticality Index for Conifers
Figure 9 shows the vertical distribution of conifer species in the studied forest, classified using the Pretzsch index for the years 2012, 2022, and 2023, within the context of forest management under the selection method.
In the upper stratum (I), corresponding to 80–100% of total height,
Pinus durangensis was the only species with sustained presence, reaffirming its ecological role as the dominant species. Its proportion increased after the first intervention (from 5.25% to 7.87%) and stabilized in 2023 (7.34%), suggesting structural consistency in response to selective harvests. In the middle stratum [
35], covering 50–80% of total height,
P. durangensis and
P. strobiformis showed shifts in dominance.
P. durangensis exhibited a progressive reduction in this stratum, whereas
P. strobiformis maintained a constant contribution, reflecting a natural and controlled adjustment in mid-canopy composition following silvicultural interventions. Finally, the lower stratum (III), corresponding to 0–50% of total height, revealed greater structural heterogeneity, characterized by the continuous presence of
J. deppeana,
P. chihuahuana, and
P. arizonica, species typically associated with this layer. The notable increase in
P. strobiformis in this stratum during 2023 (33.92%) suggests active regeneration favored by the light and space conditions generated by selective harvesting, pointing to a potential future shift in canopy structure.
3.6. Pretzsch Verticality Index for Broadleaved Species
Figure 10 shows the vertical distribution of broadleaved species evaluated using the Pretzsch index for the years 2012, 2022, and 2023, allowing for the identification of structural changes associated with selective management.
In the upper stratum (I), the presence of broadleaved species was scarce and inconsistent. Only
Q. sideroxyla and
Q. laeta reached this level, albeit in low proportions, indicating that these species rarely attain the dominant canopy, likely due to physiological limitations compared with more competitive conifer species. In the middle stratum [
35], greater participation of
Q. sideroxyla and
Q. laevis was observed, with increases in their relative representation over time. This trend suggests that some broadleaved species have a moderate capacity for upward progression under disturbance conditions, occupying intermediate canopy positions. Finally, the lower stratum (III) exhibited the greatest diversity and structural dominance of broadleaved species. This pattern reflects a clear ecological specialization of these species, with adaptations to shade and competition. The persistence of species such as
A. xalapensis,
Alnus acuminata, and
Q. rugosa in this stratum confirms their role as stable components of the lower layer.
4. Discussion
4.1. Vertical Profiles and Statistical Analysis of Species Groups
The analysis of vertical profiles revealed significant differences in height distribution among species (Kruskal–Wallis, p < 0.05) across the three evaluation periods, confirming the persistence of a stratified and functional structure under selection management. In 2012, after the first harvest, P. durangensis, P. arizonica, and Q. laeta dominated the upper canopy, while J. deppeana, A. xalapensis, and P. chihuahuana remained in the lower strata. By 2022, prior to the second harvest, vertical differentiation had increased, with the upward progression of intermediate species such as A. acuminata and P. strobiformis, indicating a cohort turnover driven by canopy gaps and greater light availability. In 2023, after the second intervention, the same pattern persisted, with a marked contrast between conifers and broadleaved species, reflecting stable functional and structural segregation.
Our results are consistent with those reported by Sumida et al. (2013) and Aiba et al. (2013) [
35,
36], who emphasize that an open upper canopy favors the regeneration of shade-intolerant conifers, and that the conical and deep crown morphology of these species allows them to maintain dominance in the upper stratum. In this context, the selection method operates as a controlled disturbance, able to open light niches without compromising the structural continuity of the forest.
According to Jin & Qian (2023) and Béland & Baldocchi (2021) [
37,
38], the upward progression of intermediate species and the persistence of broadleaved species in the lower strata demonstrate a dynamic balance between the conservation of dominant trees, the release of individuals with potential for upward growth, and the consolidation of advanced regeneration. In this study, we found that the resulting multi-layered structure ensures functional coexistence among groups, enhances ecological resilience, and contributes to the long-term productive sustainability of the stand. Studies conducted in Chile have also highlighted light as one of the main factors influencing the development of vertical forest structure [
39,
40,
41]. These studies propose that the complementarity of light use among plants plays a predominant role in determining height distribution within the canopy. In the case of secondary forests, their stratifications are typically composed of an understory layer dominated by shade-tolerant species and an overstory composed of shade-intolerant species [
42].
Notably, the recruitment observed in 2022 was translated in 2023 into vertical advancement of previously established individuals, particularly among mid-height conifers. This process evidences a functional cohort turnover, whereby individuals from intermediate diameter classes progressively attain dominant positions, strengthening the structural continuity of the forest.
From a management perspective, the results indicate that the application of the individual selection system between 2012 and 2023 has effectively maintained the structural and ecological integrity of the stand. This system has promoted the conservation of dominant trees, particularly emergent individuals of high ecological and commercial value such as P. durangensis and P. arizonica, which act as seed sources, structural elements, and biodiversity refuges. At the same time, the selective removal of intermediate, subdominant, or defective trees has reduced competition for resources, facilitating the vertical progression of previously established individuals in lower classes. This pattern suggests a silvicultural strategy aimed at the progressive improvement of the forest in terms of both productivity and structural complexity.
Analysis of vertical profiles across the three evaluated stages revealed clear and persistent stratification, confirming the presence of a complex, multi-layered forest structure in this temperate conifer–broadleaf ecosystem. This structural pattern is characteristic of advanced successional stages and reflects functional coexistence among species with distinct ecological requirements.
4.2. Dasometric Characteristics of the Vertical Structure of Conifer Species
Dasometric results showed a significant curvilinear relationship between DBH and total height in conifers, confirming a structurally coherent growth trajectory over time. This functional stability, even under management, is consistent with the findings of Soares & Tomé (2002) and Trincado & Leal (2006) [
43,
44], who emphasize that the height–diameter relationship is key for estimating volume and defining silvicultural treatments. Likewise, its utility in growth projection models by Sharma & Parton (2007) and Santiago-García (2017) [
45,
46] reinforces the importance of maintaining this structural consistency in managed stands. The greater dispersion observed at higher values during 2022 and 2023 suggests the coexistence of dominant trees and new cohorts, reflecting an active but predictable vertical dynamic consistent with regeneration processes under selection systems.
The evolution of height and crown distributions demonstrates a structural transition aligned with the principles of selection management. The height–diameter relationship also showed high allometric consistency in conifers (R
2 ≈ 0.78–0.80; r > 0.85) compared with lower fit in broadleaved species. In 2012, both patterns displayed unimodal distributions concentrated in intermediate classes (~15 m), characteristic of a recently harvested forest with a simplified vertical structure. By 2022, the shift toward higher classes in the height histogram, along with the appearance of a second crown mode (~10 m), reflected the upward progression of recruited cohorts, likely favored by canopy openings. In 2023, clear bimodality in both variables (peaks at ~10 m and ~20 m) confirmed the presence of a multi-layered system in which dominant trees coexist with advanced regeneration. This pattern is typical of forests managed under selection, where bimodality in the vertical profile reflects structural functionality and ecological continuity [
47,
48].
Furthermore, previous studies have shown that forest stands evolve from homogeneous structures toward more complex architectures, with multiple cohorts coexisting as time since the last intervention increases [
49,
50,
51]. The gradual replacement of pioneer species by shade-tolerant species in Bergeron (2000) [
52] also contributes to this stratification, reinforcing the functional stability of the canopy. Chai et al. (2023) [
53] emphasized that explicitly accounting for vertical stratification is a key factor in sustaining diversity stability within forest communities. Our findings support this view, as the differentiation into height strata not only reflects the coexistence of species with contrasting life-history strategies and shade tolerances, but also enhances the efficient use of three-dimensional canopy space. This structural arrangement reduces direct competition for resources and underpins the ecological mechanisms that maintain long-term community stability.
4.3. Dasometric Characteristics of the Vertical Structure of Broadleaved Species
The DBH–height relationship in broadleaved species showed a positive and significant trend across the three periods, although with greater dispersion than in conifers. This relationship (R
2 ≈ 0.55–0.57) highlights the morphological plasticity and structural heterogeneity of broadleaved species, suggesting that management strategies are functionally effective for this group. Dispersion was particularly evident in large-diameter trees, as also reported by Song & Zeng (2024) [
54]. The higher variability in the DBH–height relationship compared with conifers, especially among larger individuals, suggests a more variable architecture, likely attributable to interspecific differences and greater morphological plasticity [
10]. This behavior is common in shade-tolerant or slow-growing species that do not prioritize vertical height as a competitive strategy.
The height distribution of broadleaved species evolved from an asymmetric pattern in 2012, dominated by lower height classes, toward a stable concentration in intermediate heights (~10–15 m) in 2022 and 2023. This pattern reflects their persistent role in the middle and lower forest strata. Recent studies in temperate forests indicate that shade-tolerant species tend to remain in the intermediate strata under selection management without assuming dominance in the upper canopy [
55,
56,
57]. This structural trend is reinforced by the functional role of broadleaved species. According to Kneeshaw & Prévost (2007) [
58], these species maximize efficiency under reduced light conditions, which limits their vertical progression. Similarly, Chai et al. (2023) [
53], studying mixed forests, confirmed that the middle and lower strata are consistently occupied by angiosperm species, contributing to stand stability and biodiversity without vertically competing with conifers.
Consistently, our crown density analysis showed a bimodal distribution in 2012, which agrees with the findings of Oyarzún-Quezada (2016) [
25] in an old-growth forest in Chile. This pattern suggests the coexistence of older and younger cohorts within the stand. By 2022 and 2023, however, the distribution shifted to a unimodal curve centered around ~10 m, indicating a structural reorganization toward greater homogeneity in the mid-canopy. Such a transition from bimodality to unimodality highlights the effects of selection management in promoting stable regeneration layers while reinforcing the secondary structural role of broadleaved species.
4.4. Pretzsch Verticality Index for All Species
The Pretzsch verticality index in our study showed that individual selection management maintained a complex and stable vertical forest structure, consistent with findings reported by other authors working in the Sierra Madre Occidental [
7,
20,
59]. The Arel index was 68.75% in 2012, increased slightly to 68.79% in 2022, and reached 77.53% in 2023, indicating that the second harvest did not reduce stratification but rather consolidated it.
Between 2012 and 2023, the upper stratum increased its proportion from 4.77% to 7.37%, with
P. durangensis as the dominant species, consistent with Rascón-Solano et al. (2022) [
20], who described it as the most representative and dominant species in the forests of this region of Mexico. The middle stratum declined from 34.42% to 24.08%, reflecting the upward progression of previously intermediate individuals. The lower stratum remained the most representative across the three years, increasing from 60.80% to 68.56%, evidencing active and sustained recruitment, a pattern also characteristic of heterogeneous forests under planned management.
Overall, our results indicate that the silvicultural treatment simultaneously favored both production and conservation, ensuring a functional and resilient structure over time. The nearly 10% increase in Arel demonstrates that the second harvest not only preserved vertical stratification but also strengthened it globally. This confirms that selection management has successfully balanced timber extraction with conservation, fostering a resilient canopy with multiple cohorts coexisting [
10,
23].
4.5. Pretzsch Verticality Index for Conifer Species
The vertical structure of conifers under selection management showed a clear hierarchical pattern:
Pinus durangensis consistently dominated the upper stratum, while
P. strobiformis and other species such as
J. deppeana,
P. chihuahuana, and
P. arizonica occupied the middle and lower strata. This pattern stabilized after the second harvest, indicating that management allowed the conservation of key trees while favoring recruitment. Studies such as Racine et al. (2021) [
60] have demonstrated that stand vertical structure depends on both species and age, showing that some broadleaved species display more uniform distributions, whereas others concentrate within certain vertical segments, as is the case of conifers, which is directly related to their growth form and structural role. This agrees with our results, in which conifers exhibited vertical segregation associated with their functional role in the canopy. Similarly, research on multi-layered stand structures highlights that the mixture of sizes and species responds to management practices aimed at conserving key structural trees while simultaneously promoting regeneration [
61].
4.6. Pretzsch Verticality Index for Broadleaved Species
Broadleaved species remained concentrated in the lower stratum, where
Arbutus xalapensis,
Alnus acuminata, and
Quercus rugosa showed dominance, reflecting their adaptation to shaded conditions.
Quercus sideroxyla and
Q. laeta gradually increased their presence in the middle stratum but maintained only a marginal presence in the upper canopy, revealing their limited vertical competitiveness compared to conifers [
55].
This pattern is consistent with findings in boreal mixed forests, where differences in shade tolerance, longevity, and light requirements facilitate vertical stratification and coexistence between conifers and broadleaved species, particularly when disturbances generate canopy gaps of varying sizes [
58]. In addition, studies using LiDAR data have confirmed that the intermediate and lower vertical structure of angiosperm species is typical of multi-layered systems [
60].
5. Conclusions
The analysis of vertical profiles and the Kruskal–Wallis test revealed significant differences in height distribution among species. Dominant conifers such as P. durangensis and P. arizonica clustered in the upper strata, whereas species such as J. deppeana and Q. rugosa were concentrated in the lower strata. These patterns reflect vertical segregation driven by shade tolerance and differentiated ecological strategies, consolidating a multi-layered structure promoted by silvicultural management.
Conifers exhibited a stronger height–diameter relationship and a bimodal distribution of crown density, with a clear presence of emergent trees and advanced regeneration. Broadleaved species, in contrast, were mainly concentrated in the lower strata, showing more homogeneous crown forms and lower relative height. This morpho-structural differentiation allows for efficient use of vertical space and demonstrates functional coexistence between groups, favored by the applied selection method.
The values of the Pretzsch index (A, Amax, and Arel) indicate that the forest maintained significant vertical complexity during the three periods analyzed. The stability of Arel values (55–59%) shows that selective management not only preserves the existing vertical structure, but also promotes spatial reorganization and long-term structural recruitment, ensuring functional continuity of the ecosystem.
The spatial distribution of species reflected patterns associated with topographic gradients and local microclimatic conditions. Conifers were preferentially located in areas of higher altitude and moderate slope, while broadleaved species clustered in transitional zones or areas with higher soil moisture. This spatial heterogeneity confirms that vertical structure also responds to horizontal ecological processes, a relevant aspect for territorial planning and the design of differentiated silvicultural treatments.
The comparative analysis between 2013 and 2024 showed a slight increase in pine–oak and pure pine forest cover in the Sierra Madre Occidental. This growth may be linked to the progressive implementation of sustainable forest management practices, such as the selection method, which favor natural regeneration without compromising vertical structure. The results also indicate regional stability in forest cover, reinforcing the value of these strategies for conservation and the productive use of forest landscapes.
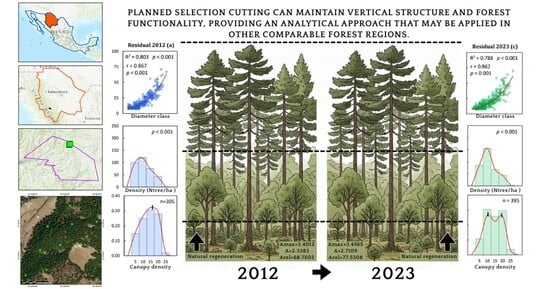
Overall, the results of this study confirm that the application of selective cutting under the selection method promotes the conservation and reorganization of forest vertical structure, maintaining dominant trees in the upper canopy while fostering the progressive incorporation of younger individuals. This structural dynamic ensures continuous and functional crown cover, with positive effects on natural regeneration, soil protection, and microclimatic stability. Given its effectiveness, this analytical approach is transferable to other temperate forest regions with similar structural characteristics, such as multiple strata, dominant conifers, and tree recruitment, consolidating its potential as a viable tool for sustainable forest management in conservation–production contexts.


 ,
, 


