Article

DNA Barcoding Reveals a Critical Spawning Ground in the Paranapanema River Basin, Southern Brazil

by
Thiago S. Depintor
1,*,
Wilson Frantine-Silva
2,3,
Mario L. Orsi
4 and
Fernanda S. Almeida
3
1
Departamento de Biologia da Faculdade de Filosofia Ciências e Letras de Ribeirão Preto, Universidade de São Paulo, Ribeirão Preto 14049-900, SP, Brazil
2
Colegiado de Ciências Biológicas, Universidade Estadual do Norte do Paraná, Cornélio Procópio 86304-028, PR, Brazil
3
Departamento de Biologia Geral do Centro de Ciências Biológicas, Universidade Estadual de Londrina, Londrina 86057-970, PR, Brazil
4
Departamento de Biologia Animal e Vegetal do Centro de Ciências Biológicas, Universidade Estadual de Londrina, Londrina 86057-970, PR, Brazil
*
Author to whom correspondence should be addressed.
Ecologies 2025, 6(3), 59; https://doi.org/10.3390/ecologies6030059
Submission received: 24 April 2025 / Revised: 24 July 2025 / Accepted: 15 August 2025 / Published: 2 September 2025
(This article belongs to the Special Issue The Ecology of Rivers, Floodplains and Oxbow Lakes)

Abstract

Hydropower plants have significant impacts on aquatic biodiversity, particularly on migratory fish species. Effectively managing these impacts requires a comprehensive understanding of fish reproduction and recruitment within altered river systems, which can be assessed through ichthyoplankton studies. However, traditional morphological methods for identifying fish eggs and larvae present considerable challenges due to morphological ambiguity and developmental constraints. In this study, we applied DNA barcoding to characterize the ichthyoplankton community within a relictual lotic stretch downstream of the Capivara Dam, located on the Paranapanema River in Southern Brazil. Cytochrome oxidase I (COI) gene sequences from 79 samples were compared against the Barcode of Life Data System (BOLD) and GenBank databases, resulting in successful species-level identification for all samples, each exhibiting around 99.8% similarity. The identified specimens comprised eight species, six genera, four families, and two orders. Species from the order Siluriformes accounted for 60.5% of the total abundance, predominantly including migratory species such as Pimelodus ornatus, Pimelodus maculatus, Leporinus friderici, and Pinirampus pirinampu, the latter a species rarely observed in the basin. These findings highlight the importance of lotic stretches as spawning grounds and emphasize the need for their conservation. DNA barcoding proved to be an efficient method for species identification, providing essential data for environmental assessments and conservation strategies targeting local fish populations.

Graphical Abstract

1. Introduction

Aquatic ecosystems worldwide face significant pressures from human activities, including habitat fragmentation caused by damming and reservoir construction; pollution from industrial, agricultural, and urban sources; and substantial alterations to natural flow regimes [1,2,3,4]. In Neotropical regions, where riverine systems support exceptionally high biodiversity and exhibit complex ecological interactions, these pressures are particularly pronounced and challenging to manage [5].
While dams provide essential socioeconomic benefits, including hydroelectric power generation and flood control, their ecological impacts are extensive, often severely disrupting local and regional biodiversity patterns [6,7]. Water impoundment results in reservoir formation, often causing thermal stratification that depletes oxygen in deeper layers. The downstream release of this cold, oxygen-poor water creates unfavorable conditions for native fish species adapted to specific temperature and oxygen regimes [8]. Additionally, stagnant water conditions can promote algal blooms and increase water temperatures, further degrading water quality [9]. Dams also significantly modify the natural flow patterns of rivers, affecting the timing, magnitude, and duration of flows. These alterations can disrupt spawning cues, reduce the availability of suitable habitats, and affect the transport of nutrients and sediments essential for maintaining productive ecosystems. The resulting habitat fragmentation profoundly affects fish communities by disrupting migratory routes and altering spawning dynamics, recruitment processes, and gene flow among populations [10,11,12]. Agostinho and colleagues [5] report that dams in the Upper Paraná River basin have dramatically altered fish diversity and that populations of rheophilic and long-distance migratory species may collapse or even disappear in intensely regulated river stretches.
To mitigate these ecological impacts, environmental management strategies have historically relied on restocking programs involving native species. However, the effectiveness of such initiatives remains questionable, often producing unintended ecological outcomes, including the establishment of non-native species and alterations in community structure [5]. Given these limitations, modern conservation approaches increasingly emphasize habitat protection, ecological monitoring, and the identification of critical spawning and nursery grounds, especially within areas directly affected by reservoir construction [13,14]. In particular, ichthyoplankton surveys represent a valuable approach for monitoring reproductive activity and habitat suitability, as quantifying early life stages provides direct evidence of successful spawning and recruitment [15,16].
Nevertheless, the morphological identification of ichthyoplankton is constrained by several challenges, including the absence or poor development of morphological features in eggs and early larvae, which limits taxonomic resolution. Additionally, the scarcity of taxonomic specialists and the inherent complexity of species-rich communities further exacerbate these difficulties, particularly in biodiverse Neotropical regions [14,15]. Consequently, relying solely on morphological identification can result in incomplete or inaccurate biodiversity assessments, hindering effective conservation and management efforts. Methodological advances in molecular identification, such as DNA barcoding, have provided robust and reliable alternatives capable of overcoming most of the limitations of traditional morphological methods [17,18]. DNA barcoding, which utilizes standardized fragments of mitochondrial DNA (cytochrome oxidase subunit I, COI), enables accurate species-level identification across a variety of scenarios [11,16,19]. Numerous studies in South American rivers have demonstrated the precision, efficiency, and reliability of DNA barcoding, making it a preferred approach for biodiversity assessments and ecological monitoring of fish communities, especially at early developmental stages [16,20].
Despite the increased application of molecular techniques, critical knowledge gaps remain regarding the ecological significance and conservation value of small, relictual lotic segments within heavily dammed river systems. Although dams commonly transform extensive river reaches from lotic to lentic habitats, relictual lotic segments persist in many regulated systems and may maintain ecological conditions favorable for the spawning and recruitment of migratory and threatened fish species. However, the functional role and conservation importance of these residual habitats remain insufficiently investigated, particularly in Neotropical contexts. In this study, we employed DNA barcoding to investigate the ichthyoplankton community structure within a lotic segment associated with the Capivara Dam, located on the Paranapanema River in Southern Brazil. Specifically, our research aimed to determine whether this residual lotic area retains its ecological function as a viable spawning habitat for migratory and threatened fish species, thereby providing critical baseline data for biodiversity conservation and management strategies in reservoir-impacted river systems. Through this molecular-based assessment, we sought to illuminate the broader ecological roles of these remnant lotic habitats, addressing a key gap in our understanding of riverine ecosystem resilience under substantial anthropogenic pressure.

2. Materials and Methods

2.1. Area of Study

The Capivara Dam is a hydroelectric facility with a height of 59 m, creating a large reservoir with a surface area of approximately 515 square kilometers and a total capacity of around 10.54 billion cubic meters (Figure 1A). Samples of fish eggs and larvae were collected from a lotic stretch of the Capivara Reservoir in the Jataizinho Stream, a tributary of the Tibagi River, located in the Paranapanema Basin (23°16′05.30′′ S; 50°57′19.29′′ O) (Figure 1B). The site was specifically selected due to its flowing water habitat, potentially suitable for spawning by migratory fish species. Sampling was conducted during the main reproductive season for the regional fish fauna, known as Piracema, extending from November to March over two consecutive years.

2.2. Ichthyoplankton Sampling and Screening

For the collection of ichthyoplankton samples, two plankton nets were employed. Each net measured 1.6 m in length and featured a mesh size of 0.5 mm, suitable for capturing fish eggs and larvae while allowing smaller particles to pass through. During sampling, the nets were deployed at a depth of approximately 20 cm below the water surface, specifically targeting the upper water column where fish eggs are commonly found. Three sampling sites, each spaced 100 m apart within the same stretch of the river, were surveyed during the reproductive season, between September and March of 2013 and 2014. At each site, three replicate tows were conducted, each lasting ten minutes. This replication was designed to account for spatial variability and to ensure a representative collection of ichthyoplankton. A total of 79 samples were collected over the two-year study period. Immediately upon retrieval, the collected samples were transferred into containers filled with 98% ethanol, preventing enzymatic degradation, thus maintaining the integrity of DNA. The samples were then stored at −20 °C to further preserve their condition until laboratory processing. The preserved samples underwent examination under a stereomicroscope. This step involved sorting and identifying fish larvae based on morphological characteristics following Nakatani et al. [15], retaining all fish eggs. To maximize the diversity of larvae morphotypes analyzed, a subset of specimens was randomly selected following pre-classification. These selected eggs were photographed to document their morphology and then individually isolated for genetic analysis. All procedures involving the collection and handling of biological samples were conducted in accordance with ethical guidelines. The research protocol received approval from the Ethics Committee of the State University of Londrina (CEUA/UEL), under protocol number 29790.2012.39.

2.3. DNA Extraction

Individual fish eggs and larvae tissue were placed in 0.6 mL microtubes containing 100 µL of 10% Chelex resin (Bio-Rad, Hercules, CA, USA). Samples were thoroughly macerated with sterile scissors and pestles, followed by the addition of 2 µL of proteinase K. Tubes were incubated at 62–65 °C for 30 min, then briefly vortexed for 10 s, and subsequently heated in boiling water (100 °C) for 5 min to inactivate enzymes. Finally, tubes were centrifuged at 14,000 rpm for 3 min, and the clear supernatant containing extracted genomic DNA was carefully transferred and used directly as template in PCR reactions. The quality of the extracted DNA was initially assessed by electrophoresis on 1.2% agarose gel stained with SYBR Safe under UV light, verifying the presence of intact, high-molecular-weight DNA. DNA quantity was not determined by spectrophotometric or fluorometric methods due to the small amount of biological material in each sample. Instead, successful amplification of the COI target sequence via PCR was used as a functional proxy to confirm the presence and integrity of the DNA template.

2.4. Amplification, Purification, and Sequencing of COI

Amplification of a 648-base-pair fragment of the mitochondrial COI gene was performed using primers FishF1 (5′-TCA ACC AAC CAC AAA GAC ATT GGC AC-3′ and FishR1 (5′-TAG ACT TCT GGG TGG AAG CCA AAT CA-3′) as in Ward et al. [21], in an MJ Research PTC-100 thermocycler. The PCR cycling conditions consisted of an initial denaturation at 94 °C for 5 min, followed by 35 cycles of 94 °C for 30 s, 54 °C for 30 s, and 72 °C for 1 min, with a final extension at 72 °C for 10 min. Reactions were carried out in a final volume of 10 µL, containing 2× PCR Master Mix (Promega, Madison, WI, USA), 0.4 µM of each primer (FishF1 and FishR1), 15 ng of DNA, and water to complete the volume. The amplified product was visualized on a 1.2% agarose gel stained with 0.08 µL/mL SYBR Safe Gel Stain (Invitrogen, a brand of Thermo Fisher Scientific, Waltham, MA, USA) under UV light to assess amplification quality. The amplified products were purified by adding 0.5 µL of the Illustra Exo-Star 1-Step PCR Clean-Up Kit (Thermo Fisher Scientific, Waltham, MA, USA). The purified samples were sequenced in reactions containing 1 µL of 1× BigDye buffer (400 mM Tris-HCl, pH 9.0, and 10 mM MgCl2), 2 µL of the BigDye Terminator v3.1 Cycle Sequencing Kit (Applied Biosystems, a brand of Thermo Fisher Scientific, Waltham, MA, USA), 2 µM of either FishF1 or FishR1 primer (in separate reactions), and water to complete the volume. The sequencing reactions were performed bidirectionally using an ABI Prism 3500XL automatic sequencer (Applied Biosystems, a brand of Thermo Fisher Scientific, Waltham, MA, USA). To ensure data integrity, a qualitative assessment of the electropherograms was performed using the Electropherogram Quality Analysis Software (available at http://lbi.cenargen.embrapa.br/phph/ accessed on 25 January 2025) [22], with sequence ends trimmed where Phred scores were below 20.

2.5. Sequence Data Analysis

The sequences were submitted to the Barcode of Life Data System (BOLD) under the project PDJA and compared using the BOLD Identification System (BOLD-IDS) [23]. In parallel, sequences were also compared against the GenBank database using BLASTn searches. Species-level identification was accepted when sequence similarity to a reference sequence was equal to or greater than 98%, following established barcoding thresholds for fish species [17]. In cases where similarity was below 98% or conflicting between BOLD and GenBank results, the identification was considered inconclusive, and the specimen was assigned at genus or family level only. Subsequently, the sequences with the highest matches for each taxon were included in the analysis of intraspecific and interspecific genetic distances, based on the Kimura 2-Parameter model (K2P) [24]. The same model was applied to construct a Neighbor-Joining tree to illustrate the genetic distances between taxa. To support species-level identifications, we also calculated the Nearest Neighbor Distance, which represents the genetic distance between a sequence and its closest match in the dataset, providing an estimate of how distinct one species is from its closest relative. All genetic distance analyses and Neighbor-Joining tree construction were performed using MEGA v5.0 [25], using 1000 bootstrap pseudoreplications. All sequences are available in the GenBank NCBI repository (accession numbers: PV960227–PV960305; see Supplementary Material).

3. Results

The sequences were trimmed to remove low-quality regions at the ends, avoiding potential interference in downstream analyses. After trimming, all sequences had a final length of 568 bp. Species-level identification was achieved for all 79 samples, with a minimum sequence similarity of 99.8% when compared against reference databases (Table 1). Initial identifications were performed using the Barcode of Life Data Systems (BOLD). In instances where additional confirmation was necessary, BLASTn searches, with the nucleotide sequences, were conducted within the GenBank (National Center for Biotechnology Information—NCBI) repository.
Eight different species, distributed across six genera, four families, and two orders, were identified. These species were as follows: Pimelodus microstoma (Steindachner, 1877), Pimelodus ornatus (Kner, 1858), Pimelodus maculatus (Lacepède, 1803), Iheringichthys labrosus (Lütken, 1874), Leporinus friderici (Bloch, 1794), Triportheus nematurus (Kner, 1858), Apareiodon affinis (Steindachner, 1879), and Pinirampus pirinampu (Spix & Agassiz, 1829). The most abundant species was Pimelodus ornatus, representing 43.04% of the total collected individuals, while the least abundant was Apareiodon affinis, with only a single specimen recorded (Table 1). The family Pimelodidae was the most representative, comprising five of the eight collected species. It was also the most abundant in terms of individual counts, making up 79.75% of the total collected samples.
Among the taxonomic orders, Siluriformes was the most dominant, comprising approximately 79.74% of the specimens, despite being represented by only one family. In contrast, Characiformes exhibited greater diversity, including three of the four identified families (Table 1). Within the identified species, 50% (4 out of 8) are migratory, as listed by ICMBio (Chico Mendes Institute for Biodiversity Conservation) [26], including the rarely recorded Pinirampus pirinampu in the Paranapanema River basin.
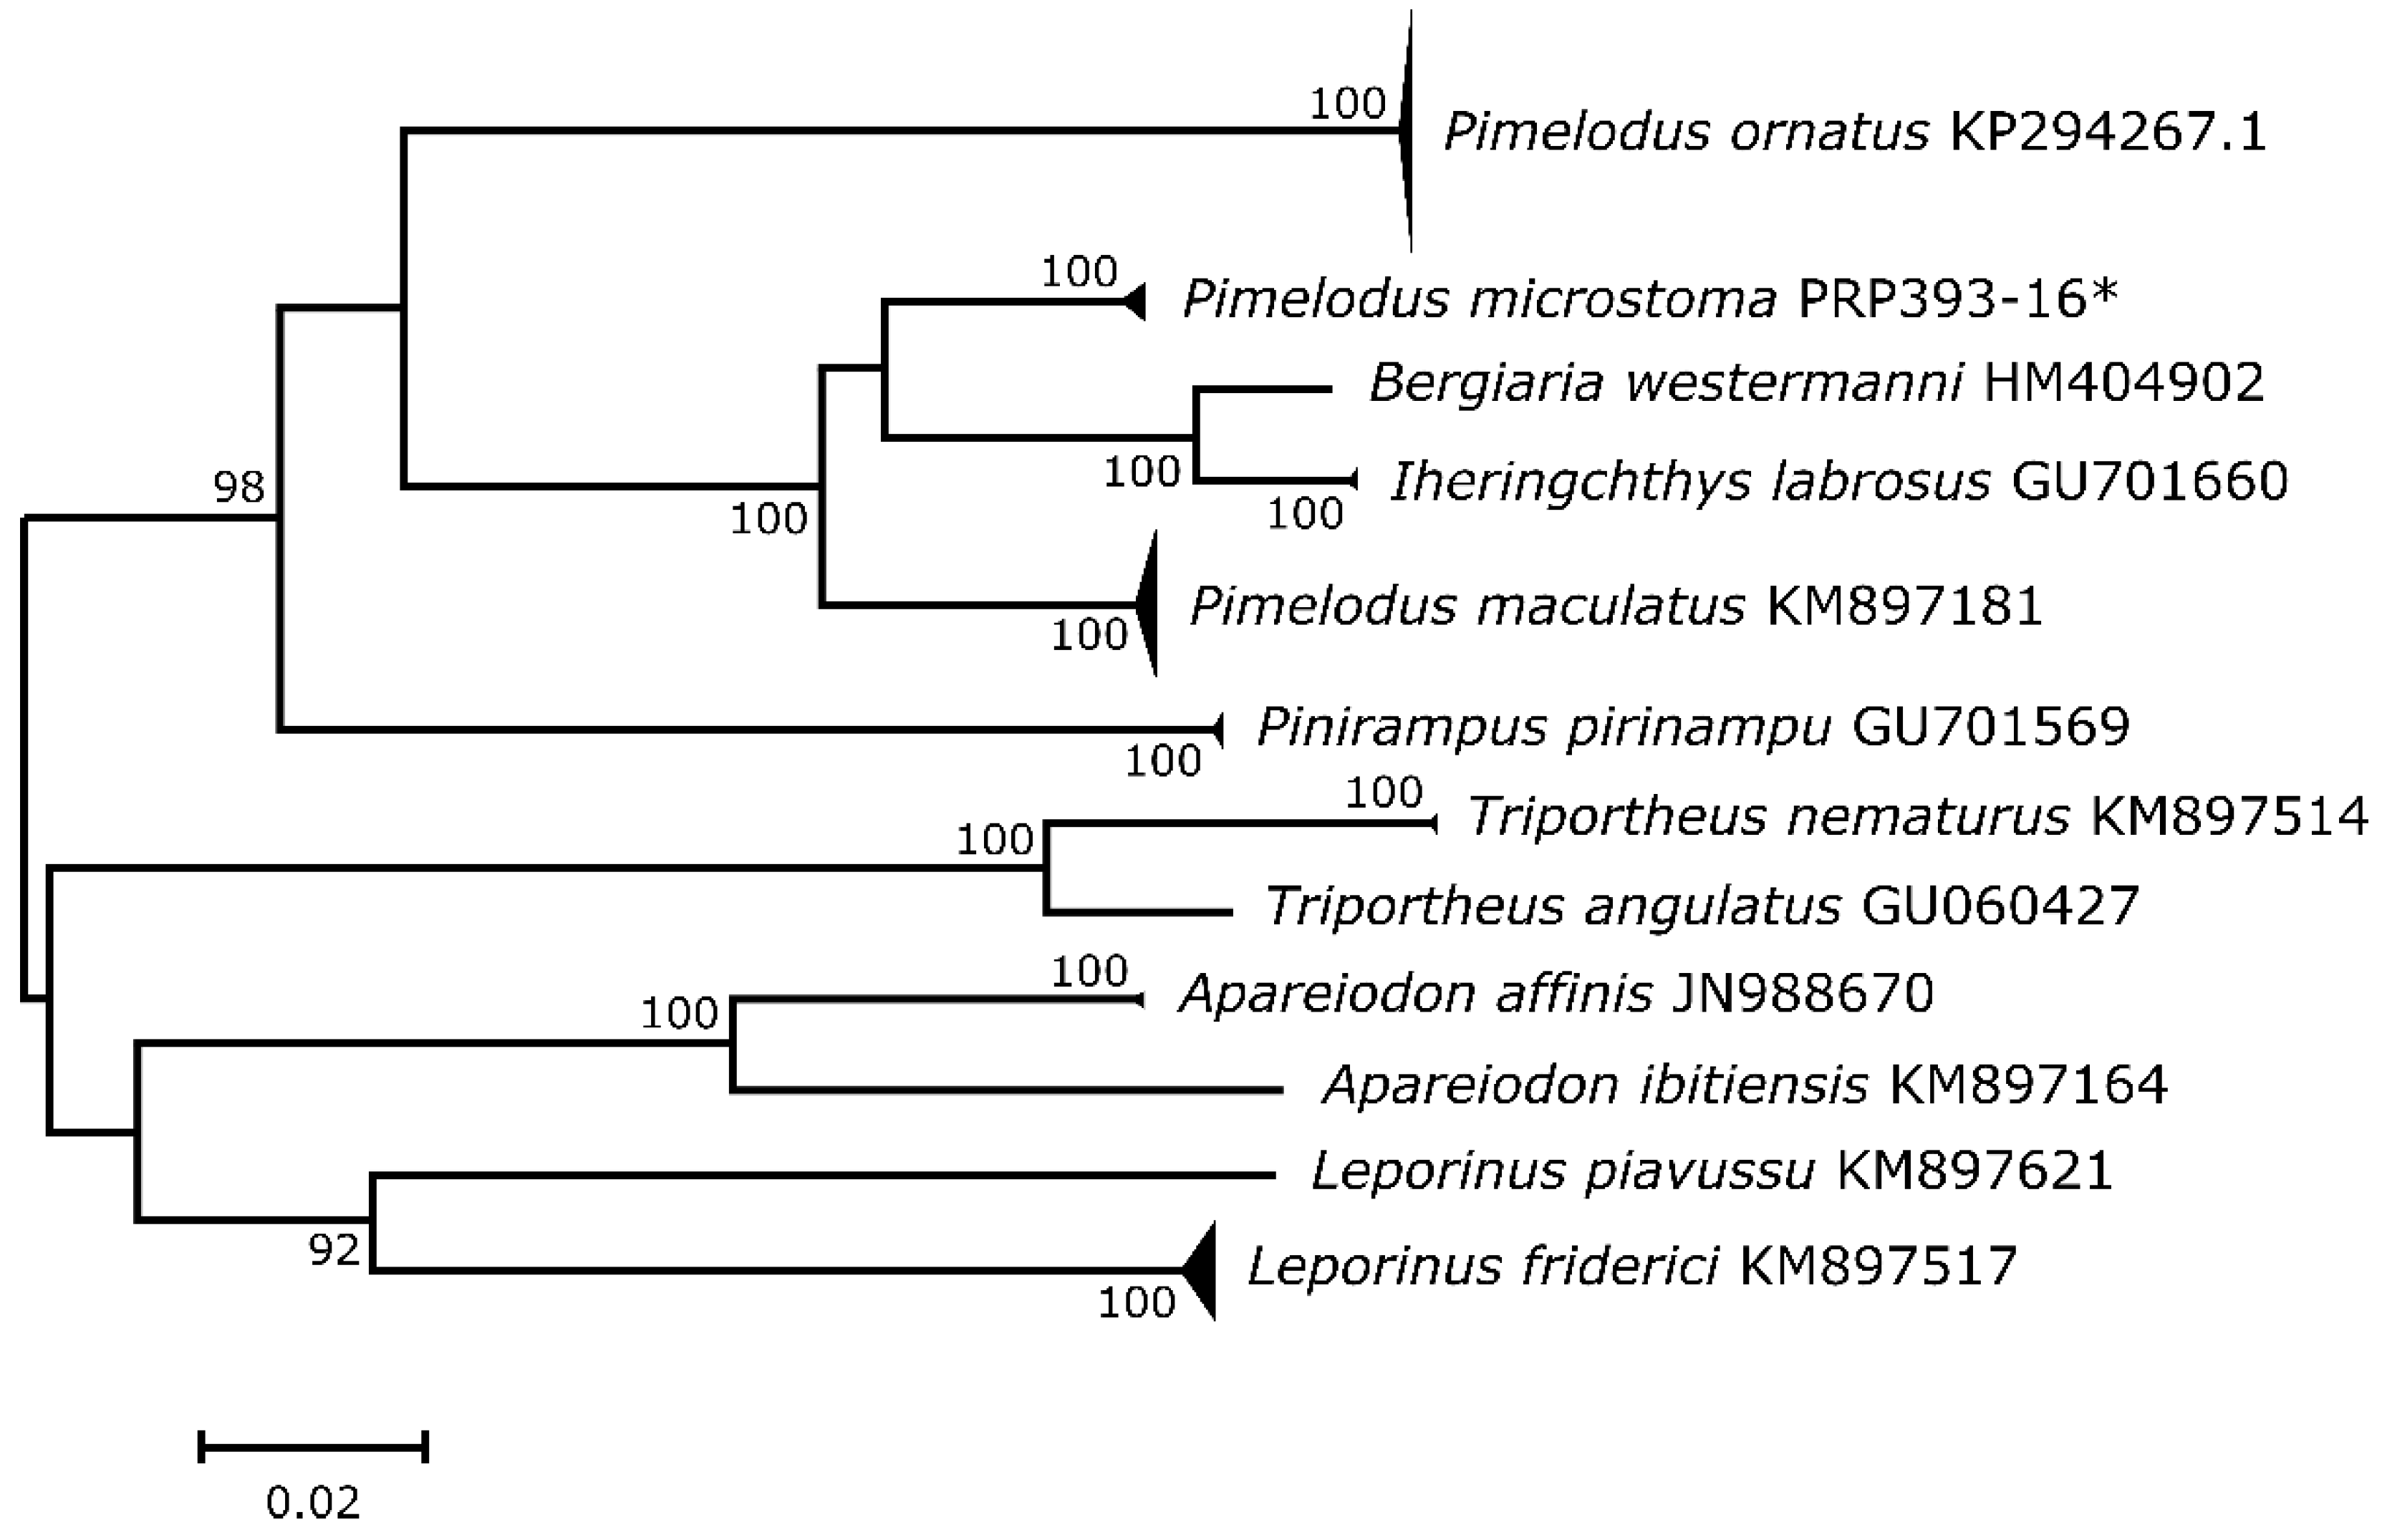
A simplified NJ phylogenetic tree was constructed using MEGA v5.0 software, employing the Kimura 2-Parameter model to analyze the genetic relationships among the sampled taxa. The resulting tree demonstrated clear delineation among species, with each forming distinct and well-supported clades. Notably, significant interspecific genetic distances were observed, exceeding 2%, even among congeneric species (Figure 2), underscoring the robustness of species-level differentiation. This threshold aligns with established benchmarks for species delimitation in DNA barcoding studies.
To enhance the visualization of phylogenetic relationships, the “Nearest Neighbor Distance” approach was applied, incorporating the closest taxon for each identified group. This method facilitated a more comprehensive understanding of the genetic proximity among taxa. The clustering patterns observed were consistent with taxonomic classifications, with individuals from the same family grouping cohesively within the same clade (Figure 2). Such congruence between molecular data and traditional taxonomy reinforces the validity of the phylogenetic inferences drawn from the NJ analysis.

4. Discussion

Our findings highlight the importance of lotic segments within reservoir-influenced ecosystems as critical spawning and nursery habitats for migratory and threatened fish species. The identification of migratory taxa [26] (including Pimelodus ornatus, Pimelodus maculatus, Leporinus friderici, and Pinirampus pirinampu) highlights that even small relictual lotic tributaries can hold substantial ecological value within heavily modified river systems. These migratory species accounted for 89.8% of the total individuals sampled (71 out of 79), reinforcing the role of such tributaries as functional refuges for migratory fish. These observations align with previous studies conducted in Neotropical regions, highlighting the essential role of relictual lotic habitats in supporting successful reproduction and maintaining the diversity of migratory species [11,12,19]. Additionally, this study expands the list of species previously recorded in the Tibagi River by Lima et al. [27] to include this important functional refuge, the Jataizinho Stream. Despite their seemingly environmentally friendly image, the ecological impacts of reservoirs constructed for hydropower purposes are numerous and well-documented, including the disruption of natural flow regimes, obstruction of migration pathways, and negative effects on reproductive success and recruitment dynamics [1,28]. However, our molecular analyses clearly demonstrate that reproductive activity persists in suitable lotic microhabitats. The dominance of migratory siluriform species in our ichthyoplankton samples underscores these species’ preference for habitats characterized by consistent flow and appropriate spawning substrates [10]. Indeed, lotic habitats adjacent to reservoirs may function as critical ecological refuges, where sensitive species encounter suitable conditions for reproduction, partially mitigating the negative impacts of reservoirs on fish biodiversity.
We documented the presence of Pinirampus pirinampu, a threatened species that is seldom recorded in ichthyofaunal surveys within the Paranapanema Basin [29]. Detecting early life stages of this species strongly suggests local reproductive activity and elevates the conservation priority of the Jataizinho Stream segment. Our study supports the concept that maintaining ecological connectivity through the conservation or restoration of relictual lotic segments, even small stretches, can significantly contribute to sustaining migratory fish populations at broader spatial scales [30,31]. The results presented here provide evidence that dammed systems are not necessarily detrimental to migratory fish communities. Rather, they suggest that preserving strategically important lotic segments within reservoir-impacted watersheds may enable threatened and migratory taxa to complete critical stages of their reproductive cycles successfully. Identifying such areas through reliable methods, as demonstrated here via DNA barcoding, can greatly enhance biodiversity management strategies and conservation outcomes. While this study provides important insights into the reproductive activity of migratory and threatened fish species in a reservoir-influenced lotic segment, it is important to acknowledge that sampling was conducted at a single site and without the inclusion of environmental variables such as water quality, flow regime, or habitat structure. This spatial and environmental limitation restricts the ability to fully assess how local abiotic conditions may influence ichthyoplankton distribution and spawning activity. Future research that expands spatial and temporal coverage and incorporates key environmental parameters could offer a broader understanding of spawning dynamics and habitat preferences. These complementary approaches would improve the ecological interpretation of ichthyoplankton patterns and support more refined conservation and management strategies in regulated river systems.
The application of DNA barcoding has proven particularly effective for identifying ichthyoplankton, which are notoriously challenging to classify using traditional morphological approaches, especially in highly biodiverse regions such as the Neotropics [16,18,20]. A threshold of 2% divergence in the COI gene was adopted to ensure reliable species delimitation. This threshold is widely accepted for fish species, as demonstrated by foundational studies [32] and reinforced by surveys of Neotropical ichthyofauna [33] and North American freshwater species [34]. A 2% divergence is considered sufficient to distinguish closely related species, particularly in taxa where morphological differences are subtle or cryptic [35,36]. By enabling accurate identification of ichthyoplankton, DNA barcoding significantly enhances our understanding of fish population dynamics and supports the sustainable management of aquatic resources.
Surveys of adult fish conducted in the lower Paranapanema and Tibagi rivers consistently record Leporinus friderici, Triportheus nematurus, Iheringichthys labrosus, Pimelodus maculatus, and other pimelodids occupying the main channel and adjacent floodplain habitats during the reproductive season [29,37]. The occurrence of eggs and larvae of these same taxa in the residual lotic reach downstream of Capivara Dam indicates that this stretch is being used as an alternative spawning site, likely compensating for migration barriers imposed by the reservoir. This spatial overlap between adult distributions reported in earlier studies [29] and the early-life stages detected here strengthens the view that even short lotic remnants can sustain key phases of migratory cycles, helping to maintain regional connectivity and genetic flow in an otherwise highly fragmented system.
This study illustrates how molecular techniques can improve our understanding of fish reproductive dynamics in river systems affected by human activity. The identification of ichthyoplankton in a key lotic habitat associated with the Capivara Reservoir underscores the ecological significance of these habitats for migratory and threatened fish species. While our findings support the use of molecular monitoring tools in conservation programs and underscore the importance of preserving lotic refuges within dam-regulated river systems, it is essential to acknowledge that these results are site-specific. Nevertheless, considering the fragmentation caused by dams, the targeted conservation of lotic habitats may play a critical role in sustaining fish reproduction. Future research that builds upon our framework, incorporating multi-site sampling and environmental data, will be essential to confirm these patterns and strengthen conservation planning and ecological management, ensuring the persistence of diverse and ecologically important fish populations in heavily regulated river basins.

Supplementary Materials

The following supporting information can be downloaded at https://www.mdpi.com/article/10.3390/ecologies6030059/s1.

Author Contributions

M.L.O., field collection; T.S.D. and W.F.-S., experiment and analysis design; T.S.D., W.F.-S. and F.S.A., writing; F.S.A., provision of reagents, materials and analysis tools; F.S.A. and M.L.O., study direction. All authors have read and agreed to the published version of the manuscript.

Funding

This research was supported by Duke Energy International Geração Paranapanema and the Coordenação de Aperfeiçoamento de Pessoal de Nível Superior (CAPES), financial code 001.

Institutional Review Board Statement

The research protocol received approval from the Ethics Committee of the State University of Londrina (CEUA/UEL), under protocol number 29790.2012.39.

Acknowledgments

We thank the State University of Londrina for the structure provided, and to the LEPIB folks for their great help during the field collection.

Conflicts of Interest

The authors declare that they have no financial conflicts of interest related to this study.

References

  1. Lehner, B.; Liermann, C.R.; Revenga, C.; Vorosmarty, C.; Fekete, B.; Crouzet, P.; Döll, P.; Endejan, M.; Frenken, K.; Magome, J.; et al. High-resolution mapping of the world’s reservoirs and dams for sustainable river-flow management. Front. Ecol. Environ. 2011, 9, 494–502. [Google Scholar] [CrossRef]
  2. Zarfl, C.; Lumsdon, A.E.; Berlekamp, J.; Tydecks, L.; Tockner, K. A global boom in hydropower dam construction. Aquat. Sci. 2015, 77, 161–170. [Google Scholar] [CrossRef]
  3. Wu, H.; Chen, J.; Xu, J.; Zeng, G.; Sang, L.; Liu, Q.; Yin, Z.; Dai, J.; Yin, D.; Liang, J.; et al. Effects of dam construction on biodiversity: A review. J. Clean. Prod. 2019, 221, 480–489. [Google Scholar] [CrossRef]
  4. Chucholl, F.; Chucholl, C. Differences in the functional responses of four invasive and one native crayfish species suggest invader-specific ecological impacts. Freshw. Biol. 2021, 66, 2051–2063. [Google Scholar] [CrossRef]
  5. Agostinho, A.A.; Pelicice, F.M.; Gomes, L.C. Dams and the fish fauna of the Neotropical region: Impacts and management related to diversity and fisheries. Braz. J. Biol. 2008, 68, 1119–1132. [Google Scholar] [CrossRef]
  6. Barbarossa, V.; Schmitt, R.J.; Huijbregts, M.A.; Zarfl, C.; King, H.; Schipper, A.M. Impacts of current and future large dams on the geographic range connectivity of freshwater fish worldwide. Proc. Natl. Acad. Sci. USA 2020, 117, 3648–3655. [Google Scholar] [CrossRef]
  7. Liu, X.; Olden, J.D.; Wu, R.; Ouyang, S.; Wu, X. Dam construction impacts fish biodiversity in a subtropical river network, China. Diversity 2022, 14, 476. [Google Scholar] [CrossRef]
  8. Liu, M.; Zhang, Y.; Shi, K.; Zhu, G.; Wu, Z.; Liu, M.; Zhang, Y. Thermal stratification dynamics in a large and deep subtropical reservoir revealed by high-frequency buoy data. Sci. Total Environ. 2019, 651, 614–624. [Google Scholar] [CrossRef] [PubMed]
  9. Posch, T.; Köster, O.; Salcher, M.M.; Pernthaler, J. Harmful filamentous cyanobacteria favoured by reduced water turnover with lake warming. Nat. Clim. Change 2012, 2, 809–813. [Google Scholar] [CrossRef]
  10. Dias, J.H.; Britto, S.G.C.; Vianna, N.C.; Garavello, J.C. Biological and ecological aspects of Pinirampus pirinampu (Spix, 1829), Siluriformes, Pimelodidae, Capivara Reservior, Paranapanema River, Southern Brazil. Acta Limnol. Brasiliensia 2004, 16, 293–304. [Google Scholar]
  11. Frantine-Silva, W.; Savada, C.S.; de Almeida, F.S.; Orsi, M.L. Polygynandry and high genetic diversity supported by kinship and population genetics from neotropical catfish ichthyoplankton. Ecol. Freshw. Fish 2023, 32, 406–415. [Google Scholar] [CrossRef]
  12. Ferreira, D.G.; Carlsson, J.; Galindo, B.A.; Frantine-Silva, W.; Apolinário-Silva, C.; Meschini, J.S.; Zanatta, A.S.; Almeida, F.S.; Sofia, S.H. The role of free-flowing tributary rivers in the maintenance of genetic diversity of a migratory fish species living in a river fragmented by dams. Hydrobiologia 2022, 849, 1221–1237. [Google Scholar] [CrossRef]
  13. Agostinho, A.A.; Gomes, L.C.; Latini, J.D. Fisheries management in Brazilian reservoirs: Lessons from/for South America. Interciencia 2004, 29, 334–338. [Google Scholar]
  14. Pegg, G.G.; Sinclair, B.; Briskey, L.; Aspden, W.J. MtDNA barcode identification of fish larvae in the southern Great Barrier Reef–Australia. Scientia Marina 2006, 70 (Suppl. 2), 7–12. [Google Scholar] [CrossRef]
  15. Nakatani, K. Ovos e Larvas de Peixes de Água Doce: Desenvolvimento e Manual de Identificação; EDUEM: Panama City, Brazil, 2001. [Google Scholar]
  16. Frantine-Silva, W.; Sofia, S.H.; Orsi, M.L.; Almeida, F.S. DNA barcoding of freshwater ichthyoplankton in the Neotropics as a tool for ecological monitoring. Mol. Ecol. Resour. 2015, 15, 1226–1237. [Google Scholar] [CrossRef]
  17. Hebert, P.D.; Cywinska, A.; Ball, S.L.; DeWaard, J.R. Biological identifications through DNA barcodes. Proc. R. Soc. Lond. Ser. B Biol. Sci. 2003, 270, 313–321. [Google Scholar] [CrossRef]
  18. Hajibabaei, M.; Singer, G.A.; Hebert, P.D.; Hickey, D.A. DNA barcoding: How it complements taxonomy, molecular phylogenetics and population genetics. Trends Genet. 2007, 23, 167–172. [Google Scholar] [CrossRef]
  19. Almeida, F.S.; Frantine-Silva, W.; Lima, S.C.; Garcia, D.A.; Orsi, M.L. DNA barcoding as a useful tool for identifying non-native species of freshwater ichthyoplankton in the neotropics. Hydrobiologia 2018, 817, 111–119. [Google Scholar] [CrossRef]
  20. Becker, R.A.; Sales, N.G.; Santos, G.M.; Santos, G.B.; Carvalho, D.C. DNA barcoding and morphological identification of neotropical ichthyoplankton from the Upper Paraná and São Francisco. J. Fish Biol. 2015, 87, 159–168. [Google Scholar] [CrossRef]
  21. Ward, R.D.; Zemlak, T.S.; Innes, B.H.; Last, P.R.; Hebert, P.D. DNA barcoding Australia’s fish species. Philos. Trans. R. Soc. B Biol. Sci. 2005, 360, 1847–1857. [Google Scholar] [CrossRef]
  22. Togawa, R.C.; Brigido, M.M. PHPH: Web based tool for simple electropherogram quality analysis. In Proceedings of the 1st International Conference on Bioinformatics and Computational Biology-IcoBiCoBi, Ribeirão Preto, Brazil, 14–16 May 2003. [Google Scholar]
  23. Ratnasingham, S.; Hebert, P.D. BOLD: The Barcode of Life Data System. Mol. Ecol. Notes 2007, 7, 355–364. [Google Scholar] [CrossRef] [PubMed]
  24. Kimura, M. A simple method for estimating evolutionary rates of base substitutions through comparative studies of nucleotide sequences. J. Mol. Evol. 1980, 16, 111–120. [Google Scholar] [CrossRef] [PubMed]
  25. Tamura, K.; Peterson, D.; Peterson, N.; Stecher, G.; Nei, M.; Kumar, S. MEGA5: Molecular evolutionary genetics analysis using maximum likelihood, evolutionary distance, and maximum parsimony methods. Mol. Biol. Evol. 2011, 28, 2731–2739. [Google Scholar] [CrossRef] [PubMed]
  26. ICMBio—Chico Mendes Institute for Biodiversity Conservation. Biodiversity Extinction Risk Assessment System—SALVE. Available online: https://salve.icmbio.gov.br/ (accessed on 16 July 2025).
  27. Lima, M.C.C.D.; Lima, S.C.; Savada, C.S.; Suzuki, K.M.; Orsi, M.L.; Almeida, F.S.D. Use of DNA barcode in the identification of fish eggs in tributaries of the Paranapanema River basin. Genet. Mol. Biol. 2020, 43, e20190352. [Google Scholar] [CrossRef]
  28. Alho, C.J. Hydropower dams and reservoirs and their impacts on Brazil’s biodiversity and natural habitats: A review. World J. Adv. Res. Rev. 2020, 6, 205–215. [Google Scholar] [CrossRef]
  29. Jarduli, L.R.; Garcia, D.A.Z.; Vidotto-Magnoni, A.P.; Casimiro, A.C.R.; Vianna, N.C.; de Almeida, F.S.; Jerep, F.C.; Orsi, M.L. Fish fauna from the Paranapanema River basin, Brazil. Biota Neotrop. 2019, 20, e20180707. [Google Scholar] [CrossRef]
  30. Montes-Rojas, A.; Delgado-Morales, N.A.J.; Escucha, R.S.; Siabatto, L.C.; Link, A. Recovering connectivity through restoration corridors in a fragmented landscape in the magdalena river’s valley in Colombia. Biodivers. Conserv. 2024, 33, 3171–3185. [Google Scholar] [CrossRef]
  31. Qiu, J.; Yuan, S.; Tang, H.; Zhang, Q.; Wolter, C.; Nikora, V. Ecological connectivity of river-lake ecosystem: Evidence from fish population dynamics in a connecting channel. Water Resour. Res. 2024, 60, e2024WR037495. [Google Scholar] [CrossRef]
  32. Ward, R.D. DNA barcode divergence among species and genera of birds and fishes. Mol. Ecol. Resour. 2009, 9, 1077–1085. [Google Scholar] [CrossRef]
  33. Pereira, L.H.; Hanner, R.; Foresti, F.; Oliveira, C. Can DNA barcoding accurately discriminate megadiverse Neotropical freshwater fish fauna? BMC Genet. 2013, 14, 20. [Google Scholar] [CrossRef]
  34. April, J.; Mayden, R.L.; Hanner, R.H.; Bernatchez, L. Genetic calibration of species diversity among North America’s freshwater fishes. Proc. Natl. Acad. Sci. USA 2011, 108, 10602–10607. [Google Scholar] [CrossRef]
  35. Crawford, A.J.; Cruz, C.; Griffith, E.; Ross, H.; Ibáñez, R.; Lips, K.R.; Driskell, A.C.; Bermingham, E.; Crump, P. DNA barcoding applied to ex situ tropical amphibian conservation programme reveals cryptic diversity in captive populations. Mol. Ecol. Resour. 2013, 13, 1005–1018. [Google Scholar] [CrossRef]
  36. Brasier, M.J.; Wiklund, H.; Neal, L.; Jeffreys, R.; Linse, K.; Ruhl, H.; Glover, A.G. DNA barcoding uncovers cryptic diversity in 50% of deep-sea Antarctic polychaetes. Royal Soc. Open Sci. 2016, 3, 160432. [Google Scholar] [CrossRef]
  37. Shibatta, O.A.; Gealh, A.M.; Bennemann, S.T. Ichthyofauna from the middle and upper stretches of rio Tibagi basin, Paraná, Brazil. Biota Neotrop. 2007, 7, 125–134. [Google Scholar] [CrossRef]
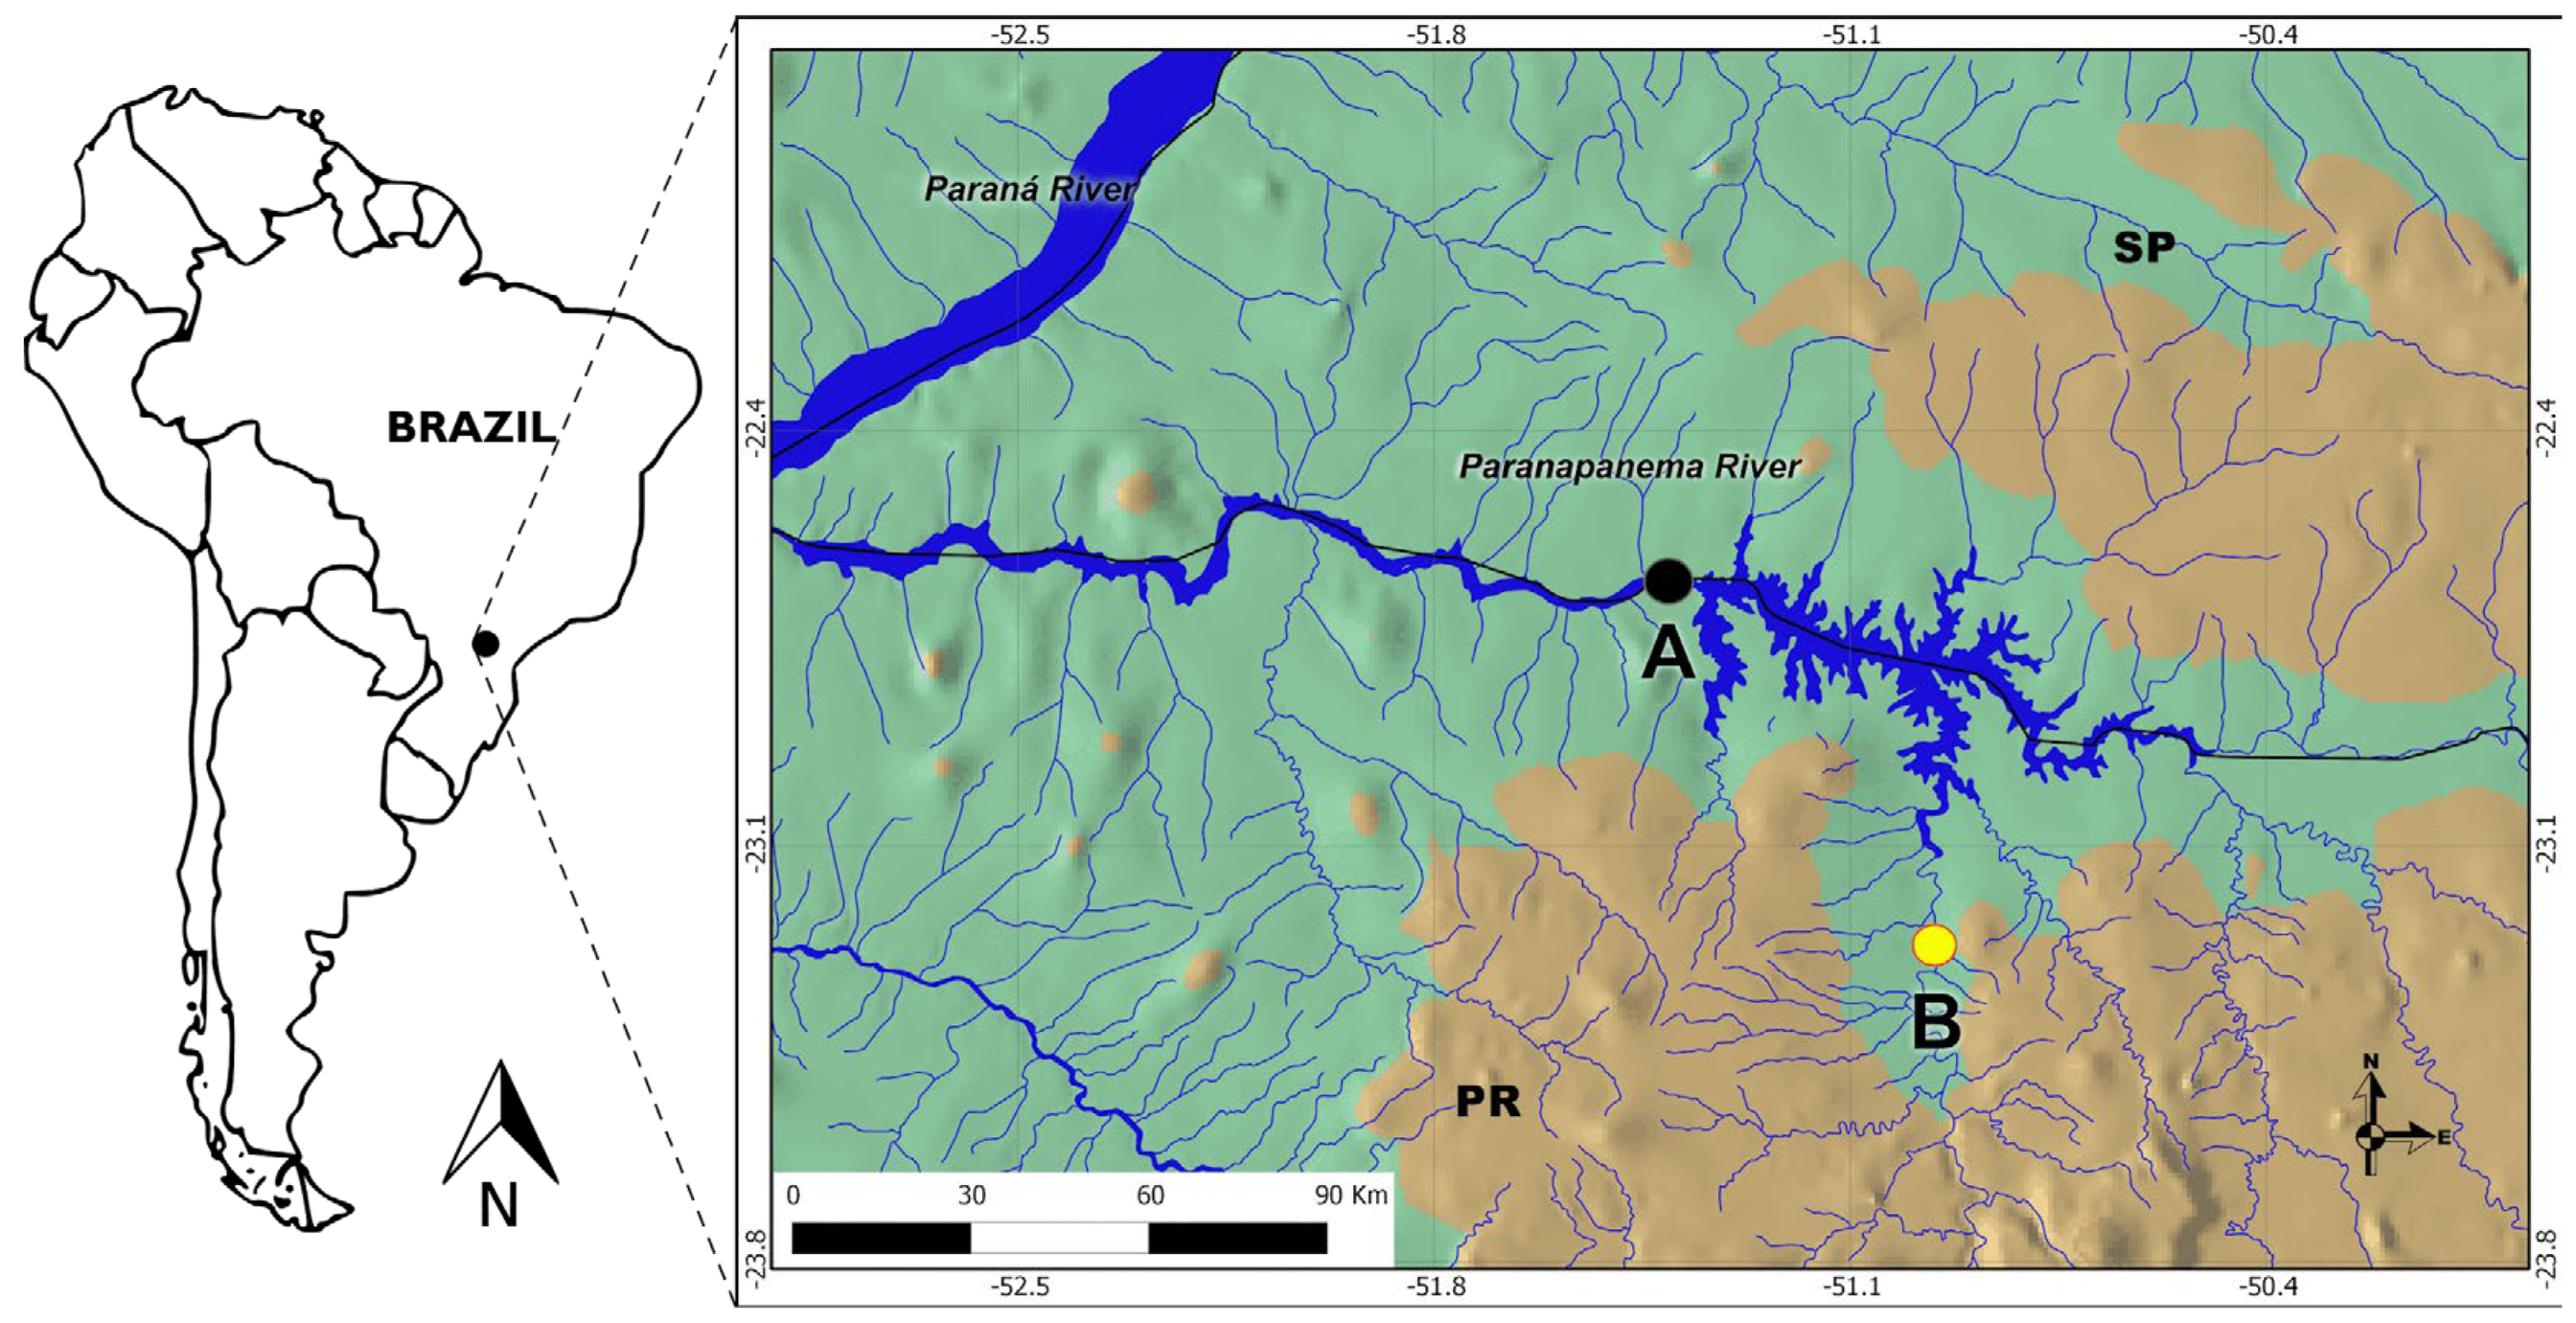
Figure 1. Location of the Capivara Reservoir in the southern region of Brazil: (A) The black dot indicates the location of the Capivara Dam (coordinates: 22°39′36″ S, 51°21′28″ W). (B) The yellow dot marks the sampling site in the Jataizinho Stream, a tributary of the Tibagi River in Paraná State (coordinates: 23°16′05.30″ S, 50°57′19.29″ W). The Paranapanema River forms a natural border between two Brazilian states, São Paulo (SP) and Paraná (PR), as indicated on the map.
Ecologies 06 00059 g001
Figure 2. Neighbor-Joining tree summarizing the identified taxa along with their closest phylogenetic taxon based on COI sequence comparisons. The distribution of species is illustrated according to Kimura 2-Parameter distances [24], represented by the scale bar. Bootstrap support values are indicated at each node and calculated under 1000 bootstrap replicates. Access codes are provided adjacent to each species name. * BOLD identification number.
Ecologies 06 00059 g002
Table 1. (N) = number of samples; (BOLD Ø) = similarity average obtained in the databases; (σ) = standard deviation; and (D.I.) = intraspecific difference.
ORDER/Family/SpeciesMigratory StatusNBOLD Ø (%)–σD.I. (%)
SILURIFORMES
Pimelodidae
Pimelodus ornatusMigratory34100–00.06
Pimelodus microstomaNon–migratory399.82–0.180.21
Pimelodus maculatusMigratory20100–00.14
Pinirampus pirinampuMigratory499.95–0.090
Iheringichthys labrosusNon–migratory2100–00.11
CHARACIFORMES
Anostomidae
Leporinus fridericiMigratory1399.94–0.080.19
Triportheinae
Triportheus nematurusNon–migratory2100–00.11
Parodontidae
Apareiodon affinisNon–migratory199.82–00
Disclaimer/Publisher’s Note: The statements, opinions and data contained in all publications are solely those of the individual author(s) and contributor(s) and not of MDPI and/or the editor(s). MDPI and/or the editor(s) disclaim responsibility for any injury to people or property resulting from any ideas, methods, instructions or products referred to in the content.