Article

Forest Management Effects on Breeding Bird Communities in Apennine Beech Stands

1
Dream Italia, 52015 Arezzo, Italy
2
Dipartimento di Bioscienze e Territorio, Università degli Studi del Molise, C. da Fonte Lappone, 86090 Pesche, Italy
3
NBFC, National Biodiversity Future Center, 90133 Palermo, Italy
4
geoLAB-Laboratorio di Geomatica Forestale, Dipartimento di Scienze e Tecnologie Agrarie, Alimentari, Ambientali e Forestali, Università degli Studi di Firenze, Via San Bonaventura 13, 50145 Firenze, Italy
*
Author to whom correspondence should be addressed.
Ecologies 2025, 6(3), 54; https://doi.org/10.3390/ecologies6030054 (registering DOI)
Submission received: 15 June 2025 / Revised: 13 July 2025 / Accepted: 15 July 2025 / Published: 1 August 2025

Abstract

Beech forests in the Italian peninsula are actively managed and they also support a high level of biodiversity. Hence, biodiversity conservation can be synergistic with timber production and carbon sequestration, enhancing the overall economic benefits of forest management. This study aimed to evaluate the effect of forest management regimes on bird communities in the Italian Peninsula during 2022 through audio recordings. We studied the structure, composition, and specialization of the breeding bird community in four managed beech stands (three even-aged beech stands aged 20, 60, and 100 years old, managed by a uniform shelterwood system; one uneven-aged stand, managed by a single-tree selection system) and one uneven-aged, unmanaged beech stand in the northern Apennines (Tuscany region, Italy). Between April and June 2022, data were collected through four 1-hour audio recording sessions per site, analyzing 5 min sequences. The unmanaged stand hosted a richer (a higher number of species, p < 0.001) and more specialized (a higher number of cavity-nesting species, p < 0.001; higher Woodland Bird Community Index (WBCI) values, p < 0.001; and eight characteristic species, including at least four highly specialized ones) bird community, compared to all the managed forests; moreover, the latter were homogeneous (similar to each other). Our study suggests that the unmanaged beech forests should be a priority option for conservation, while in terms of the managed beech forests, greater attention should be paid to defining the thresholds for snags, deadwood, and large trees to be retained to enhance their biodiversity value. Studies in additional sites, conducted over more years and including multi-taxon communities, are recommended for a deeper understanding and generalizable results.

1. Introduction

The European beech (Fagus sylvatica Linnaeus 1753) is endemic to Europe, covering approximately 14–15 million hectares, and beech forests are among the most extensive forest formations on the continent [1]. Beech forests in Europe have a long history of interaction with human activities: over the centuries, those not cleared to make way for pastures and crops have been mainly used for timber, firewood, and charcoal production, representing a vital resource, especially for mountain populations [2]. Despite this, they still play a significant role in biodiversity conservation [1], and in this regard, they are among the most studied forests [3]. Also, in the southern part of the range, particularly in the Italian and Balkan peninsulas, beech forests, although much more limited in extent than in Central Europe, still play a crucial role in biodiversity conservation (i.e., [4]), strengthened by their evolutionary history and the biogeographical conditions that distinctly set them apart [5].
In Italy, beech forests cover over one million hectares, about 9.5% of all forests [6], ranging from the Alps to Sicily. Moreover, beech forests are the dominant forest type in mountain areas, especially in the Apennine region [7]. Except for a few relict patches that could be considered old-growth forests [8], Italian beech forests have been subjected to centuries of management, often intensive, which has altered their extent, structure, and composition [9].
Coppice management was widespread in beech forests throughout Italy until the first half of the 20th century, becoming the dominant management system in some areas such as the northern Apennines [10]. Traditionally, coppicing involved clear cutting and leaving 60–80 standards per hectare at ages 16 to 24 years [7]. The economic and social changes in the past 70 years have led to a progressive and substantial reduction in coppicing, and beech stands have been widely converted to high forests [10]. The conversion to high forests has been carried out by reducing stand density with repeated thinning, and the uniform shelterwood system, which includes preparatory cuts, seeding cuts, secondary cuts, and clearing cuts, has been prescribed to carried out regeneration felling in the older transition stands; however, regeneration felling has rarely been applied in practice in Italy [7].
This transformation has led to a positive trend in the Apennine region: beech forests, like other woodlands, have expanded in area [11] and their structure has changed, by increasing in age, amount of standing volume, and deadwood [9]. In the northern Apennines, for example, some studies have shown a positive trend in bird diversity: forest bird populations have been steadily increasing for decades [12], and, in the last 25 years, two specialized forest species, Dryocopus martius and Lophophanes cristatus, have (re)colonized the area [13]. However, we are still far from “optimal” conditions regarding biodiversity, since old-growth beech forests are very few and limited in extent [8], while most beech forests, which have been derived from coppice conversions to high forest over the past 50–70 years, are biologically young, with overall low levels of naturalness [14].
As beech forests still hold economic importance and are actively managed, especially in public forests, management systems play a significant role in conserving forest biodiversity in this geographic area. Silvicultural management is crucial for maintaining forest biodiversity and resilience, particularly in the Mediterranean region [15]. Key tools for monitoring biodiversity include European Forest Types and Forest Europe SFM (Sustainable Forest Management) indicators, which help track progress in forest conservation [16]. These indicators, including common forest bird species (Criterion 4: Biological diversity, indicator 4.10 [17]) assess the health of and trends in forest ecosystems, emphasizing the importance of protecting primary and old-growth forests. Effective forest management, guided by these indicators, is essential for both preserving forest ecosystems and improving their adaptability to environmental changes.
In this regard, a key element is the relationship between forest management and animal diversity: some research has been conducted in Italy [18], mainly focusing, in beech forest, on saproxylic beetles [19,20], birds [21,22,23], and bats [24,25]. However, there is a general scarcity of detailed, spatial-scale studies, which are often costly in terms of research effort [21], and the specific impacts of different forest management practices on biodiversity remain underexplored in some geographical areas such the northern Apennines of Italy.
Bird monitoring has long been used as a tool for biodiversity assessment [26], and, more recently, Passive Acoustic Monitoring has proven to be a capable tool for discriminating fine spatial details [27]. For example, in central–northern Italy, it has been highlighted that vegetation height is the most important factor in diversifying soundscapes at a very fine (25 m) scale [28]. Even in beech forests, soundscapes vary at fine spatial scales, although the relationship with vegetation structure is less clear [29]. This approach involves analyzing audio records to extract information about “acoustic communities”, which can have ecological or ethological significance, which is useful for monitoring purposes [30]. This method identifies spatial patterns of acoustic activity determined via vegetation structure and microtopographic factors in different environments [27,28]. Recent developments favor the analysis of the entire sound spectrum, using dedicated algorithms to compute acoustic indices directly from audio recordings [31]. The limitations of this new approach are not yet fully known, as this is a very new and dynamic field of research: for example, the relationship between acoustic indices and species richness can sometimes be weak [31], and their correct use requires significant analytical and interpretative effort [32]. Therefore, studies focusing on individual components of soundscapes remain valid and, in some cases, preferable, as they are more immediately interpretable [30]. Moreover, in temperate regions, bird vocalizations represent the most significant component of natural soundscapes of natural environments, making this component highly informative [33].
This study aims to examine, through Passive Acoustic Monitoring, the main characteristics, with regard to structure, composition, and specialization, of breeding bird communities in beech-dominated stands in the northern Apennines, characterized by different management systems and development stages. Instead of an automatic analysis of audio records, which could be unsatisfactory in providing information directly and closely linked to diversity [31], we chose a more “traditional” analysis, using the vocalization frequency of different species to link the forest stand structure and composition to the ecological specialization of breeding bird communities. Given the recognized value of birds as indicators, this study, conducted in parallel with a similar investigation on saproxylic and non-saproxylic beetles [34], evaluated the effects of forest management on diversity by comparing different bird communities. The results can provide insights for sustainable management and conservation priorities in the beech forests of the northern Apennines.

2. Materials and Methods

2.1. Study Area

The study area encompasses five beech forest stands in the northern Apennines, all located in the Tuscany region of Italy (Figure 1): two in the province of Pistoia in the Abetone area (Pian degli Ontani, hereafter PDO, and Bosco di Baldo, BDB), three in the province of Arezzo in the Alpe di Catenaia area (Casella 1, CA1, and Casella 2, CA2), and the Foreste Casentinesi, Monte Falterona, and Campigna National Park (La Verna, LVN). All sites were located within the same ecoregion (i.e., they share the same climate, physiography, vegetation, biogeography, and land use [35]), in landscapes largely dominated by forest, and fall within the same elevation range (Table 1). The sites were selected to be representative of the main management systems, including unmanaged forest, of beech forests in the region [7]: Three sites were even-aged beech forest stands managed with a uniform shelterwood system, with each site representing a different development stage of this management approach—CA1 was a young forest stand (approximately 20 years old) originating from seed, established following seeding and clearing cuts performed in 2002 and 2018, respectively; PDO was a seed-originated forest stand aged approximately 60 years old; and CA2 was a coppice in transition to high forest, aged about 100 years old, where the natural regeneration of beech is taking place after a seeding cut carried out in 2017. The fourth site, BDB, was an uneven-aged forest managed using a single-tree selection system; the fifth site, LVN, was an uneven-aged, unmanaged forest that could be considered an old-growth forest due to its age, structure, and naturalness. The area of the sites is between 2.5 hectares (CA1, PDO, and CA2) and 5 hectares (BDB and LVN).

2.2. Bird Survey

A survey was carried out using Zoom H2, H2n, and H4 digital audio recorders, whose microphones can effectively capture the vocalizations of a bird community [28,36], positioned at a 1.2 m height, ensuring that each recorder was placed at the center of an area with uniform characteristics at each site. Recordings were made in the spring of 2022 between 13 April and 8 June (covering most of the breeding season of birds at the site), from 5:55 to 9:05 a.m., when singing activity is generally at its peak [37] and the breeding passerines are much more detectable [38], under good weather conditions, and in the absence of an observer (who moved away after positioning the equipment). We conducted four recording sessions, on four different dates, at each site, each approximately one hour long. A total of 20 samples were collected, corresponding to four hours of monitoring at each site. Since our sites did not exceed 5 ha in area, we chose the same location for each recording session. This choice is also in accordance with Balestrieri et al.’s study [39], which suggests one point every five hectares, repeated three times, as the survey effort requirements for bird community assessment in forest habitats (including beech forests). Species identification was carried out through direct listening, using Audacity© software (version 3.6.4), which also allows for the visualization of sonograms and, in cases of difficult identification, their comparison [40] with reference archives of reliably identified recordings (i.e., xeno-canto.org).

2.3. Data Analysis

Sequences of five minutes, which are generally informative regarding bird communities [41,42] (they are often the basis of ornithological monitoring, including in our study area [12]), were used to study breeding bird communities [43,44]. We recorded the presence of different species in each sequence; the primary data, therefore, consisted of 48 species lists for each site, each corresponding to a five-minute sequence. The main goal was to highlight potential differences between bird communities across sites; the following characteristics were assessed based on the species lists: (1) the structure, (2) composition, and (3) ecological specialization of the bird community.
For structure, we analyzed the total species richness, which is one of the indices that best describes the complexity of bird communities in forest environments [45]; the richness of cavity-nesting species, to assess the structural component of the community most closely associated with forest environments [46]; and the richness of other species. The sites were compared using generalized linear mixed models (GLMMs), where the site was the fixed factor and the session was the random factor, to account for the non-independence of the five-minute sequences in the same session [47]. A Poisson distribution was considered for the variables, and we verified that the model did not result in overdispersion. If the estimated variance for the random factor was too low (i.e., if the model had singularity issues), the random factor was removed. The models were calculated using the lme4 package [48] in R software (version 4.3.2). Additionally, we compared the diversity among the five sites using rarefaction curves, which showed the expected number of species as a function of sampling effort, calculated with the iNext4 R package [49], for the total species richness, Shannon diversity, and Simpson diversity (with Hill numbers q = 0, q = 1, and q = 2, respectively).
For composition, we compared the distribution of bird communities in a two-dimensional space via NMDS (non-metric multidimensional scaling, [50]). The dissimilarity matrix used in the analyses was calculated using the “Chao” method, which adjusts traditional dissimilarity estimates (such as Sørensen or Jaccard) to account for rare species (that are not directly observed but may be present) using information derived from the number of unique and duplicate species in the samples [51]. We then assessed the similarity between sites using the Morisita index [52], which ranges from 0 (i.e., completely different assemblages) to 1 (i.e., the same species with the same abundance for each assemblage). The results are presented in a dendrogram calculated using the UPGMA (unweighted pair group method with arithmetic mean) for both the entire community and for cavity-nesting species only. All these analyses were performed using the vegan R package [53]. Finally, we assessed the ornithological characterization of each site using the indicator value (IV) method [54]. The indicator value combines species’ relative abundance and occurrence frequency across predefined groups (or sites, as in our case), ranging from 0 to 1, with higher values indicating a stronger association with a particular group or site. We calculated the IV for each species at each site and assessed the significance through 10,000 iterations. The IV analysis was performed using the labdsv R package [55].
For the ecological specialization of species communities at each site, we calculated the Woodland Bird Community Index (WBCI). The WBCI is the sum of the scores that measure the “strength” of the association of each species with forests. The score is the (standardized) β-coefficient of a simple logistic regression that associates the presence of a species with the proportion of forest cover, calculated for breeding bird species in Italy [56]. Species more closely associated with the forest have higher values; therefore, the greater the sum of the values in a bird community, the higher its degree of forest specialization [56]. Since the frequency and intensity of vocalizations are linked to habitat quality [57], we expect a higher vocalization frequency in more specialized species if the forest is of higher quality [58]. We calculated the WBCI for each 5′ sequence. The differences between sites were analyzed, as with the species richness, using GLMMs with the lme4 R package [48], using a normal distribution for the variable in this case and testing the significance of the variables with the lme4Test R package [59]. All analyses and plots were generated using R version 4.4.1 [60].

3. Results

In total, 1719 records (species × sequence) were obtained, with 281, 302, 344, 304, and 488 records from the CA1, PDO, CA2, BDB, and LVN sites, respectively. Overall, 31 species were recorded; at the site level, the numbers of species observed were 17, 19, 23, 21, and 27 at CA1, PDO, CA2, BDB, and LVN, respectively. A total of 12 species were cavity-nesting, with 6, 7, 7, 9, and 11 species at the CA1, PDO, CA2, BDB, and LVN sites, respectively (Table 2).

3.1. Bird Community Structure

The bird community was much more complex in the unmanaged forest stand (LVN) than at all the other sites (CA1, PDO, CA2, and BDB). At all the managed sites, the total species richness and the richness of cavity-nesting species were significantly lower than at the LVN site (Table 3).
The CA1 site, representing the early stages of a uniform shelterwood system, was a very young even-aged forest stand and hosted a significantly lower number of cavity-nesting species than all the other sites. At the CA2 site, representing the advanced phase of the same management system and characterized by an open structure with some large trees, the number of non-cavity-nesting species was not significantly different from that at the LVN site and was higher than that at the BDB site (uneven-aged). Overall, the differences between managed sites were minimal, even when statistically significant (Table 3). A visual comparison of site richness is provided in the Supplementary Material (Figure S1).
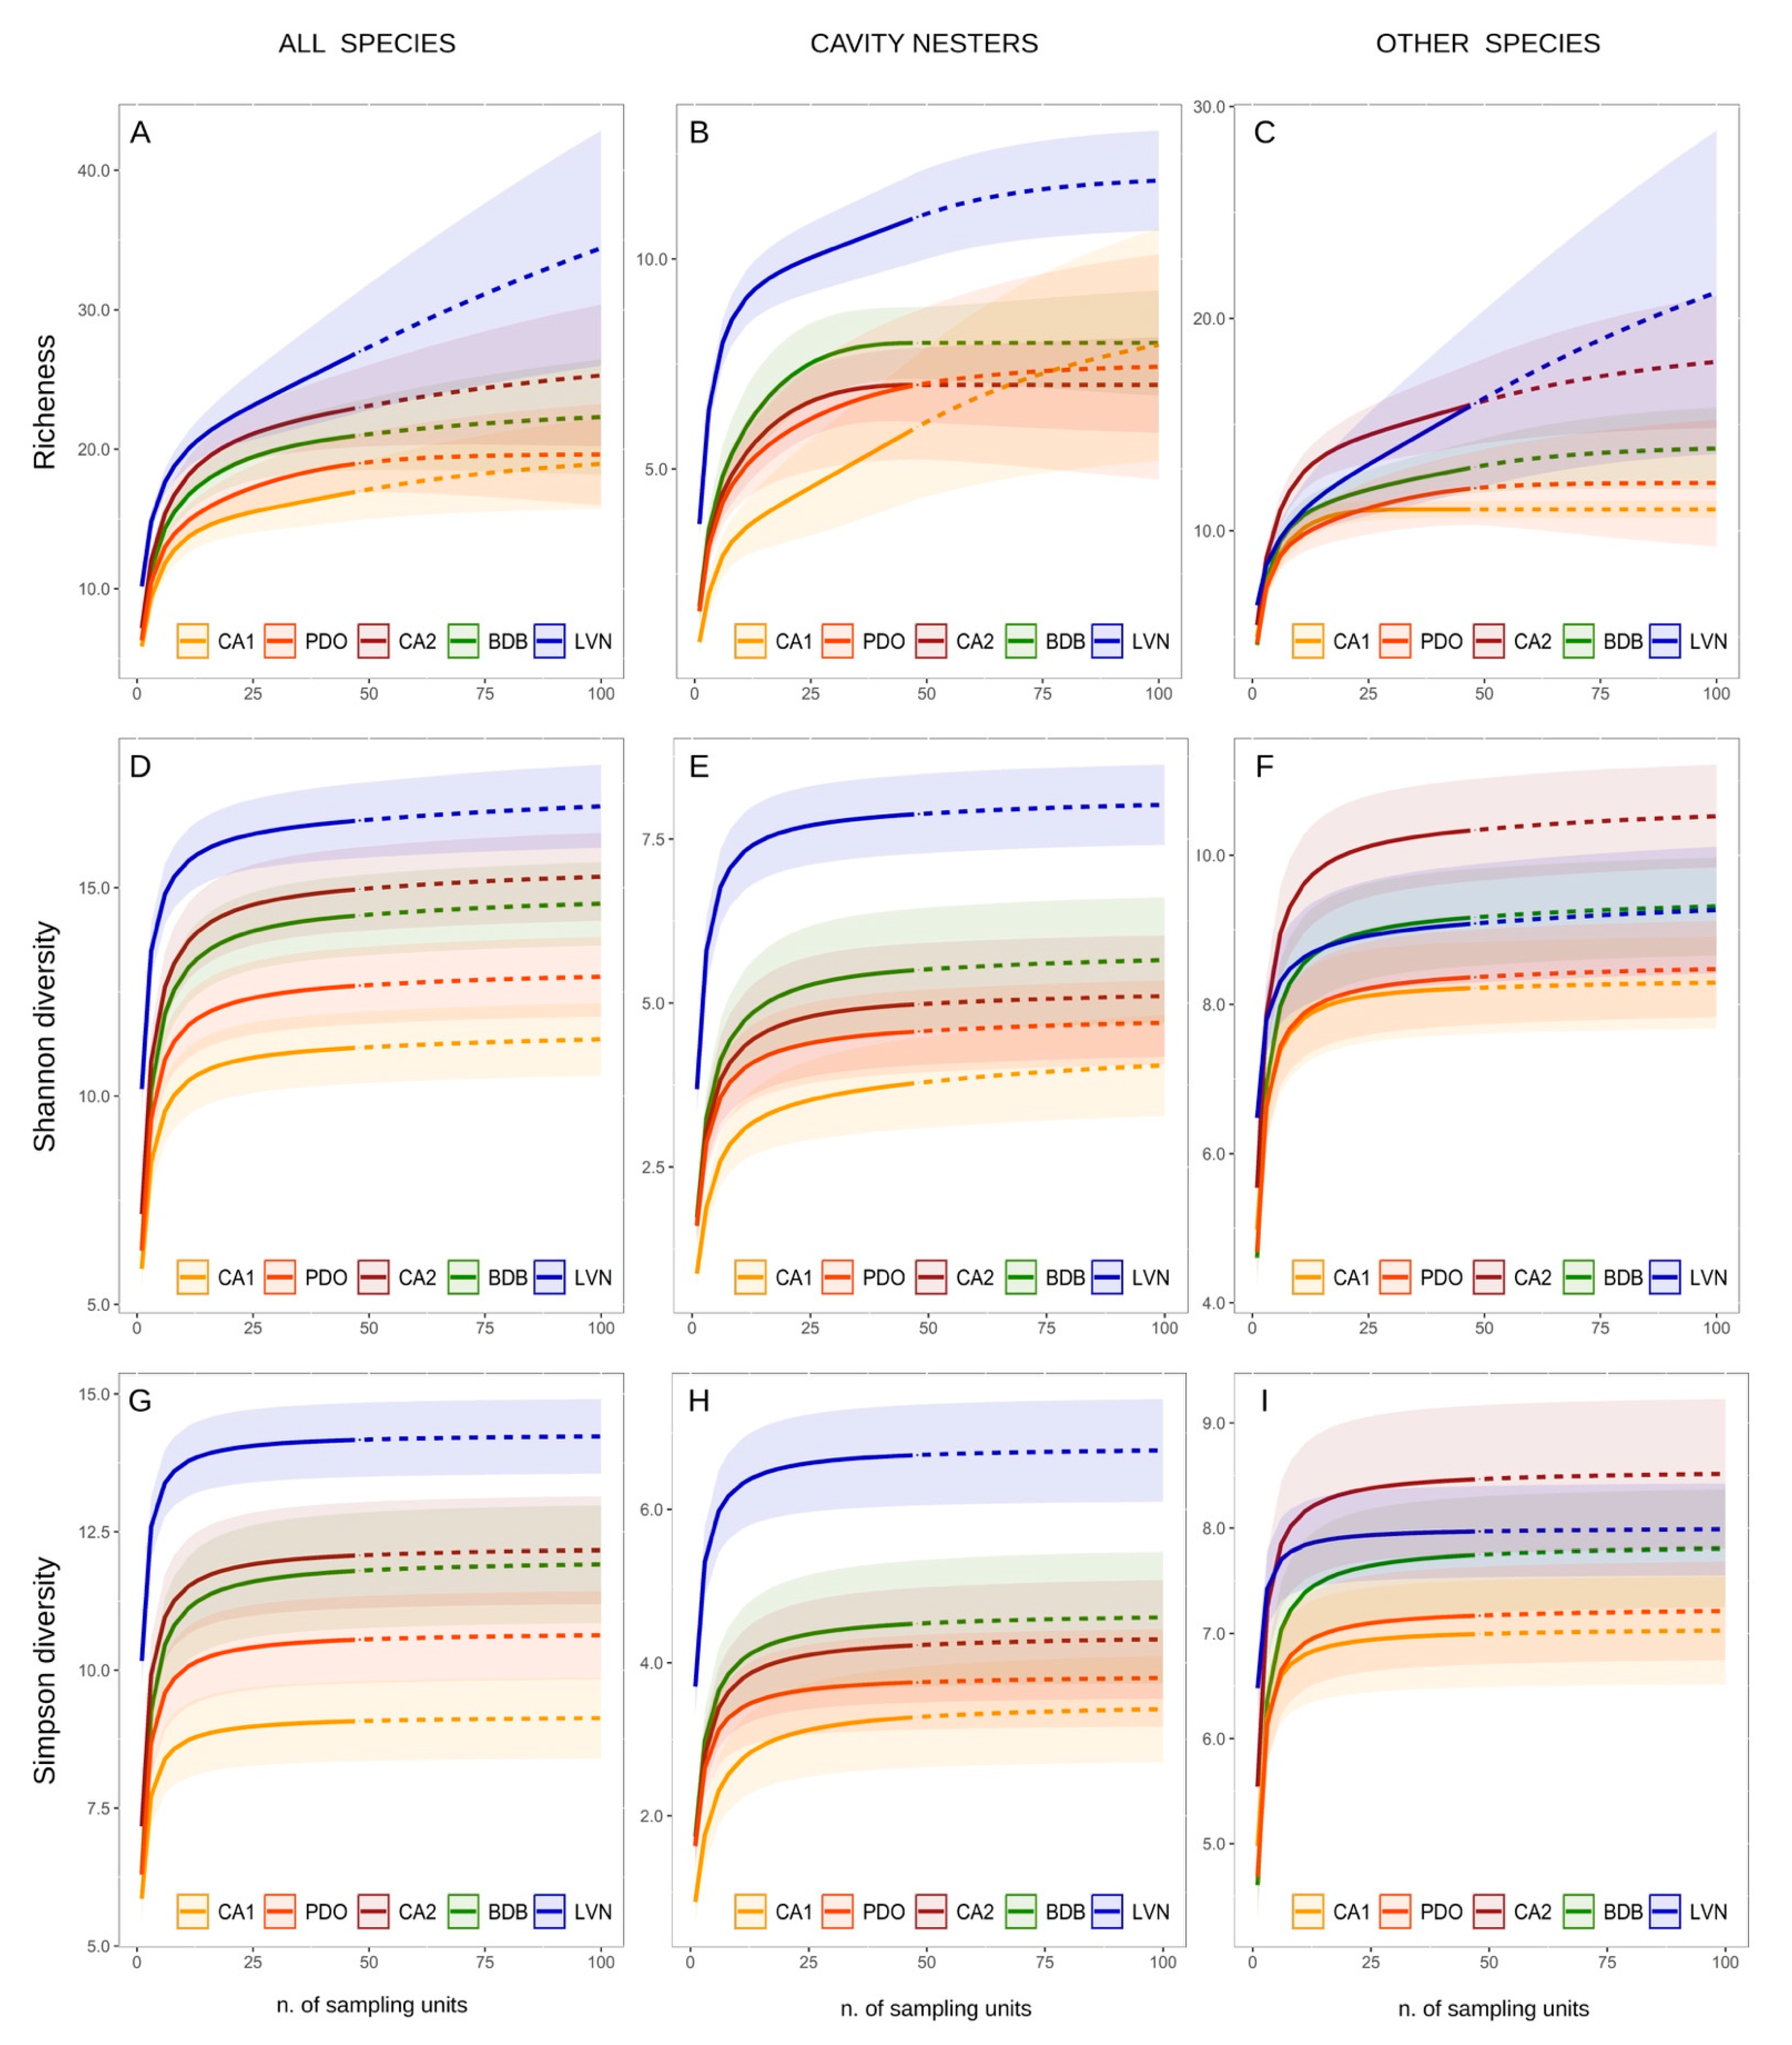
Considering the entire bird community, the rarefaction curves showed higher diversity values for the LVN site than for all other sites. However, a more distinct separation was observed for higher Hill numbers, i.e., when progressively reducing the importance of rarer species (Figure 2A,D,G). Cavity-nesting species were much more diverse at the LVN site (Figure 2B,E,H). Other species showed minor differences, and, for Shannon and Simpson diversity, the CA2 site exhibited greater diversification (Figure 2F,I).

3.2. Bird Community Composition

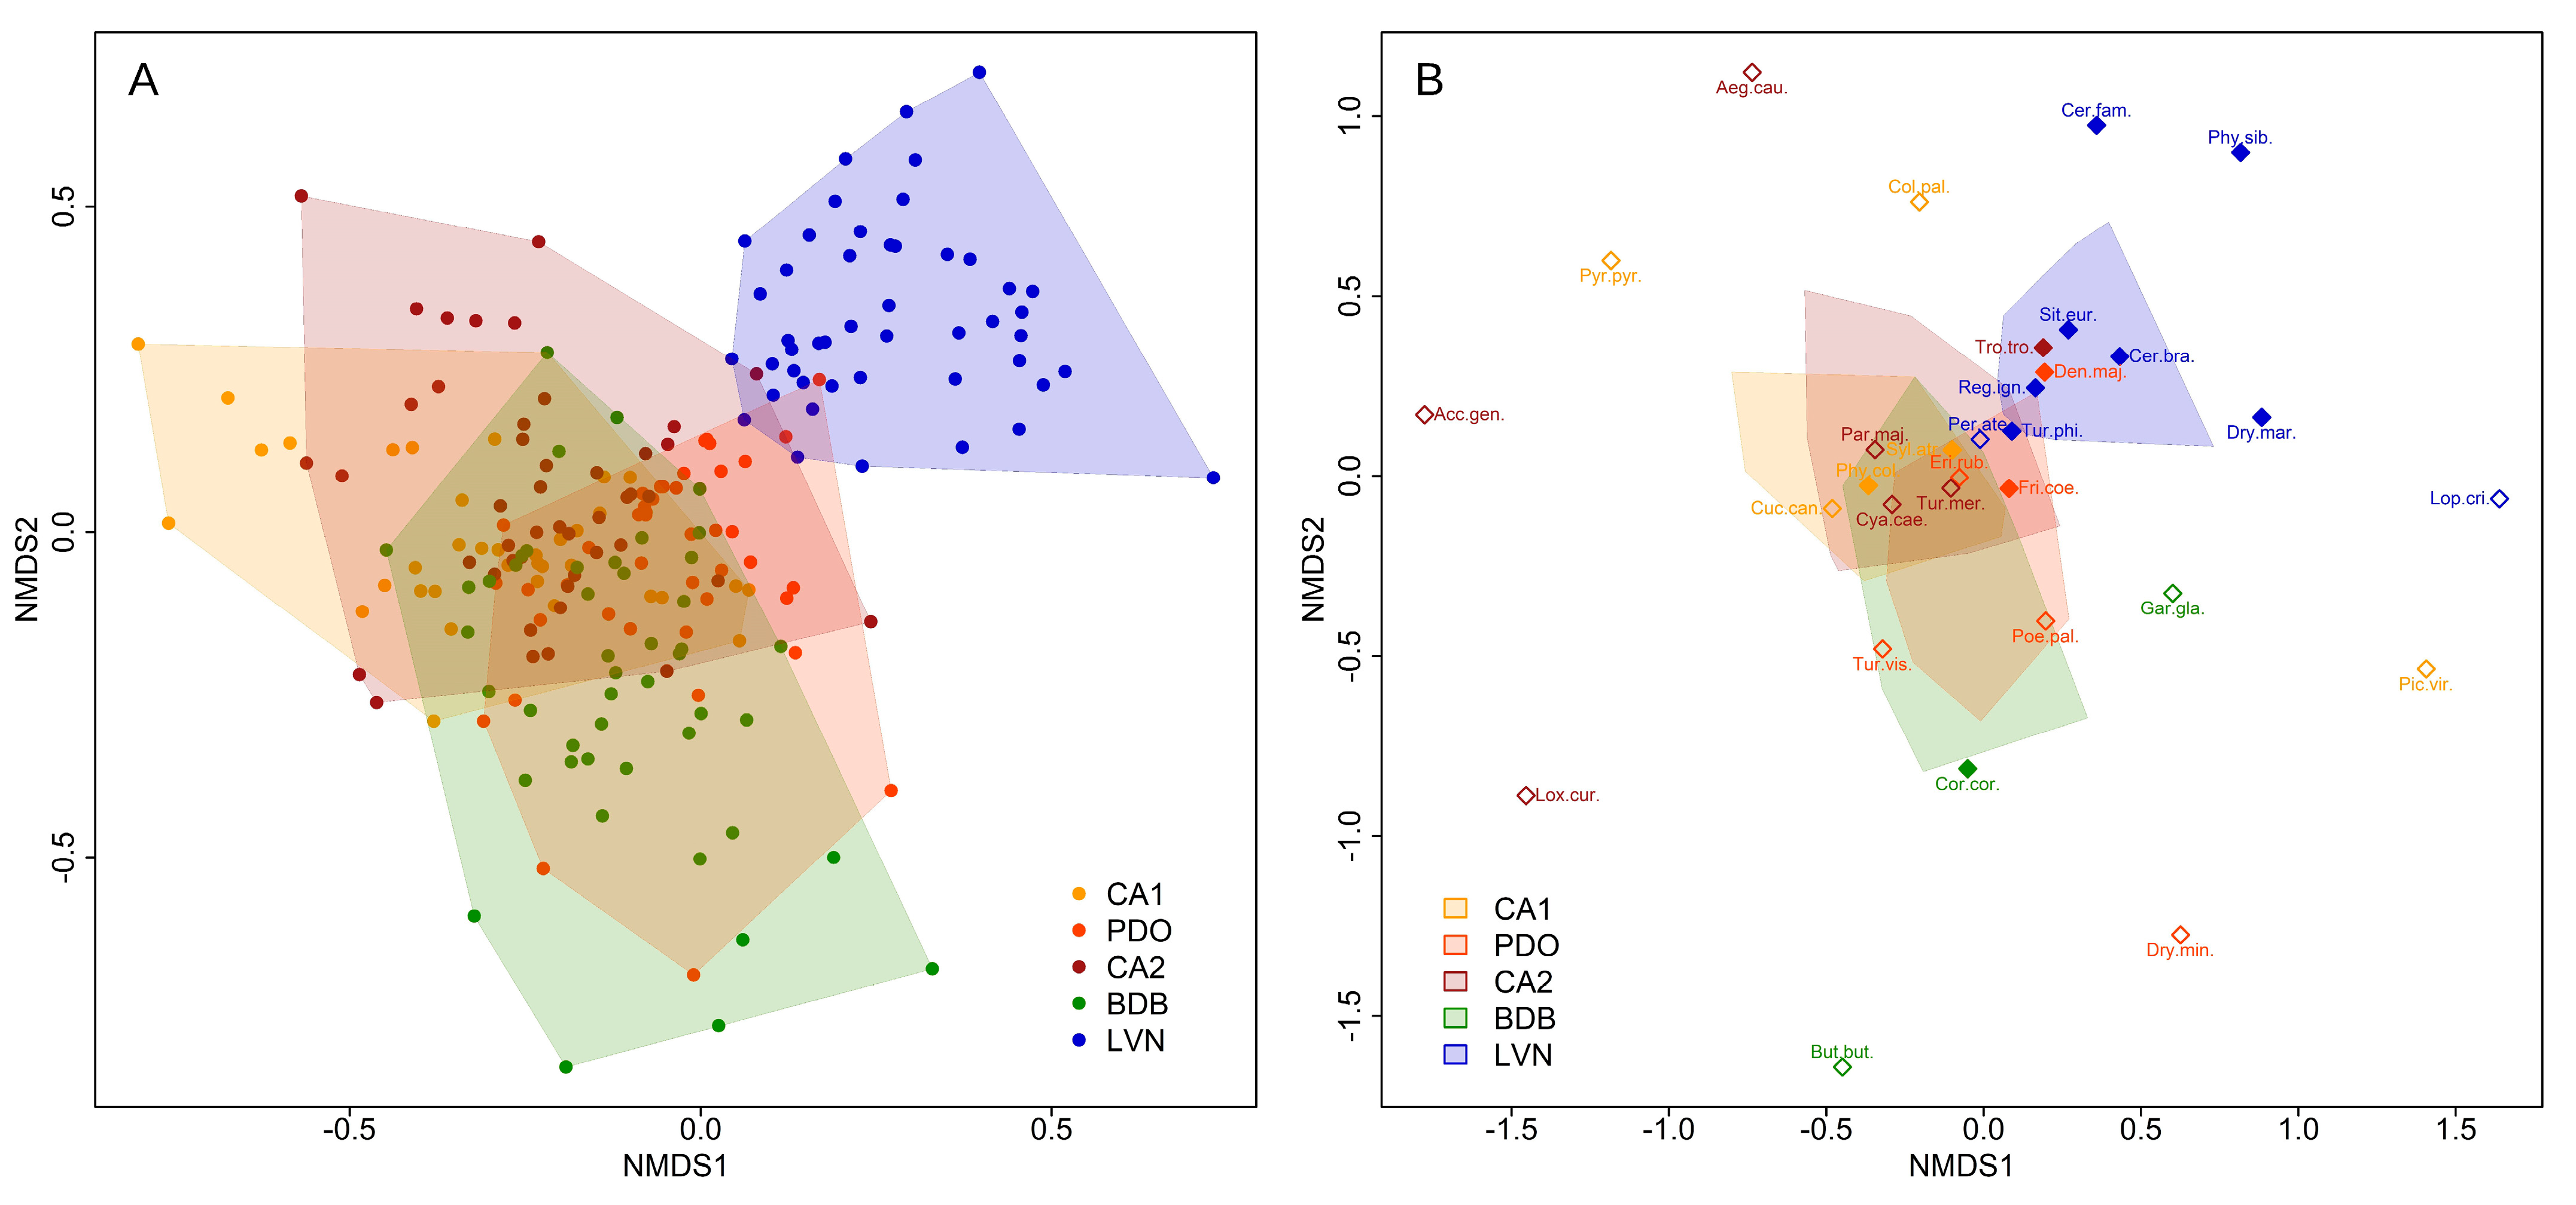
The NMDS ordination clearly separated the LVN site from all managed sites, which broadly overlapped each other (Figure 3); the representation can be considered sufficiently informative (stress value = 0.13, [61]).
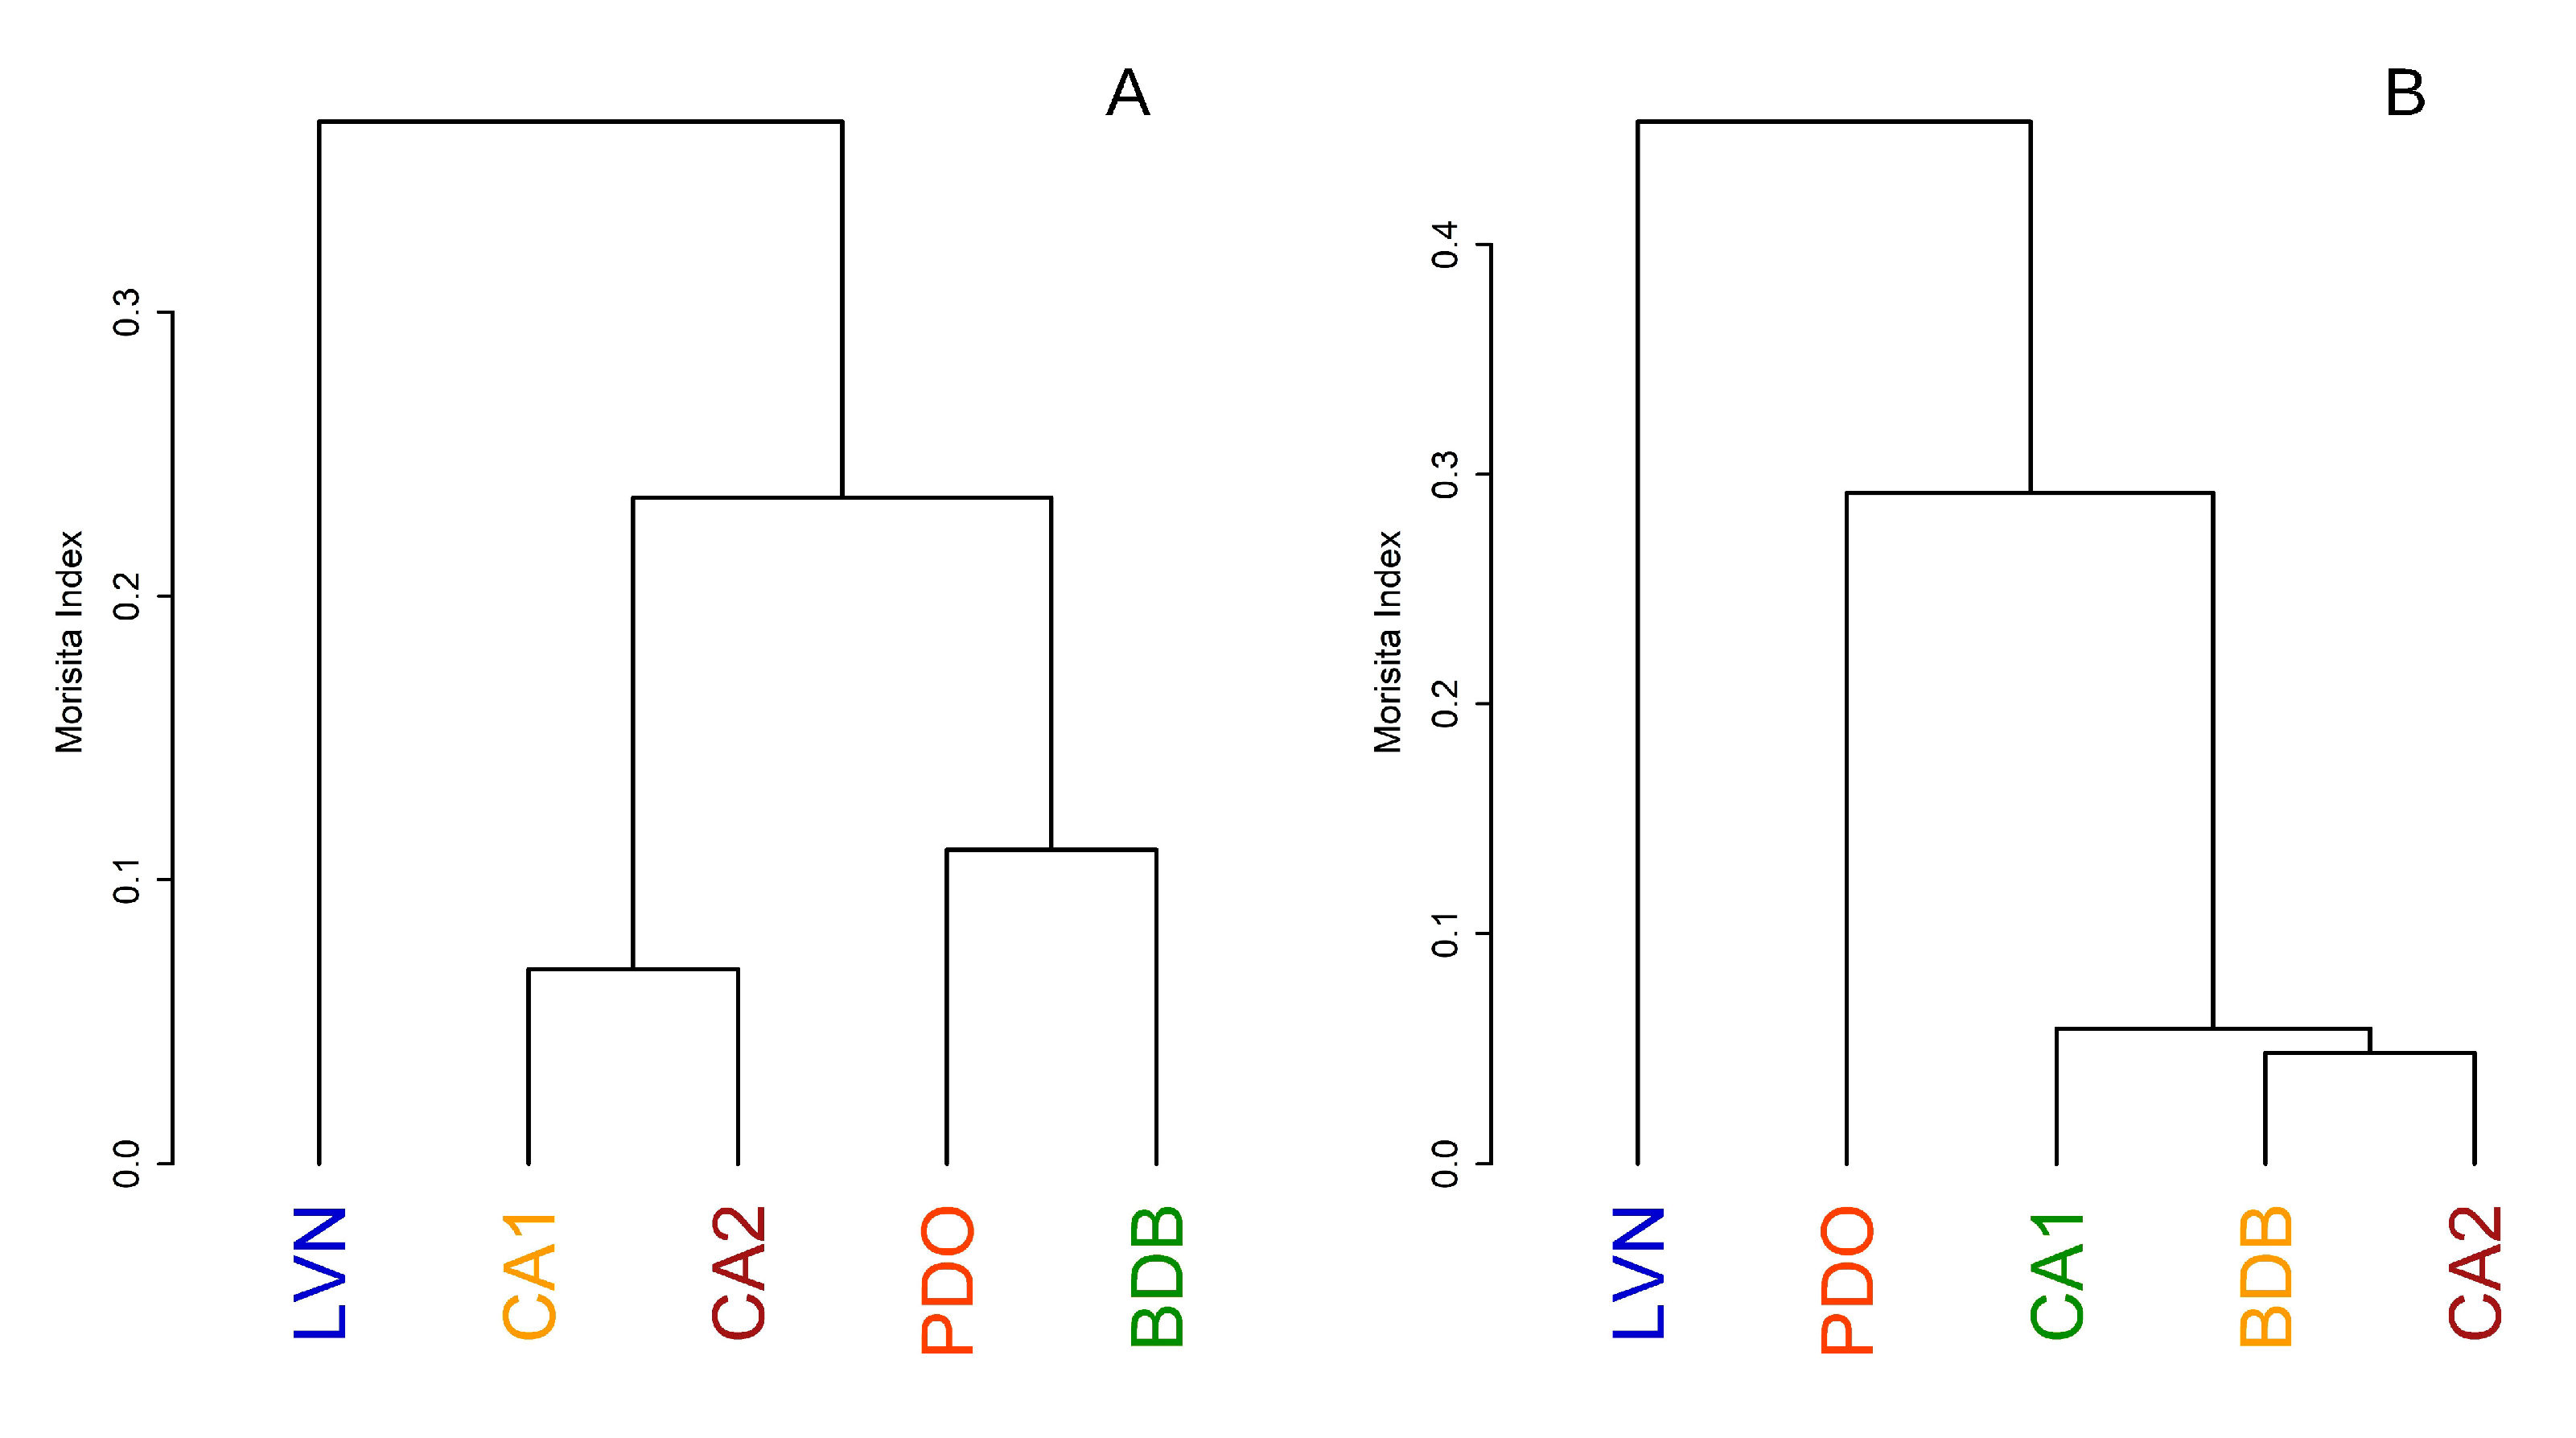
The Morisita index showed greater similarity between sites that were closer to each other in terms of overall community composition (CA1 and CA2; PDO and BDB; Figure 1 and Figure 4A), while no geographic pattern emerged for cavity-nesting species (Figure 4B). In any case, the LVN site remained distinct from the others.
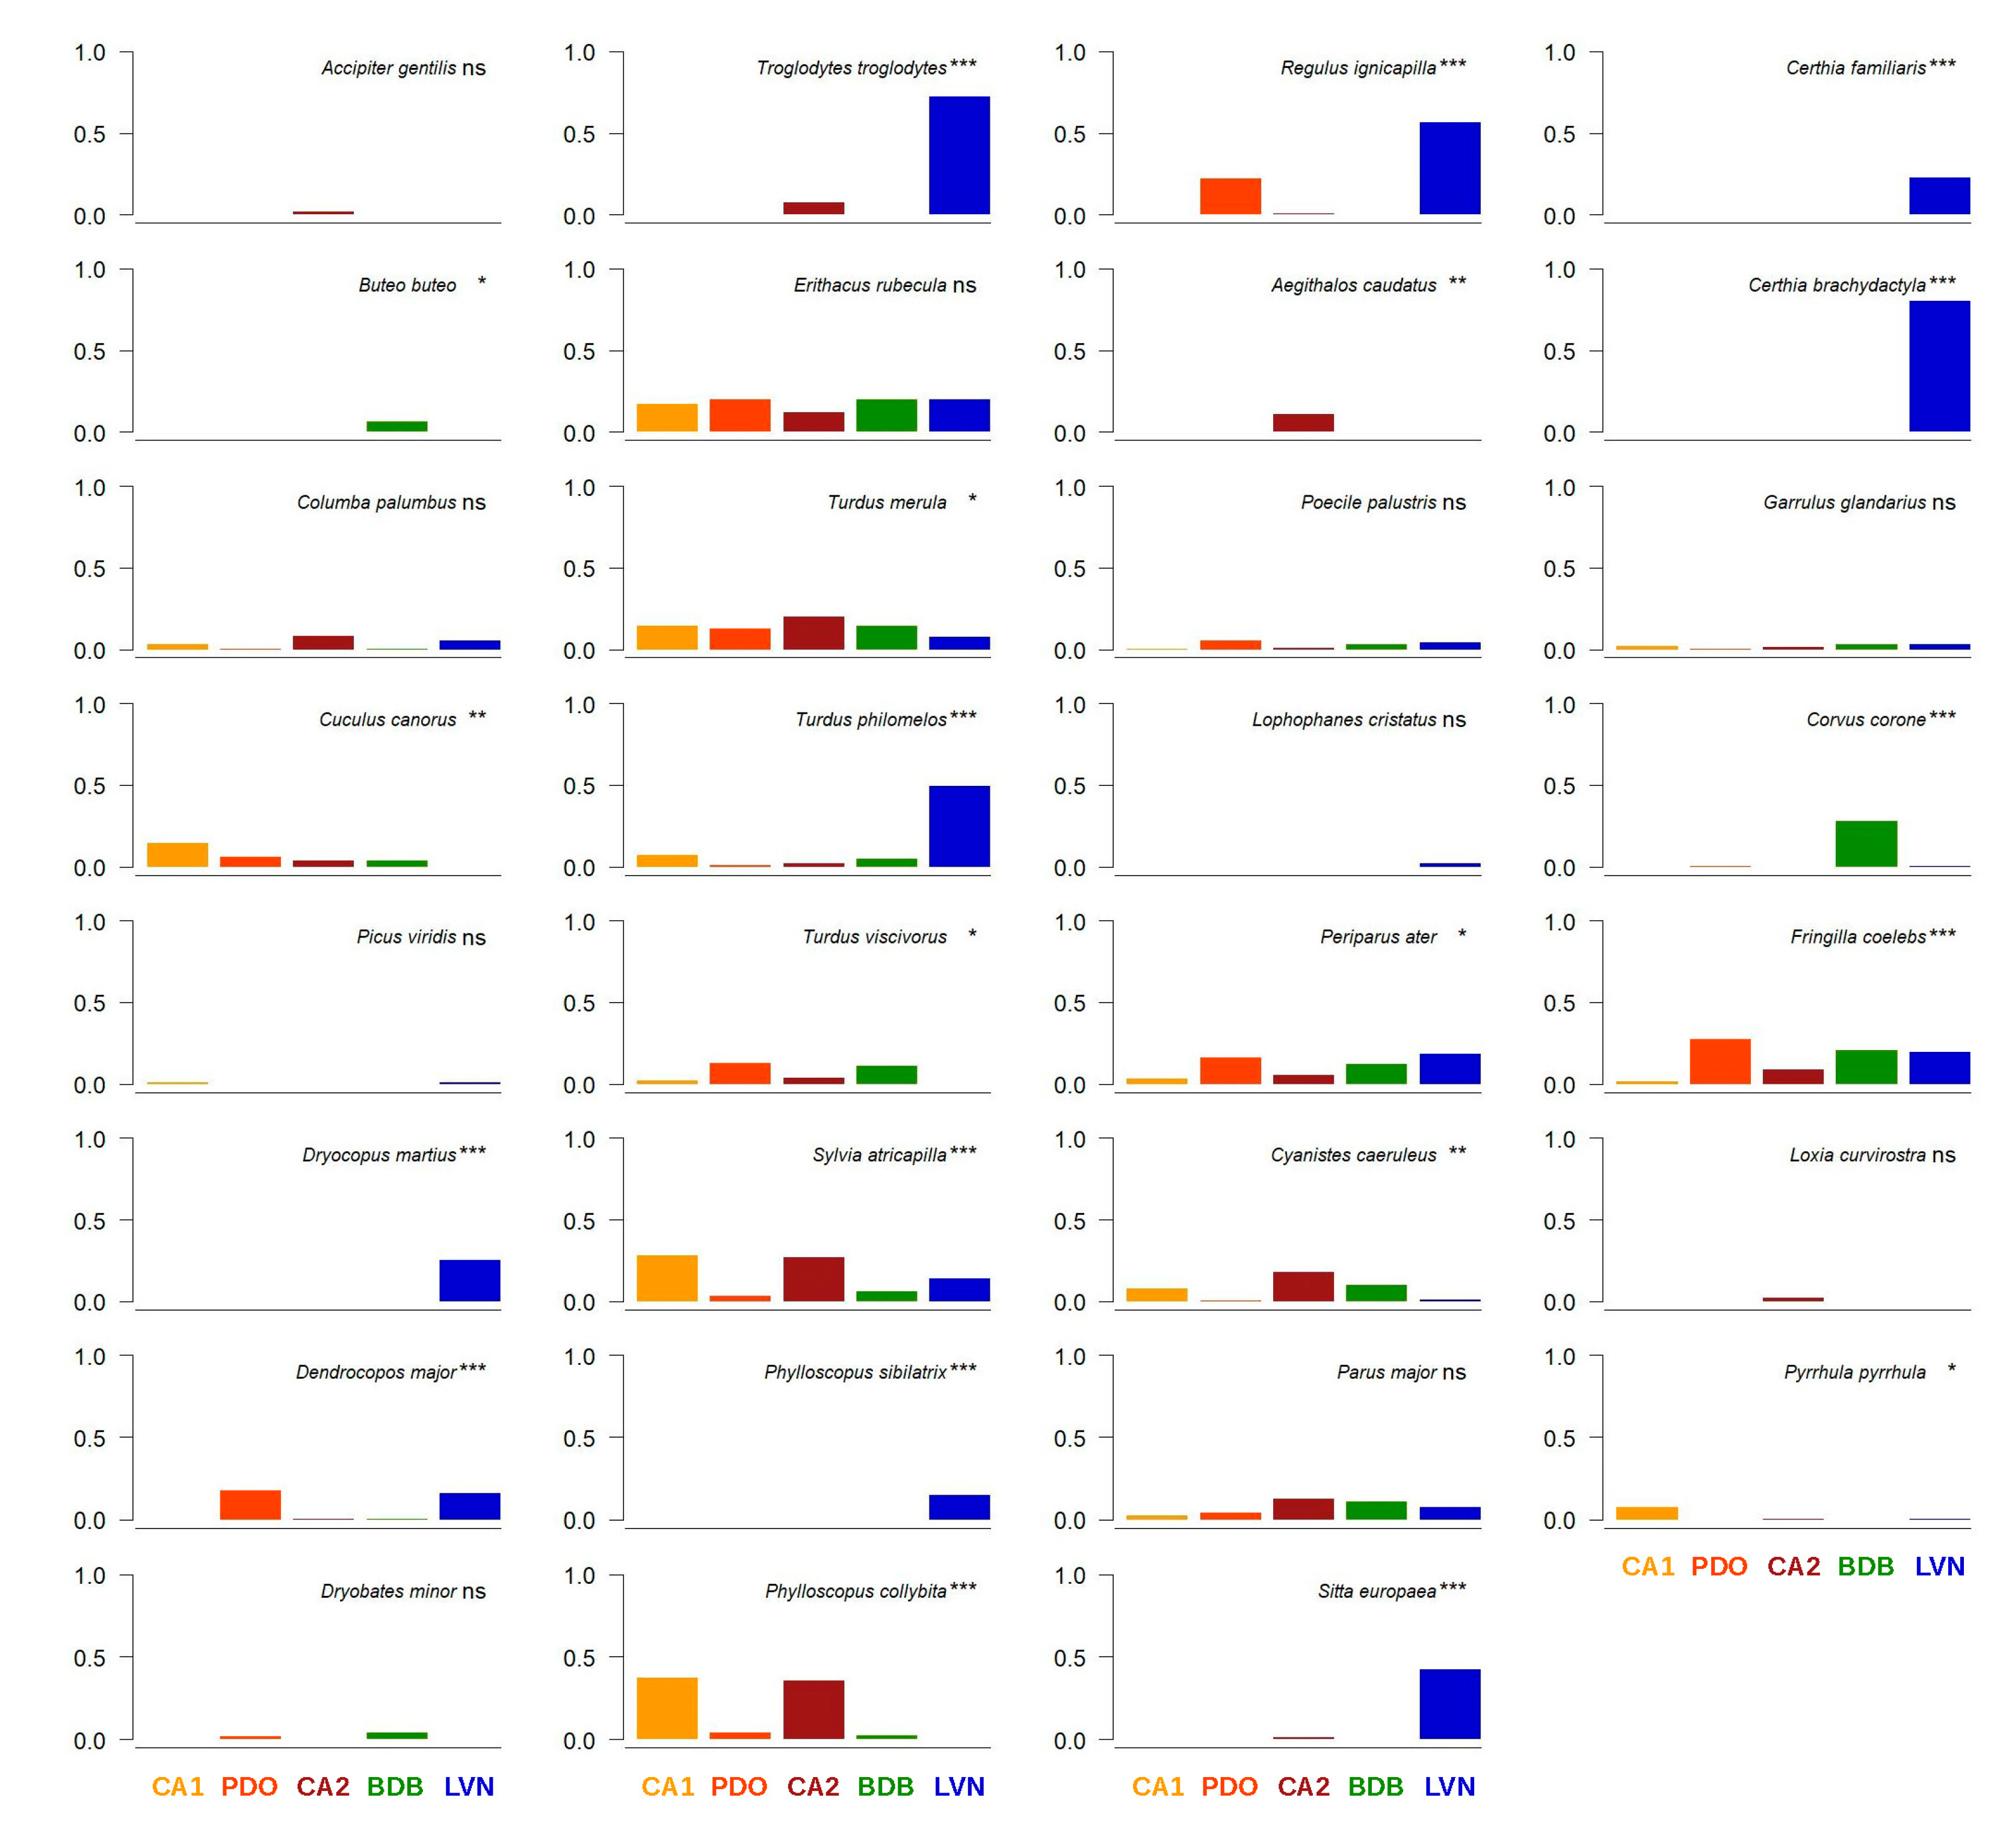
Regarding the analysis of the indicator value (Figure 5), significant differences in the IVs among sites were found for 21 species, of which 13 were highly significant (p < 0.001). The highest IVs were consistently observed at the LVN site.
Figure 3. Results of the NMDS (non-metric multidimensional scaling) analysis. The sampling sequences (A) and the species (B) are shown. The species are represented by the color of the site where the IV (indicator value) is highest; solid points represent those for which the IV is highly significant (p < 0.001, cfr. Figure 5). The species are indicated by their abbreviated scientific name (the first three letters of the genus name and the first three letters of the species name). CA1 = Casella 1; PDO = Pian degli Ontani; CA2 = Casella 2; BDB = Bosco di Baldo; LVN = La Verna.
Ecologies 06 00054 g003
Figure 4. Similarity dendrograms were drawn using the Morisita index for (A) total bird species and (B) cavity-nesting bird species. CA1 = Casella 1; PDO = Pian degli Ontani; CA2 = Casella 2; BDB = Bosco di Baldo; LVN = La Verna.
Ecologies 06 00054 g004
Figure 5. Results of the IV (indicator value) analysis. For each species, the IV for each site is shown in the graph, along with the significance levels calculated using 10,000 iterations (*** p < 0.001; ** p < 0.01; * p < 0.05). CA1 = Casella 1; PDO = Pian degli Ontani; CA2 = Casella 2; BDB = Bosco di Baldo; LVN = La Verna.
Ecologies 06 00054 g005

3.3. Bird Community Specialization

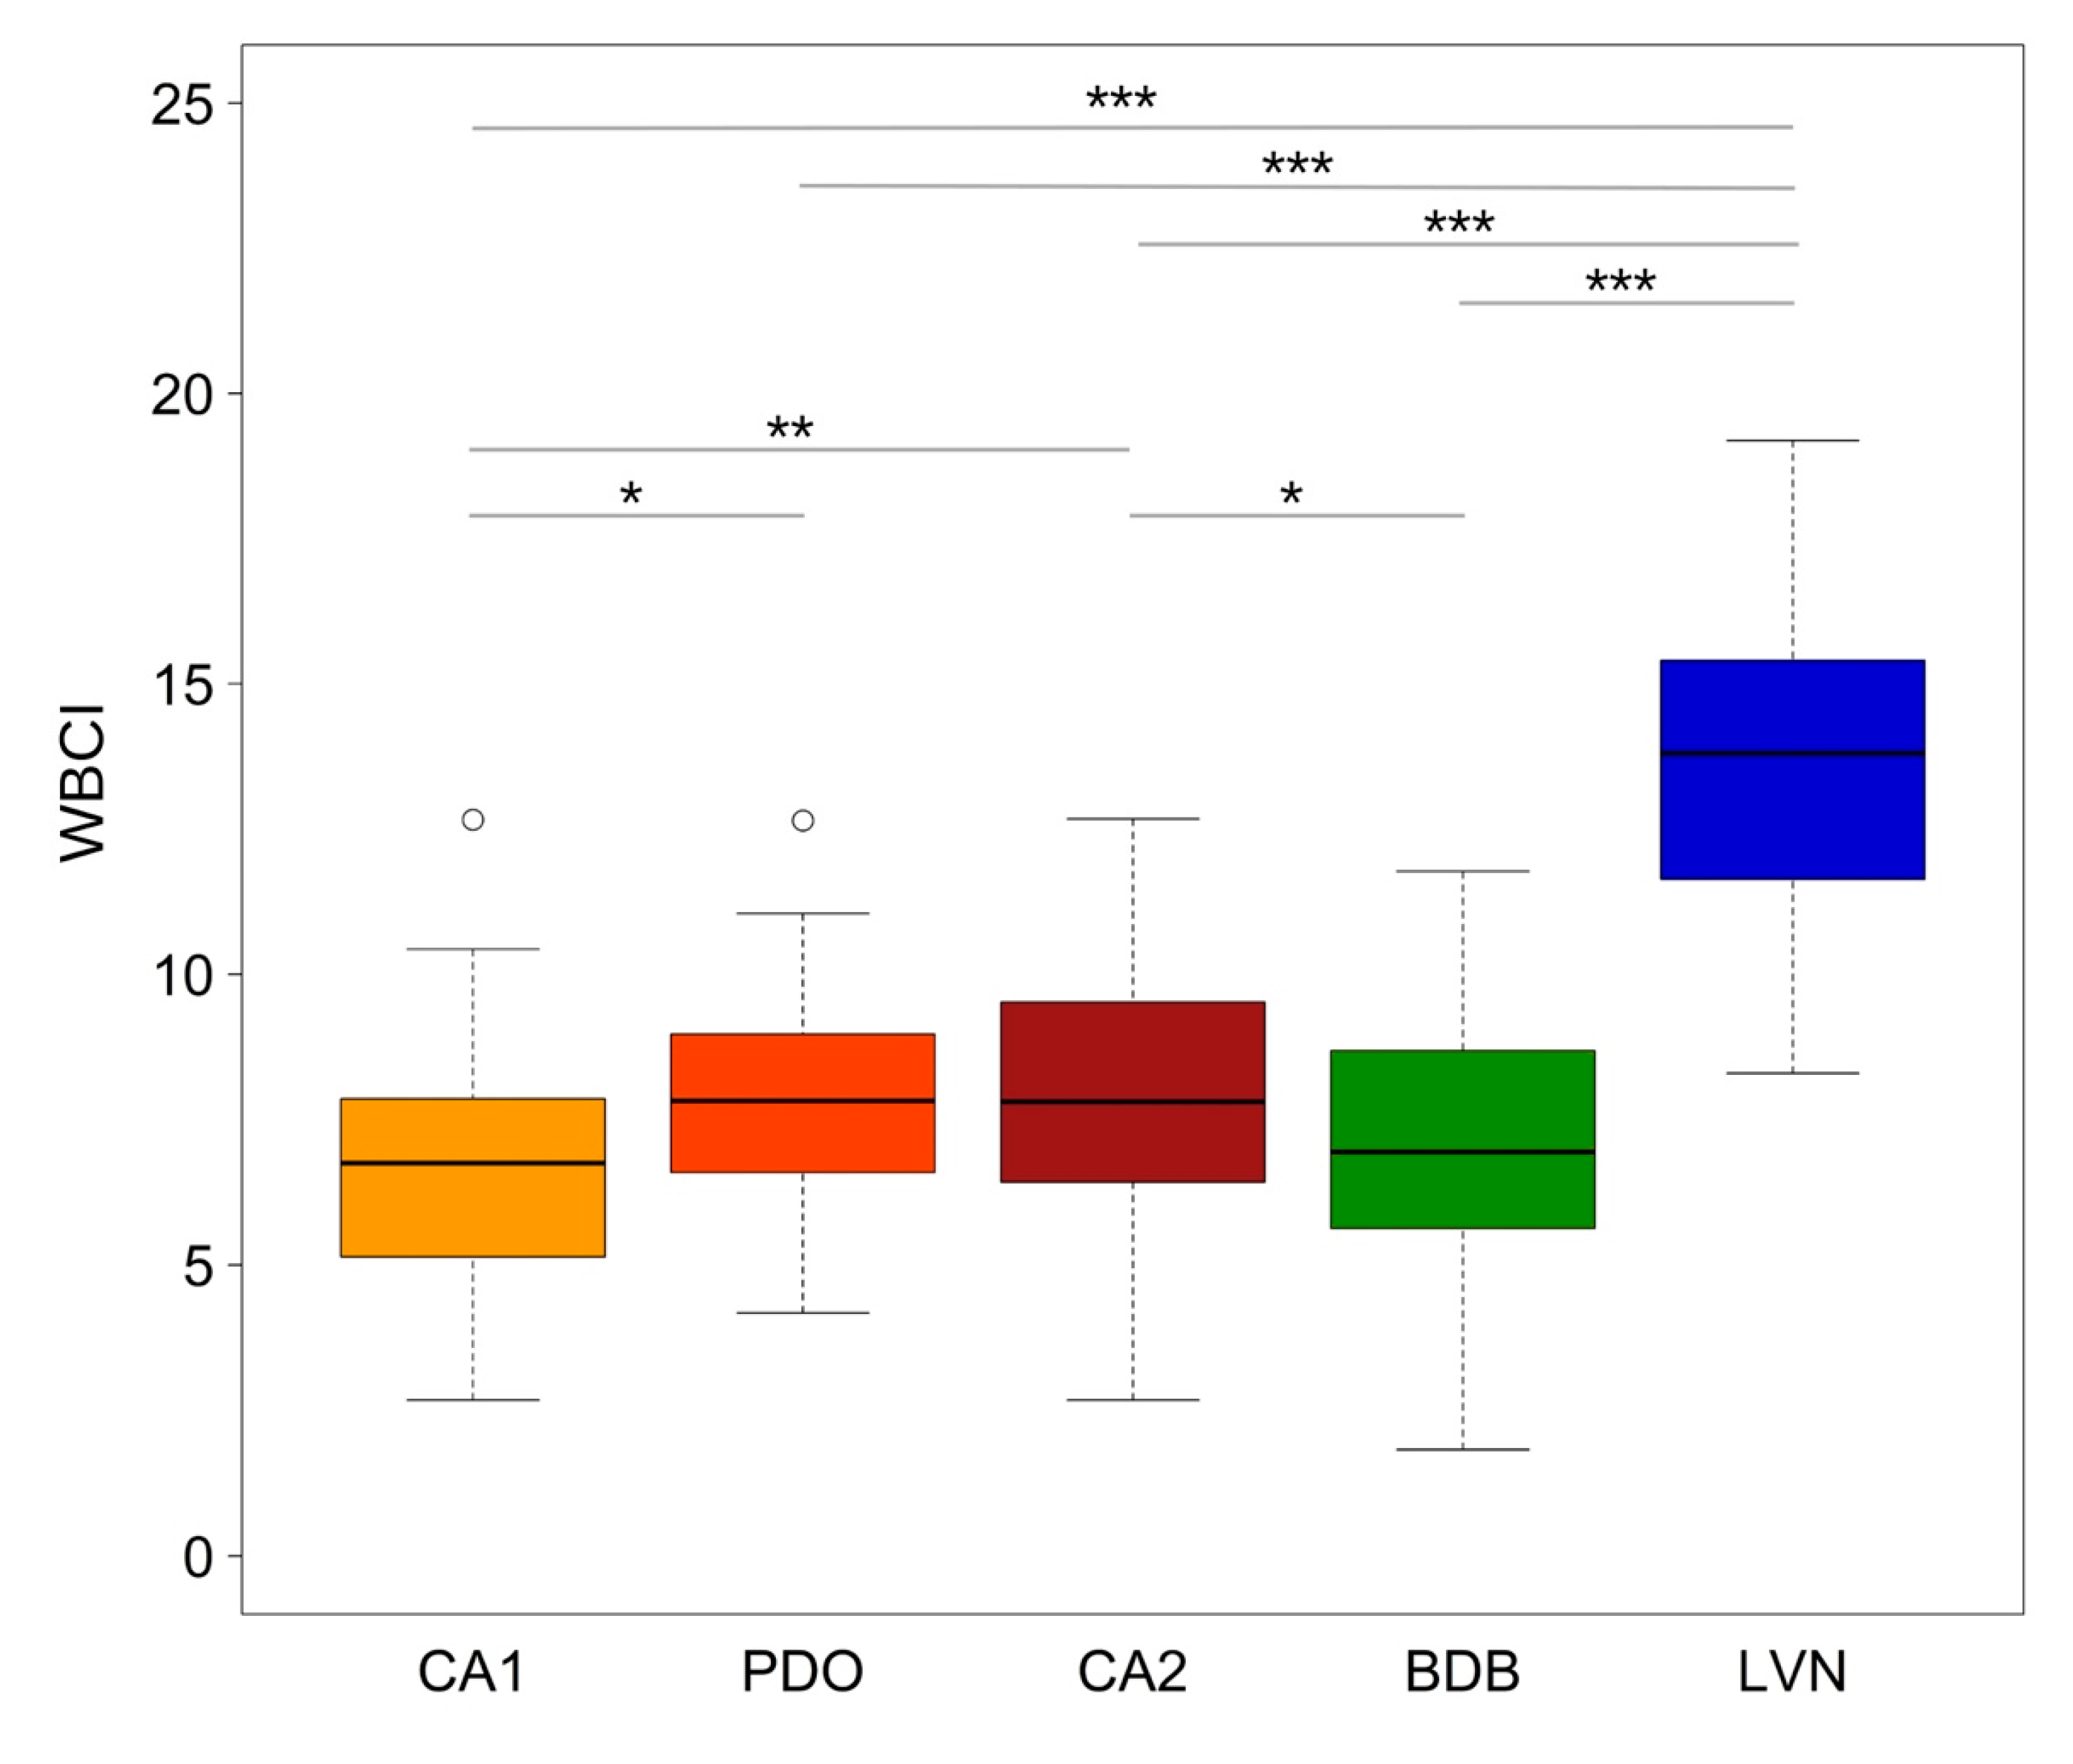
The WBCI was significantly higher at the LVN site than other sites. The differences between the other sites were minor, but CA2 (compared to BDB and CA1) and PDO (compared to CA1) still exhibited significantly higher WBCI values. BDB and CA1 hosted the least specialized communities (Figure 6).

4. Discussion

4.1. Bird Community Structure

In the sites managed with the uniform shelterwood system, bird richness increased from CA1 to PDO to CA2, i.e., showing an increasing bird richness related to the development stage (Table 3), replicating a widely studied trend showing species richness increases with forest age [62,63], which has also been observed in beech forests [64]. Bird community richness is typically correlated with forest age [65,66], and this pattern is often pronounced in all forms of management that involve even-aged forests [67,68]. However, in our study, the differences between sites managed with even-aged structures were minimal and only in one case significant. Even at CA2, which represented the most advanced development stage of the uniform shelterwood system, the stands were still biologically young (i.e., has not yet reached the structural and ecological complexity of late-successional natural forest), and, at the age of about 100 years, especially in mountain beech forests, bird communities are not highly diversified [64].
The clearest result of our analyses is the higher bird richness of the LVN site compared to all managed sites (Table 3 and Figure 2). High levels of spatial heterogeneity, typical of old-growth forest stands [69], characterized the LVN site and, more generally, the forest that it is a part of [70], as well as a high amount of deadwood (Table 1). High bird community diversity is driven by the high structural complexity of a forest, which has long been established as the primary determinant of bird richness in forest environments [45,71,72], and a high amount of deadwood is generally associated with high levels of bird community richness [66]. The structural complexity of the forest and deadwood can be regarded as key factors in shaping the richness of the bird community at the LNV site.
The BDB site showed low bird richness, comparable to the other managed sites (Figure 2). Forest stand management practices such as thinning or selective logging affect vegetation composition and forest structure, directly influencing the availability of resources for birds, depending on the intensity and frequency of interventions [73,74]. Despite creating a structurally diverse forest stand with a single-tree selection system, the forest management approach in the BDB site removes all trees with a diameter at breast height (dbh) > 45–50 cm and nearly all deadwood [75]. In other words, it removes the key elements that enable, in European forests, the coexistence of many bird species [19,66]. Many studies show that bird richness in uneven-aged managed forests is lower than in unmanaged forests and the mature stages of even-aged forests [74,76]. For example, uneven-aged beech forests in Thuringia, Germany, demonstrate a relatively poor bird community [77], and this general pattern also likely applies to the uneven-aged beech forest in our study.
All managed sites (CA1, PDO, CA2, and BDB) had similar bird communities despite showing substantial differences in forest stand structure (the number and size of trees, distribution of diameters, volume, and deadwood volume). This suggests a general, non-differentiated effect of forest management in “depressing” the community richness [21,78]. A similar pattern (limited differentiation between managed sites and significant differences between managed and unmanaged sites) has been observed in young beech forests (<50 years) in Northern Italy [79]. Although the pattern is very clear in our sites, a deeper investigation into bird community responses to management systems [80], which can vary under different conditions [67,81] and landscape-related factors [77], is necessary to generalize our results.
The rarefaction curve plots clearly show that cavity-nesting species contributed more than other species in differentiating the sites, mainly the LVN site (Figure 2B,E,H). Other species were relatively important only at the CA2 site (Figure 2C,F,I), which was the only site with non-continuous forest cover, allowing for the significant presence of ground-foraging species, which contributed to enriching the forest bird community [65,82].
When considering Shannon diversity (Figure 2D,E) and Simpson diversity (Figure 2G,H), the differentiation patterns among the sites remained the same. However, Simpson diversity showed more pronounced differences: more abundant species drove most of the differences, while rarer species contributed less. This result has also been observed in birds in broader-scale studies [72], but it contrasts with the findings for the beetle community at the same study sites [34]. In this case, for instance, rare saproxylic beetle species played a substantial role in diversity at the LVN site.

4.2. Bird Community Composition

The bird communities at the five sites showed a certain degree of differentiation in terms of species composition; however, only the LVN site showed consistent separation, with all the other sites being much less separated from each other (Figure 3A). The similarity among communities, at least for the managed sites, had a strong geographic basis: the CA1 and CA2 sites were very similar to each other, as were the PDO and BDB sites (Figure 4A), which are also geographically closer to each other (Figure 1). This suggests that biogeographic (i.e., bird species distribution range) and large-scale factors (i.e., patch size, habitat continuity, and landscape heterogeneity) play a decisive role in defining the composition of bird communities [66]. When cavity-nesting species were considered, the geographic pattern disappeared (Figure 4B), as the “ecological” requirement for the availability of cavities or suitable conditions for their excavation is more important [83]. Similarly, at our study site, Parisi et al. [34] found that the overall beetle community similarity was strongly dependent on geographic location, even more so than we found for bird communities; however, this effect was not observed for the saproxylic-beetle component, where the key ecological factor was the availability of deadwood.
The analysis of indicator species also revealed a lack of precise site characterization. The few high IV scores were all associated with the LVN site. In contrast, the managed sites showed very low IVs, even when certain species (such as Sylvia atricapilla and Phylloscopus collybita for CA1, Dendrocopos major and Fringilla coelebs for PDO, and Corvus cornix for BDB) were highly significant (Figure 5). These are, moreover, generalist species that are very common and widespread in this area [12]. Thus, the capacity of the managed sites to host “exclusive” species was low. In any case, species of European (Dryocopus martius) or local (Certhia familiaris) conservation concern, as well as those that are locally rare (Phylloscopus sibilatrix), are highly sensitive to forest management and are only present in the unmanaged site. Although using five-minute sequences, as in our study, may result in the underrepresentation of certain rare species—particularly those that vocalize less frequently—the overall pattern remains clearly discernible.
Forest management is considered potentially beneficial for enhancing overall bird community richness, especially in even-aged management systems. A mosaic of different management stages, each with different structures and conditions [62], can simulate some natural dynamics [84], offering a variety of habitats. This pattern has been demonstrated in plantations and intensively managed forests with a high degree of artificiality [85,86], but it could potentially apply to more “natural” woodland, such as beech forests [87]. Our data, showing limited differentiation and low specificity regarding the bird communities of the managed sites, did not confirm this pattern, at least for the examined beech forest stands in the northern Apennines, but the number of sites considered in our work is too small for general conclusions in this regard.

4.3. Ecological Specialization

In our study, the LVN site supported a highly specialized community: the WBCI values were consistently and significantly higher than those of the managed sites, reflecting, and even accentuating, the previously observed differences in forest stand structure and composition (Figure 6). In our study, the majority of the differences in species richness can be attributed to the higher number of cavity-nesting species at the LVN site (Figure 2), which are themselves indicators of highly specialized forest bird communities [46,83]. The indicator species followed the same pattern: Dryocopus martius, Sitta europaea, Certhia familiaris, and Certhia brachydactyla are cavity-nesting species, and Troglodytes troglodytes, Turdus philomelos, Phylloscopus sibilatrix, and Regulus ignicapilla, which had the highest IV at the LVN site, are forest specialists [88,89]. Moreover, some of these species (Dryocopus martius, Phylloscopus sibilatrix, Sitta europaea, and Certhia familiaris) exhibit a very high degree of specialization in Italian forests [56] and are among the best indicators (Sitta europaea and Certhia brachydactyla) in broadleaf forests [88].
The high specialization of bird communities is a characteristic feature of virgin forests, even in remnant patches across Europe [90,91,92]. While there is a general negative effect of factors such as small size and isolation [93], high specialization remains a distinctive trait of old-growth forests [19,94].
In summary, our study clearly confirms the negative effect of forest management on more demanding and specialized species [78,81]. Indeed, the uniform shelterwood system and single-tree selection system applied in the managed sites we studied [7,75] generally lead to a significant reduction in key factors for these species, including the presence of large trees [95], the richness of tree-related microhabitats (TreMs) [96,97], and the presence of snags [66]. Deadwood plays a decisive role, as it is associated with the presence of forest specialists among the birds of beech forests [19,21,22] and forests in general [98,99]. Deadwood also holds significant importance for many other aspects of biodiversity [100], including saproxylic beetles [101]. The fact that saproxylic species dominate the beetle community at the LVN site confirms the great relevance of deadwood quality and quantity at this site [34].
The very low amount of deadwood is also key to explaining the low specialization of the community at the BDB site. The beetle population also supports this finding, as saproxylic species are poorly represented in this site [34]. The generally low amount of deadwood in managed uneven-aged beech forests is considered a limiting factor for their ability to contribute highly to biodiversity [77].
As observed for species richness, the even-aged managed sites in our study (CA1, PDO, and CA2) were arranged in increasing order of the WBCI (i.e., increasing degree of specialization) according to the development stage. The differences between the various sites were small but significant, indicating that bird communities in the PDO and especially the CA2 sites are more specialized than those in BDB and CA1 sites (Figure 6). The most important driver here was likely the increasing size of trees: the quantity and diversity of tree-related microhabitats (TreMs) increase as their diameter increases, even in managed forests [102]. In particular, at the CA2 site, some large trees provided a greater availability of TreMs than at the other managed sites. Some authors have identified the mature stages of even-aged treatments as a factor that explains the biodiversity sustainability of beech forest management based on even-aged stands [87]. However, the validity of this hypothesis, or at least its general relevance, has been questioned [103], and the significant difference in forest specialization that we found between the bird communities in the more mature stages of the even-aged treatments (CA2) and the unmanaged site (LVN) suggests that it may be a questionable approach for northern Apennine beech forests.

5. Conclusions

The results of our study show that unmanaged old-growth forests host a much richer, more differentiated, and much more specialized bird community than managed forest stands. Besides being poorer and less specialized than those in unmanaged forests, the communities in managed forests are also very homogeneous. Therefore, the first consideration underscores the decisive role of protected areas and old-growth forests for conserving diversity in Northern Apennine beech forest stands. This pattern is further emphasized by the observation that all species of conservation concern—whether of local or European significance—as well as the rarest taxa in this geographical context, are entirely confined to the unmanaged site [101]. The second consideration concerns the homogeneity of the bird communities at the managed sites, which is in line with the results that we found for the beetle community at the same sites in a previous study [34], thus suggesting the need to cautiously assess the potential role of these forest stands in the diversification and conservation of biodiversity. Based on these findings, we can draw the following conclusions:
Firstly, unmanaged forest stands that have (or will have) characteristics of old-growthness represent a fundamental element of biodiversity conservation strategies. Unmanaged beech forests can sustain rich and, most importantly, highly specialized bird communities, thus including species of conservation concern. These areas are critical in highly homogeneous contexts, with a prevalence of even-aged or nearly even-aged forests. This should be a priority option from a management perspective, especially in public forests.
Secondly, the data collected suggest that a landscape mosaic of only managed forests cannot sustain high levels of diversity. Additionally, in our study area, there is no evidence of any consistent positive effects from a mosaic of patches with different management or development stages.
Thirdly, some of the limiting factors for diversity clearly emerged from the analyses of community composition: (i) a low number of snags; (ii) a low amount of deadwood; and (iii) a lack or scarcity of habitat trees. It is well known that intensive management focused solely on production goals can reduce the availability of natural habitats, leading to a decline in more sensitive species [80,104], but practices that promote structural diversity can enhance habitats for birds [105]. So, for forest managers, it is crucial to adopt management practices that balance ecological and economic aspects, promoting biodiversity conservation. Therefore, we recommend paying greater attention to defining the thresholds for snags, deadwood, and large trees to be retained during harvests (i.e., [98]), especially in establishing protocols for applying and monitoring these thresholds. The multi-scale approach is recommended for maximizing the effects of these practices [106], and implementing sustainable management techniques can help improve the condition of bird populations, preserving the natural richness of the Apennines.
Our study provides a preliminary analysis of the effects of forest management on bird communities in the beech forest stands of the northern Apennines. While the results are clear, some limitations warrant further investigation to enable broader generalization. First, the study is restricted to a single forest type and geographic region, and its observational design limits the strength of causal inference. As noted by Savilaakso et al. [76], the impacts of even-aged and uneven-aged forest management can vary substantially across different facets of biodiversity, emphasizing the importance of integrative, multi-taxa approaches in assessing ecological outcomes. Future research should, therefore, broaden the taxonomic scope, incorporate long-term monitoring, and account for the interaction between management practices and site-specific ecological conditions. We recommend further research in the Apennine beech forests, exploring more sites with different management systems and in different development stages [87], conducting more in-depth analyses, also at the landscape scale [66], and studying in detail the species of highest conservation interest, as well as those that are rarer and more ecologically demanding [101].
We also suggest investigating other forest types, particularly oak forests, which, in the same geographical area, are both intensively and extensively used. Moreover, multi-year surveys could provide a deeper understanding of the effects of forest management and individual forest intervention on bird communities over time [74]. Finally, we recommend incorporating additional taxonomic groups and their corresponding biomass proportions for each species [23], which are closely linked to forest structural characteristics, in future research. This should include groups such as small mammals, spiders, amphibians, fungi, and bryophytes to enable the thorough monitoring of both managed and unmanaged forest ecosystems.

Supplementary Materials

The following supporting information can be downloaded at: https://www.mdpi.com/article/10.3390/ecologies6030054/s1. Figure S1: BoxPlot of the total richness, cavity-nesting richness, and other species richness.

Author Contributions

Conceptualization, data curation, investigation, methodology, resources, roles/writing—original draft, writing—review and editing, G.L., F.P., E.V. and D.T.; investigation, resources, roles/writing—original draft, supervision, G.L., F.P., E.V., G.D. and D.T. All authors have read and agreed to the published version of the manuscript.

Funding

This study was supported by the following projects: PNRR, a project funded under the National Recovery and Resilience Plan (NRRP), Mission 4 Component 2 Investment 1.4—Call for tender No. 3138 of 16 December 2021, rectified by Decree No. 3175 of 18 December 2021 of the Italian Ministry of University and Research funded by the European Union—NextGenerationEU; Project code CN_00000033, Concession Decree No. 1034 of 17 June 2022 adopted by the Italian Ministry of University and Research, CUP H73C22000300001, Project title “National Biodiversity Future Center—NBFC”; and the LIFE Programme of the European Union, grant number LIFE18ENV/IT/000124 LIFE SySTEMiC.

Institutional Review Board Statement

Not applicable.

Acknowledgments

We thank the Reparto Carabinieri Biodiversità di Pistoia, the Baldo family, and the Unione dei Comuni Montani del Casentino for their logistical support.

Conflicts of Interest

Author Guglielmo Londi was employed by the company Dream Italia. The remaining authors declare that the research was conducted in the absence of any commercial or financial relationships that could be construed as a potential conflict of interest.

References

  1. Brunet, J.; Fritz, Ö.; Richnau, G. Biodiversity in European Beech Forests—A Review with Recommendations for Sustainable Forest Management. Ecol. Bull. 2010, 53, 77–94. [Google Scholar]
  2. Clements, T.J.; Mountford, E.P.; Pakenham, R.; Hahn, K.; Fanta, J.; Diaci, J.; Abruda, I.V. Contemporary Beech Forest M Anagement in Europe. NAT-M AN Working Report 1; Hahan, K., Fanta, J., Eds.; Nat-Man Project (Nature-Based Management of Beech in Europe); Forest & Landscape Denmark: Copenhagen, Denmark, 2001. [Google Scholar]
  3. Burrascano, S.; Chianucci, F.; Trentanovi, G.; Kepfer-Rojas, S.; Sitzia, T.; Tinya, F.; Doerfler, I.; Paillet, Y.; Nagel, T.A.; Mitic, B.; et al. Where Are We Now with European Forest Multi-Taxon Biodiversity and Where Can We Head To? Biol. Conserv. 2023, 284, 110176. [Google Scholar] [CrossRef]
  4. Walentowski, H.; Müller-Kroehling, S.; Bergmeier, E.; Bernhardt-Römermann, M.; Gossner, M.M.; Reif, A.; Schulze, E.-D.; Bußler, H.; Strätz, C.; Adelmann, W. Fagus sylvatica Forests and Their Faunal Diversity: A Regional and European Perspective. Ann. For. Res. 2014, 57, 2015–2231. [Google Scholar] [CrossRef]
  5. Magri, D.; Vendramin, G.G.; Comps, B.; Dupanloup, I.; Geburek, T.; Gömöry, D.; Latałowa, M.; Litt, T.; Paule, L.; Roure, J.M.; et al. A New Scenario for the Quaternary History of European Beech Populations: Palaeobotanical Evidence and Genetic Consequences. New Phytol. 2006, 171, 199–221. [Google Scholar] [CrossRef]
  6. Gasparini, P.; Di Cosmo, L.; Floris, A.; De Laurentis, D. (Eds.) Italian National Forest Inventory-Methods and Results of the Third Survey. Inventario Nazionale Delle Foreste e dei Serbatoi Forestali di Carbonio-Metodi e Risultati Della Terza Indagine; Springer Tracts in Civil Engineering; Springer International Publishing: Cham, Germany, 2022; ISBN 978-3-030-98677-3. [Google Scholar]
  7. Nocentini, S. Structure and Management of Beech (Fagus sylvatica L.) Forests in Italy. IForest-Biogeosci. For. 2009, 2, 105–113. [Google Scholar] [CrossRef]
  8. Marchetti, M.; Blasi, C. Old-Growth Forests in Italy: Towards a First Network. Ital. For. E Mont. 2010, 65, 679–698. [Google Scholar] [CrossRef]
  9. Vacchiano, G.; Garbarino, M.; Lingua, E.; Motta, R. Forest Dynamics and Disturbance Regimes in the Italian Apennines. For. Ecol. Manag. 2017, 388, 57–66. [Google Scholar] [CrossRef]
  10. Agnoletti, M.; Piras, F.; Venturi, M.; Santoro, A. Cultural Values and Forest Dynamics: The Italian Forests in the Last 150 Years. For. Ecol. Manag. 2022, 503, 119655. [Google Scholar] [CrossRef]
  11. Malandra, F.; Vitali, A.; Urbinati, C.; Garbarino, M. 70 Years of Land Use/Land Cover Changes in the Apennines (Italy): A Meta-Analysis. Forests 2018, 9, 551. [Google Scholar] [CrossRef]
  12. Tellini Florenzano, G. Birds as Indicators of Recent Environmental Changes in the Apennines (Foreste Casentinesi National Park, Central Italy). Ital. J. Zool. 2004, 71, 317–324. [Google Scholar] [CrossRef]
  13. Keller, V.; Herrando, S.; Voříšek, P.; Martí, F.; Kipson, M.; Milanesi, P.; Martí, D.; Anton, M.; Klvaňová, A.; Kalyakin, M.V.; et al. (Eds.) European Breeding Bird Atlas 2. Distribution, Abundance and Change, Lynx ed.; European Bird Census Council: Beek, The Netherlands, 2020. [Google Scholar]
  14. Borghi, C.; Francini, S.; McRoberts, R.E.; Parisi, F.; Lombardi, F.; Nocentini, S.; Maltoni, A.; Travaglini, D.; Chirici, G. Country-Wide Assessment of Biodiversity, Naturalness and Old-Growth Status Using National Forest Inventory Data. Eur. J. For. Res. 2024, 143, 271–303. [Google Scholar] [CrossRef]
  15. Fabbio, G.; Merlo, M.; Tosi, V. Silvicultural Management in Maintaining Biodiversity and Resistance of Forests in Europe—The Mediterranean Region. Maint. For. Biodivers. 2003, 67, 67–76. [Google Scholar] [CrossRef]
  16. Barbati, A.; Marchetti, M.; Chirici, G.; Corona, P. European Forest Types and Forest Europe SFM Indicators: Tools for Monitoring Progress on Forest Biodiversity Conservation. Mech. Predict. Ecol. Change Manag. For. Sel. Pap. Second Int. Conf. Biodivers. For. Ecosyst. Landsc. 2014, 321, 145–157. [Google Scholar] [CrossRef]
  17. Voříšek, P.; Schwartz, M.; Rastislav, R. Pilot Study: Common Forest Bird Species Indicator; FOREST EUROPE Liaison Unit: Bratislava, Slovakia, 2019. [Google Scholar]
  18. Amori, G.; Mazzei, A.; Storino, P.; Urso, S.; Luzzi, G.; Aloise, G.; Gangale, C.; Ouzounov, D.; Luiselli, L.; Pizzolotto, R.; et al. Forest Management and Conservation of Faunal Diversity in Italy: A Review. Plant Biosyst. 2022, 155, 1226–1239. [Google Scholar] [CrossRef]
  19. Redolfi De Zan, L.; Battisti, C.; Carpaneto, G.M. Bird and Beetle Assemblages in Relict Beech Forests of Central Italy: A Multi-Taxa Approach to Assess the Importance of Dead Wood in Biodiversity Conservation. Community Ecol. 2014, 15, 235–245. [Google Scholar] [CrossRef]
  20. Parisi, F.; Innangi, M.; Tognetti, R.; Lombardi, F.; Chirici, G.; Marchetti, M. Forest Stand Structure and Coarse Woody Debris Determine the Biodiversity of Beetle Communities in Mediterranean Mountain Beech Forests. Glob. Ecol. Conserv. 2021, 28, e01637. [Google Scholar] [CrossRef]
  21. Balestrieri, R.; Basile, M.; Posillico, M.; Altea, T.; De Cinti, B.; Matteucci, G. A Guild-Based Approach to Assessing the Influence of Beech Forest Structure on Bird Communities. For. Ecol. Manag. 2015, 356, 216–223. [Google Scholar] [CrossRef]
  22. De Zan, L.R.; De Gasperis, S.r.; Fiore, L.; Battisti, C.; Carpaneto, G.M. The Importance of Dead Wood for Hole-Nesting Birds: A Two Years Study in Three Beech Forests of Central Italy. Isr. J. Ecol. Evol. 2016, 63, 19–27. [Google Scholar] [CrossRef]
  23. Parisi, F.; Vangi, E.; Francini, S.; D’Amico, G.; Chirici, G.; Marchetti, M.; Lombardi, F.; Travaglini, D.; Ravera, S.; De Santis, E.; et al. Sentinel-2 Time Series Analysis for Monitoring Multi-Taxon Biodiversity in Mountain Beech Forests. Front. For. Glob. Change 2023, 6, 1020477. [Google Scholar] [CrossRef]
  24. Russo, D.; Cistrone, L.; Jones, G.; Mazzoleni, S. Roost Selection by Barbastelle Bats (Barbastella Barbastellus, Chiroptera: Vespertilionidae) in Beech Woodlands of Central Italy: Consequences for Conservation. Biol. Conserv. 2004, 117, 73–81. [Google Scholar] [CrossRef]
  25. Russo, D.; Cistrone, L.; Garonna, A.P.; Jones, G. Reconsidering the Importance of Harvested Forests for the Conservation of Tree-Dwelling Bats. Biodivers. Conserv. 2010, 19, 2501–2515. [Google Scholar] [CrossRef]
  26. Fraixedas, S.; Lindén, A.; Piha, M.; Cabeza, M.; Gregory, R.; Lehikoinen, A. A State-of-the-Art Review on Birds as Indicators of Biodiversity: Advances, Challenges, and Future Directions. Ecol. Indic. 2020, 118, 106728. [Google Scholar] [CrossRef]
  27. Turner, A.; Fischer, M.; Tzanopoulos, J. Sound-Mapping a Coniferous Forest-Perspectives for Biodiversity Monitoring and Noise Mitigation. PLoS ONE 2018, 13, e0189843. [Google Scholar] [CrossRef] [PubMed]
  28. Farina, A.; Pieretti, N. Sonic Environment and Vegetation Structure: A Methodological Approach for a Soundscape Analysis of a Mediterranean Maqui. Ecol. Acoust. 2014, 21, 120–132. [Google Scholar] [CrossRef]
  29. Farina, A.; Mullet, T.C. Sonotope Patterns within a Mountain Beech Forest of Northern Italy: A Methodological and Empirical Approach. Front. Ecol. Evol. 2024, 12, 1341760. [Google Scholar] [CrossRef]
  30. Sugai, L.S.M.; Silva, T.S.F.; Ribeiro, J.W.; Llusia, D. Terrestrial Passive Acoustic Monitoring: Review and Perspectives. BioScience 2019, 69, 15–25. [Google Scholar] [CrossRef]
  31. Alcocer, I.; Lima, H.; Sugai, L.S.M.; Llusia, D. Acoustic Indices as Proxies for Biodiversity: A Meta-analysis. Biol. Rev. 2022, 97, 2209–2236. [Google Scholar] [CrossRef]
  32. Bradfer-Lawrence, T.; Desjonqueres, C.; Eldridge, A.; Johnston, A.; Metcalf, O. Using Acoustic Indices in Ecology: Guidance on Study Design, Analyses and Interpretation. Methods Ecol. Evol. 2023, 14, 2192–2204. [Google Scholar] [CrossRef]
  33. Farina, A.; Lattanzi, E.; Malavasi, R.; Pieretti, N.; Piccioli, L. Avian Soundscapes and Cognitive Landscapes: Theory, Application and Ecological Perspectives. Landsc. Ecol. 2011, 26, 1257–1267. [Google Scholar] [CrossRef]
  34. Parisi, F.; Mazziotta, A.; Chirici, G.; D’amico, G.; Vangi, E.; Francini, S.; Travaglini, D. Effects of Forest Management on Beetle (Coleoptera) Communities in Beech Forests (Fagus sylvatica) in the Apennines of Central Italy (Tuscany). Forests 2024, 15, 1085. [Google Scholar] [CrossRef]
  35. Blasi, C.; Capotorti, G.; Copiz, R.; Guida, D.; Mollo, B.; Smiraglia, D.; Zavattero, L. Classification and Mapping of the Ecoregions of Italy. Plant Biosyst. 2014, 148, 1255–1345. [Google Scholar] [CrossRef]
  36. Rempel, R.S.; Francis, C.M.; Robinson, J.N.; Campbell, M. Comparison of Audio Recording System Performance for Detecting and Monitoring Songbirds. J. Field Ornithol. 2013, 84, 86–97. [Google Scholar] [CrossRef]
  37. Farina, A.; Ceraulo, M.; Bobryk, C.; Pieretti, N.; Quinci, E.; Lattanzi, E. Spatial and Temporal Variation of Bird Dawn Chorus and Successive Acoustic Morning Activity in a Mediterranean Landscape. Bioacoustics 2015, 24, 269–288. [Google Scholar] [CrossRef]
  38. Voříšek, P.; Klvaňová, A.; Wotton, S.; Gregory, R.D. (Eds.) A Best Practice Guide for Wild Bird Monitoring Schemes; CSO/RSPB: Sandy, UK, 2008; p. 151. ISBN 978-80-903554-3-9. [Google Scholar]
  39. Balestrieri, R.; Basile, M.; Posillico, M.; Altea, T.; Matteucci, G. Survey Effort Requirements for Bird Community Assessment in Forest Habitats. Acta Ornithol. 2017, 52, 1–9. [Google Scholar] [CrossRef]
  40. Hujatulatif, A.; Jumadi, J.; Kuswanto, H.; Ilma, A.Z. Analyzing and Comparing Frequency of the Birds Sound Spectrum Using Audacity Software in Practicum Activity. J. Penelit. Pendidik. IPA 2022, 8, 2586–2592. [Google Scholar] [CrossRef]
  41. Cook, A.; Hartley, S. Efficient Sampling of Avian Acoustic Recordings: Intermittent Subsamples Improve Estimates of Single Species Prevalence and Total Species Richness. Avian Conserv. Ecol. 2018, 13, art21. [Google Scholar] [CrossRef]
  42. Yip, D.A.; Mahon, C.L.; MacPhail, A.G.; Bayne, E.M. Automated Classification of Avian Vocal Activity Using Acoustic Indices in Regional and Heterogeneous Datasets. Methods Ecol. Evol. 2021, 12, 707–719. [Google Scholar] [CrossRef]
  43. Diaz, S.D.U.; Gan, J.L.; Tapang, G.A. Acoustic Indices as Proxies for Bird Species Richness in an Urban Green Space in Metro Manila. PLoS ONE 2023, 18, e0289001. [Google Scholar] [CrossRef] [PubMed]
  44. Budka, M.; Sokołowska, E.; Muszyńska, A.; Staniewicz, A. Acoustic Indices Estimate Breeding Bird Species Richness with Daily and Seasonally Variable Effectiveness in Lowland Temperate Białowieża Forest. Ecol. Indic. 2023, 148, 110027. [Google Scholar] [CrossRef]
  45. Erdelen, M. Bird Communities and Vegetation Structure: I. Correlations and Comparisons of Simple and Diversity Indices. Oecologia 1984, 61, 277–284. [Google Scholar] [CrossRef] [PubMed]
  46. Wesołowski, T.; Martin, K. Tree Holes and Hole-Nesting Birds in European and North American Forests. In Ecology and Conservation of Forest Birds; Mikusiński, G., Roberge, J.-M., Fuller, R.J., Eds.; Cambridge University Press: Cambridge, UK, 2018; pp. 79–134. ISBN 978-1-107-42072-4. [Google Scholar]
  47. Zurr, A.F.; Ieno, E.N.; Walker, N.J.; Saveliev, A.A.; Smith, G.M. Mixed Effects Models and Extensions in Ecology with R. Statistics for Biology and Health; Springer: Berlin/Heidelberg, Germany, 2009. [Google Scholar]
  48. Bates, D.; Mächler, M.; Bolker, B.; Walker, S. Fitting Linear Mixed-Effects Models Using Lme4. J. Stat. Softw. 2015, 67, 1–48. [Google Scholar] [CrossRef]
  49. Hsieh, T.C.; Ma, K.H.; Chao, A. iNEXT: An R Package for Rarefaction and Extrapolation of Species Diversity (HIll Numbers). Methods Ecol. Evol. 2016, 7, 1451–1456. [Google Scholar] [CrossRef]
  50. Smith, J.M.; Mather, M.E. Using Assemblage Data in Ecological Indicators: A Comparison and Evaluation of Commonly Available Statistical Tools. Ecol. Indic. 2012, 13, 253–262. [Google Scholar] [CrossRef]
  51. Chao, A.; Chazdon, R.L.; Colwell, R.K.; Shen, T. A New Statistical Approach for Assessing Similarity of Species Composition with Incidence and Abundance Data. Ecol. Lett. 2005, 8, 148–159. [Google Scholar] [CrossRef]
  52. Morisita, M. Measuring of Interspecific Association and Similarity between Assemblages. Mem. Fac. Sci. Kyushu. Univ. Ser. E Biol. 1959, 3, 65–80. [Google Scholar]
  53. Oksanen, J.; Simpson, G.L.; Blanchet, F.G.; Kindt, R.; Legendre, P.; Minchin, P.R.; O’Hara, R.B.; Solymos, P.; Stevens, M.H.H.; Szoecs, E.; et al. Community Ecology Package. R Package ‘Vegan’, Version 2.6-8; Comprehensive R Archive Network; 2022. Available online: https://CRAN.R-project.org/package=labdsv (accessed on 14 June 2025).
  54. Dufrene, M.; Legendre, P. Species Assemblages and Indicator Species: The Need for a Flexible Asymmetrical Approach. Ecol. Monogr. 1997, 67, 345–366. [Google Scholar] [CrossRef]
  55. Roberts, D.W. Package ‘Labdsv’, version: 2.1-0; Comprehensive R Archive Network (CRAN), R Foundation for Statistical Computing: Vienna, Austria, 2023.
  56. Londi, G.; Tellini Florenzano, G.; Mini, L.; Caliendo, M.F.; Campedelli, T.; De Carli, E. Assessing Woodland Ecological Characters Through a New Objective Bird Community Index, the WBCI. Avocetta 2009, 33, 107–114. [Google Scholar]
  57. Phillips, J.N.; Cooper, W.J.; Luther, D.A.; Derryberry, E.P. Territory Quality Predicts Avian Vocal Performance Across an Urban-Rural Gradient. Front. Ecol. Evol. 2020, 8, 587120. [Google Scholar] [CrossRef]
  58. Grava, T.; Otter, K.A.; Grava, A. Vocal Performance Varies with Habitat Quality in Black-Capped Chickadees (Poecile atricapillus). Behaviour 2012, 149, 35–50. [Google Scholar] [CrossRef]
  59. Kuznetzova, A.; Brockhoff, P.B.; Christensen, R.H.B.; Jensen, S.P. Package ‘lmerTest’, lmerTest: Tests in Linear Mixed Effects Models (R Package Version 3.1-3) [Computer Software]; R Foundation for Statistical Computing: Vienna, Austria, 2022. [Google Scholar]
  60. R Core Team. R: A Language and Environment for Statistical Computing, version 4.5.1; Comprehensive R Archive Network: Vienna, Austria, 2024. [Google Scholar]
  61. Clarke, K.R. Non-Parametric Multivariate Analyses of Changes in Community Structure. Aust. J. Ecol. 1993, 18, 117–143. [Google Scholar] [CrossRef]
  62. Begehold, H.; Rzanny, M.; Flade, M. Forest Development Phases as an Integrating Tool to Describe Habitat Preferences of Breeding Birds in Lowland Beech Forests. J. Ornithol. 2015, 156, 19–29. [Google Scholar] [CrossRef]
  63. Birčák, T.; Reif, J. The Effects of Tree Age and Tree Species Composition on Bird Species Richness in a Central European Montane Forest. Biologia 2015, 70, 1528–1536. [Google Scholar] [CrossRef]
  64. Moning, C.; Müller, J. Critical Forest Age Thresholds for the Diversity of Lichens, Molluscs and Birds in Beech (Fagus sylvatica L.) Dominated Forests. Ecol. Indic. 2009, 9, 922–932. [Google Scholar] [CrossRef]
  65. Gil-Tena, A.; Saura, S.; Brotons, L. Effects of Forest Composition and Structure on Bird Species Richness in a Mediterranean Context: Implications for Forest Ecosystem Management. For. Ecol. Manag. 2007, 242, 470–476. [Google Scholar] [CrossRef]
  66. Basile, M.; Storch, I.; Mikusiński, G. Abundance, Species Richness and Diversity of Forest Bird Assemblages—The Relative Importance of Habitat Structures and Landscape Context. Ecol. Indic. 2021, 133, 108402. [Google Scholar] [CrossRef]
  67. Du Bus De Warnaffe, G.; Deconchat, M. Impact of Four Silvicultural Systems on Birds in the Belgian Ardenne: Implications for Biodiversity in Plantation Forests. Biodivers. Conserv. 2008, 17, 1041–1055. [Google Scholar] [CrossRef]
  68. Mentil, L.; Battisti, C.; Carpaneto, G.M. The Older the Richer: Significant Increase in Breeding Bird Diversity Along an Age Gradient of Different Coppiced Woods. Web Ecol. 2018, 18, 143–151. [Google Scholar] [CrossRef]
  69. Franklin, J.F.; Van Pelt, R. Spatial Aspects of Structural Complexity in Old-Growth Forests. J. For. 2004, 102, 22–28. [Google Scholar] [CrossRef]
  70. Motta, R.; Garbarino, M.; Berretti, R.; Bono, A.; Curovic, M.; Dukić, V.; Nola, P. Monastic Silviculture Legacies and Current Old-Growthness of Silver Fir (Abies alba) Forests in the Northern Apennines (Italy). Front. For. Glob. Change 2023, 6, 1252462. [Google Scholar] [CrossRef]
  71. MacArthur, R.H.; MacArthur, J.W. On Bird Species Diversity. Ecology 1961, 42, 594–598. [Google Scholar] [CrossRef]
  72. Lian, Z.; Wang, J.; Fan, C.; Von Gadow, K. Structure Complexity Is the Primary Driver of Functional Diversity in the Temperate Forests of Northeastern China. For. Ecosyst. 2022, 9, 100048. [Google Scholar] [CrossRef]
  73. De La Montaña, E.; Rey-Benayas, J.M.; Carrascal, L.M. Response of Bird Communities to Silvicultural Thinning of Mediterranean Maquis. J. Appl. Ecol. 2006, 43, 651–659. [Google Scholar] [CrossRef]
  74. Versluijs, M.; Hekkala, A.-M.; Lindberg, E.; Lämås, T.; Hjältén, J. Comparing the Effects of Even-Aged Thinning and Selective Felling on Boreal Forest Birds. For. Ecol. Manag. 2020, 475, 118404. [Google Scholar] [CrossRef]
  75. Bottalico, F.; Brundu, P.; Ciancio, O.; Nocentini, S.; Puletti, N.; Travaglini, D. “Baldo’s Forest”: Selection felling based on traditional knowledge in a beech stand in the Tuscan Appenines. For.-Riv. Selvic. Ed Ecol. For. 2010, 7, 58–72. [Google Scholar] [CrossRef]
  76. Savilaakso, S.; Johansson, A.; Häkkilä, M.; Uusitalo, A.; Sandgren, T.; Mönkkönen, M.; Puttonen, P. What Are the Effects of Even-Aged and Uneven-Aged Forest Management on Boreal Forest Biodiversity in Fennoscandia and European Russia? A Systematic Review. Environ. Evid. 2021, 10, 1. [Google Scholar] [CrossRef]
  77. Schall, P.; Gossner, M.M.; Heinrichs, S.; Fischer, M.; Boch, S.; Prati, D.; Jung, K.; Baumgartner, V.; Blaser, S.; Böhm, S.; et al. The Impact of Even-aged and Uneven-aged Forest Management on Regional Biodiversity of Multiple Taxa in European Beech Forests. J. Appl. Ecol. 2018, 55, 267–278. [Google Scholar] [CrossRef]
  78. Bouvet, A.; Paillet, Y.; Archaux, F.; Tillon, L.; Denis, P.; Gilg, O.; Gosselin, F. Effects of Forest Structure, Management and Landscape on Bird and Bat Communities. Environ. Conserv. 2016, 43, 148–160. [Google Scholar] [CrossRef]
  79. Laiolo, P.; Rolando, A.; Valsania, V. Responses of Birds to the Natural Re-Establishment of Wilderness in Montane Beechwoods of North-Western Italy. Acta Oecologica 2004, 25, 129–136. [Google Scholar] [CrossRef]
  80. Czeszczewik, D.; Zub, K.; Stanski, T.; Sahel, M.; Kapusta, A.; Walankiewicz, W. Effects of Forest Management on Bird Assemblages in the Bialowieza Forest, Poland. IForest-Biogeosci. For. 2015, 8, 377–385. [Google Scholar] [CrossRef]
  81. Paillet, Y.; Bergès, L.; Hjältén, J.; Ódor, P.; Avon, C.; Bernhardt-Römermann, M.; Bijlsma, R.; De Bruyn, L.; Fuhr, M.; Grandin, U.; et al. Biodiversity Differences Between Managed and Unmanaged Forests: Meta-Analysis of Species Richness in Europe. Conserv. Biol. 2010, 24, 101–112. [Google Scholar] [CrossRef]
  82. Lewandowski, P.; Przepióra, F.; Ciach, M. Single Dead Trees Matter: Small-Scale Canopy Gaps Increase the Species Richness, Diversity and Abundance of Birds Breeding in a Temperate Deciduous Forest. For. Ecol. Manag. 2021, 481, 118693. [Google Scholar] [CrossRef]
  83. Martin, K.; Aitken, K.E.H.; Wiebe, K.L. Nest Sites and Nest Webs for Cavity-Nesting Communities in Interior British Columbia, Canada: Nest Characteristics and Niche Partitioning. Condor 2004, 106, 5–19. [Google Scholar] [CrossRef]
  84. Angelstam, P.K. Maintaining and Restoring Biodiversity in European Boreal Forests by Developing Natural Disturbance Regimes. J. Veg. Sci. 1998, 9, 593–602. [Google Scholar] [CrossRef]
  85. Wilson, M.W.; Pithon, J.; Gittings, T.; Kelly, T.C.; Giller, P.S.; O’Halloran, J. Effects of Growth Stage and Tree Species Composition on Breeding Bird Assemblages of Plantation Forests. Bird Study 2006, 53, 225–236. [Google Scholar] [CrossRef]
  86. Sweeney, O.F.M.; Wilson, M.W.; Irwin, S.; Kelly, T.C.; O’Halloran, J. Breeding Bird Communities of Second-rotation Plantations at Different Stages of the Forest Cycle. Bird Study 2010, 57, 301–314. [Google Scholar] [CrossRef]
  87. Schall, P.; Heinrichs, S.; Ammer, C.; Ayasse, M.; Boch, S.; Buscot, F.; Fischer, M.; Goldmann, K.; Overmann, J.; Schulze, E.; et al. Can Multi-taxa Diversity in European Beech Forest Landscapes Be Increased by Combining Different Management Systems? J. Appl. Ecol. 2020, 57, 1363–1375. [Google Scholar] [CrossRef]
  88. Bani, L.; Massimino, D.; Bottoni, L.; Massa, R. A Multiscale Method for Selecting Indicator Species and Priority Conservation Areas: A Case Study for Broadleaved Forests in Lombardy, Italy. Conserv. Biol. 2006, 20, 512–526. [Google Scholar] [CrossRef] [PubMed]
  89. Mikusiński, G.; Villero, D.; Herrando, S.; Brotons, L. Macroecological Patterns in Forest Bird Diversity in Europe. In Ecology and Conservation of Forest Bird; Mikusiński, G., Roberge, J.-M., Fuller, R.J., Eds.; Cambridge University Press: Cambridge, UK, 2018; pp. 137–182. ISBN 978-1-107-42072-4. [Google Scholar]
  90. Boncina, A. Comparison of Structure and Biodiversity in the Rajhenav Virgin Forest Remnant and Managed Forest in the Dinaric Region of Slovenia. Glob. Ecol. Biogeogr. 2000, 9, 201–211. [Google Scholar] [CrossRef]
  91. Tomiałojć, L.; Wesołowski, T. Diversity of the Białowieża Forest Avifauna in Space and Time. J. Ornithol. 2004, 145, 81–92. [Google Scholar] [CrossRef]
  92. Kornan, M. Breeding Bird Assemblage Dynamics of a Primaeval Temperate Mixed Forest in the Western Carpathians (Slovakia): Support for Pluralistic Community Concept. Ornis Fenn. 2013, 90, 151–177. [Google Scholar] [CrossRef]
  93. Kouki, J.; Väänänen, A. Impoverishment of Resident Old-Growth Forest Bird Assemblages along an Isolation Gradient of Protected Areas in Eastern Finland. Ornis Fenn. 2000, 77, 145–154. [Google Scholar]
  94. Rosenvald, R.; Lõhmus, A.; Kraut, A.; Remm, L. Bird Communities in Hemiboreal Old-Growth Forests: The Roles of Food Supply, Stand Structure, and Site Type. For. Ecol. Manag. 2011, 262, 1541–1550. [Google Scholar] [CrossRef]
  95. Kebrle, D.; Zasadil, P.; Hošek, J.; Barták, V.; Šťastný, K. Large Trees as a Key Factor for Bird Diversity in Spruce-Dominated Production Forests: Implications for Conservation Management. For. Ecol. Manag. 2021, 496, 119460. [Google Scholar] [CrossRef]
  96. Paillet, Y.; Archaux, F.; Du Puy, S.; Bouget, C.; Boulanger, V.; Debaive, N.; Gilg, O.; Gosselin, F.; Guilbert, E. The Indicator Side of Tree Microhabitats: A Multi-taxon Approach Based on Bats, Birds and Saproxylic Beetles. J. Appl. Ecol. 2018, 55, 2147–2159. [Google Scholar] [CrossRef]
  97. Parisi, F.; D’Amico, G.; Vangi, E.; Chirici, G.; Francini, S.; Cocozza, C.; Giannetti, F.; Londi, G.; Nocentini, S.; Borghi, C.; et al. Tree-Related Microhabitats and Multi-Taxon Biodiversity Quantification Exploiting ALS Data. Forests 2024, 15, 660. [Google Scholar] [CrossRef]
  98. Angelstam, P.K.; Bütler, R.; Lazdinis, M.; Mikusiński, G.; Roberge, J.M. Habitat Thresholds for Focal Species at Multiple Scales and Forest Biodiversity Conservation—Dead Wood as an Example. Ann. Zool. Fenn. 2003, 40, 473–482. [Google Scholar]
  99. Lõhmus, A.; Kinks, R.; Soon, M. The Importance of Dead-Wood Supply for Woodpeckers in Estonia. Balt. For. 2010, 16, 76–86. [Google Scholar]
  100. Siitonen, J.; Jonsson, B.G. Other Association with Dead Woody Material. In Biodiversity in Dead Wood; Stokland, J.N., Siitonen, J., Jonsson, B.G., Eds.; Cambridge University Press: Cambridge, UK, 2012; pp. 58–81. [Google Scholar]
  101. Zasadil, P.; Romportl, D.; Horák, J. Disentangling the Roles of Topography, Patch, and Land Use on Conservation Trait Status of Specialist Birds in Marginal Forest Land Use Types. Forests 2020, 11, 103. [Google Scholar] [CrossRef]
  102. Vuidot, A.; Paillet, Y.; Archaux, F.; Gosselin, F. Influence of Tree Characteristics and Forest Management on Tree Microhabitats. Biol. Conserv. 2011, 144, 441–450. [Google Scholar] [CrossRef]
  103. Bruun, H.H.; Heilmann-Clausen, J. What Is Unmanaged Forest and How Does It Sustain Biodiversity in Landscapes with a Long History of Intensive Forestry? J. Appl. Ecol. 2021, 58, 1813–1816. [Google Scholar] [CrossRef]
  104. Tozer, D.C.; Burke, D.M.; Nol, E.; Elliott, K.A. Short-Term Effects of Group-Selection Harvesting on Breeding Birds in a Northern Hardwood Forest. For. Ecol. Manag. 2010, 259, 1522–1529. [Google Scholar] [CrossRef]
  105. Arcilla, N.; Strazds, M. Ten Principles for Bird-Friendly Forestry: Conservation Approaches in Natural Forests Used for Timber Production. Birds 2023, 4, 245–261. [Google Scholar] [CrossRef]
  106. Cordeiro Pereira, J.M.; Mikusiński, G.; Storch, I. A Systematic Review of the Effects of Multi-Purpose Forest Management Practices on the Breeding Success of Forest Birds. Curr. For. Rep. 2024, 10, 175–195. [Google Scholar] [CrossRef]
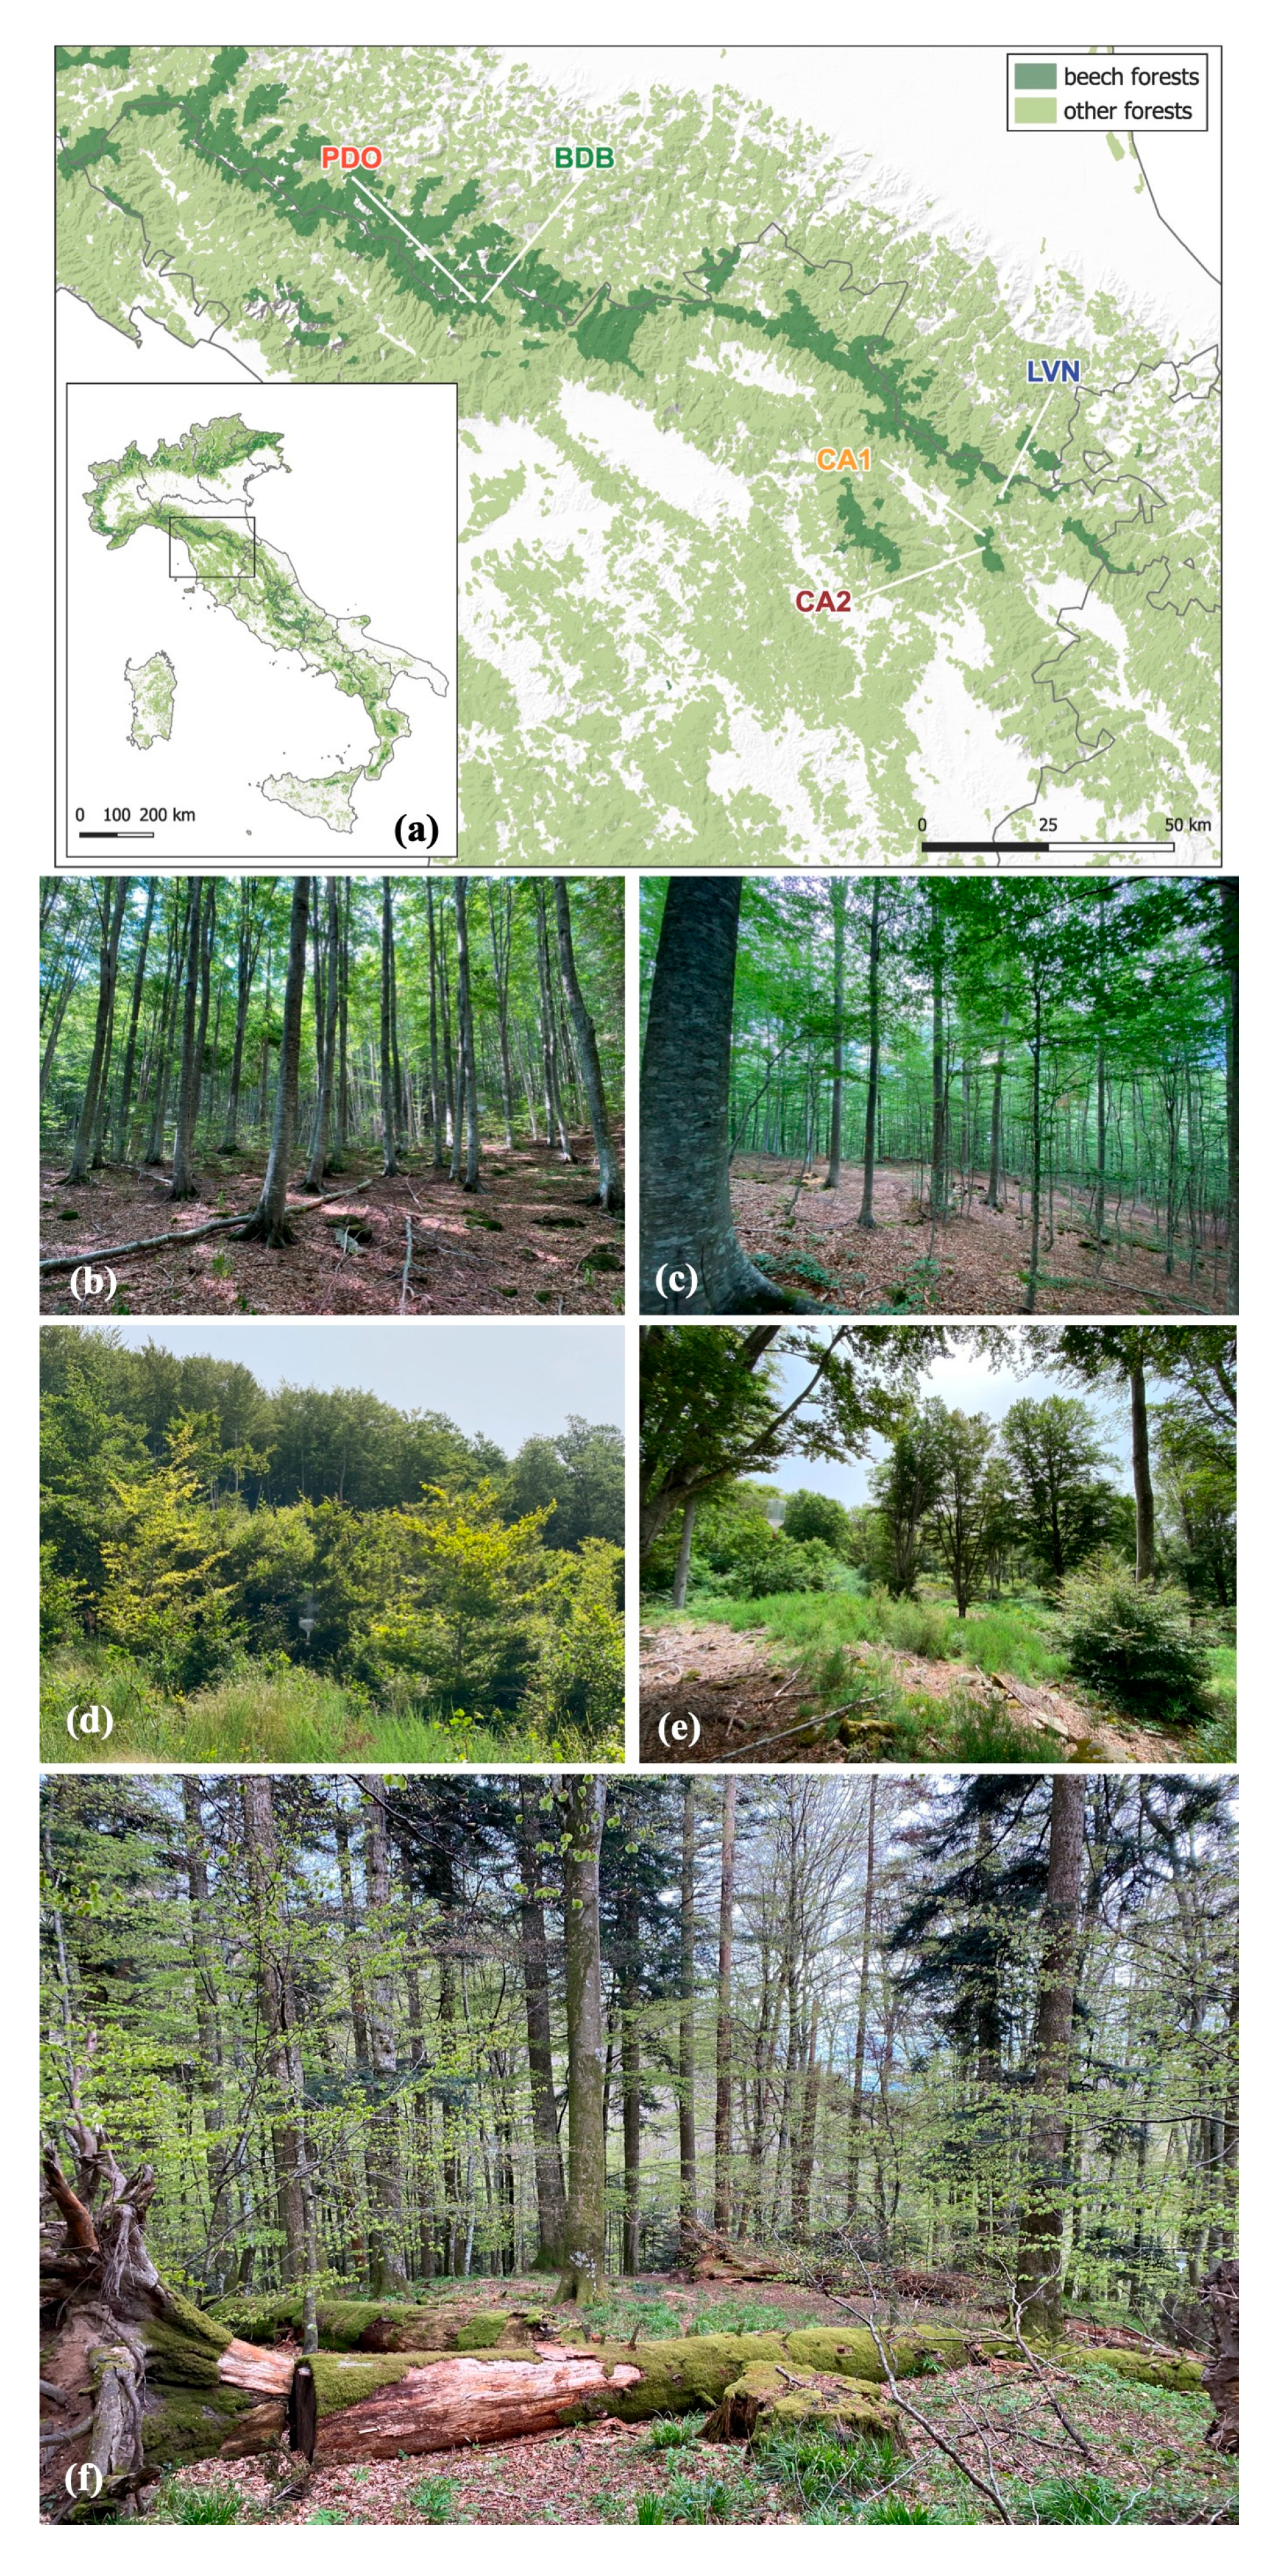
Figure 1. (a) Location of the sampling sites. (b) PDO = Pian degli Ontani; (c) BDB = Bosco di Baldo; (d) CA1 = Casella 1; (e) CA2 = Casella 2; (f) LVN = La Verna.
Ecologies 06 00054 g001
Figure 2. Rarefaction curves for all species (A,D,G), for cavity-nesting species (B,E,H) and other species (C,F,I). Rarefaction curves for Hill number q = 0 (AC), corresponding to total species richness; q = 1 (DF), corresponding to Shannon diversity (i.e., the effective number of common species); and q = 2 (GI), corresponding to Simpson diversity (i.e., the effective number of dominant species). The curves are shown for an approximately double-length segment, interpolated (dashed line) compared to the actual sample (solid line). CA1 = Casella 1; PDO = Pian degli Ontani; CA2 = Casella 2; BDB = Bosco di Baldo; LVN = La Verna.
Ecologies 06 00054 g002
Figure 6. BoxPlot of the total WBCI (Woodland Bird Community Index). Below each site, the model results for comparisons with other sites (when significant) are reported (*** p < 0.001; ** p < 0.01; * p < 0.05). CA1 = Casella 1; PDO = Pian degli Ontani; CA2 = Casella 2; BDB = Bosco di Baldo; LVN = La Verna.
Ecologies 06 00054 g006
Table 1. Management systems and structural and environmental variables of the sampling sites (from Parisi et al. [34], mod.).
Site CodeSite NameCoordinateManagementAge Class StructureVolume (m3 ha−1)Deadwood Volume (m3 ha−1)Elevation
(m a.s.l.)
Exposure
(°N)
Forest Cover (Proportion) Within 1 km BufferForest Cover (Proportion) Within 5 km Buffer
CA1Casella 143°39′37.34″ N, 11°55′11.7″ EUniform shelterwood systemEven-aged (ca. 20-years-old)-5.511252280.970.81
PDOPian degli Ontani44°6′26.52″ N, 10°41′40.14″ EUniform shelterwood systemEven-aged (ca. 60-years-old)528.26.41229260.970.88
CA2Casella 244°6′33.13″ N, 10°41′49.6″ EUniform shelterwood systemEven-aged (ca. 100-years-old)204.414.911022790.970.77
BDBBosco di Baldo44°6′33.13″ N, 10°41′49.6″ ESingle-tree selection systemUneven-aged363.44.41189610.970.87
LVNLa Verna43°42′32.48″ N, 11°55′51.67″ EUnmanagedUneven-aged997.842611651420.860.85
Table 2. Species composition and distribution across the sites; for each species, the frequency across the 48 sequences is reported. Cavity-nesting species (CAV) are also identified. CA1 = Casella 1; PDO = Pian degli Ontani; CA2 = Casella 2; BDB = Bosco di Baldo; LVN = La Verna.
EuringSpecies Breeding SiteCA1PDOCA2BDBLVN
1Northern GoshawkAccipiter gentilisother 0.02
2Eurasian BuzzardButeo buteoother 0.06
3Common WoodpigeonColumba palumbusother0.130.020.210.020.17
4Common CuckooCuculus canorusother0.400.250.210.210.02
5Eurasian Green WoodpeckerPicus viridisCAV0.02 0.02
6Black WoodpeckerDryocopus martiusCAV 0.25
7Great Spotted WoodpeckerDendrocopos majorCAV 0.420.080.080.40
8Lesser Spotted WoodpeckerDryobates minorCAV 0.04 0.06
9Northern WrenTroglodytes troglodytesother 0.31 0.96
10European RobinErithacus rubeculaother0.880.940.730.940.94
11Eurasian BlackbirdTurdus merulaother0.710.670.830.710.52
12Song ThrushTurdus philomelosother0.380.130.210.311.00
13Mistle ThrushTurdus viscivorusother0.150.380.210.350.02
14Eurasian BlackcapSylvia atricapillaother0.980.330.960.460.69
15Wood WarblerPhylloscopus sibilatrixother 0.15
16Common ChiffchaffPhylloscopus collybitaother0.960.310.940.230.02
17Common FirecrestRegulus ignicapillaother 0.630.130.021.00
18Long-tailed TitAegithalos caudatusother 0.13 0.02
19Marsh TitPoecile palustrisCAV0.020.170.060.130.15
20Crested TitLophophanes cristatusCAV 0.02
21Coal TitPeriparus aterCAV0.290.650.380.560.69
22Eurasian Blue TitCyanistes caeruleusCAV0.330.060.500.380.13
23Great TitParus majorCAV0.190.250.460.420.35
24Eurasian NuthatchSitta europaeaCAV0.020.020.100.040.56
25Eurasian TreecreeperCerthia familiarisCAV 0.23
26Short-toed TreecreeperCerthia brachydactylaCAV 0.040.060.90
27Eurasian JayGarrulus glandariusother0.100.040.080.130.13
28Carrion CrowCorvus coroneother 0.04 0.330.02
29Common ChaffinchFringilla coelebsother0.210.960.540.830.81
30Red CrossbillLoxia curvirostraother 0.02
31Eurasian BullfinchPyrrhula pyrrhulaother0.10 0.02 0.02
Table 3. Richness comparisons among sites using GLMMs (generalized linear mixed models). The effect size and the significance level are reported. The effect size is the exponentiated value, representing the relative change in the incidence rate (i.e., the proportion of richness in the site from the row compared to the site from the column; if >1, the site from the row is richer than the site from the column, and if <1, the site from the column is richer than the site from the row). Significant differences are highlighted in bold (*** p < 0.001; ** p < 0.01; * p < 0.05). CA1 = Casella 1; PDO = Pian degli Ontani; CA2 = Casella 2; BDB = Bosco di Baldo; LVN = La Verna.
SiteCA1PDOCA2BDBLVN
Models for total richness
CA1-0.930.82 *0.920.57 ***
PDO1.07-0.880.990.62 ***
CA21.22 *1.14-1.120.70 ***
BDB1.091.010.89-0.63 ***
LVN1.74 ***1.62 ***1.42 ***1.60 ***-
Models for cavity-nesting richness
CA1-0.54 **0.54 **0.50 ***0.24 ***
PDO1.84 **-10.920.44 ***
CA21.84 **1-0.920.44 ***
BDB2.01 ***1.091.09-0.48 ***
LVN4.22 ***2.30 ***2.29 ***2.10 ***-
Models for other species richness
CA1-1.060.91.080.77 **
PDO0.94-0.851.020.72 ***
CA21.111.18-1.20 *0.86
BDB0.920.980.83 *-0.71 ***
LVN1.31.381.171.14 ***-
Disclaimer/Publisher’s Note: The statements, opinions and data contained in all publications are solely those of the individual author(s) and contributor(s) and not of MDPI and/or the editor(s). MDPI and/or the editor(s) disclaim responsibility for any injury to people or property resulting from any ideas, methods, instructions or products referred to in the content.