Article

Some Ecological Characteristics of a Neophyte of the Canary Islands: Pluchea ovalis (Asteraceae)

by
Miguel Pestano
,
Isabel Suárez
,
Cristina González-Montelongo
,
Natalia Sierra Cornejo
and
José Ramón Arévalo
*
Department of Botany, Ecology and Plant Physiology, University of La Laguna, 38206 San Cristobal de La Laguna, Spain
*
Author to whom correspondence should be addressed.
Ecologies 2025, 6(2), 28; https://doi.org/10.3390/ecologies6020028
Submission received: 15 January 2025 / Revised: 24 February 2025 / Accepted: 18 March 2025 / Published: 1 April 2025
(This article belongs to the Special Issue Feature Papers of Ecologies 2024)

Abstract

:
Pluchea ovalis (Pers.) DC. is an invasive alien plant species. It has spread widely on the island of Tenerife since it was first introduced, becoming a major threat to the island’s flora. The aims of this study are to analyze its germination capacity under different environmental conditions (e.g., light and temperature) and determine its effects on soil properties and native plant communities. Germination assays were carried out both in a germination chamber and in a greenhouse. Twelve plots were also established in the field to determine its effect on soil properties and plant species composition. Our results reveal that the germination capacity of Pluchea ovalis decreases under high temperature ranges and increases on flooded substrates. In addition, Pluchea ovalis can modify soil physicochemical properties by increasing soil magnesium content. As its invasive potential has been demonstrated, this study contributes with evidence of its effects on environmental conditions and species composition. Moreover, we recommend its inclusion in the Spanish Alien Invasive Species Catalogue and the development of further studies about its potential distribution and effects in the Canary Islands.

1. Introduction

For millennia, humans have acted as dispersal agents for plants and animals, whether by using them as food or pets or by accidentally transporting them. This has influenced current species distribution patterns [1,2]. Moreover, on occasion, some species have been deliberately introduced for erosion control in degraded areas, timber production, ornamental use, forage, or for the extraction of medicinal products. The introduction of species can also occur accidentally through the presence of seeds in relocated agricultural soil, the attachment of propagules to domestic animals, or the release of ballast water [3,4,5,6].
Islands are known to host a high proportion of endemic species but have a lower species diversity compared to continental regions [7]. Due to their isolation and weaker biotic resistance, oceanic islands are more susceptible to invasion than the mainland [8,9]. Invasive alien species (IASs) are responsible for 25% of plant and 33% of animal extinctions worldwide [10], but their impact is greater on islands, where IASs have caused the extinction of 54% of endemic plant, amphibian, reptile, bird, and mammal species [11].
The arrival of alien species on the Canary Islands began at least 2000 years ago with the settlement of the first inhabitants, who brought with them both plant and animal species for agriculture and livestock. Subsequently, numerous native and endemic species have become extinct due to grazing, fires, and resource exploitation [12,13]. According to data from BIOTA (Banco de Datos de Biodiversidad de Canarias), there is a total of 2092 alien species in the Canary Islands, of which 347 (16%) are invasive, representing 2.1% of the total species present in the archipelago [14].
Pluchea ovalis (Pers.) DC. is an alien species that has been present in Tenerife for 24 years. It has undergone a major expansion since it was first recorded [15,16] and is currently in a phase of expansion. In addition, some individuals have recently been recorded on other islands of the archipelago [13]. Understanding the ecology and requirements of invasive species is essential for their management.
Invasive plant species are known to cause impacts on physicochemical soil properties that directly affect plant communities [17], as they increase soil nutrient availability and alter microbial activity [8]. In addition, nutrient enrichment, such as carbon and nitrogen, makes the soil more suitable for the arrival of other invasive species [18,19]. In most cases, plant communities are affected by the loss of diversity [18,20,21], while in other cases, species diversity increases due to the arrival of non-native species [19]. Seed germination is a critically important step in a plant’s life cycle that plays an important role in seedling emergence and adaptation to environmental conditions [22,23]. Plants can even suffer cline variation due to the adaptation to climatic conditions that trigger changes in seed production, velocity and rate of germination, and seedling emergence [24,25,26,27].
To gain new information on the ecology of Pluchea ovalis, we test the following hypotheses: higher temperatures favor higher germination rates, flooded soils are better for germination, and Pluchea ovalis modifies species composition and soil properties. This study provides relevant information for management prioritization, both in the short term and in the future.

2. Materials and Methods

2.1. Species

Pluchea ovalis is a species native to Africa and the Arabian Peninsula [28] that can grow up to 2.5 m in height, with hairy branches and leaves and purple flowers. It has been reported as an invasive alien species on some of the Canary Islands (Fuerteventura, La Gomera, Tenerife). It settles on waterlogged soil or in areas with external water sources where, under favorable conditions, it can produce flowers and seeds continuously throughout the year [29,30,31].
In Tenerife, the first recorded sighting was in the urban area of Adeje in the year 2000 (R. Mesa, com. pers.). In 2009, its presence was reported along a roadside between La Caleta and the Costa Adeje Golf Club [27]. Subsequently (2011), its introduction as an ornamental plant on the Adeje golf course was confirmed, along with its expansion toward the tourist resorts of Las Americas and Los Cristianos [31]. The most recent data indicate that the distribution of Pluchea ovalis extends from Granadilla de Abona to Buenavista del Norte, ranging from 0 to 900 m a.s.l. in Santiago del Teide [32,33]. Recently, some isolated occurrences of Pluchea ovalis have been recorded on the north side of Tenerife, as well as in the metropolitan area (Santa Cruz de Tenerife) and on La Gomera and Fuerteventura [26].
In addition to Pluchea ovalis, two new species from the same genus have been detected in the Canary Islands over the past fifteen years. Both species exhibit the same potential invasive behavior, but with a smaller distribution area: Pluchea dioscoridis is found in Tenerife [34], where it shares its distribution area with Pluchea ovalis, while Pluchea carolinensis is found in Gran Canaria [26,35,36].

2.2. Study Area

The study was carried out in the southern part of Tenerife, the largest (2034 km2) and highest (3715 m a.s.l.) island of the Macaronesian archipelagos, where the species under study can be found at altitudes of up to 900 m a.s.l. [24,37]. In lower areas (0–500 m a.s.l.), the average temperature ranges between 18 and 22 °C, and the annual precipitation does not exceed 500 mm, leading to arid conditions between February and October. In middle-altitude areas (500–900 m a.s.l.), the average temperature ranges between 11 and 18 °C, and the annual precipitation varies between 300 and 800 mm [37].
As demonstrated in the Canary Island vegetation map [38], this region of the island is mainly composed of seven vegetation units: desertic nitrophilous scrub, Euphorbia balsamifera Aiton shrubland, Euphorbia lamarckii Sweet shrubland, Euphorbia canariensis L. shrubland, Cistus scrubs, xeric nitrophilous scrub, and Euphorbia atropurpurea Brouss ex. Willd shrubland. However, most areas invaded by Pluchea ovalis correspond to xeric nitrophilous shrubland, which is mainly composed of Artemisia thuscula Cav., Rumex lunaria L., Lavandula canariensis Mill., or Argyranthemum spp., all of which occur on disturbed and anthropogenically influenced soils in the E. canariensis shrubland and thermos-sclerophyllous woodland climatophilous zones [37,39].

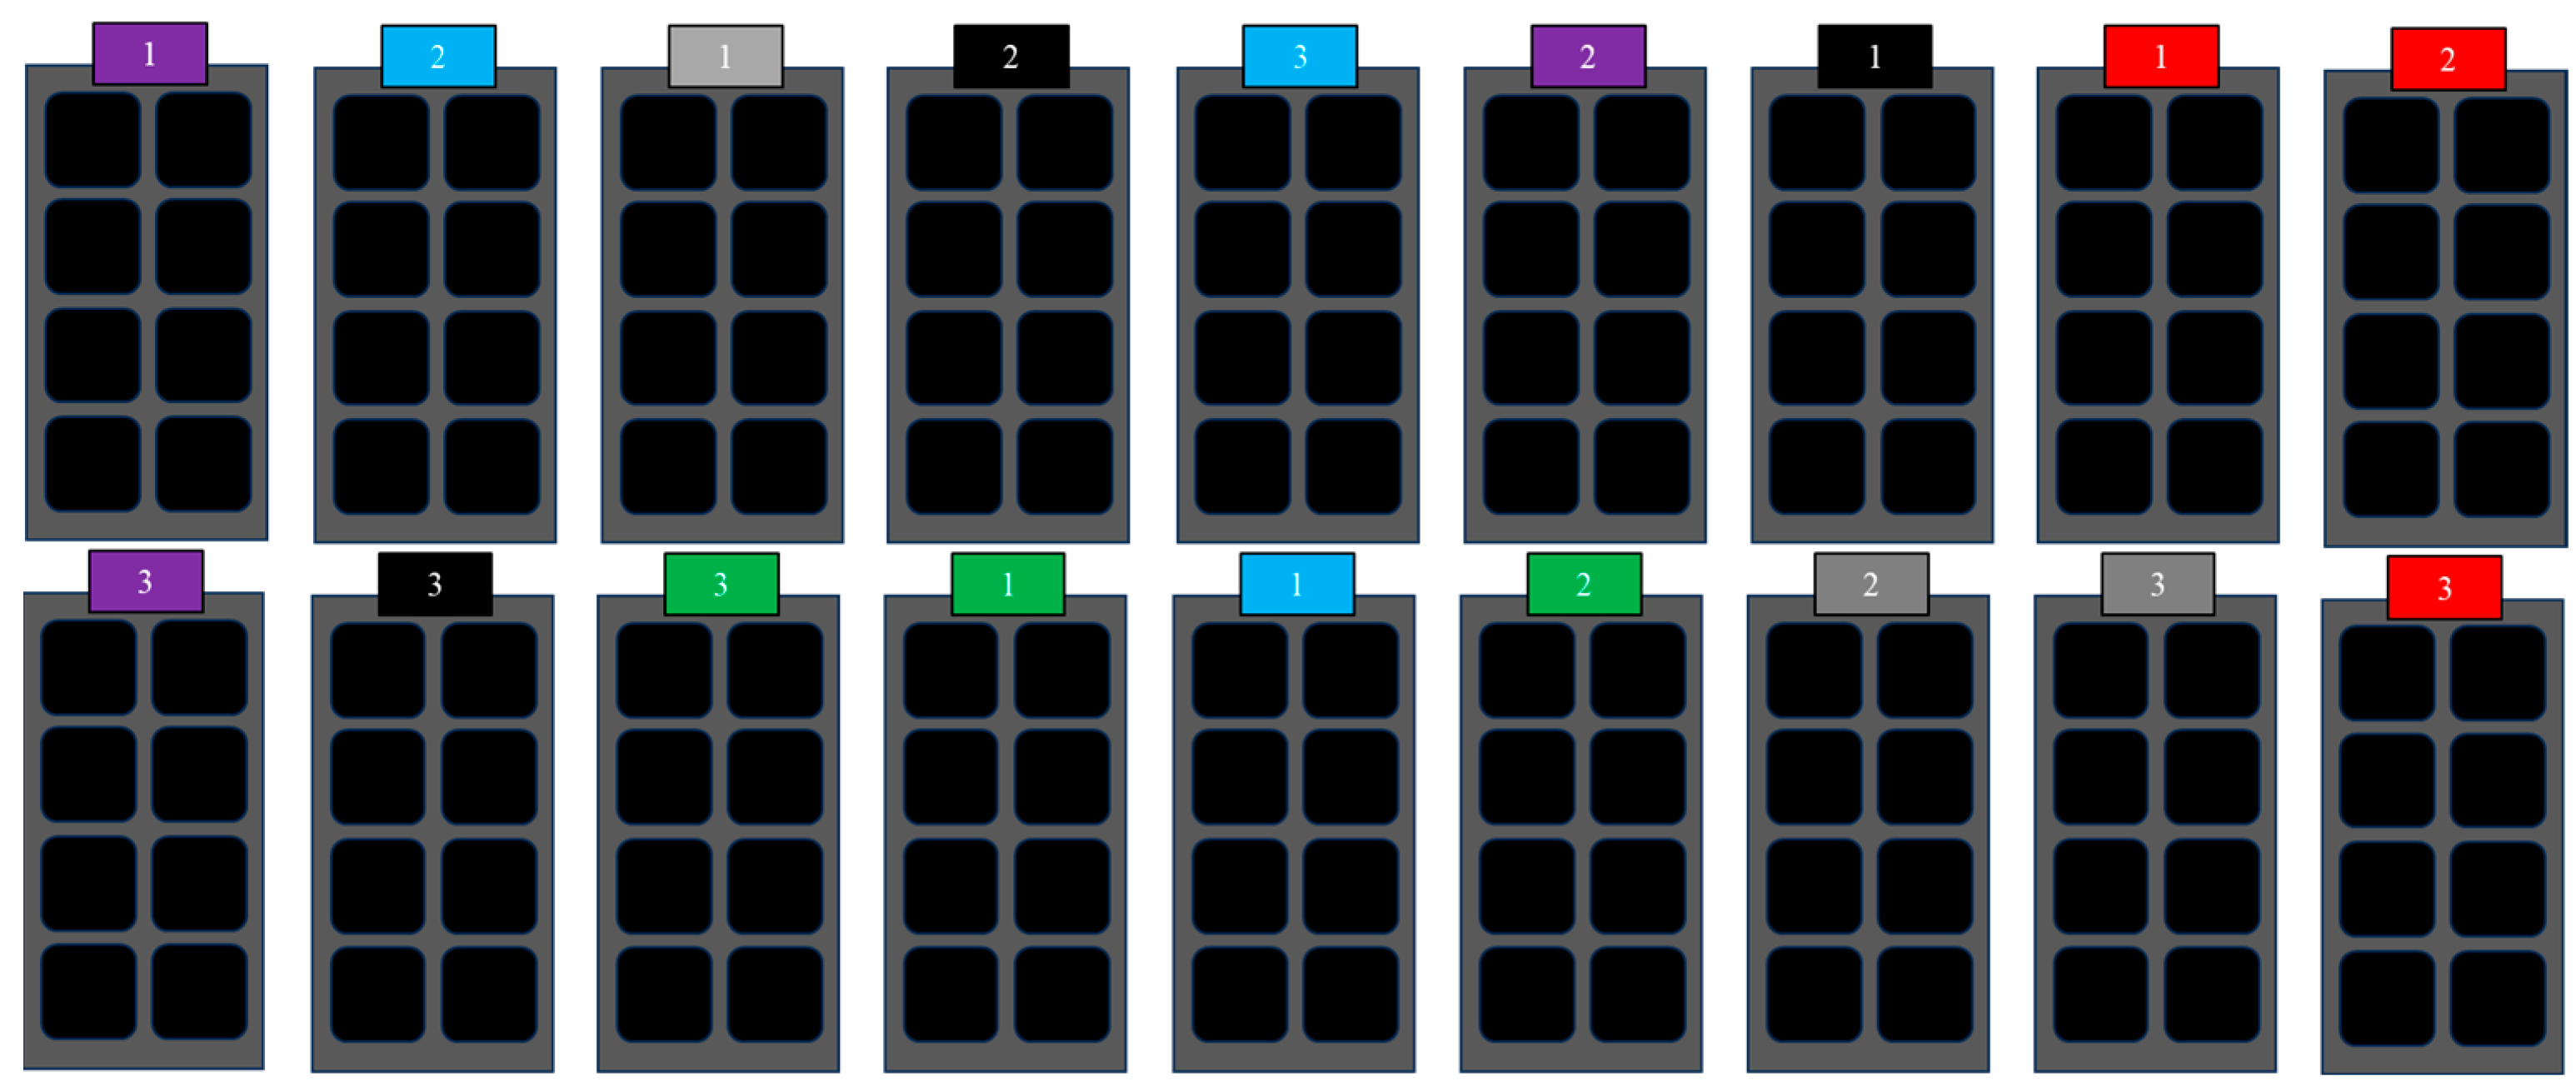
2.3. Germination Chamber Tests

Seeds for greenhouse and germination chamber assays were collected in an anthropized area near Las Chafiras, San Miguel de Abona (28°02′58.9″ N–16°36′35.8″ W), where there was a broken pipe causing an external water influx. We used scissors to cut the inflorescences and stored them in paper envelopes. Seed processing was carried out using a binocular magnifying glass (35×), separating seeds individually with tweezers and storing them in groups of 100 in paper envelopes, placed afterward in a desiccator until the assays took place.
To evaluate germination under different light and temperature conditions, germination tests were carried out using a germination chamber (IBERCEX F-4) with controlled photoperiods and temperature conditions. Four temperature ranges were established by consulting the annual mean daily minimum (17.9 °C) and maximum (24.8 °C) temperatures at Tenerife South Airport meteorological station [40] and selecting lower and higher temperatures to make them more representative of the island’s meteorological conditions (10–17 °C, 17–24 °C, 24–31 °C, 31–38 °C). Two photoperiods were established, i.e., 12 h light–12 h darkness (12 h–12 h hereafter) and 24 h darkness (24 h hereafter), in order to investigate the possible effects of total darkness compared to a default circadian rhythm. Thus, there was a total of eight treatments combining temperature ranges and light conditions. The 12 h–12 h treatment was considered normal and is denoted as N, while the 24 h treatment was considered as darkness and is denoted as D.
Each treatment consisted of 10 Petri dishes as replicates, with 20 seeds in each one arranged in a zigzag pattern to provide space for growth and subsequent data collection on a 0.5% agarose base. All dishes were sealed with parafilm. Daily monitoring of germination was conducted for 20 days, using the emergence of a radicle longer than 2 mm as the criterion to confirm seed germination [41] (Figure 1). For the darkness treatments, germination was checked in a dark room with a green light.
Finally, five germination indexes were calculated for each treatment using the germinationmetrics package (v.0.1.8.9000) [42] in R (v.4.3.3). Final germination percentage (FGP) [43] indicates the percentage (%) of germination at the end of the period indicated above; mean germination time (MGT) [44] indicates the average time required to reach the maximum germination value; the germination index (GI) [45] indicates the relationship between germination percentage and germination rate; the time spread of germination (TSG) [46] indicates the number of days between the beginning and the end of the germination period; and the first germination time (FGT) [47] indicates the first day on which germination occurs.

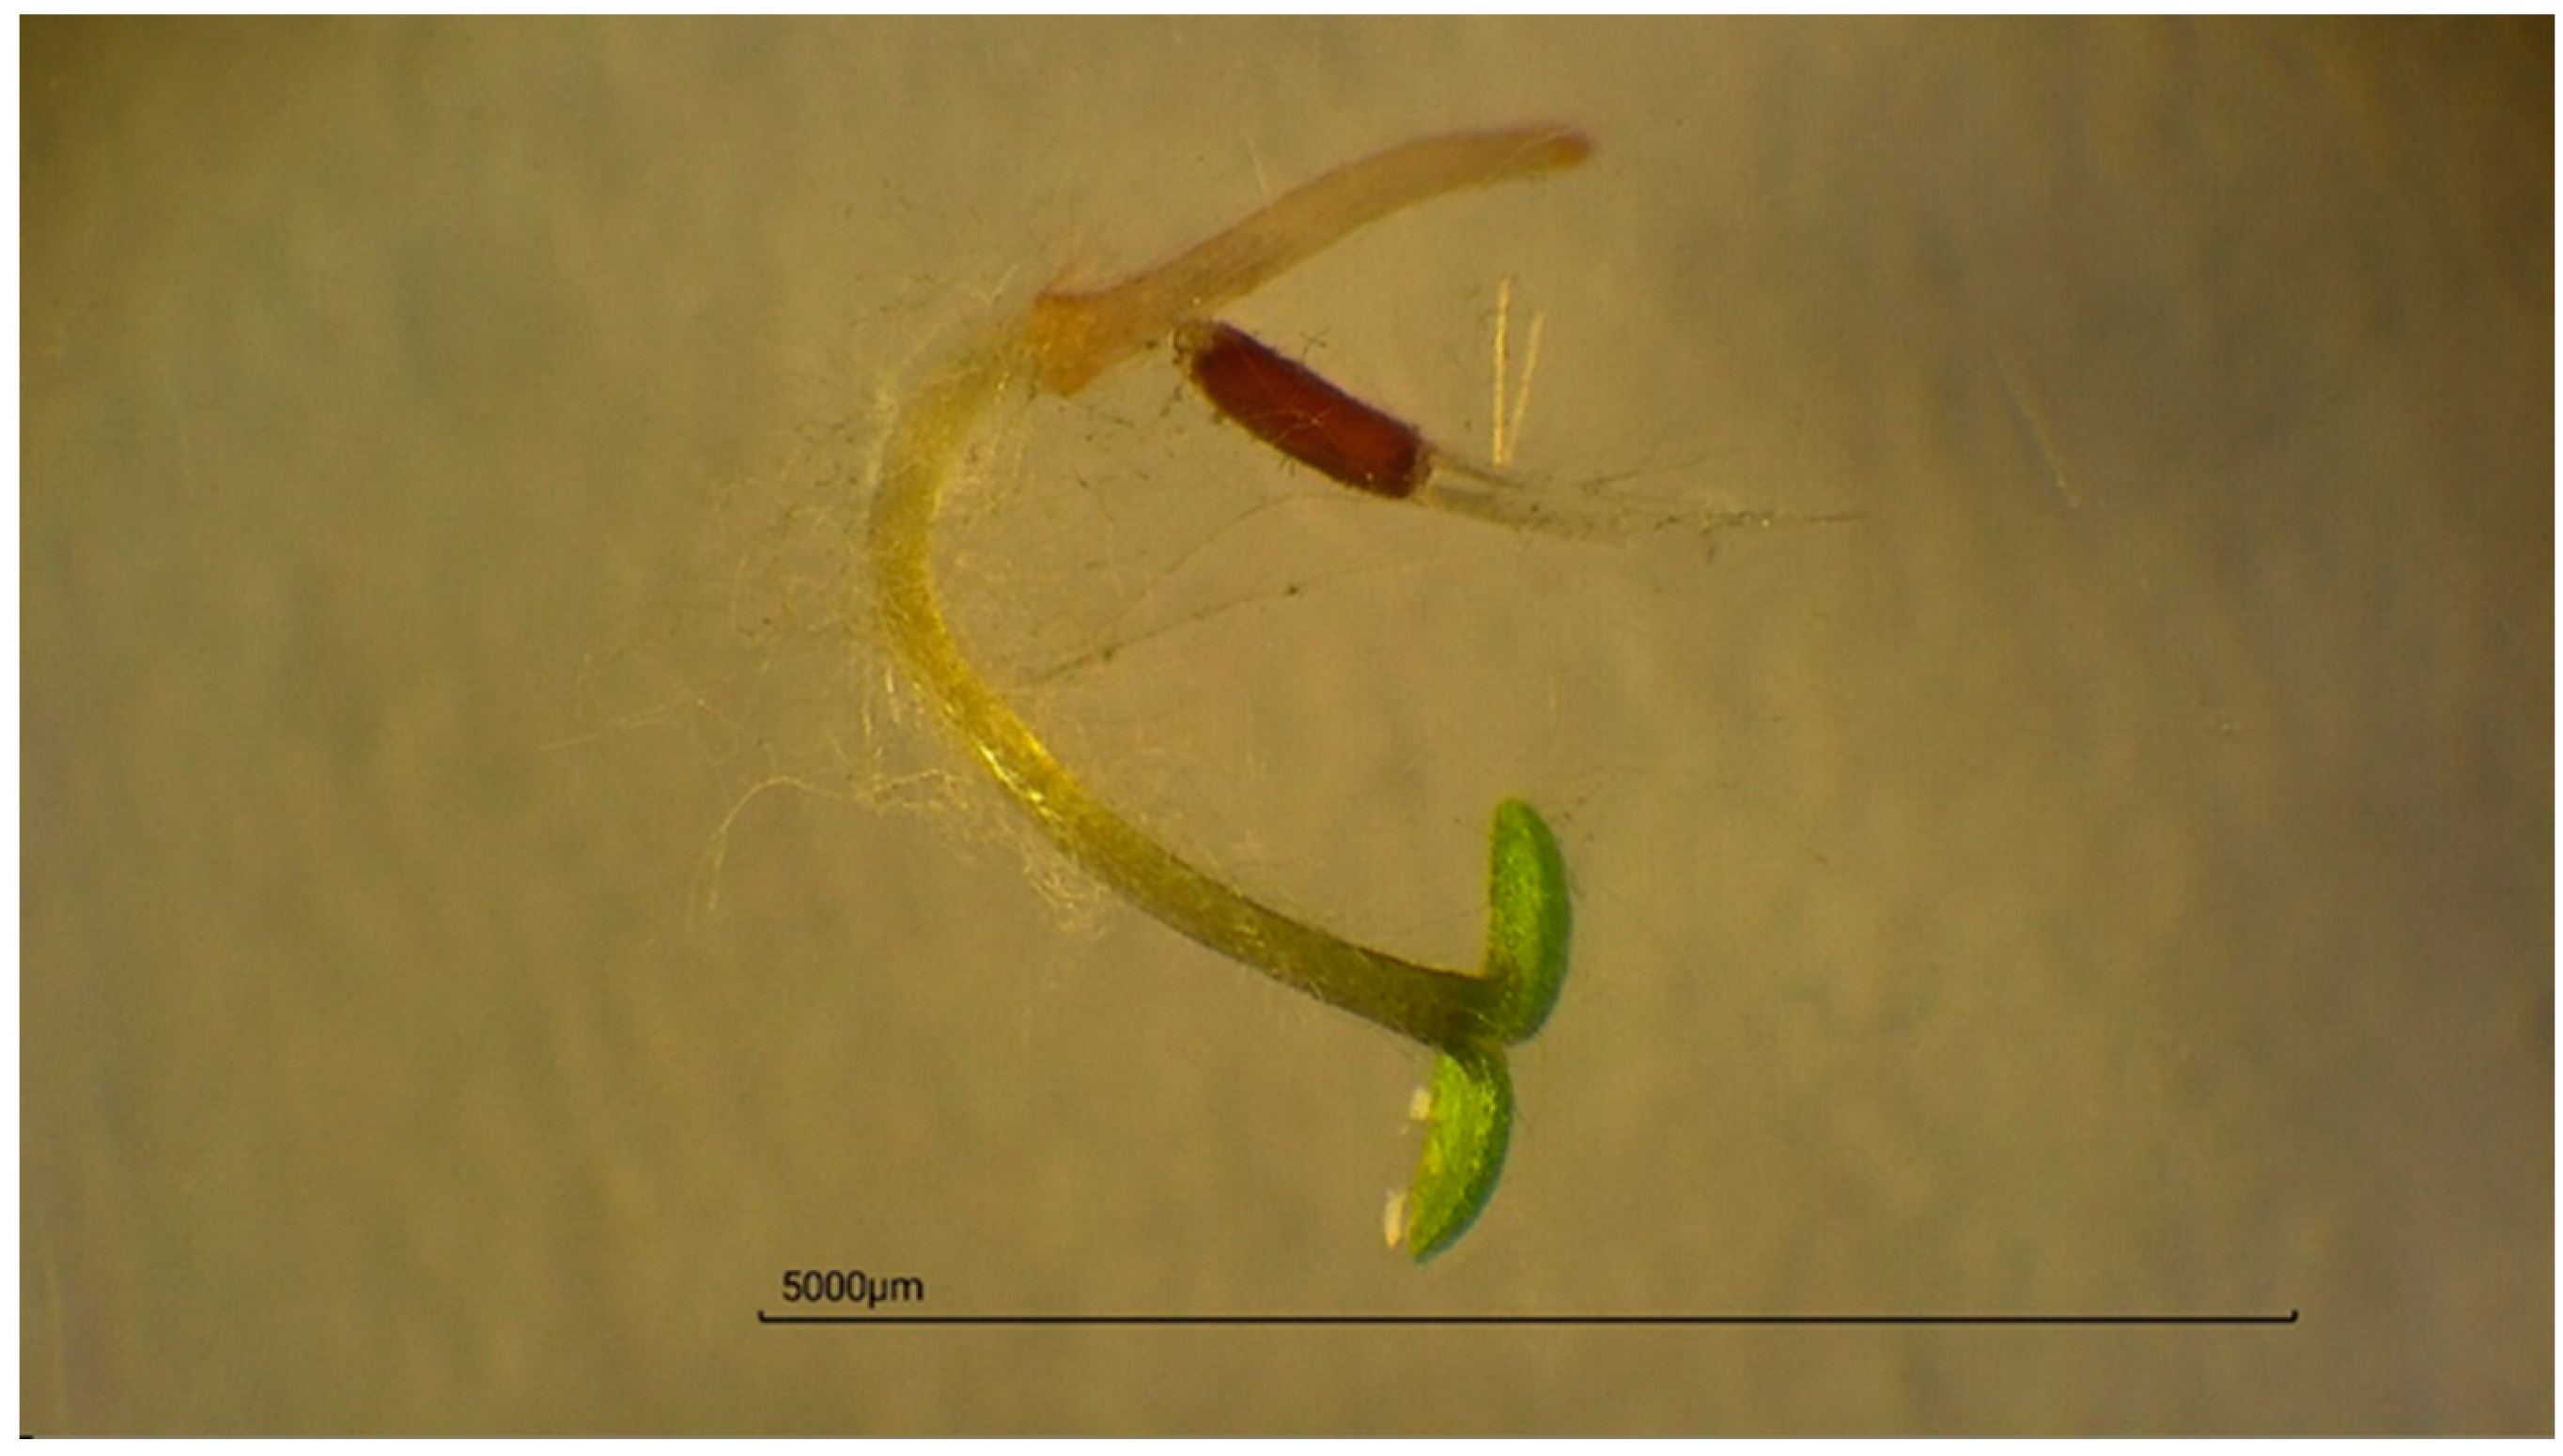
2.4. Greenhouse Germination Experiment and Root Functional Trait Analysis

The experiment was carried out in a greenhouse under controlled conditions between November 2023 and January 2024. The substrate was prepared as a mixture of soil, perlite, and peat (1:1:1). Each treatment was composed of three seedbeds as replicates, with eight cells containing ten seeds each; therefore, the experiment included a total of 1440 seeds. A total of 10 g of universal fertilizer Nitro Azul Jardinero Verde (12% N, 10% P2O5, 18% K2O, 2% and 22% SO3) was placed in each cell except for the nutrient deficiency treatment.
Six treatments were established by considering different possible environmental conditions in terms of nutrient and water availability, shading, and soil type where the species could occur: control, flooding, 50% darkness, drought, heat, and nutrient deficiency. Flooding was achieved by placing plastic trays under the seedbeds to retain runoff water (1–2 cm water depth), 50% darkness was created using black plastic mesh with 50% shading, while the control treatment entailed no changes with respect to the composition previously described. Drought was simulated by placing transparent plastic covers that were removed once a week for 24 h. Heat was achieved by placing the seedbeds over a hotbed, which increased the temperature by 11 °C. Lastly, nutrient deficiency was simulated by providing no granular fertilizer input.
The irrigation was automatic and homogeneous. Seedbeds received three daily irrigations, each lasting 1 min. Seedbeds were assigned to the treatments randomly, except for those in the heat treatment due to logistic issues (Figure 2). Weekly monitoring for germination and plant height was carried out for three months between 11:00 AM and 18:00 PM. Weekly recordings of environmental temperature and humidity were made using an analogic thermohygrometer.
To avoid competition, during the fifth week, when plants exceeded 1 cm in height, only the largest one in each cell was kept. Once the greenhouse experiment was finished, all seedlings were extracted. Roots were separated from the aerial parts and washed under tap water through a 0.5 mm mesh. Washed roots were individually placed in a transparent box made of methacrylate with distilled water and scanned using an Epson Perfection V850 Pro scanner. Then, dry weight (after 24 h in a 6 °C drying oven) was calculated and expressed in grams.
Since the roots were too transparent to be analyzed, a correction was applied so that the images could be analyzed. The applied correction consisted of modifying the following parameters: sharpness (100%), brightness (−25%), and contrast (67%). Then, total root length, volume, mean diameter, and total surface data were calculated for each root using the RhizoVision free software (ver.2.0.3) [48]. Finally, four functional traits [49,50,51] were calculated: (1) specific root length (SRL, root length per weight), which reflects a plant’s capacity for soil exploration; (2) root tissue density (RTD, root volume per weight), linked to the defense against herbivory and drought; (3) specific root area (SRA, root area per weight), connected to nutrient uptake and mycorrhiza colonization; (4) mean root diameter (MRD), related to the adaptation to environmental stressors, mycorrhizal colonization, and resource acquisition.

2.5. Field Study: Effect of the Presence of Pluchea ovalis on Native Plant Communities and Physicochemical Soil Properties

Twelve 10 × 10 m plots were systematically established at two sites near San Miguel de Abona (28°05′09.6″ N–16°37′01.5″ W; 28°05′02.8″ N–16°37′24.6″ W) spaced 600 m apart. At each site, three plots were already invaded by Pluchea ovalis, while another three, free of this species, were used as control plots. Data collection on each plot was undertaken twice, once during the summer (July–August 2023) and once during the winter (January–February 2024).
The data collected from each plot consisted of abiotic variables, such as altitude, aspect, slope, the cover of rock, bare soil, and litter, as well as biotic variables such as the cover and maximum height of gramineous, herbaceous plants and woody plants; finally, the height and phenology of every Pluchea ovalis individual and a plant checklist of the rest of the species with their cover were recorded. Additionally, a superficial soil sample (0–10 cm) was collected from the four corners and the center of each plot to determine further abiotic variables, such as soil pH, percentage of organic matter (%OM), electrical conductivity (mS/cm), PO4 content (ppm), and available cations in mequiv./100 g (Ca2+, Mg2+, K+, Na+), using standard methods of soil analysis [52,53]. Soil analyses were carried out in the Institute of Natural Products and Agrobiology (IPNA—CSIC).

2.6. Statistical Analysis

Normality and homoscedasticity were respectively checked with the Shapiro–Wilk test and the Breusch–Pagan test (for p < 0.05) in R studio (v.4.3.3). Non-normally distributed datasets (in vitro germination, germination indexes, greenhouse germination, plant height, root functional traits, and physicochemical soil properties) were analyzed with the Kruskal–Wallis test, followed by Dunn’s post-hoc test with the Benjamin–Hochberg correction to assess differences among all groups simultaneously. Only the SRL functional trait (normally distributed dataset) was analyzed with an ANOVA test and Tukey’s post-hoc test.
A redundancy analysis (RDA) was conducted to compare the species composition (based on species cover) of control and invaded plots. The differences between sampling season and the relationship with biotic and abiotic factors [54] were also analyzed using the Canoco 5.1 software [55]. RDA analysis is a multiple linear regression that models the effect of an explanatory matrix (environmental variables × locations) on a response matrix (species cover × locations). When selecting the environmental variables to be analyzed, it is necessary to choose the ones that are expected to influence species composition. However, it is also desirable to use variables that, a priori, do not seem to be important, as these can end up influencing species composition too [56,57]. Species cover was used as a biotic factor (response matrix), while a matrix with the environmental variables (pH, %MO, CE, PO4 content, available cations, slope, cover of gramineous, herbaceous, and woody plants, cover of rock, soil, and litter) was used as the explanatory matrix. Finally, indicator species analysis was carried out using PAST (v.4) to analyze the importance of species in control and invaded plots [58].

3. Results

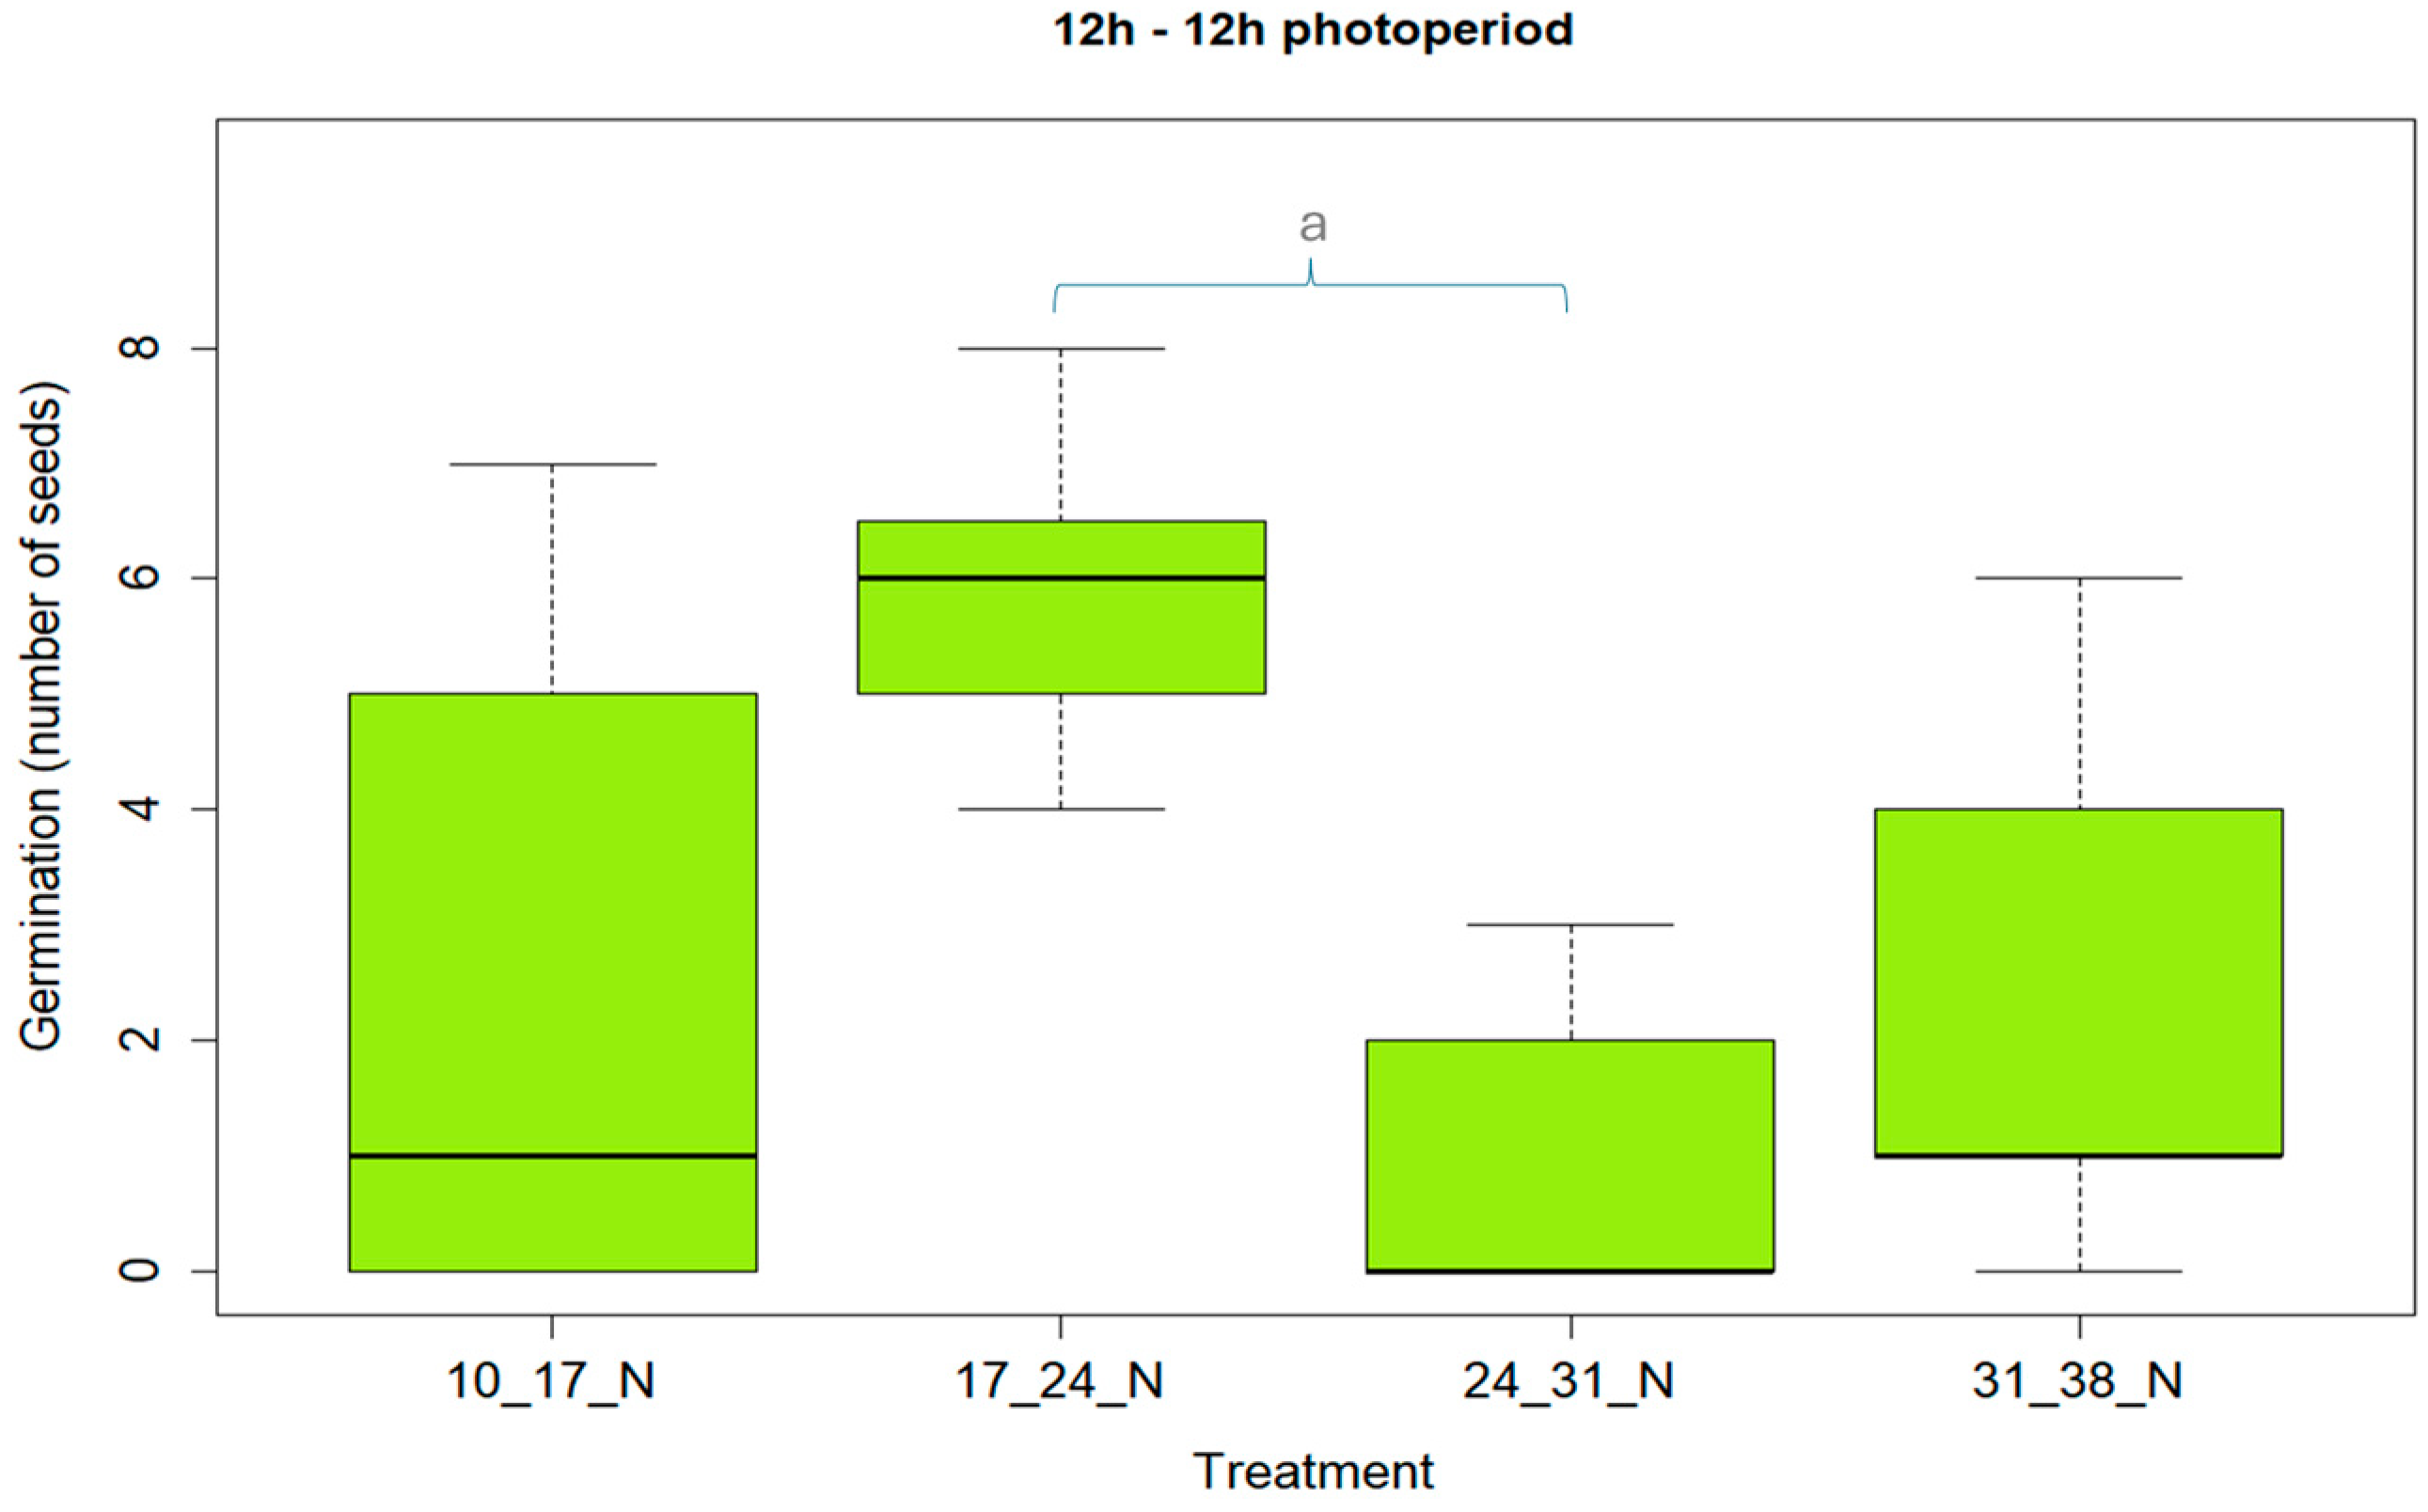
3.1. Effect of Light and Temperature on Germination Rate

Data from both photoperiods were analyzed separately. A Kruskal–Wallis test for the 12 h light–12 h darkness photoperiod showed significant differences (H3;15.5; p < 0.05) among temperature ranges in terms of their effect on the germination rate. A post-hoc test showed that 17–24 °C and 24–31 °C were the only significatively different treatments, with the first range showing higher values. Regarding the 24 h darkness photoperiod, a Kruskal–Wallis test revealed no significant differences (H3;7.25; p > 0.05) (Figure 3).
For both photoperiods, the highest number of germinated seeds occurred in the 17–24 °C temperature range, while the lowest number of germinated seeds was observed between 24 and 31 °C.
Final germination percentage (FGP) reached its highest value in the 17–24 °C temperature range for both the 12 h light–12 h darkness (58.8%) and 24 h darkness (22.5%) photoperiods. Mean germination time (MGT) was lowest for 24–31 °C under the 12 h–12 h photoperiod (3.63 days) and for 24–31 °C under the 24 h photoperiod (8.67 days) compared to the remaining treatments. Regarding germination rate and percentage, the germination index (GI) reached its highest value for both the 12 h–12 h and 24 h photoperiods in the 24–31 °C temperature range. Finally, the time spread of germination (TSG) was longer in the 10–17 °C temperature range under the 12 h–12 h photoperiod (14 days) and in the 17–24 °C temperature range under the 24 h photoperiod (12 days) (Table 1).

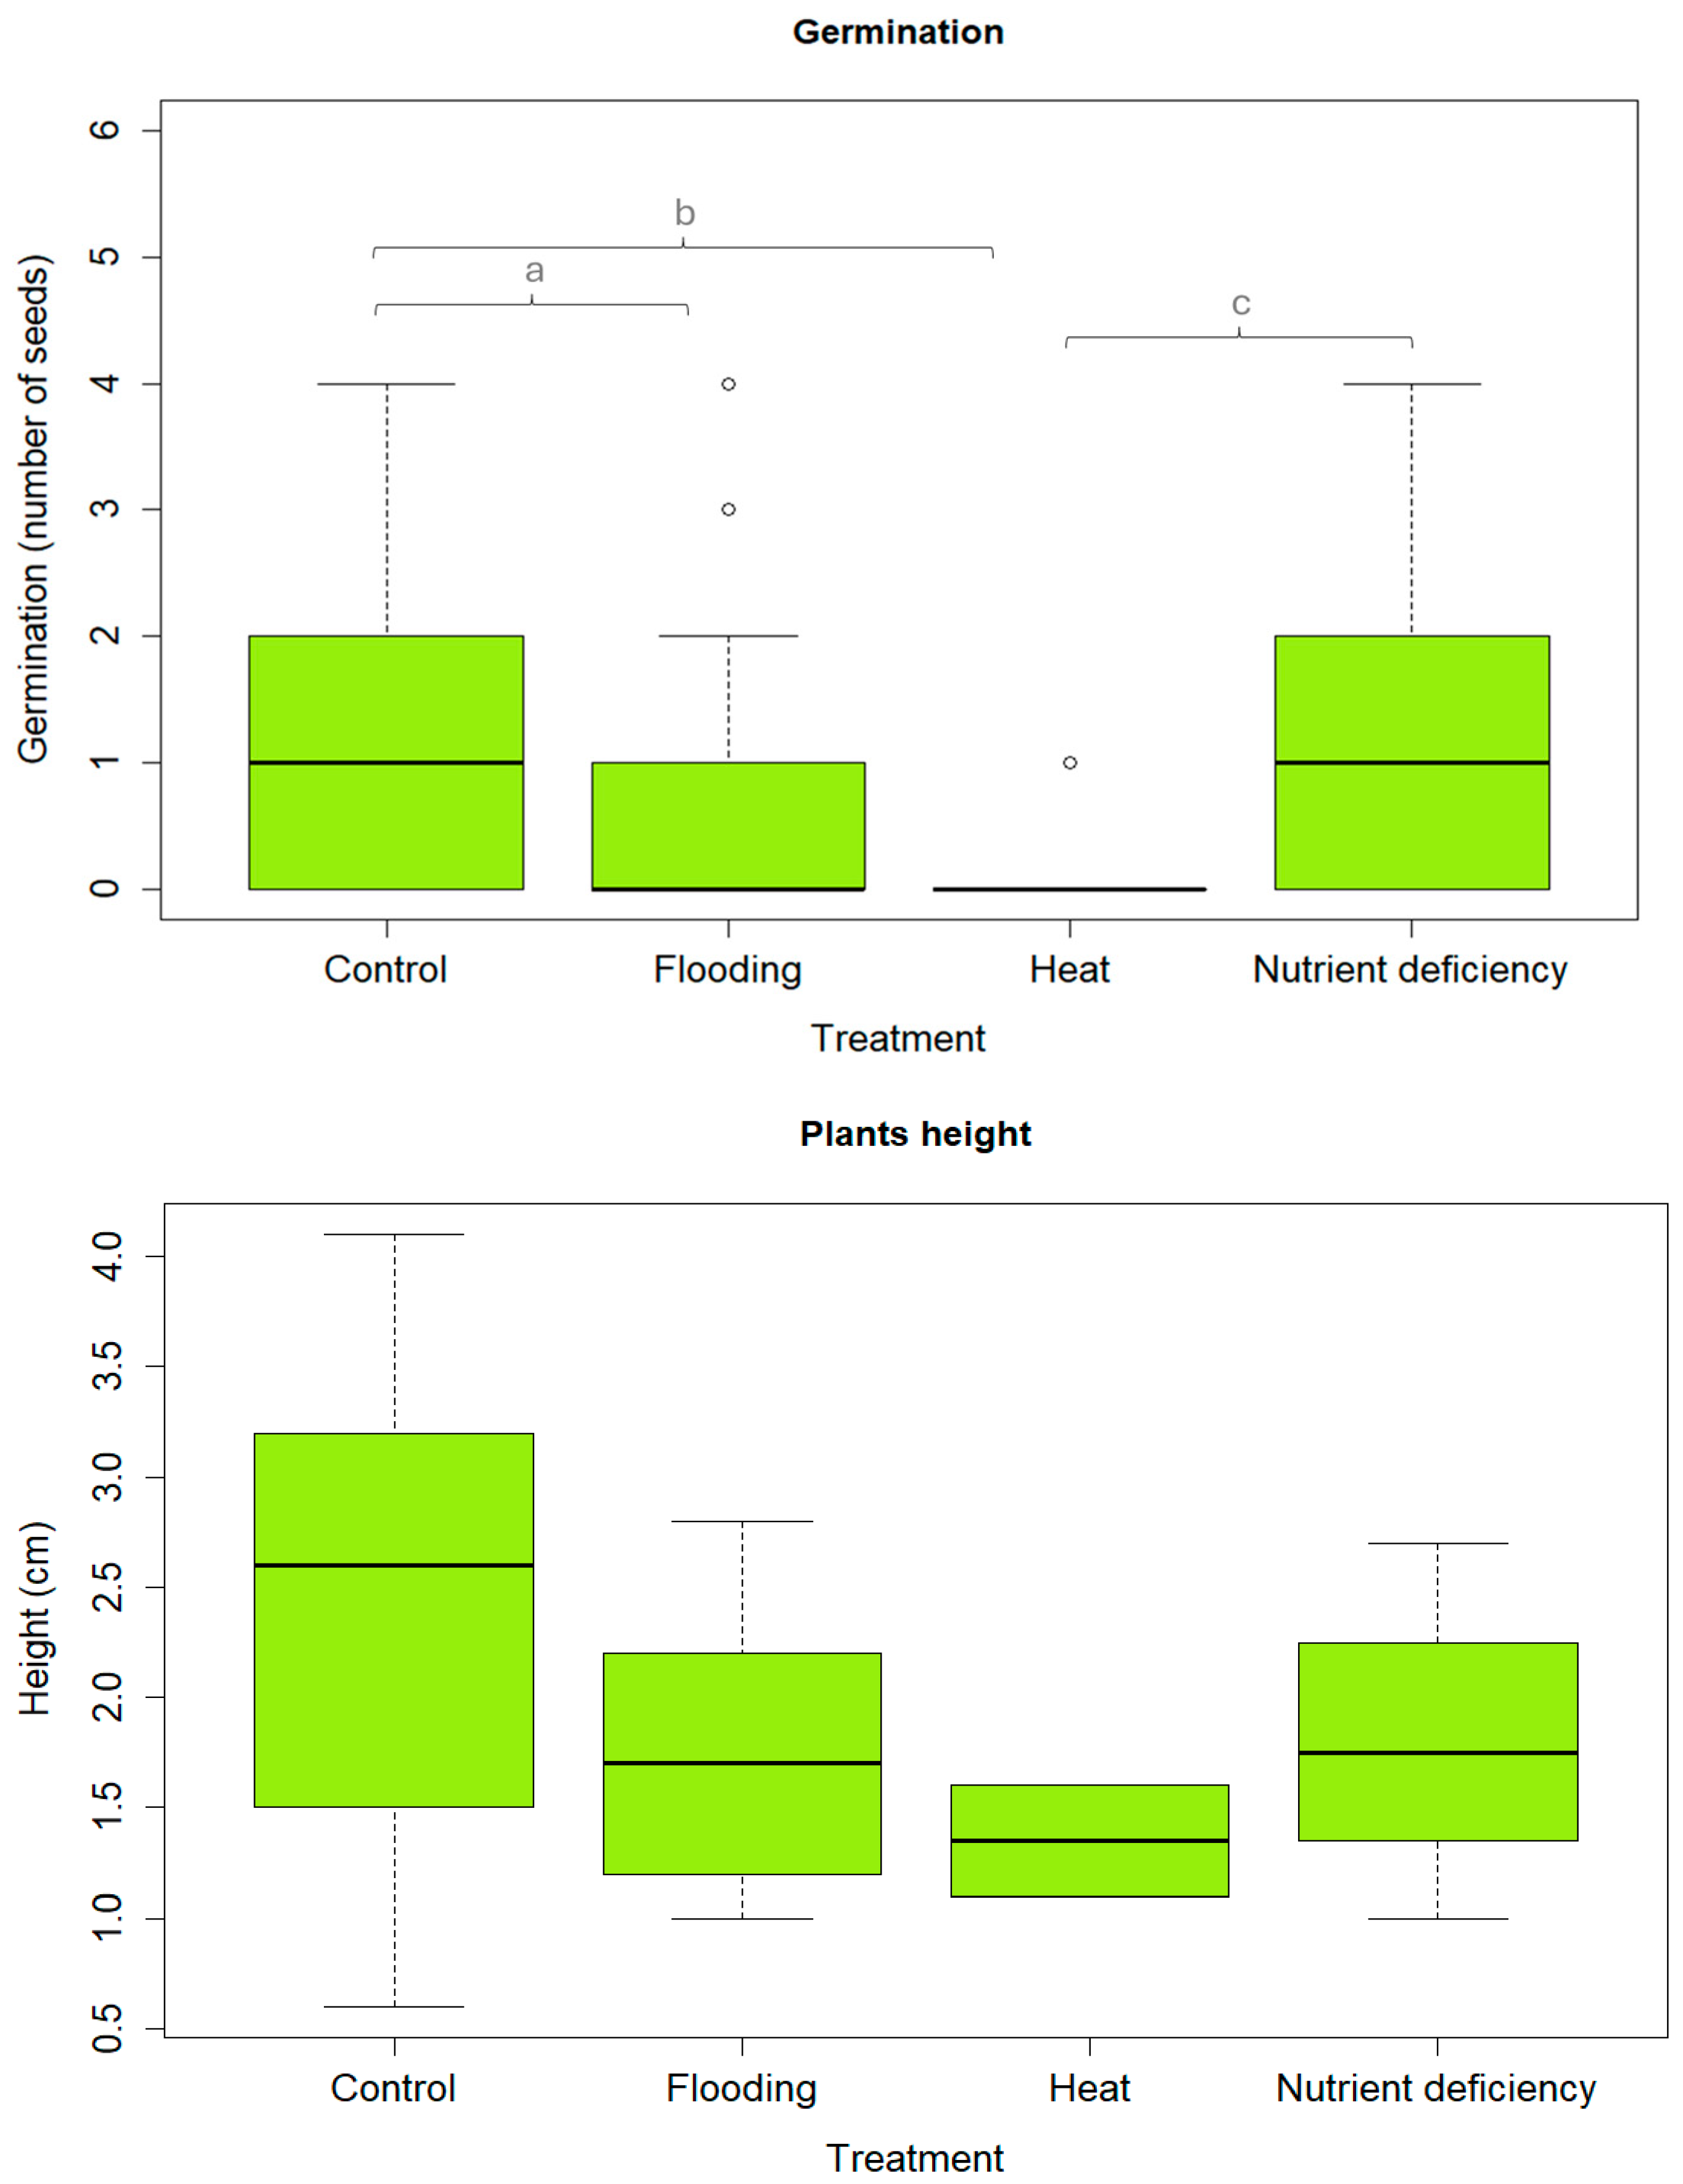
3.2. Effect of Environmental Conditions on Germination and Plant Development

Due to low germination under the drought (one seedling) and 50% darkness (one seedling) treatments, only four treatments (heat, control, flooding, and nutrient deficiency) were included in the data analysis. The Kruskal–Wallis test for maximum plant height showed no significant differences (H3;5.21; p > 0.05). However, germination showed significant differences (H3;20.6; p < 0.05). According to the post-hoc tests, the treatments that showed significant differences were heat and control (z = −3.91; p < 0.005), control and flooding (z = 2.70; p < 0.05), and heat and nutrient deficiency (z = −3.46; p < 0.05) (Figure 4).
Regarding root functional traits, an ANOVA was performed for specific root length (SRL) (F3.39 = 0.31, p > 0.05), while a Kruskal–Wallis test was carried out for root tissue density (RTD) (H3;0.62; p > 0.05), specific root area (SRA) (H3;1.13; p > 0.05), and mean root diameter (MRD) (H3;3.42; p > 0.05). Results showed no significant differences for any root functional trait.

3.3. Effect of Pluchea ovalis on Soil Properties and Native Plant Communities

A total of 27 species were identified (Table S1), of which 23 are native to the Canary Islands (Aizoon canariense L., Argyranthemum frutescens (L.) Sch. Bip., Artemisia thuscula, Asphodelus ramosus L., Asteraceae sp., Asteriscus aquaticus (L.) Less., Bromus sp., Cenchrus ciliaris L., Dittrichia viscosa (L.) Greuter, Euphorbia lamarckii, Fagonia cretica L., Fumaria sp., Hyparrhenia hirta (L.) Stapf, Juncus acutus L., Kleinia neriifolia Haw., Launaea arborescens (Batt.) Murb., Lavandula canariensis, Lysimachia arvensis (L.) U. Manns & Anderb., Patellifolia patellaris (Moq.) A. J. Scott, Ford-Lloyd & J. T. Williams, Periploca laevigata Aiton, Plantago ovata Forssk., Plocama pendula Aiton, and Sonchus leptocephalus Cass.) and four are alien taxa (Atriplex semibaccata R. Br., Cenchrus setaceus (Forssk.) Morrone, Opuntia maxima Mill., and Pluchea ovalis). Of these, 16 were present on both types of plots, nine on the invaded plots, and only one (Patellifolia patellaris) on the control plots (Table S2).
The analysis of the physicochemical soil properties revealed significant differences in magnesium (Mg2+) content (H2;10.5; p < 0.05). Moreover, some patterns are visible regarding the rest of the soil property analysis (Table S3). Seasonal variation in pH makes pH levels higher in winter than in summer, reaching a maximum level of 9.65 and 8.79, respectively. The percentage of organic material content (% OM) was slightly higher in the invaded plots than in the control plots, probably due to the higher number of species, while electrical conductivity was higher in winter in the invaded plots. PO43− is always higher in the summer than in winter, reaching greater values in the control plots. While Ca2+ and Na2+ showed no patterns, K+ was higher in the control plots whereas Mg2+ was higher in the invaded plots.
Axis I (RDA I) showed a clear gradient regarding the treatment of the plots (invaded/control), with the invaded plots located on the left side of the gradient and the control plots on the right side. This gradient ranges from high values to lower values of magnesium (Mg2+) and woody plant cover, implying a shift in species such as Pluchea ovalis, Opuntia maxima, Juncus acutus, Bromus sp., Fumaria sp., or Dittrichia viscosa.
Axis II (RDA II) showed a gradient related to some of the physicochemical characteristics of the soil. On the one hand, it progresses from low to high values of bare soil cover and potassium (K+) for species such as Cenchrus ciliaris, Aizoon canariense, and Launaea arborescens. On the other hand, there is also a gradient that moves toward lower values of electrical conductivity (EC) and percentage of organic matter content (% OM).
The variable Mg2+ (magnesium) was closely related to the invaded plots, with concentration values typically higher in soil samples collected from the invaded plots. In contrast, for the control plots, the abiotic variables that seemed to characterize them were K (potassium), altitude, and rock cover (Figure 5).
It can be clearly observed that Pluchea ovalis (Plu_ova) was the most characteristic species of the invaded plots, a finding which is corroborated by the indicator species analysis (ISA) (Figures S1 and S2). In the control plots, the most characteristic species appeared to be Euphorbia lamarckii (Eup_lam) or Kleinia neriifolia (Kle_ner).

4. Discussion

Some ecological characteristics of the species that could explain its expansion were found. Regarding germination, our results suggest that it is directly influenced by temperature and light, thriving at an optimum cool temperature (17–24 °C) as other invasive plant species of the same family [59,60].
No previous studies on Pluchea ovalis germination have been found so far, but there are studies on other species of the same genus. For Pluchea carolinensis, it has been observed that both temperature and light directly affect germination [61]. For other species in the Asteraceae family, temperature also affects germination, but it has not been demonstrated that light conditions have the same effect [62,63].
According to our results, higher temperature ranges slightly reduce the species germination capacity. Thus, in the context of projected global climate change, it is likely that, given the high seed production of the species, the increase in temperature will not pose a significant obstacle to its expansion. Similar to our findings, previous studies conducted on other species of the genus demonstrate the shade intolerance of these species [64,65]. In addition, other studies have found differences in terms of germination when comparing native and invaded ranges [14,17,66,67,68], as the species become adapted and favor the climatic conditions. In this case, the rapid expansion of the species in Tenerife could be explained by the climatic and environmental conditions.
Regarding greenhouse experiments, our results indicate significant differences among treatments, but we cannot claim that any is optimal. No studies have been found that evaluate Pluchea ovalis germination under controlled greenhouse conditions. For other species of the genus Pluchea, there is only one previous study, although it does not study germination under different treatments [69]. However, other studies on species of the same family indicate that darkness leads to a decrease in germination, although not with the same intensity as in this work. Additionally, our results indicate that germination capacity is also significantly reduced in hot substrates (in addition to the lack of germination in the drought treatment), indicating the species’ preference for moist and waterlogged substrates, primarily found in the northern part of the island. Thus, it is understood that, regarding management, it is preferable to act on individuals located in wet and waterlogged areas.
Regarding the effect of Pluchea ovalis on soil properties, our results demonstrate that its presence increases magnesium (Mg2+) content. However, a study on a species of the same genus (Pluchea lanceolata (DC.) C. B. Clarke) indicates that there are no significant differences in the content of magnesium and other nutrients in the soil when comparing invaded plots and control plots [70]. In contrast, other Asteraceae species, e.g., Chromolaena odorata (L.) R. M. King & H. Rob and Tithonia diversifolia (Hemsl.) A. Gray, seem to favor the increase in magnesium and other available cations in the soil where they grow [71,72].
The allelopathic effect of two species of the same genus, Pluchea dioscoridis and Pluchea lanceolata, has been demonstrated [73,74,75]. Nevertheless, our results indicate that the number of species is greater in the invaded plots than in the control ones. As revealed by the indicator species analysis, it was observed that the invasive exotic species Cenchrus setaceus and Opuntia maxima are more abundant in the invaded plots. This could be explained by a facilitation process between species, also known as the “invasional meltdown hypothesis” [76,77]. This theory explains how invasive species can modify the environmental conditions of the areas they invade, thus favoring the establishment of new exotic species. Moreover, we observed that in several of the invaded plots, individuals of Pluchea ovalis grow on decomposing individuals of Opuntia maxima, suggesting that they could be incorporating sufficient water into the soil for the species’ development. Further experiments focused on this are necessary to confirm the invasional meltdown hypothesis in the case of Pluchea ovalis. Furthermore, more studies should be conducted to confirm our results and their possible consequences.

5. Conclusions

Knowledge of the ecology of an invasive species is very important for control and eradication efforts. This work presents some characteristics of the behavior of the species Pluchea ovalis that can be useful for its management, at least on the island of Tenerife.
At higher temperature ranges, the germination capacity of the species decreases; however, this does not appear to be as much of a limiting factor as darkness. Additionally, further studies should be conducted to analyze possible differences in germination and other traits of Pluchea ovalis when comparing native and invaded ranges.
The root functional traits do not differ between treatments. In future studies, it would be appropriate to increase the duration of the experiment, as, in this case, the plants only had two months to develop. In addition, the presence of Pluchea ovalis could be modifying the chemical properties of the soil by increasing its magnesium content. Furthermore, it could be facilitating the establishment of other invasive exotic species. A broader study should be planned in order to confirm the invasional meltdown hypothesis while considering past land uses.
Given the potential for invasion of Pluchea ovalis in the Canary Islands, its inclusion in the Spanish Catalogue of Invasive Alien Species [78] is a matter of great urgency. Additionally, future studies should focus on modeling its potential distribution in current and future climate scenarios.
By identifying the most suitable places for germination and growth and its potential areas of expansion, control and eradication efforts could be optimized, focusing on areas most susceptible to invasion.

Supplementary Materials

The following supporting information can be downloaded at: https://www.mdpi.com/article/10.3390/ecologies6020028/s1, Table S1. List of all the species identified in all sampled plots. ‘Listed as invasive’ refers to all those species included in the Spanish List of Alien Invasive Species [54]; Table S2. List of species present in both types of plots; Figure S1. Percentage of native and invasive species present in the control plots during both periods of sampling; Figure S2. Percentage of native and invasive species present in the invaded plots during both periods of sampling; Table S3. Physicochemical soil properties for all sampled plots after both summer and winter samplings; Table S4. Abiotic data collected in all sampled plots during both winter and summer samplings; Figure S3. Indicator species analysis for the summer sampling; Figure S4. Indicator species analysis for the winter sampling.

Author Contributions

Conceptualization, formal analysis, writing, M.P. and J.R.A.; data curation, I.S.; data curation, visualization, supervision, C.G.-M.; investigation and supervision, N.S.C.; conceptualization, investigation, review and editing, and funding acquisition, J.R.A. All authors have read and agreed to the published version of the manuscript.

Funding

We thank the “Excmo. Cabildo Insular de Tenerife” and GEPLAN S.L. for funding and supporting this study.

Institutional Review Board Statement

Not applicable.

Informed Consent Statement

Not applicable.

Data Availability Statement

The data are provided in the manuscript.

Acknowledgments

We thank the Excmo. Cabildo Insular de Tenerife and GESPLAN S.L. for their cooperation in locating the invaded sites, CIPEV for supporting germination tests, and IPNA—CSIC for soil analysis.

Conflicts of Interest

The authors declare no conflicts of interest.

References

  1. Mack, R.; Simberloff, D.; Lonsdale, M.W.; Evans, H.; Clout, M.; Bazzaz, F.A. Biotic invasions: Causes, epidemiology, global consequences and control. Ecol. Appl. 2000, 10, 689–710. [Google Scholar] [CrossRef]
  2. Jaksic, F.M.; Castro, S.A. Biological invasions in the Anthropocene. In Biological Invasions in the South American Anthropocene: Global Causes and Local Impacts; Springer Nature: Cham, Switzerland, 2021; pp. 19–47. [Google Scholar]
  3. Baker, H.G. The evolution of weeds. Annu. Rev. Ecol. Syst. 1974, 5, 1–24. [Google Scholar]
  4. Baker, H.G. Patterns of plant invasion in North America. In Ecology of Biological Invasions of North America and Hawaii; Springer: New York, NY, USA, 1986; pp. 44–57. [Google Scholar]
  5. Sakai, A.K.; Allendorf, F.W.; Holt, J.S.; Lodge, D.M.; Molofsky, J.; With, K.A.; Baughman, S.; Cabin, R.J.; Cohen, J.E.; Ellstrand, N.C.; et al. The Population Biology of Invasive Species. Annu. Rev. Ecol. Evo. Syst. 2001, 32, 305–332. [Google Scholar] [CrossRef]
  6. Ruiz, G.M.; Rawlings, T.K.; Dobbs, F.C.; Drake, L.A.; Mullady, T.; Huq, A.; Colwell, R.R. Global spread of microorganisms by ships. Nature 2000, 408, 49–50. [Google Scholar] [PubMed]
  7. Kier, G.; Kreft, H.; Ming-Lee, T.; Jetz, W.; Ibisch, P.L.; Nowicki, C.; Mutke, J.; Barthlott, W. A global assessment of endemism and species richness across island and mainland regions. Biol. Sci. 2009, 106, 9322–9327. [Google Scholar] [CrossRef] [PubMed]
  8. Pfadenhauer, W.G.; Bradley, B.A. Quantifying vulnerability to plant invasion across global ecosystems. Ecol. Appl. 2024, 34, e3031. [Google Scholar]
  9. Moser, D.; Lenzner, B.; Weigelt, P.; Dawson, W.; Kreft, H.; Pergl, J.; Pyšek, P.; van Kleunen, M.; Winter, M.; Capinha, C.; et al. Remoteness promotes biological invasions on islands worldwide. Biol. Sci. 2018, 115, 9270–9275. [Google Scholar]
  10. Blackburn, T.M.; Bellard, C.; Ricciardi, A. Alien versus native species as drivers of recent extinctions. Front. Ecol. Environ. 2019, 17, 203–207. [Google Scholar]
  11. Bellard, C.; Cassey, P.; Blackburn, T.M. Alien species as a driver of recent extinctions. Biol. Lett. 2016, 12, 20150623. [Google Scholar]
  12. De Nascimento, L.; Willis, K.J.; Fernández-Palacios, J.M.; Criado, C.; Whittaker, R.J. The long–term ecology of the lost forests of La Laguna, Tenerife (Canary Islands). J. Biogeogr. 2009, 36, 499–514. [Google Scholar]
  13. De Nascimento, L.; Nogué, S.; Naranjo-Cigala, A.; Criado, C.; McGlone, M.; Fernández-Palacios, E.; Fernández-Palacios, J.M. Human impact and ecological changes during prehistoric settlement on the Canary Islands. Quat. Sci. Rev. 2020, 239, 106332. [Google Scholar] [CrossRef]
  14. Banco de Datos de Biodiversidad de Canarias (BIOTA). Available online: https://www.biodiversidadcanarias.es/biota/ (accessed on 11 October 2024).
  15. Red Canaria de Alerta Temprana de Especies Exóticas Invasoras (REDEXOS). Available online: https://www3.gobiernodecanarias.org/cptss/sostenibilidad/biodiversidad/redexos/ (accessed on 24 October 2024).
  16. Rodríguez-Navarro, M.L.; Fariña-Trujillo, B.; Rivero-Quintero, A. La expansion de las especies de Pluchea Cass. (Asteraceae) y su potencial comportamiento invasor en Tenerife (Islas Canarias). Rev. Sci. Insul. 2021, 4, 11–25. [Google Scholar] [CrossRef]
  17. Weidenhamer, J.D.; Callaway, R.M. Direct and indirect effects of invasive plants on soil chemistry and ecosystems function. J. Chem. Ecol. 2010, 36, 59–69. [Google Scholar] [CrossRef] [PubMed]
  18. Xu, H.; Liu, Q.; Wang, S.; Yang, G.; Xue, S. A global meta-analysis of the impacts of exotic plant species invasion on plant diversity and soil properties. Sci. Total Environ. 2022, 810, 152286. [Google Scholar] [CrossRef]
  19. Slesak, R.A.; Harrington, T.B.; D’Amato, A.W.; Peter, D.H. Removal of invasive scoth broom increases its negative effects on soil chemistry and plant communities. Oecologia 2022, 198, 243–254. [Google Scholar] [CrossRef]
  20. Zarafshar, M.; Bazot, S.; Matinizadeh, M.; Bordbar, S.K.; Rousta, M.J.; Kooch, Y.; Enayati, K.; Abbasi, A.; Negahdarsaber, M. Do tree plantations or cultivated fields have the same ability to maintain soil quality as natural forests? Appl. Soil Ecol. 2020, 151, 103536. [Google Scholar] [CrossRef]
  21. Stanek, M.; Piechnik, L.; Stefanowicz, A.M. Invasive red oak (Quercus rubra L.) modifies soil physicochemical properties and forest understory vegetation. For. Ecol. Manag. 2020, 472, 118253. [Google Scholar] [CrossRef]
  22. Wen, B. Effects of high temperature and water stress on seed germination of the invasive species Mexican sunflower. PLoS ONE 2015, 10, e0141567. [Google Scholar] [CrossRef]
  23. Donohue, K.; Rubio de Casas, R.; Burghardt, L.; Kovach, K.; Willis, C.G. Germination, postgermination adaptation and species ecological ranges. Annu. Rev. Ecol. Evol. Syst. 2010, 41, 293–319. [Google Scholar] [CrossRef]
  24. Udo, N.; Tarayre, M.; Atlan, A. Evolution of germination strategy in the invasive species Ulex europaeus. J. Plant Ecol. 2016, 10, 375–385. [Google Scholar]
  25. Hahn, M.A.; Lanz, T.; Fasel, D.; Müller-Schärer, H. Increased seed survival and seedling emergence in a polyploidy plant invader. Am. J. Bot. 2013, 100, 1555–1561. [Google Scholar] [CrossRef]
  26. Henery, M.L.; Bowman, G.; Mráz, P.; Treier, U.A.; Gex-Fabry, E.; Schaffner, U.; Müller-Schärer, H. Evidence for a combination of pre-adapted traits and rapid adaptive change in the invasive plant Centaurea stoebe. J. Ecol. 2010, 98, 800–813. [Google Scholar] [CrossRef]
  27. Hierro, J.L.; Eren, Ö.; Khetsuriani, L.; Diaconu, A.; Török, K.; Montesinos, D.; Andonian, K.; Kikodze, D.; Janoian, L.; Estanga-Mollica, M.E.; et al. Germination responses of an invasive species in native and non-native ranges. Oikos 2009, 118, 529–538. [Google Scholar]
  28. Plants of the World Online (POWO). Available online: https://powo.science.kew.org/ (accessed on 24 October 2024).
  29. Sauerbier, H.; Cabrera-Calixto, F.; Muer, T. Flora Vascular de Canarias, 1st. ed.; Turquesa Ediciones: San Cristóbal de La Laguna, Spain, 2023; p. 1192. [Google Scholar]
  30. King-Jones, S. Revision of Pluchea Cass (Compositae, Plucheae) in the Old World. Englera 2001, 23, 3–136. [Google Scholar]
  31. Padrón-Mederos, M.A.; Reyes-Betancort, J.A. Apuntes florísticos y taxonómicos para la flora de las Islas Canarias. Acta Botánica Malacit. 2009, 34, 242–251. [Google Scholar]
  32. Verloove, F.; Reyes-Betancort, J.A. Additions to the flora of Tenerife (Canary Islands, Spain). Collect. Bot. 2011, 30, 63–78. [Google Scholar]
  33. Barone-Tosco, R.; Hernández-Romero, F. La planta Pluchea ovalis invade el sur de Tenerife. Quercus 2014, 399, 42–43. [Google Scholar]
  34. Martín-Osorio, V.E.; Wildpret, W. Pluchea dioscoridis (L.) DC (Asteraceae) new introduced and naturalized species in Tenerife, Canary Islands. Vieraea 2014, 42, 323–326. [Google Scholar]
  35. Verloove, F. New xenophytes from Gran Canaria (Canary Islands, Spain), with emphasis on naturalized and (potentially) invasive species. Coll. Bot. 2013, 33, 59–82. [Google Scholar]
  36. Verloove, F. New xenophytes from the Canary Islands (Gran Canaria and Tenerife; Spain). Acta Bot. Croat. 2010, 76, 120–131. [Google Scholar]
  37. Del Arco-Aguilar, M.J.; González-González, R.; Garzón-Machado, V.; Pizarro-Hernández, B. Actual and potential natural vegetation on the Canary Islands and its conservation status. Biodivers. Conserv. 2010, 19, 3089–3140. [Google Scholar]
  38. Del Arco-Aguilar, M.J.; Wildpret-de la Torre, W.; Pérez-de Paz, P.L.; Rodríguez-Delgado, O.; Acebes-Ginovés, J.R.; García-Gallo, A.; Martín-Osorio, V.E.; Reyes-Betancort, A.; Salas-Pascual, M.; Díaz, M.A.; et al. Mapa de Vegetación de Canarias, 1st ed.; Grafcan Ediciones: Santa Cruz de Tenerife, Spain, 2006; p. 294. [Google Scholar]
  39. Del Arco-Aguilar, M.J.; Rodríguez-Delgado, O. Vegetation of the Canary Islands, 1st ed.; Springer: Cham, Switzerland, 2018; pp. 92–293. [Google Scholar]
  40. Agencia Estatal de Meteorología (AEMET). Available online: https://www.aemet.es/es/portada (accessed on 7 December 2024).
  41. Côme, D. Obstacles to germination. Obs. Germ. 1970, 6, 162. [Google Scholar]
  42. Aravind, J.; Vimala, D.; Radharani, J.; Jacob, S.R.; Srinivasa, K. The Germinationmetrics Package: A Brief Introduction; ICAR-National Bureau of Plant Genetic Resources: New Delhi, India, 2019. [Google Scholar]
  43. Scott, S.J.; Jones, R.A.; Williams, W.A. Review of data analysis for seed germination. Crop Sci. 1984, 24, 1192–1199. [Google Scholar]
  44. Orchard, T. Estimating the parameters of plant seedling emergence. Seed Sci. Technol. 1977, 5, 61–69. [Google Scholar]
  45. Benech Arnold, R.; Fenner, M.; Edwards, P. Changes in germinability, ABA content and ABA embryonic sensitivity in developing seeds of Sorghum bicolor (L.) Moench. induced by water stress during grain filling. New Phytol. 1991, 118, 339–347. [Google Scholar] [PubMed]
  46. Al-Mudaris, M. Notes on various parameters recording the speed of seed germination. Der Tropenlandwirt-J. Agric. Trop. Subtrop. 1998, 99, 147–154. [Google Scholar]
  47. Goloff, A.A., Jr.; Bazzaz, F.A. A germination model for natural seed populations. J. Theor. Biol. 1975, 52, 259–283. [Google Scholar]
  48. Seethepalli, A.; York, L.M. RhizoVision Explorer—Interactive software for generalized root image analysis designed for everyone (2.0.3). Zenodo 2020. [Google Scholar] [CrossRef]
  49. Ryser, P. The importance of tissue density for growth and life span of leaves and roots: A comparisson of five ecologically contrasting grasses. Funct. Ecol. 1996, 10, 717–723. [Google Scholar]
  50. Freschet, G.T.; Roumet, C.; Comas, L.H.; Weemstra, M.; Bengough, A.G.; Rewald, B.; Bardgett, R.D.; De Deyn, G.B.; Johnson, D.; Klimešová, J.; et al. Root traits as drivers of plant ecosystem functioning: Current understanding, pitfalls and future research needs. New Phytol. 2020, 232, 1123–1158. [Google Scholar]
  51. Weemstra, M.; Mommer, L.; Visser, E.J.W.; van Ruijven, J.; Kuyper, T.W.; Mohren, G.M.J.; Sterck, F.J. Towards a multidimensional root trait framework: A tree root review. New Phytol. 2016, 211, 1159–1169. [Google Scholar] [CrossRef] [PubMed]
  52. Anon. Métodos Oficiales de Análisis, 1st ed.; Ministerio de Agricultura, Pesca y Alimentación: Madrid, Spain, 1986. [Google Scholar]
  53. AOAC. Official Methods of Analysis of the Association of Official Analytical Chemist, 15th ed.; The Association: Arlington, TX, USA, 1990. [Google Scholar]
  54. Fernández-Lugo, S.; de Nascimento, L.; Mellado, M.; Bermejo, L.A.; Arévalo, J.R. Vegetation change and chemical soil composition after 4 years of goat grazing exclusion in a Canary Islands pasture. Agric. Ecosyst. Environ. 2009, 132, 276–282. [Google Scholar] [CrossRef]
  55. Šmilauer, P.; Lepš, J. Multivariate Analysis of Ecological Data Using CANOCO 5, 2nd ed.; Cambridge University Press: Cambridge, UK, 2014; ISBN 978-1-107-69440-8. [Google Scholar]
  56. Borcard, D.; Gillet, F.; Legendre, P. Numerical Ecology with R, 1st ed.; Springer: New York, NY, USA, 2011. [Google Scholar]
  57. Palmer, M.W. Ordination Methods-an Overview; Oklahoma State University: Stillwater, OK, USA, 2004. [Google Scholar]
  58. Hammer, Ø.; Harper, D.A.T.; Ryan, P.D. PAST: Paleontological statistics software package for education and data analysis. Palaeontol. Electron. 2001, 4, 1–9. [Google Scholar]
  59. Luo, J.; Cardina, J. Germination patterns and implications for invasiveness in three Taraxacum (Asteraceae) species. Weed Res. 2010, 52, 112–121. [Google Scholar] [CrossRef]
  60. Westman, W.E.; Panetta, F.D.; Stanely, T.D. Ecological studies on reproduction and establishment of the woody weed, groundsel bush (Baccharis halimifolia L.: Asteraceae). Aust. J. Agr. Res. 1975, 26, 855–870. [Google Scholar] [CrossRef]
  61. Sánchez, J.A.; Montejo, L.; Gamboa, A.; Albert-Puentes, D.; Hernández, F. Germinación y dormancia de arbustos y trepadoras del bosque siempreverde de la Sierra del Rosario, Cuba. Pastos Forrajes 2015, 38, 11–28. [Google Scholar]
  62. Leger, E.A.; Rice, K.J. Assessing the speed and predictability of local adaptation in invasive California poppies (Eschscholzia californica). J. Evol. Biol. 2007, 20, 1090–1103. [Google Scholar] [CrossRef]
  63. Beckmann, M.; Bruelheide, H.; Erfmeier, A. Germination responses of three grassland species differ between native and invasive origins. Ecol. Res. 2011, 26, 763–771. [Google Scholar] [CrossRef]
  64. Kudoh, H.; Nakayama, M.; Lihová, J.; Marhold, K. Does invasion involve alternation of germination requirements? A comparative study between native and introduced strains of an annual Brassicaceae, Cardamine hirsuta. Ecol. Res. 2007, 22, 869–875. [Google Scholar] [CrossRef]
  65. Kurt, S.; Erdağ, B. In vitro germination and axillary shoot propagation of Centaurea zeybekii. Biologia 2009, 64, 97–101. [Google Scholar] [CrossRef]
  66. Gianguzzi, V.; Di Gristina, E.; Barone, G.; Sottlie, F.; Domina, G. Seed germination and vegetative and in vitro propagation of Hieracium lucidum sbsp. lucidum (Asteraceae), a critically endangered endemic taxon of the sicilian flora. PeerJ 2024, 12, e16839. [Google Scholar]
  67. Falkner, M.B.; Laven, R.D.; Aplet, G.H. Experiments on germination and early growth of three rare and endemic species of Hawaiian Tetramolopium (Asteraceae). Biol. Cons. 1997, 80, 39–47. [Google Scholar]
  68. Rodrigues de Queiroz, A.; Maricle, B.R. Effects of light levels on germination of five Asteraceae species native to the tallgrass prairie. Trans. Kans. Acad. Sci. 2019, 122, 267–273. [Google Scholar]
  69. Shahda, R.H.; El-Bana, M.; El-Bous, M.M.; Zaghloul, M.S. Variations in achene traits, germination, and seedling growth of Pluchea dioscoridis (L.) DC. as affected by maternal climatic aridity. Egypt. J. Bot. 2022, 62, 85–96. [Google Scholar] [CrossRef]
  70. Inderjit. Influence of Pluchea lanceolata (Asteraceae) on selected soil properties. Am. J. Bot. 1998, 85, 64–69. [Google Scholar]
  71. Koné, A.W.; Edoukou, E.F.; Gonnety, J.T.; N’Dri, A.N.A.; Assémien, L.F.E.; Angui, P.K.T.; Tondoh, J.E. Can the shrub Chromolaena odorata (Asteraceae) be considered as improving soil biology and plant nutrient availability? Agrofor. Syst. 2012, 85, 233–245. [Google Scholar] [CrossRef]
  72. Agbede, T.M.; Adekiya, A.O.; Ogeh, J.S. Response of soil properties and yam yield to Chromolaena odorata (Asteraceae) and Tithonia diversifolia (Asteraceae) mulches. Arch. Agron. Soil Sci. 2014, 60, 209–224. [Google Scholar]
  73. Inderjit; Dakshini, K.M.M. Allelopathic potential of the phenolics from the roots of Pluchea lanceolata. Physiol. Plant. 1994, 92, 571–576. [Google Scholar]
  74. Fahmy, G.M.; Al-Sawaf, N.A.; Turki, H.; Ali, H.I. Allelopathic potential of Pluchea dioscoridis (L.) DC. J. Appl. Sci. Res. 2012, 8, 3129–3142. [Google Scholar]
  75. Youssef, N.; Diatta, J. Potential efficiency of wild plant species (Pluchea dioscoridis (L.) DC.) for phytoremediation of trace elements on contaminated locations. Sustainability 2023, 15, 119. [Google Scholar] [CrossRef]
  76. Simberloff, D.; Von Holle, B. Positive interactions of nonindigenous species: Invasional meltdown? Biol. Invasions 1999, 1, 21–32. [Google Scholar]
  77. Green, P.T.; O’Dowd, D.J.; Abbott, K.L.; Jeffery, M.; Retallick, K.; Mac-Nally, R. Invasional meltdown: Invader—Invader mutualism facilitates a secondary invasion. Ecology 2011, 92, 1758–1768. [Google Scholar] [PubMed]
  78. Real Decreto 630/2013, de 2 de Agosto, por el que se regula el Catálogo español de especies exóticas invasoras. Available online: https://www.boe.es/eli/es/rd/2013/08/02/630/con (accessed on 27 November 2024).
Figure 1. Germinated seed on a 0.5% agarose base from the treatment 24–31 °C N. The scale is 5000 µm.
Ecologies 06 00028 g001
Figure 2. Part of the study design showing the random distribution of seedbeds by treatments. Heat-treatment seedbeds were not randomly distributed due to logistic issues. Colors represent different treatments—red: heat, grey: nutrient deficiency, blue: flooding, black: 50% darkness, purple: drought, and green: control. Numbers are replicates.
Ecologies 06 00028 g002
Figure 3. Germination for both photoperiods. The letter ‘a’ indicates significant differences between the 17–24 °C and 24–31 °C temperature ranges under the 12 h–12 h photoperiod at the p < 0.05 level. Bars represent the interquartile range, the line inside the bars is the median, the lines outside the bars represent the data outside the interquartile range, and circles are the outliers. N and D on the x-axis of the plots indicate the normal treatment and the darkness treatment, respectively.
Ecologies 06 00028 g003aEcologies 06 00028 g003b
Figure 4. Germination and plant height for all control, flooding, heat, and nutrient deficiency treatments. Letters a, b, and c indicate significant differences between groups at the p < 0.05 level (a: control–flooding), (b: control–heat), (c: heat–nutrient deficiency). Bars represent the interquartile range, the line inside the bars is the median, the lines outside the bars represent the data outside the interquartile range, and circles are the outliers.
Ecologies 06 00028 g004
Figure 5. RDA analysis for control and invaded plots. The eigenvalues of axes I and II are 0.255 and 0.157, respectively. The total explained variation is 41.22.
Ecologies 06 00028 g005
Table 1. Final germination percentage (FGP), mean germination time (MGT), germination index (GI), time spread of germination (TSG), and first germination time (FGT) indexes. Values are presented for all the indexes calculated. MGT is calculated as the mean ± SD.
TreatmentFGP (%)MGT (Days)GITSG (Days)FGT (Days)
10–17 °C N248 ± 6.482.88145
10–17 °C D1214.33 ± 6.570.68513
17–24 °C N58.84.11 ± 8.789.3414
17–24 °C D22.58.89 ± 6.462.5124
24–31 °C N8.893.63 ± 6.611.4632
24–31 °C D3.338.67 ± 6.680.3857
31–38 °C N24.443.68 ± 6.543.9842
31–38 °C D14.4412.15 ± 6.521.13117
Disclaimer/Publisher’s Note: The statements, opinions and data contained in all publications are solely those of the individual author(s) and contributor(s) and not of MDPI and/or the editor(s). MDPI and/or the editor(s) disclaim responsibility for any injury to people or property resulting from any ideas, methods, instructions or products referred to in the content.

