Abstract
Responses of forest-floor small mammals to clearcutting are species-specific with generalists occupying a range of habitats, and specialists persisting on clearcuts for variable periods. We investigated the responses in abundance and species composition of small mammal communities to cumulative clearcutting of coniferous forests on a landscape that had four independent clearcutting events (Periods 1 to 4) over a 42-year interval from 1979 to 2020 in south-central British Columbia, Canada. We ask if the small mammal communities have changed significantly over these decades owing to removal of old-growth forest by clearcut harvesting. Hypotheses (H) predicted that the small mammal community would (H1) increase in abundance, species richness, and diversity on new clearcuts owing to the availability of early seral post-harvest habitats from cumulative clearcutting; and (H2) have higher mean abundance, species richness, and species diversity in clearcut than uncut forest sites, owing to availability of vegetative food and cover. A third hypothesis (H3) predicted that abundance of (i) early seral vegetation (herbs and shrubs) and (ii) small mammal populations, will be greater in ungrazed clearcut sites than in those grazed by cattle (Bos taurus). Mean total numbers of small mammals on new clearcuts declined in Periods 3 and 4, and hence did not support the abundance part of H1. Much of this decline was owing to low numbers of the long-tailed vole (Microtus longicaudus) and meadow vole (M. pennsylvanicus). Two generalist species: the deer mouse (Peromyscus maniculatus) and northwestern chipmunk (Neotamias amoenus), contributed to high mean species richness and diversity in Periods 2 and 3 before these metrics declined in Period 4, and hence partly supported H1. The similarity in mean total numbers of small mammals in Periods 2 to 4 did not support the abundance prediction of H2 that total numbers would be higher in clearcut than uncut forest sites. Higher mean species richness (Periods 2 and 3) and diversity (Period 3) measurements on clearcut than forest sites, particularly in the early post-harvest years, did support these parts of H2. The vegetation part (i) of H3 was not supported for herbaceous plants but it was for shrubs. The small mammal part (ii) of H3 that populations would be higher in ungrazed than grazed clearcut sites was supported for abundance but not for species richness or diversity. The decline and near disappearance of both species of Microtus was possibly related to the reduction in plant community abundance and structure from grazing (at least for shrubs) and potentially from drought effects associated with climate change. Loss of microtines from these early seral ecosystems may have profound negative effects on various ecological functions and predator communities.
1. Introduction
Conservation of mature and old-growth forests has reached a crucial point in time because there are unpredictable and large-scale losses of existing timber due to clearcut harvesting, natural disturbances from wildfire, insect epidemics, windthrow, and potentially widespread drought owing to climate change [1,2,3,4]. Naturally disturbed forests may also have large-scale salvage harvesting that creates very large (>1000 ha) contiguous openings [5]. Clearcutting continues to be common and may reduce the abundances of some mammalian species because of a loss of food, cover, and forest stand structure [6,7,8,9,10].
Forest-floor small mammals are excellent ecological indicators of significant change in forest structure and function [11,12,13,14]. These functions include prey for many predators [15,16], consumers of seeds [17,18], seedlings [19,20], other plant products [21], and invertebrates [22,23], and dispersal of fungal (including mycorrhizae) spores [24,25]. Many studies have used small mammals as a model to evaluate improvements in forestry practices and sustainable management for conservation of forest biodiversity across landscapes [14,26].
Responses of forest-floor small mammals to clearcutting in North America are species-specific with generalists such as the deer mouse (Peromyscus maniculatus) and chipmunks (Neotamias spp.) occupying a range of habitats, whereas Microtus voles and Sorex shrews may persist on clearcuts for variable periods. Similarly, common species of small mammals usually increased in abundance, or were not affected, by clearcutting of temperate and boreal forests in Europe [10]. Small mammals take advantage of increased vegetation cover and food on clearcuts. Foods include herbaceous forbs and grasses, seeds, fruits, and mast of various tree and plant species, invertebrates, and fungi [17,24,27,28].
Specialists such as the southern red-backed vole (Clethrionomys gapperi) require closed-canopy forest and disappear on clearcuts, often within a year after harvest, at least in coniferous stands in North America [29,30]. Thus, C. gapperi is an important indicator species of closed-canopy forest conditions in managed landscapes [31]. This microtine does not return to old forest-level abundance for several decades [32,33]. Recent reviews by [9,26] have corroborated this pattern of response in abundance of small mammal species to clearcutting in North America.
A major limitation of determining the explanation for population changes of forest-floor small mammals is that most studies are short-term (e.g., 3–5 years). However, the crucial importance of identifying and understanding how species and ecosystems respond to environmental change requires long-term studies of many decades [34]. Research undertakings in forest ecology are long-term endeavors that may be termed “the long now” [35]. The value of long-term monitoring of ecological sites has been known for some time [36,37,38,39], Long-term monitoring programs provide managers with input on the effectiveness of past actions (e.g., silvicultural systems) and/or environmental change (e.g., habitat alteration and climate change) that help provide input into management and policy decisions [34,39]. This feature of “the long now” allows us to look forward in a way that is informed by the past [35]. For example, long-term datasets (46 years) from the Yukon Territory have recorded major changes in northern red-backed vole (C. rutilus) and deer mouse numbers over several years, possibly related to climate change [40,41].
In many forest regions, the cumulative removal of forest cover by clearcutting and salvage harvesting has generated large expanses of early successional habitat on an unprecedented scale [4]. We ask what are the long-term consequences of this dramatic change in habitat for abundance and species composition of forest-floor small mammal communities? We have a unique 42-year window of a landscape from the first clearcut-harvest event in lodgepole pine (Pinus contorta var. latifolia) forest through four independent periods of cumulative clearcutting (1979 to 2020) in southern British Columbia (BC), Canada. Cover of early successional habitat progressed from 0% of the landscape in 1977 (pre-clearcutting) to ≥70% in 2020. Conversely, cover of standing mature and old-growth coniferous forest has declined from near 100% to ≤30%. In addition, a second anthropogenic disturbance is that virtually all clearcuts are grazed by cattle (Bos taurus) which are ubiquitous throughout much of the inland Pacific Northwest, at least where summer forage is relatively abundant [42]. A further disturbance is climate change, which is particularly severe in arctic regions, but is affecting all ecosystems including temperate forests [43].
Firstly, we investigated the responses in abundance and species composition of small mammal communities to cumulative clearcutting of coniferous forests over a landscape that covered four independent harvest events (Periods 1 to 4) over a 42-year interval from 1979 to 2020. In particular, we ask if the small mammal communities have changed significantly over these decades owing to removal of old-growth forest by clearcut harvesting. Secondly, we report on changes in abundance, species richness, and diversity of small mammal communities in newly clearcut harvested sites and uncut old-growth forest sites over these same four Periods. Thirdly, we compared the responses in the abundance of early seral vegetation (herbs and shrubs) post-harvest and abundance, species richness, and diversity of small mammal communities in cattle-grazed and ungrazed clearcuts over three comparable periods of cumulative clearcutting at our Summerland and Golden study areas, respectively.
To better understand these long-term changes, we tested three hypotheses (H): the small mammal community would (H1) increase in abundance, species richness, and diversity on new clearcuts owing to the availability of early seral post-harvest habitats from cumulative clearcutting; and (H2) have higher mean abundance, species richness, and species diversity in clearcut than uncut forest sites, owing to availability of vegetative food and cover. A third hypothesis (H3) predicted that abundance of (i) early seral vegetation (herbs and shrubs) and (ii) small mammal populations, will be greater in ungrazed than grazed clearcut sites
2. Methods
2.1. Study Areas
Studies were conducted in BC, Canada from 1979 to 2020. The long-term cumulative clearcutting (LTCC), clearcut-forest (CC-FOR), and ungrazed vs. grazed clearcut (CC-GR) studies were located at two study areas in south-central BC: (i) Summerland (LTCC + CC-FOR + CC-GR) 25 km west of Summerland and (ii) Golden (CC-GR) 25 km and 35 km east and northwest, respectively, of Golden. The Summerland area is primarily in the Montane Spruce (MSdm; dry, mild) biogeoclimatic subzone with a small part in the upper Interior Douglas fir (Pseudotsuga menziesii var. glauca) (IDFdk; dry, cool) subzone [44] (Table 1). Hybrid interior spruce (Picea glauca × P. engelmannii) and subalpine fir (Abies lasiocarpa) are the dominant shade-tolerant climax trees. Trembling aspen (Populus tremuloides) and black cottonwood (Populus trichocarpa) occur on some moist sites [44].

Table 1.
Characteristics of Summerland and Golden study areas and treatment sites for the cumulative clearcutting study (LTCC) and grazed vs. ungrazed clearcutting (CC-GR) studies.
The Golden area is in the MSdk (dry, cool) and Interior Cedar-Hemlock (ICHmk; moist, cool) biogeoclimatic subzones with topography ranging from hilly to steep terrain at 1060–1350 m elevation in the lower ranges of the Rocky Mountains. Western red cedar (Thuja plicata) and western hemlock (Tsuga heterophylla) dominate mature climax forests with Douglas-fir, lodgepole pine, white spruce (Picea glauca), Engelmann spruce (Picea engelmannii), and subalpine fir common in these stands [44].
The Summerland studies were in a commercial forest landscape with clearcut harvesting of lodgepole pine beginning in 1977 and continuing periodically throughout the 1980s and 1990s in response to an outbreak of mountain pine beetle (MPB) (Dendroctonus ponderosae). Approximately 30% of uncut old-growth forest remained in this area, and hence approximately 70% of the original standing forest of lodgepole pine had been harvested. Thus, the clearcut harvests that initiated the four Periods of the LTCC and CC-FOR and three Periods of the CC-GR studies (1979–1982, 1997–2002, 2007–2011, and 2017–2020) included harvest of lodgepole pine and other available coniferous species.
The Golden study area was located in a similar commercial forest landscape but with some larger expanses of unbroken forest (100 s to 1000 s of ha) than at Summerland. Clearcutting was initially dominated by salvage harvesting of lodgepole pine from stands of MPB-killed and susceptible trees and then conventional harvest focussed on Douglas-fir and interior spruce. The three Periods (2, 3, and 4) of the CC-GR study at Golden (2004–2009, 2012–2016, and 2016–2019) were approximate matches for those at Summerland (1997–2002, 2007–2011, and 2017–2020) with respect to number of post-harvest years after each new clearcutting.
2.2. Study and Sampling Designs
For the LTCC study at Summerland, there were 1, 3, 3, and 4 replicate sites of each treatment in Periods: (1) 1979–1982, (2) 1997–2002, (3) 2007–2011, and (4) 2017–2020, respectively. Timing of clearcut harvesting and mean area of clearcut sites are listed in Table 1. Pinegrass (Calamogrostis rubescens), Arctic lupine (Lupinus arcticus), fireweed (Epilobium angustifolium), and heart-leaved arnica (Arnica cordifolia) were the major herbaceous species on these 1- to 6-year-old clearcut sites. All clearcut units were aerially seeded with an agronomic grass-legume mix in the first year after harvest to enhance forage production for cattle in Period 1 at Summerland [42]. However, this practice was dramatically reduced by 83% by the 1990s [45] and was not evident in Periods 2, 3, or 4 in our study areas. Seasonal grazing by cattle continues to be common and relatively consistent on harvested sites, particularly clearcuts at Summerland, and may last for at least 10–15 years post-harvest [42].
The CC-FOR study at Summerland had a completely randomized design with two treatments: (a) clearcut harvest and (b) uncut old-growth forest in each of the four independent Periods. Forest sites were composed of a mixture of lodgepole pine and Douglas-fir with scattered interior spruce and subalpine fir in wetter sites. Mean ages of lodgepole pine ranged from 80 to 120 years and Douglas-fir and other conifers ranged from 120 to 220 years. Area of forest sites ranged from 10 to 100+ ha. Canopy closure ranged from 82% to 88%. The CC-GR study (Periods 2, 3, and 4) included clearcut sites at Summerland which had summer grazing by cattle and at Golden which had no history of grazing (Table 1). However, seeding of landings, road-sides, and skid-trails with an agronomic-legume mix for slope stabilization and erosion control was conducted, as an operational practice, on some harvested sites at Golden.
All clearcut sites were planted with lodgepole pine, Douglas-fir, and interior spruce seedlings at 1- or 2-years post-harvest. All sites at Summerland and Golden were spatially segregated to enhance biological and statistical independence [46] (Table 1). Forest sites in the CC-FOR study were separated by a mean (±SE) of 1.79 ± 0.49 km (range 0.67–2.96 km). For the major species, very few or no voles or deer mice were captured on more than one grid or line, and hence our sites were considered independent. Sites were not considered independent for the northwestern chipmunk (Neotamias amoenus).
2.3. Forest-Floor Small Mammal Populations
There were nine species of forest-floor small mammals: five major species that included the deer mouse, southern red-backed vole, long-tailed vole (Microtus longicaudus), meadow vole (M. pennsylvanicus), and northwestern chipmunk; and four less common species: heather vole (Phenacomys intermedius), montane shrew (Sorex monticolus), common shrew (S. cinereus), and western jumping mouse (Zapus princeps). Two small mustelids: the short-tailed weasel (Mustela erminea) and long-tailed weasel (M. frenata) were also captured occasionally. At Summerland, populations were sampled at 3–4-week intervals on grids in clearcut and forest sites in Period 1: May to September or October 1979–1982; Period 2: May to October 1997–2002; Period 3: May or June to September or October 2007–2011; and on index-lines in Period 4: May or June to October 2017–2020. At Golden, populations were sampled on clearcut sites at 4-week intervals with grids in Period 1: May to September 2004–2008; at 4- to 8-week intervals with index-lines in Period 2: May to September 2012–2016; and Period 3: May to September 2016–2019.
One live-trapping grid (1 ha) or index-line was in each site. Grids had 49 (7 × 7) trap stations at 14.3-m intervals with 1 Longworth live-trap at each station. An index-line had 7 stations at 14.3-m intervals with four Longworth live-traps at each station [47]. Traps were baited with whole oats, a slice of carrot, and cotton as bedding. Each trap had a 30-cm × 30-cm plywood cover for protection from sunlight (heat) and precipitation. Traps were set on the afternoon of day 1, checked on the morning and afternoon of day 2 and the morning of day 3, and then locked open between trapping periods. All animals captured were ear-tagged with serially numbered tags and point of capture recorded [48]. Animals were released immediately after processing. Unfortunately, the overnight trapping technique resulted in a high mortality rate for shrews. Therefore, shrews were collected, frozen, and later identified according to tooth patterns [49]. All handling of animals followed guidelines approved by the American Society of Mammalogists [50] and the Animal Care Committee, University of British Columbia.
2.4. Population Data Analyses
Abundance estimates of the major species (numerically dominant) were derived from the Jolly–Seber (J-S) stochastic model for open populations with small sample size corrections [51,52]. Minimum number alive was used to estimate populations of the heather vole; number of individuals was used for the montane shrew, common shrew, and western jumping mouse. We calculated the effective trapped area (ETA) for the major species on each grid based on mean maximum distance moved (MMDM) as a boundary strip method [53]. Estimates of population size were converted to a density estimate by dividing population estimates for each trapping period by the ETA. At Summerland, mean ETAs (±SE) (ha) in Periods 1, 2, and 3 for deer mice in clearcut sites was 1.44 ± 0.04 and forest sites was 1.54 ± 0.09; for red-backed voles in forest sites was 1.28 ± 0.04; for long-tailed and meadow voles in clearcut sites was 1.19 ± 0.06; and for chipmunks, where sample size was sufficient, was 2.05 ± 0.02 in clearcut sites and 1.80 ± 0.19 in forest sites. Mean ETAs (±SE) (ha) for Period 2 in clearcut sites at Golden were 1.40 ± 0.03 for deer mice, 1.27 ± 0.00 for red-backed voles, 1.09 ± 0.05 for long-tailed voles, 1.08 ± 0.00 for meadow voles, and 1.82 ± 0.07 for chipmunks.
Regression relationships of numbers of animals captured on index-lines to numbers on an ETA-adjusted 1-ha grid system were conducted for each of the major species: deer mice (y = 8.45ln(x) + 0.69; R2 = 0.47, p < 0.01) [54]; long-tailed vole (y = 0.57x0.80; R2 = 0.62, p < 0.01) [55]; and northwestern chipmunk: (y = −0.14x2 + 1.57x; R2 = 0.51, p < 0.01). We consider each of these estimates to be a “density index” [53]. Jolly trappability was calculated according to [56]. Species richness was the total number of species sampled for the small mammal communities in each site [52]. Species diversity was based on the Shannon-Wiener index [52,57].
2.5. Early Seral Vegetation
Early seral vascular plants were sampled following the method of [58]. Vegetation responses were coordinated for 3 and 5 years post-harvest at Summerland (Period 2; 1999 and 2001) and Golden (Period 2; 2006 and 2008) and again for 1, 2, and 3 years post-harvest at Summerland (Period 3; 2007–2009) and Golden (Period 3; 2012–2014). All sampling was conducted in July–August and plant species were identified in accordance with [59]. No vegetation sampling was done in Periods 1 or 4 at Summerland nor Period 4 at Golden.
2.6. Statistical Analyses
In the LTCC study at Summerland, a repeated-measures analysis of variance (RM-ANOVA) [60] was conducted to determine the effect of clearcutting treatment: Period (1, 2, 3, and 4), and time: years 1 to 4 post-harvest, on mean annual total abundance, species richness, and species diversity of small mammals in the four years immediately post-clearcutting in each Period. Where significant treatment effects were detected that also had significant treatment × time interactions over the four Periods, additional univariate ANOVAs were conducted within individual Periods.
In the CC-FOR study at Summerland, a RM-ANOVA was also conducted to determine the effect of cumulative clearcutting on mean annual total abundance, species richness, and species diversity of small mammals, as well as time and treatment × time interactions, between clearcut and forest sites over the three Periods (2, 3, and 4). Mean values were calculated for these attributes in Period 1 (one replicate only) for comparison with mean results for Periods 2, 3, and 4 in the RM-ANOVA. A univariate ANOVA was conducted to determine the effect of the two treatments on overall mean trappability for P. maniculatus and N. amoenus in clearcut and forest sites.
In the CC-GR study, a RM-ANOVA was conducted to determine the effect of cattle grazing on mean ground cover and abundance (crown volume index) of herb and shrub layers between grazed sites (Summerland) and ungrazed sites (Golden) for the two comparable Periods where vegetation data were available. This analysis was also done for mean annual total abundance, species richness, and species diversity of small mammals, as well as time and treatment × time interactions, between grazed and ungrazed sites for the three comparable Periods. Where significant treatment effects were detected that also had significant treatment × time interactions over the three Periods, additional univariate ANOVAs were conducted within individual Periods.
For all analyses, homogeneity of variance was measured by the Levene statistic. Mauchly’s W-test statistic was used to test for sphericity (independence of data among repeated measures) [61,62]. For data found to be correlated among years, the Huynh-Feldt (H-F) correction was used to adjust the degrees of freedom of the within-subjects F-ratio [63]. Duncan’s multiple range test (DMRT), adjusted for multiple contrasts, was used to compare mean values based on RM-ANOVA results for the LTCC analysis [64]. In all analyses, the level of significance was at least p = 0.05 [65].
3. Results
3.1. Small Mammal Populations
We conducted a total of 185 trapping periods at Summerland (120) and Golden (65) and captured an overall total of 8068 individual small mammals: P. maniculatus (2940), C. gapperi (1586), M. longicaudus (1541), N. amoenus (691), M. pennsylvanicus (376), P. intermedius (194), S. monticolus (553), S. cinereus (181), and Z. princeps (6). At Summerland, for the major species, overall mean (±SE) Jolly trappability (%) of P. maniculatus ranged from 84.6 ± 1.0 to 85.9 ± 3.7 in clearcut sites and from 73.3 ± 8.3 to 81.4 ± 1.0 in forest sites and for N. amoenus ranged from 72.2 ± 5.7 to 75.7 ± 8.4 in clearcut sites to 55.4 ± 10.0 to 63.6 ± 7.2 in forest sites. For both species, these values were similar (p ≥ 0.21) between treatment sites for all Periods, thereby meeting the homogeneity assumption related to capture probabilities. For those species captured predominantly in one treatment site, overall mean (±SE) trappability (%) for C. gapperi ranged from 78.4 ± 3.6 to 87.5 ± 2.3 in forest sites; for M. longicaudus ranged from 65.3 ± 4.4 to 76.8 ± 9.7 in clearcut sites; for M. pennsylvanicus ranged from 67.4 ± 4.2 to 73.2 ± 12.4 in clearcut sites. In clearcut sites at Golden, overall mean (±SE) Jolly trappability (%) of M. longicaudus was 68.5 ± 1.0, P. maniculatus was 75.8 ± 1.9, and N. amoenus was 52.0 ± 1.8.
3.2. Small Mammals and Cumulative Clearcutting
In the LTCC study, mean total annual abundance of small mammals was significantly (F3,7 = 20.59; p < 0.01) different across Periods 1 to 4 of cumulative forest harvesting with numbers being highest (DMRT; p = 0.05) overall in Period 2 (Table 2 and Figure 1). Mean total abundance was 1.7 to 5.2 times higher in Period 2 than Periods 3 and 4, respectively, in the first two years post-harvest. This comparison of total abundance followed the same pattern ranging from 2.6 to 3.4 times higher in Period 1 than Periods 3 and 4 (Table 2). Mean total abundance declined significantly (p < 0.01) with time (i.e., years post-harvest). However, a significant (p < 0.01) effect of treatment × time interaction was a result of higher (DMRT; p = 0.05) abundance in Period 4 than Periods 2 and 3 in the third year post-harvest. Furthermore, these mean values were similar between Period 1 (22.8) and 4 (19.8) in this third year post-harvest (Table 2). There was no difference among Periods in the fourth post-harvest year. Overall mean total abundance was 1.7 to 1.9 times higher in Periods 1 and 2 than Periods 3 and 4 (Table 2).
Table 2.
Mean (n = 1, 3 or 4 replicate sites) ± SE annual total abundance, species richness, and species diversity per ha for forest-floor small mammals during the first four years after clearcutting for each of the four Periods for the LTCC study in southern BC, Canada 1979 to 2020, and results of RM-ANOVA. Within a row, columns of mean values with different letters (upper-case for RM-ANOVA; lower-case for univariate ANOVA) are significantly different by Duncan’s multiple range test (DMRT), adjusted for multiple contrasts. Significant values are given in bold text.
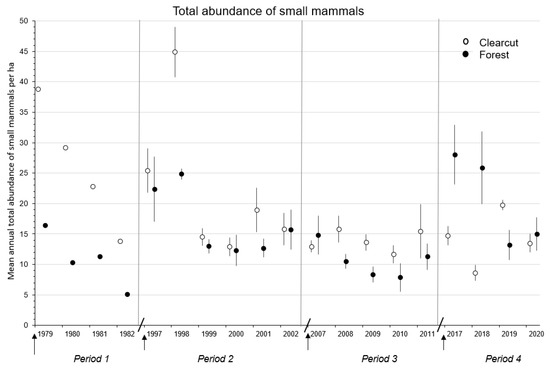
Figure 1.
Mean (n = 1, 3, or 4 replicate sites) ± SE total annual abundance of forest-floor small mammals in the first four to six complete years in clearcut and uncut forest sites during the Periods 1979–1982, 1997–2002, 2007–2011, and 2017–2020 for the CC-FOR study in southern British Columbia, Canada. Arrow indicates time of harvesting on clearcut sites. Diagonal line separates Periods.
Mean annual species richness of the small mammal communities was significantly (F3,7 = 16.35; p < 0.01) different across Periods 1 to 4 of cumulative forest harvesting with the number of species being highest (DMRT; p = 0.05) overall in Period 2, followed by Periods 3 and then 4 (Table 2 and Figure 2). In terms of overall mean species richness, Periods 1 (2.72) and 4 (2.63) were similar. Again, there were significant (p ≤ 0.03) effects of time and treatment × time interaction across the three Periods, whereby richness generally declined with post-harvest year (Table 2).
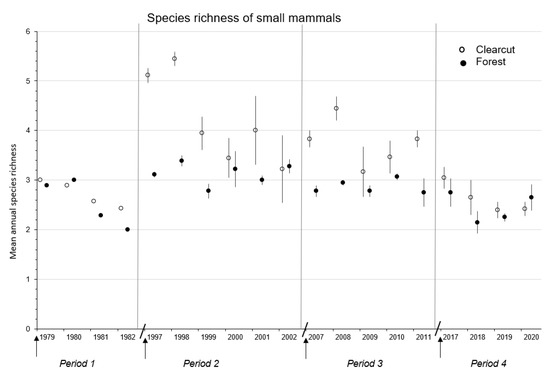
Figure 2.
Mean (n = 1, 3, or 4 replicate sites) ± SE annual species richness of forest-floor small mammals in the first four to six complete years in clearcut and uncut forest sites during the Periods 1979–1982, 1997–2002, 2007–2011, and 2017–2020 for the CC-FOR study in southern British Columbia, Canada. Arrow indicates time of harvesting on clearcut sites. Diagonal line separates Periods.
Mean annual species diversity of the small mammal communities was significantly (F3,7 = 10.18; p < 0.01) different across Periods 1 to 4 of cumulative forest harvesting with diversity being highest (DMRT; p = 0.05) overall in Periods 2 and 3 (Table 2 and Figure 3). Overall mean diversity was 1.7 to 2.4 times higher in Periods 2 and 3 than in 1 and 4. Again, a significant (p < 0.01) time effect reflected the general decline in diversity with post-harvest year.

Figure 3.
Mean (n = 1, 3, or 4 replicate sites) ± SE annual species diversity of forest-floor small mammals in the first four to six complete years in clearcut and uncut forest sites during the Periods 1979–1982, 1997–2002, 2007–2011, and 2017–2020 for the CC-FOR study in southern British Columbia, Canada. Arrow indicates time of harvesting on clearcut sites. Diagonal line separates Periods.
3.3. Small Mammals in Clearcut vs. Forest
In the CC-FOR study, mean total abundance of small mammals was similar between clearcut and forest sites during Periods 2 to 4 (p ≥ 0.07), however, mean numbers were 2.0 to 2.8 times higher in clearcut than forest sites in Period 1 (Table 3 and Table 4 and Figure 1). Mean total abundance increased to a high of 45 animals per ha in the clearcut sites in 1998 before declining through time, thereby resulting in the significant (p < 0.01) time and treatment × time interactions (Figure 1). The significant (p < 0.01) treatment × time interaction in Period 4 reflected the high numbers of total animals in the forest sites in 2017 and 2018 (Table 4 and Figure 1).
Table 3.
Mean (n = 1 replicate site) ± SE abundance, species richness, and species diversity per trapping period for forest-floor small mammals in forest and clearcut sites during Period 1 (1979 to 1982) for the CC-FOR study in southern BC, Canada. Number of trapping periods each year in parentheses.
Table 4.
Overall mean (n = 3 × 6; 3 × 5; 4 × 4; sites × years) ± SE annual total abundance, species richness, and species diversity of forest-floor small mammals in clearcut-harvested and forest sites for the CC-FOR study in southern BC, Canada 1997 to 2020, and results of RM-ANOVA for Periods 2, 3, and 4. Within a row, columns of mean values with different letters are significantly different. F-values identified by * were calculated using an H-F correction factor, which decreased the stated degrees of freedom due to correlation among repeated measures. Significant values are given in bold text.
Mean annual species richness was significantly (p ≤ 0.04) higher in clearcut than forest sites in Periods 2 and 3 but similar between treatment sites in Periods 1 and 4 (Table 3 and Table 4 and Figure 2). There were significant (p < 0.01) effects of time and treatment × time interaction in Period 2 with a univariate ANOVA detecting significantly (p ≤ 0.03) higher species richness in clearcut than forest sites in 1997 to 1999 (Figure 2). Mean annual numbers of species was >5.0 in clearcut sites in 1997 and 1998, the highest recorded levels over the 42-year study period. A similar pattern was observed in clearcut sites in 2007, 2008, and 2011 in Period 3 with species richness above or near 4.0 (Figure 2).
Mean annual species diversity was significantly (p = 0.05) higher in clearcut than forest sites in Period 3 but was similar between treatment sites in Periods 2 and 4 (Table 4 and Figure 3). Again, the highest diversity measurements (at or near 1.80) were recorded in 1997, 1998, 2007, and 2008 (Figure 3). The significant (p = 0.02) treatment × time interaction in Period 2 was related to the dramatic difference between clearcut and forest sites in the first two years. The significant (p < 0.01) effects of time and treatment × time interaction in Period 4 were related to the decline in diversity of small mammals in the clearcut sites in 2017 to 2019 and forest sites in 2017 to 2018 followed by an increase in both sites up to 2020 (Table 4 and Figure 3). Mean species diversity measurements of small mammals were at similar levels in Periods 1 and 4 (Figure 3) but were 1.2 to 2.3 times higher in the forest than clearcut sites in Period 1 (Table 3).
3.4. Composition of Small Mammal Communities in Clearcut vs. Forest
The relative abundance of the most common species, P. maniculatus, was >60% in Period 1 and near 75% in Period 4 in clearcut sites but was approximately 40% in the two intervening Periods (Figure 4 and Figure 5). In forest sites relative abundance of deer mice declined to 20% in Period 4 after ranging from 25% to 40% in the earlier Periods. Relative abundance of the other common species, the red-backed vole, was <5% in clearcut sites throughout the four Periods but was comparable to, or higher than, the deer mouse in forest sites in Periods 1 to 3 ranging from 40% to 56% (Figure 4 and Figure 5). In Period 4, C. gapperi made up 76% of the forest small mammal community. M. longicaudus was most abundant in Period 1 with relative measures of 32% in clearcut sites and 14% in forest sites but declined over time to <3% in Period 4 in clearcuts and disappeared completely in forest sites (Figure 4 and Figure 5). M. pennsylvanicus was relatively uncommon throughout the overall 42-year period except in Period 2 at 17% relative abundance in clearcut sites. However, similar to M. longicaudus, this vole all but disappeared in Periods 3 and 4, despite the presence of early seral vegetation post-clearcutting. The generalist N. amoenus was rare in Period 1 but increased through time to a relative abundance of 30% in clearcut sites and 12% in forest sites in Period 3 (Figure 4 and Figure 5). There were four uncommon species that appeared infrequently throughout the 42-year period: P. intermedius, S. monticolus, S. cinereus, and Z. princeps. The short-tailed and long-tailed weasel were also relatively rare.
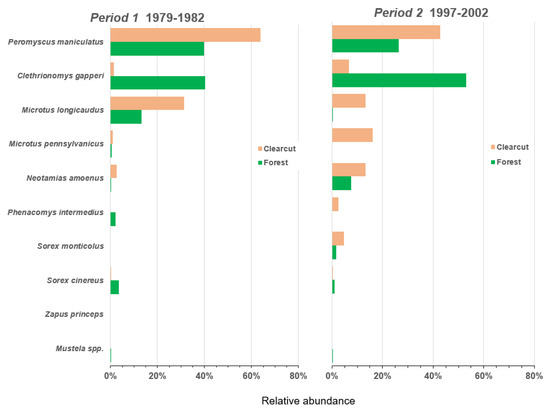
Figure 4.
Relative abundance of nine species in the small mammal community in Periods 1 to 2 (1979–1982 and 1997–2002) in clearcut and forest sites for the CC-FOR study in southern British Columbia, Canada.
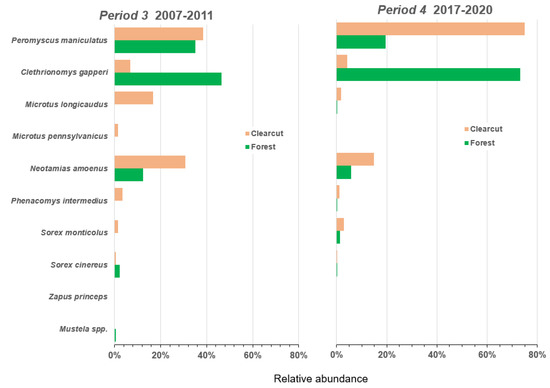
Figure 5.
Relative abundance of nine species in the small mammal community in Periods 3 to 4 (2007–2011 and 2017–2020) in clearcut and forest sites for the CC-FOR study in southern British Columbia, Canada.
3.5. Early Seral Vegetation in Grazed and Ungrazed Sites
In the CC-GR study, mean cover and abundance of herbaceous vegetation were similar (p = 0.57) between grazed and ungrazed sites for the years 3 to 5 after clearcutting in comparable Periods at Summerland and Golden (Table 5). Pine grass and fireweed were the dominant herbs at both areas. However, mean cover (F1,4 = 36.80; p < 0.01) and abundance (F1,4 = 18.40; p < 0.01) of shrubs were significantly higher (4.4 to 7.7 times) in ungrazed than grazed sites during this period (Table 5). Red raspberry (Rubus idaeus), baldhip rose (Rosa gymnocarpa), willow (Salix spp.), soapberry (Shepherdia canadensis), snowberry (Symphoricarpus albus), and aspen were dominant shrubs in the ungrazed sites at Golden. Sitka alder (Alnus sinuata), Utah honeysuckle (Lonicera utahensis), birch-leaved spiraea (Betula spiraea), and several dwarf shrubs comprised the much lower abundance of shrubs in grazed sites at Summerland. There were no significant effects of time or treatment × time interactions for this analysis.
Table 5.
Overall mean (n = 3 × 2; 3 × 3; sites × years) ± SE cover (m2/0.01 ha) and abundance (m3/0.01 ha) of early seral vegetation (herb and shrub layers) in grazed and ungrazed clearcut sites for comparable years post-harvest for the CC-GR study in southern BC, Canada, and results of RM-ANOVA, and univariate ANOVA where applicable. F-values identified by * were calculated using an H-F correction factor, which decreased the stated degrees of freedom due to correlation among repeated measures. Significant values are given in bold text.
In years 1 to 3 after clearcutting in the next comparable Periods at Summerland and Golden, mean cover and abundance of herbs were again similar (p ≥ 0.42) between grazed and ungrazed sites. Pine grass was the dominant herbaceous species followed by aster (Aster spp.), heart-leaved arnica, and white-flowered hawkweed (Hieracium albiflorum) in the grazed sites at Summerland. Fireweed dominated the herb layer along with similar species as Summerland in the ungrazed sites at Golden; however, pine grass was minimal. In both treatment sites herb abundance increased significantly (p < 0.01) with time (Table 5). Mean cover (F1,4 = 19.77; p = 0.01) and abundance (F1,4 = 16.21; p = 0.02) of shrubs were again significantly higher (4.3 to 4.9 times) in ungrazed than grazed sites during this period. Utah honeysuckle, birch-leaved spiraea, and several dwarf shrubs were common in grazed sites whereas red raspberry, thimbleberry (Rubus parviflorus), and birch-leaved spiraea dominated the shrub layer in the ungrazed sites. There were significant (p < 0.01) effects of time and treatment × time interaction with mean shrub abundance increasing over the three years (Table 5). Mean shrub abundance measurements were similar (p ≥ 0.08) in year 1, but then significantly (p ≤ 0.04) higher in ungrazed than grazed sites in years 2 and 3 as indicated by an univariate ANOVA.
3.6. Small Mammals in Grazed and Ungrazed Sites
Mean total abundance of small mammals was significantly (p ≤ 0.05) higher (1.5 to 3.5 times) in ungrazed than grazed sites during Periods 2 to 4 (Table 6 and Figure 6). Mean total abundance increased dramatically in ungrazed sites in the third to fourth years in Period 2 and second to third years in Period 3 before declining to lower numbers resulting in the significant (p ≤ 0.04) time and treatment × time interactions (Table 6 and Figure 6). A univariate ANOVA detected significantly (p ≤ 0.04) higher total abundance in ungrazed than grazed sites in the third year (Period 2) and second and fourth years (Period 3) (Figure 6). Mean total abundance of small mammals was consistently higher in ungrazed than grazed sites in Periods 3 and 4 (Figure 6).
Table 6.
Overall mean (n = 3 × 6; 3 × 5; 3 or 4 × 4; sites × years) ± SE annual total abundance, species richness, and species diversity of forest-floor small mammals in grazed (Summerland) and ungrazed (Golden) clearcut sites for comparable years post-harvest for the CC-GR study in southern BC, Canada 1997 to 2020, and results of RM-ANOVA for Periods 2, 3, and 4. Within a row, columns of mean values with different letters are significantly different. F-values identified by * were calculated using an H-F correction factor, which decreased the stated degrees of freedom due to correlation among repeated measures. Significant values are given in bold text.
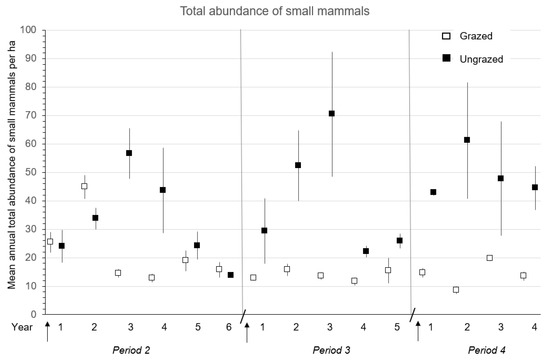
Figure 6.
Mean (n = 1, 3, or 4 replicate sites) ± SE total annual abundance of forest-floor small mammals in the first four to six complete years in grazed and ungrazed sites after clearcut harvesting during the three Periods: 2 (1997–2002 and 2004–2009), 3 (2007–2011 and 2012–2016), and 4 (2017–2020 and 2016–2019) for the CC-GR study in southern British Columbia, Canada. Arrow indicates time of harvesting on clearcut sites. Diagonal line separates Periods.
Mean annual species richness was similar (p ≥ 0.13) in grazed and ungrazed sites in all Periods (Table 6). There were significant time (all Periods) and treatment × time (Periods 2 and 4) effects with a general decline in richness in grazed sites and an increase in ungrazed sites (Table 6). Mean annual species diversity was similar (p ≥ 0.48) in grazed and ungrazed sites in Periods 2 and 4 and significantly (F1,4 = 35.77; p < 0.01) higher in grazed than ungrazed sites in Period 3. A significant (p < 0.01) treatment × time interaction in Period 4 was related to a decline in diversity in the grazed sites and an increase in the ungrazed sites (Table 6).
4. Discussion
4.1. Small Mammals and Cumulative Clearcutting
The significant decline in mean total numbers of small mammals on new clearcuts in Periods 3 and 4 did not support the abundance prediction of H1 that abundance, species richness, and diversity would increase on new clearcuts owing to availability of early seral post-harvest habitats from cumulative clearcutting. A likely explanation for the decline in all three metrics was the major decline in mean numbers of M. longicaudus to ≤2.0 voles/ha in these two Periods [66]). M. longicaudus seems to have discordant fluctuations in abundance, without any long-term pattern, that are often triggered by forest management activities such as clearcutting and the subsequent flush of early seral vegetation 2- to 3-years post-harvest (e.g., Periods 1 and 2 in [66]. There was also the almost complete disappearance of M. pennsylvanicus despite the presence of early seral vegetation, particularly grasses, during Periods 3 and 4. For both microtines, the influence of prolonged cattle grazing on new clearcuts may be crucial after they were relatively more abundant in Periods 1 and 2 than in Periods 3 and 4 (see Section 4.4).
The two generalist species: P. maniculatus and N. amoenus, contributed to the significantly higher mean species richness in Period 2, than other Periods, where along with the two vole species, richness reached >5.0. As noted by [67,68], P. maniculatus tends to be widespread among the various early successional habitats associated with post-clearcut landscapes. Similarly, N. amoenus also occupies a wide range of early successional habitats [26,69]. Both species take advantage of increased vegetation cover and food on clearcuts, including seeds, fruits, and mast of various tree and plant species, invertebrates, and fungi [17,24,28]. The high mean species diversity in Periods 2 and 3 on new clearcut sites reflected the presence of all five major species in relatively similar abundances plus the presence of the less common species P. intermedius and S. monticolus. Both generalist species were at relatively high abundance in Period 4 thereby dominating the composition of the small mammal community and contributing to lower evenness, and hence diversity, in this Period. Similarly, the community on new clearcut sites in Period 1 was dominated by P. maniculatus and M. longicaudus resulting in the lowest overall mean (±SE) diversity (0.68 ± 0.10) of all Periods. Thus, the species richness and diversity predictions of H1 were supported for both measurements at least in Periods 2 and 3.
4.2. Small Mammals in Clearcut vs. Forest
The similarity in mean total numbers of small mammals between clearcut and forest sites in Periods 2 to 4 did not support the abundance prediction of H2 that abundance, species richness, and diversity would be higher in clearcut than uncut forest sites owing to availability of vegetative food and cover. The higher overall mean abundance in clearcut than forest sites in Period 1 was supportive but based on just one replicate. Nevertheless, the high numbers of small mammals in clearcut sites in the early post-harvest years in Periods 1 and 2, but not later, did suggest that vegetative food and cover may have been less on clearcuts in the later Periods. The higher or comparable overall mean numbers of small mammals in forest than clearcut sites in 1997–1998 and 2017–2018 was owing to peak years in abundance of C. gapperi which has a well-defined 7- to 8-year population fluctuation [70]. Contrary to these abundance results, the higher mean species richness (Periods 2 and 3) and diversity (Period 3) measurements on clearcut than forest sites, particularly in the early post-harvest years, did support these parts of H2. Indeed, high relative numbers of C. gapperi in forest sites in the early years of Periods 2 and 4 suppressed evenness and hence species diversity
Most studies in North America have concluded that deer mice are more abundant (2 to 10 times) on clearcut areas than in intact forest habitat, in at least some years, and peak densities typically occur 2–5 years post-harvest [27,29,71,72]. In general, common species of small mammals usually increased in abundance, or were not affected, by clearcutting of temperate and boreal forests in Europe [10]. Eurasian ecological counterparts to P. maniculatus, Microtus and Clethrionomys spp. such as the wood mouse (Apodemus sylvaticus), field vole (M. agrestis), and common vole (M. arvalis), respectively, increased on clearcuts whereas the bank vole (C. glareolus) showed no response and the gray-sided vole (C. rufocanus) declined in abundance similar to C. gapperi [10,26,73]. Declines in Clethrionomys may be related to the damping out or collapsing of microtine population cycles over at least the last three decades, particularly in northern and central Europe [74,75]. Fragmentation of source habitats [76,77] and climate change [78] have been advanced as possible explanations and may be particularly relevant to the disappearance of C. gapperi and C. rufocanus on clearcuts, although see [79]. C. rufocanus seems to require large patches (≥79 ha) of high-quality mature or old-growth coniferous forest [77], whereas C. gapperi has been maintained in late successional forest patches of 0.3 to 20 ha, at least for a 3-year period post-clearcutting [80].
4.3. Early Seral Vegetation in Grazed and Ungrazed Sites
The vegetation part (i) of H3 that mean abundance of herbs and shrubs would be higher in ungrazed than grazed clearcut sites was not supported for herbaceous plants but it was supported for shrubs. These results were similar in the first comparable Period within the two MS ecological subzones, but also in different MS and ICH subzones in the second comparable Period, between Summerland and Golden. This pattern suggested that cattle appeared to consume shrubs as well as grasses and forbs in the grazed sites at Summerland. Although cattle feed primarily on forbs and grasses, they also will consume shrubs as browse items during certain seasons [81,82], with ranges of 50–72% grass, 23–42% forbs, and 4–20% shrubs. In recent clearcuts, cattle feed on pine grass through June but by mid-August consumption declines [83]. As pine grass matures, crude protein levels may decline to levels below minimums required for active growth of calves (12%) and for lactating cows (8.3%) [84]. It is during the late summer and fall that cattle may consume shrubs and trees such as willow, spiraea, Rosa spp., snowberry, Sitka alder, and aspen [81]. Further evidence for cattle consumption of shrubs was reported over a 10-year period where overall mean abundance of shrubs was 1.3 to 2.0 times higher in ungrazed (i.e., within an exclosure) than grazed sites [85].
4.4. Small Mammals in Grazed and Ungrazed sites
The small mammal part (ii) of H3 that populations would be higher in ungrazed than grazed clearcut sites was supported for abundance but not for species richness or diversity. In addition, the abundance results also tended to support H1, and potentially H2, at least for ungrazed sites. In other studies, livestock disturbance appeared to have a consistently significant negative impact on small mammal abundance [86,87,88] and species richness or diversity [89,90,91]. Some variable results based on scale of habitat measurements and generalist vs. specialist species of small mammals were also reported [92,93]. In all cases, reductions in plant community abundance, composition, and structure following livestock grazing were the major factors influencing small mammal communities. Alternatively, Ref. [94] reported no effect of grazing on mean overall abundance or species diversity of the total small mammal community in young (13–23 years) stands of lodgepole pine.
However, reductions in these vegetative parameters from livestock grazing have negatively influenced Microtus voles in several geographic areas of North America, the United Kingdom, and northern Europe [87,88,95,96,97] or shown variable results [98]. Thus, it is not surprising that populations in our ungrazed sites were dominated by M. longicaudus and secondarily by M. pennsylvanicus and P. maniculatus in all three Periods. M. longicaudus in the grazed sites was dominant in the first two post-harvest years in Period 2 only [66]. Thus, damping of Microtus population fluctuations and potentially predator communities as well may be linked to livestock grazing, at least in early successional forest sites. A major predator of voles, the short-tailed weasel (Mustela erminea) was reported at lower abundance in grazed vs. ungrazed sites [94] and other predators followed this pattern in other studies [99,100].
4.5. Study Limitations
Harvested sites and stands were the size of conventional forestry operations in the southern interior of BC and in similar regions of the Pacific Northwest. Continuous sampling of all sites beyond 4 to 6 years post-harvest in each Period and study may have identified the presence of additional changes in the small mammal communities. Measurements of abundance, species richness, and diversity reflect May to October months only and may not have been the same during other seasons of the year. The relatively low number (9) of small mammal species suggested that species richness and diversity measurements might have been less robust than desired and that these results might simply reflect the species level abundance patterns. Additional replicates in Period 1 would have provided precision for our measurements and allowed direct comparisons of results with the other Periods. Ideally, addition of ungrazed clearcut sites at Summerland and grazed clearcut sites and uncut forest sites at Golden would have balanced the study designs but were not available.
Unfortunately, we had no measurements of abundance of herbaceous and shrub vegetation in Periods 1 or 4 for the grazed and ungrazed conditions on clearcuts at Summerland and Golden, respectively. In addition, there are three caveats regarding the vegetation and small mammal responses in the CC-GR study. Firstly, the vegetation measurements in the grazed sites at Summerland represented different sets of years: Period 2 (1999 and 2001) and 3 (2007–2009) whereas at Golden the ungrazed sites represented Period 2 (2006 and 2008) and 3 (2012–2014). Similarly, the small mammal measurements also covered different sets of years in the three Periods: 2 (1997–2002), 3 (2007–2011), and 4 (2017–2020) at Summerland; and 2 (2004–2009), 3 (2012–2016), and 4 (2016–2019) at Golden. Secondly, comparisons in Period 2 were from similar ecosystems (MSdm and MSdk) whereas those in Periods 3 and 4 were from quite different ecosystems (MSdm and ICHmk). However, in terms of responses of vegetation in Periods 2 and 3, mean abundance and cover of herbs were similar between grazed and ungrazed sites, whereas these two metrics for shrubs were higher in ungrazed than grazed sites. Thirdly, the Golden study area was located in a similar commercial forest landscape but with some larger expanses of unbroken forest (100 s to 1000 s of ha) than at Summerland. An important further note is that both areas had the same species composition of small mammal communities.
5. Conclusions
Over the 42-year period, cumulative clearcutting of the original forest resulted in creation of early successional habitat that ranged from 0% of the landscape in 1977 (pre-clearcutting) to ≥70% in 2020. Overall mean annual abundance of forest-floor small mammals declined despite the availability of early post-seral habitats and much of this decline was owing to loss of M. longicaudus and M. pennsylvanicus, thereby not supporting H1. The deer mouse and northwestern chipmunk contributed to high mean species richness and diversity in Periods 2 and 3 before these metrics declined in Period 4, and hence partly supported H1. Except for Period 1, numbers of small mammals were often similar in clearcut and forest sites, thereby not supporting H2. However, species richness and diversity remained relatively high on clearcut sites in Periods 2 and 3, particularly in the first two years after cutting, before declining to forest levels in Period 4, and hence partly supported H2.
Cattle grazing seemed to have a significant negative effect on overall mean abundance of small mammals in all three comparableyes Periods, and hence supported the small mammal part of H3. However, this difference was apparently not related to cattle consumption of herbaceous vegetation but was possibly related to the lower abundance of shrubs in grazed than ungrazed sites. Thus, the vegetation part of H3 was supported for shrubs but not herbs. The decline and near disappearance of both species of Microtus was possibly related to the reduction in plant community abundance and structure from grazing (at least for shrubs) and potentially from drought effects associated with climate change. Loss of microtines from these early seral ecosystems may have profound negative effects on various ecological functions and predator communities.
Author Contributions
Conceptualization, T.P.S. and D.S.S.; methodology, T.P.S.; formal analysis, T.P.S.; investigation, T.P.S. and D.S.S.; resources, T.P.S.; writing, original draft, T.P.S. and D.S.S., review and editing, D.S.S. All authors have read and agreed to the published version of the manuscript.
Funding
This research was funded by the Natural Sciences and Engineering Research Council of Canada, Resources Practices Branch, BC Ministry of Forests, Lands, Natural Resource Operations and Rural Development (MoFLNRORD), Victoria, BC, the BC Habitat Conservation Trust Foundation, Forest Enhancement Society of BC, Research and Silviculture Branches, BC Ministry of Forests (MoF), Victoria, BC, the Canada-BC Partnership Agreement on Forest Resource Development (FRDA II), Forest Renewal BC through the BC Science Council, the Okanagan Innovative Forestry Society (Innovative Forest Practices Association), Gorman Bros. Lumber Ltd., and the Applied Mammal Research Institute.
Institutional Review Board Statement
Not applicable.
Informed Consent Statement
Not applicable.
Data Availability Statement
Not applicable.
Acknowledgments
We thank H. Sullivan and others for assistance with fieldwork.
Conflicts of Interest
The authors declare no conflict of interest. The funders had no role in the design of the study; in the collection, analyses, or interpretation of data; in the writing of the manuscript, or in the decision to publish the results.
References
- Mitchell, S.J. Wind as a natural disturbance agent in forests—A synthesis. Forestry 2013, 86, 147–157. [Google Scholar] [CrossRef]
- Allen, C.D.; Breshears, D.D.; McDowell, N.G. On underestimation of global vulnerability to tree mortality and forest die-off from hotter drought in the Anthropocene. Ecosphere 2015, 6, 129. [Google Scholar] [CrossRef]
- Cooke, B.J.; Carroll, A.L. Predicting the risk of mountain pine beetle spread to eastern pine forests: Considering uncertainty in uncertain times. For. Ecol. Manag. 2017, 396, 11–25. [Google Scholar] [CrossRef]
- Pritchard, S.J.; Stevens-Rumann, C.S.; Hessburg, P.F. Tamm Review: Shifting global fire regimes: Lessons from reburns and research needs. For. Ecol. Manag. 2017, 398, 217–233. [Google Scholar] [CrossRef]
- Lindenmayer, D.B.; Burton, P.J.; Franklin, J.F. Salvage Logging and its Ecological Consequences; Island Press: Washington, DC, USA, 2008. [Google Scholar]
- Keenan, R.J.; Kimmins, J.P. The ecological effects of clearcutting. Environ. Rev. 1993, 1, 121–144. [Google Scholar] [CrossRef]
- Rosenvald, R.; Lõhmus, A. For what, when, and where is green-tree retention better than clearcutting? A review of biodiversity aspects. For. Ecol. Manag. 2008, 255, 1–15. [Google Scholar] [CrossRef]
- Kuuluvainen, T. Forest management and biodiversity conservation based on natural ecosystem dynamics in northern Europe: The complexity challenge. Ambio 2009, 38, 309–315. [Google Scholar] [CrossRef]
- Fisher, J.T.; Wilkinson, L. The response of mammals to forest fire and timber harvest in the North American boreal forest. Mam. Rev. 2005, 35, 51–81. [Google Scholar] [CrossRef]
- Bogdziewicz, M.; Zwolak, R. Responses of small mammals to clearcutting in temperate and boreal forests of Europe: A meta-analysis and review. Eur. J. Forest Res. 2014, 133, 1–11. [Google Scholar] [CrossRef]
- Carey, A.B.; Harrington, C.A. Small mammals in young forests: Implications for management for sustainability. For. Ecol. Manag. 2001, 154, 289–309. [Google Scholar] [CrossRef]
- Ecke, F.; Lofgren, O.; Hornfeldt, B.; Ekland, U.; Ericsson, P.; Sorlin, D. Abundance and diversity of small mammals in relation to structural habitat factors. Ecol. Bull. 2001, 49, 165–171. [Google Scholar]
- Ecke, F.; Lofgren, O.; Sorlin, D. Population dynamics of small mammals in relation to forest age and structural habitat factors in northern Sweden. J. Appl. Ecol. 2002, 39, 781–792. [Google Scholar] [CrossRef]
- Pearce, J.; Venier, L. Small mammals as bioindicators of sustainable boreal forest management. For. Ecol. Manag. 2005, 208, 153–175. [Google Scholar] [CrossRef]
- Martin, S.K. Feeding ecology of American martens and fishers. In Martens, Sables, and Fishers: Biology and Conservation; Buskirk, S., Harestad, A.S., Raphael, M.G., Powell, A., Eds.; Comstock Publishing Associates, Cornell University Press: Ithaca, NY, USA, 1994; pp. 297–315. [Google Scholar]
- Jędrzejewska, B.; Jędrzejewski, W. Predation in Vertebrate Communities: The Bialowieźa Primeval Forest as a Case Study; Springer: Berlin/Heidelberg, Germany, 1998. [Google Scholar]
- Lobo, N.; Duong, M.; Millar, J.S. Conifer-seed preferences of small mammals. Can. J. Zool. 2009, 87, 773–780. [Google Scholar] [CrossRef]
- Zwolak, R.; Pearson, D.E.; Ortega, Y.K.; Crone, E.E. Fire and mice: Seed predation moderates fire’s influence on conifer recruitment. Ecology 2010, 91, 1124–1131. [Google Scholar] [CrossRef]
- Jacob, J.; Tkadlec, E. Rodent outbreaks in Europe: Dynamics and damage. In Rodent Outbreaks: Ecology and Impacts; Singleton, G.R., Belman, S.R., Brown, P.R., Hardy, B., Eds.; IRRI: Los Banos, Philippines, 2010; pp. 207–223. [Google Scholar]
- Ostfeld, R.S.; Manson, R.H.; Canham, C.D. Effects of rodents on survival of tree seeds and seedlings invading old fields. Ecology 1997, 78, 1531–1542. [Google Scholar] [CrossRef]
- Carey, A.B.; Kershner, J.; Biswell, B.; DeToledo, L.D. Ecological scale and forest development: Squirrels, dietary fungi, and vascular plants in managed and unmanaged forests. In Wildlife Monographs; The Wildlife Society: Bethesda, MD, USA, 1999; pp. 3–71. [Google Scholar]
- Bellocq, M.I.; Smith, S.M. Arthropods preferred as food by Sorex cinereus (masked shrew) and Peromyscus maniculatus (deer mouse): An experimental approach. Mammalia 1994, 53, 391–396. [Google Scholar] [CrossRef]
- Churchfield, S.; Rychlik, L. Diets and coexistence in Neomys and Sorex shrews in Bialowieźa forest, Eastern Poland. J. Zool. 2006, 269, 381–390. [Google Scholar] [CrossRef]
- Maser, C.; Claridge, A.W.; Trappe, J.M. Trees, Truffles, and Beasts: How Forests Function; Rutgers University Press: Piscataway, NJ, USA, 2008. [Google Scholar]
- Schickmann, S.; Urban, A.; Krautler, K.; Nopp-Mayr, U.; Hacklander, K. The interrelationship of mycophagous small mammals to ectomycorrhizal fungi in primeval, disturbed, and managed Central European mountainous forests. Oecologia 2012, 170, 395–409. [Google Scholar] [CrossRef]
- Zwolak, R. A meta-analysis of the effects of wildfire, clearcutting, and partial harvest on the abundance of North American small mammals. For. Ecol. Manag. 2009, 258, 539–545. [Google Scholar] [CrossRef]
- Hooven, E.F.; Black, H.C. Effects of some clear-cutting practices on small mammal populations in western Oregon. Northwest Sci. 1976, 50, 189–208. [Google Scholar]
- Gagne, N.; Belanger, L.; Huot, J. Comparative responses of small mammals, vegetation, and food sources to natural regeneration and conifer seed release treatments in boreal balsam fir stands in Quebec. Can. J. For. Res. 1999, 29, 1128–1140. [Google Scholar] [CrossRef]
- Martell, A.M. Demography of southern red-backed voles (Clethrionomys gapperi) and deer mice (Peromyscus maniculatus) after logging in north-central Ontario. Can. J. Zool. 1983, 61, 958–969. [Google Scholar] [CrossRef]
- Fuller, A.K.; Harrison, D.J.; Lachowski, H.J. Stand scale effects of partial harvesting and clearcutting on small mammals and forest structure. For. Ecol. Manag. 2004, 191, 373–386. [Google Scholar] [CrossRef]
- Merritt, J.F. Clethrionomys gapperi. Mammalian Species; American Society of Mammalogists: Provo, UT, USA, 1981. [Google Scholar]
- St-Laurent, M.-H.; Ferron, J.; Hache, S.; Gagnon, R. Planning timber harvest of residual forest stands without compromising bird and small mammal communities in boreal landscapes. For. Ecol. Manag. 2008, 254, 261–275. [Google Scholar] [CrossRef]
- Sullivan, T.P.; Sullivan, D.S.; Lindgren, P.M.F.; Ransome, D.B. Green-tree retention and life after the beetle: Stand structure and small mammals 30 years after salvage harvesting. Silva Fenn. 2010, 44, 749–774. [Google Scholar] [CrossRef]
- Hughes, B.B.; Beas-Luna, R.; Barner, A.K.; Brewitt, K.; Brumbaugh, D.R.; Cerny-Chipman, E.B.; Close, S.L.; Coblentz, K.E.; De Nesnera, K.L.; Drobnitch, S.T.; et al. Long-term studies contribute disproportionately to ecology and policy. Bioscience 2017, 67, 271–281. [Google Scholar] [CrossRef]
- Carpenter, S.R. Ecological futures: Building an ecology of the long now. Ecology 2002, 83, 2069–2083. [Google Scholar] [CrossRef]
- Holling, C.S. Adaptive Environmental Assessment and Management; John Wiley and Sons: Hoboken, NJ, USA, 1978. [Google Scholar]
- Lindenmayer, D.B.; Margules, C.R.; Botkin, D.B. Indicators of biodiversity for ecologically sustainable forest management. Cons. Biol. 2000, 14, 941–950. [Google Scholar] [CrossRef]
- Nichols, J.D.; Williams, B.K. Monitoring for conservation. Trends Ecol. Evol. 2006, 21, 668–673. [Google Scholar] [CrossRef]
- Sergeant, C.J.; Moynhan, B.J.; Johnson, W.F. Practical advice for implementing long-term ecosystem monitoring. J. Appl. Ecol. 2012, 49, 969–973. [Google Scholar] [CrossRef]
- Krebs, C.J.; Boonstra, R.; Kenney, A.J.; Gilbert, B.S. Hares and small rodent cycles: A 45-year perspective on predator-prey dynamics in the Yukon boreal forest. Aust. Zool. 2018, 39, 724–732. [Google Scholar] [CrossRef]
- Krebs, C.J.; Boonstra, R.; Gilbert, B.S.; Kenney, A.J.; Boutin, S. Impact of climate change on the small mammal community of the Yukon boreal forest. Integr. Zool. 2019, 14, 528–541. [Google Scholar] [CrossRef] [PubMed]
- Wikeem, B.M.; McLean, A.; Bawtree, A.; Quinton, D. An overview of the forage resource and beef production on Crown land in British Columbia. Can. J. Anim. Sci. 1993, 73, 779–794. [Google Scholar] [CrossRef]
- IPPC. IPCC Fifth Assessment Report: Climate Change 2013: The Physical Science Basis. 2014, Contribution of Working Group I to the Fifth Assessment Report of the Intergovernmental Panel on Climate Change; Cambridge University Press: Cambridge, UK, 2013. [Google Scholar] [CrossRef]
- Meidinger, D.; Pojar, J. Ecosystems of British Columbia; Special Report Series No 6; Research Branch Ministry of Forests: Victoria, BC, Canada, 1991. [Google Scholar]
- Dobb, A.; Burton, S. Rangeland Seeding Manual for British Columbia; BC Ministry of Agriculture, Sustainable Agriculture and Management Branch: Abbotsford, BC, Canada, 2013. [Google Scholar]
- Hurlbert, S.H. Pseudoreplication and the design of ecological field experiments. Ecol. Monogr. 1984, 54, 187–211. [Google Scholar] [CrossRef]
- Sullivan, T.P.; Sullivan, D.S. Forecasting vole population outbreaks: The rise and fall of a major mammalian pest. For. Ecol. Manag. 2010, 260, 983–993. [Google Scholar] [CrossRef]
- Krebs, C.J.; Keller, B.L.; Tamarin, R.H. Microtus population biology: Demographic changes in fluctuating populations of M. ochrogaster and M. pennsylvanicus in southern Indiana. Ecology 1969, 50, 587–607. [Google Scholar] [CrossRef]
- Nagorsen, D.W. Opossums, shrews, and moles of British Columbia. In Volume 2. The Mammals of British Columbia; UBC Press: Vancouver, BC, Canada, 1996. [Google Scholar]
- Sikes, R.S.; Gannon, W.L.; the Animal Care and Use Committee of the American Society of Mammalogists. Guidelines of the American Society of Mammalogists for the use of wild mammals in research. J. Mammal. 2016, 92, 235–253. [Google Scholar] [CrossRef]
- Seber, G.A.F. The Estimation of Animal Abundance and Related Parameters, 2nd ed.; Charles Griffin and Co. Ltd.: London, UK, 1982. [Google Scholar]
- Krebs, C.J. Ecological Methodology; Addison Wesley Longman, Inc.: Boston, MA, USA, 1999. [Google Scholar]
- Krebs, C.J.; Boonstra, R.; Gilbert, S.; Reid, D.; Kenney, A.J.; Hofer, E.J. Density estimation for small mammals from livetrapping grids: Rodents in northern Canada. J. Mammal. 2011, 92, 974–981. [Google Scholar] [CrossRef]
- Sullivan, T.P.; Sullivan, D.S. Long-term demographic changes of deer mouse (Peromyscus maniculatus) populations in a forest landscape with cumulative clearcutting. For. Ecol. Manag. 2022, 517, 120255. [Google Scholar] [CrossRef]
- Sullivan, T.P.; Sullivan, D.S. Balancing pest management and forest biodiversity: Vole populations and habitat in clearcut vs. variable retention harvested sites. Crop Prot. 2011, 30, 833–843. [Google Scholar] [CrossRef]
- Krebs, C.J.; Boonstra, R. Trappability estimates for mark-recapture data. Can. J. Zool. 1984, 62, 2440–2444. [Google Scholar] [CrossRef]
- Burton, P.J.; Balisky, A.C.; Coward, L.P.; Cumming, S.G.; Kneeshaw, D.D. The value of managing for biodiversity. For. Chron. 1992, 68, 225–237. [Google Scholar] [CrossRef]
- Lindgren, P.M.F.; Sullivan, T.P. Influence of stand thinning and repeated fertilization on plant community abundance and diversity in young lodgepole pine stands: 15-year results. For. Ecol. Manag. 2013, 308, 17–30. [Google Scholar] [CrossRef]
- Parish, R.; Coupé, R.; Lloyd, D. Plants of Southern Interior British Columbia; Lone Pine Publishing: Vancouver, BC, Canada, 1996. [Google Scholar]
- IBM Corp. IBM SPSS Statistics for Windows; Version 28.0; IBM Corp: Armonk, NY, USA, 2021. [Google Scholar]
- Littel, R.C. Statistical analysis of experiments with repeated measures. Hortscience 1989, 24, 36–40. [Google Scholar]
- Kuehl, R.C. Statistical Principles of Research Design and Analysis; Duxbury Press: Belmont, CA, USA, 1994. [Google Scholar]
- Huynh, H.; Feldt, L.S. Estimation of the Box correction for degrees of freedom from sample data in the randomized block and split-plot designs. J. Educ. Stat. 1976, 1, 69–82. [Google Scholar] [CrossRef]
- Saville, D.J. Multiple comparison procedures: The practical solution. Am. Stat. 1990, 44, 174–180. [Google Scholar]
- Zar, J.H. Biostatistical Analysis; Prentice-Hall, Inc.: Englewood Cliffs, NJ, USA, 1999; p. 663. [Google Scholar]
- Sullivan, T.P.; Sullivan, D.S. Population fluctuations of long-tailed voles (Microtus longicaudus) in managed forests: Site-specific disturbances or a long-term pattern? J. Mammal. 2022, gyac073. [Google Scholar] [CrossRef]
- Gitzen, R.A.; West, S.D.; Maguire, C.C.; Manning, T.; Halpern, C.B. Response of terrestrial small mammals to varying amounts and patterns of green-tree retention in Pacific Northwest forests. For. Ecol. Manag. 2007, 251, 142–155. [Google Scholar] [CrossRef]
- Wilk, R.J.; Raphael, M.G.; Nations, C.S.; Ricklefs, J.D. Initial response of small ground-dwelling mammals to forest alternative buffers along headwater streams in the Washington Coast Range, USA. For. Ecol. Manag. 2010, 260, 1567–1578. [Google Scholar] [CrossRef]
- Sutton, D.A. Tamias amoenus. Mamm. Species 1992, 390, 1–8. [Google Scholar] [CrossRef]
- Sullivan, T.P.; Sullivan, D.S.; Boonstra, R.; Krebs, C.J.; Vyse, A. Mechanisms of population limitation in the southern red-backed vole in conifer forests of western North America: Insights from a long-term study. J. Mammal. 2017, 98, 1367–1378. [Google Scholar] [CrossRef]
- Gashwiler, J.S. Plant and mammal changes in a clearcut in west-central Oregon. Ecology 1970, 51, 1018–1026. [Google Scholar] [CrossRef]
- Kirkland, G.L. Patterns of initial small mammal community change after clearcutting of temperate North American forests. Oikos 1990, 59, 313–320. [Google Scholar] [CrossRef]
- Montgomery, W.I. Peromyscus and Apodemus: Patterns of similarity in ecological equivalents. In Advances in the Study of Peromyscus (Rodentia); Kirkland, G.L., Layne, J.N., Eds.; Texas Tech University Press: Lubbock, TX, USA, 1989; pp. 293–366. [Google Scholar]
- Cornulier, T.; Yoccoz, N.G.; Bretagnolle, V.; Brommer, J.E.; Butet, A.; Ecke, F.; Elston, D.A.; Framstad, E.; Henttonen, H.; Hörn-feldt, B.; et al. Europe-wide dampening of population cycles in keystone herbivores. Science 2013, 340, 63–66. [Google Scholar] [CrossRef]
- Gouveia, A.; Bejcek, V.; Flousek, J.; Sedlacek, F.; Stastnv, K.; Zima, J.; Yoccoz, N.G.; Stenseth, N.C.; Tkadlec, E. Long-term pattern of population dynamics in the field vole from central Europe: Cyclic pattern with amplitude dampening. Popul. Ecol. 2015, 57, 581–589. [Google Scholar] [CrossRef]
- Christensen, P.; Hornfeldt, B. Long-term decline of vole populations in northern Sweden: A test of the destructive sampling hypothesis. J. Mammal. 2003, 84, 1292–1299. [Google Scholar] [CrossRef]
- Ecke, F.; Christensen, P.; Rentz, R.; Nilsson, M.; Sandstrom, P.; Hornfeldt, B. Landscape structure and the long-term decline of cyclic grey-sided voles in Fennoscandia. Landsc. Ecol. 2010, 25, 551–560. [Google Scholar] [CrossRef]
- Ims, R.A.; Henden, J.-A.; Killengreen, S.T. Collapsing population cycles. Trends Ecol. Evol. 2008, 23, 79–86. [Google Scholar] [CrossRef]
- Brommer, J.E.; Pietiaeinen, H.A.; Ahola, K.; Karell, P.; Karstinen, T.; Kolunen, H. The return of the vole cycle in southern Finland refutes the generality of the loss of cycles through ‘climatic forcing’. Glob. Change Biol. 2010, 16, 577–586. [Google Scholar] [CrossRef]
- Sullivan, T.P.; Sullivan, D.S. Similarity in occupancy of different-sized forest patches by small mammals on clearcuts: Conservation implications for red-backed voles and small mustelids. Mam. Res. 2020, 65, 255–266. [Google Scholar] [CrossRef]
- McLean, A.; Willms, W. Cattle diets and distribution on spring-fall and summer ranges near Kamloops, British Columbia. Can. J. Anim. Sci. 1977, 57, 81–92. [Google Scholar] [CrossRef]
- Quinton, D.A. Cattle diets on seeded clearcut areas in central interior British Columbia. J. Range Manag. 1984, 37, 349–352. [Google Scholar] [CrossRef]
- McLean, A. Beef production on lodgepole pine-pinegrass range in southern British Columbia. J. Range Manag. 1967, 20, 214–216. [Google Scholar] [CrossRef]
- McLean, A.; Freyman, S.; Miltimore, J.E.; Bowden, D.M. Evaluation of pinegrass as a range forage. Can. J. Plant Sci. 1969, 49, 351–359. [Google Scholar] [CrossRef]
- Lindgren, P.M.F.; Sullivan, T.P. Response of plant community abundance and diversity during 10 years of cattle exclusion within silvopasture systems. Can. J. For. Res. 2012, 42, 451–462. [Google Scholar] [CrossRef]
- Grant, W.E.; Birney, E.C.; French, N.R.; Swift, D.M. Structure and productivity of grassland small mammal communities related to grazing-induced changes in vegetative cover. J. Mammal. 1982, 63, 248–260. [Google Scholar] [CrossRef]
- Chapman, E.W.; Ribic, C.A. The impact of buffer strips and stream-side grazing on small mammals in southwestern Wisconsin. Agric. Ecosyst. Environ. 2002, 88, 49–59. [Google Scholar] [CrossRef]
- Johnston, A.N.; Anthony, R.G. Small-mammal microhabitat associations and response to grazing in Oregon. J. Wildl. Manag. 2008, 72, 1736–1746. [Google Scholar] [CrossRef]
- Reynolds, T.D.; Trost, C.H. The response of native vertebrate populations to crested wheatgrass planting and grazing by sheep. J. Range Manag. 1980, 33, 122–125. [Google Scholar] [CrossRef]
- Medin, D.E.; Clary, W.P. Small Mammal Populations in a Grazed and Ungrazed Riparian Habitat in Nevada; US Department of Agriculture, Forest Service, Intermountain Research Station: Ogden, UT, USA, 1989. [Google Scholar]
- Giuliano, W.M.; Homyack, J.D. Effects of short-term grazing exclusion on riparian small mammal communities. J. Range Manag. 2004, 57, 346–350. [Google Scholar] [CrossRef]
- Schulz, T.T.; Leininger, W.C. Nongame wildlife communities in grazed and ungrazed montane riparian habitats. Great Basin Nat. 1991, 51, 286–292. [Google Scholar]
- Rosenstock, S.S. Shrub-grassland small mammal and vegetation responses to rest from grazing. J. Range Manag. 1996, 49, 199–203. [Google Scholar] [CrossRef]
- Sullivan, T.P.; Sullivan, D.S.; Lindgren, P.M.F. Influence of repeated fertilization and cattle grazing on forest ecosystems: Abundance and diversity of forest-floor small mammals. For. Ecol. Manag. 2012, 277, 180–195. [Google Scholar] [CrossRef]
- Evans, D.M.; Redpath, S.M.; Elston, D.A.; Evans, S.A.; Mitchell, R.J.; Dennis, P. To graze or not to graze? Sheep, voles, forestry and nature conservation in the British uplands. J. Appl. Ecol. 2006, 43, 499–505. [Google Scholar] [CrossRef]
- Sullivan, T.P.; Sullivan, D.S. Fertilization, cattle grazing, and voles: Collapse of vole population fluctuations in young forests? Wildl. Res. 2014, 41, 367–378. [Google Scholar] [CrossRef]
- Villar, N.; Cornulier, T.; Evans, D.; Pakeman, R.; Redpath, S.; Lambin, X. Experimental evidence that livestock grazing intensity affects cyclic vole population regulation processes. Popul. Ecol. 2014, 56, 55–61. [Google Scholar] [CrossRef]
- Saetnan, E.R.; Skarpe, C.; Batzli, G.O. Do sheep affect vole populations in alpine meadows of central Norway? J. Mammal. 2012, 93, 1283–1291. [Google Scholar] [CrossRef]
- Hipkiss, T.; Stefansson, O.; Hornfeldt, B. Effect of cyclic and declining food supply on great grey owls in boreal Sweden. Can. J. Zool. 2008, 86, 1426–1431. [Google Scholar] [CrossRef]
- Villar, N.; Lambin, X.; Evans, D.; Pakeman, R.; Redpath, S. Experimental evidence that livestock grazing intensity affects the activity of a generalist predator. Acta Oecologica 2013, 49, 12–16. [Google Scholar] [CrossRef][Green Version]


Publisher’s Note: MDPI stays neutral with regard to jurisdictional claims in published maps and institutional affiliations. |
© 2022 by the authors. Licensee MDPI, Basel, Switzerland. This article is an open access article distributed under the terms and conditions of the Creative Commons Attribution (CC BY) license (https://creativecommons.org/licenses/by/4.0/).