Abstract
There is a need for improved understanding of how climate-change driven rises in sea level and increased ocean temperatures will affect fish assemblages in rocky shore tidal pools. Rising sea levels are predicted to alter habitat availability and increasing ocean temperatures will drive tropicalisation, both of which are likely to alter tidal pool fish assemblages. Consequently, we examined changes in fish assemblages in tidal pools at four sites in Coffs Harbour, Australia, using baited video sampling. Data were collected seasonally at each site, in pools at differing tidal elevations. We identified significant differences in tidal pool fish assemblages among elevations and found that assemblages exhibited cyclic seasonal patterns. Modelling identified that ocean temperature was the most powerful factor for explaining variations in assemblages, followed by pool area and pool elevation. Results highlight that distinct fish assemblages occur in tidal pools at different elevations and indicate that assemblages at higher elevations could be squeezed out by rising sea levels and by increased competition from tropical fish species. Future conservation assessments are needed to determine whether latitudinal and vertical range shifts for tidal pool fishes are possible, with facilitation of these range shifts needed to address displacement of tidal pool fishes by rising sea levels and ocean temperatures.
1. Introduction
Intertidal species will be severely impacted by climate change, due to the combined effects of increasing air and water temperatures and rising sea levels. Increasing temperatures will drive poleward range shifts in species distributions [1,2], while rising sea levels will drive landward retreat for intertidal species, where coastal morphology allows this [3,4,5]. These factors will potentially lead to local extinctions where these poleward range shifts or landward retreats are not possible, or where range shifting species out-compete those already present. Consequently, there is a pressing need for improved understanding of how intertidal species will respond to climate-induced increases in water temperatures and sea levels.
Of particular concern are those species found on intertidal wave-cut rock platforms, due to the variable potential for landward retreat on these platforms [6] and the geographic isolation of platforms inhibiting poleward range shifts. In these habitats, species assemblages typically vary according to tidal elevations, creating zonation, due to the severe environmental gradients that occur with increasing elevation above the spring low-tide mark [7,8]. Consequently, species distributions on rock platforms are likely to be severely affected by rising sea levels, especially species living in tidal pools (hereafter referred to as pools), which occur on many platforms. Sea level rise will change the duration of pool connectivity to the ocean and increasing air and water temperatures are likely to affect the abiotic dynamics within pools. Pools provide important shelter from predation and harsh environmental conditions, for a wide range of species including fish [9,10] and invertebrates [11]. They also provide important nursery areas for juvenile fish [12,13,14] and can shelter species of conservation importance, including endemic species [9] and threatened species [15].
Previous research has identified that fish assemblages in pools are sensitive to changes in environmental factors (e.g., temperatures) and tide levels [16] and research examining seasonal variations has demonstrated that pool fish assemblages shift, identifying changes in ocean temperatures and seasonal recruitment of tropical species as drivers of seasonal patterns [13,16,17]. Similarly, research indicates that fish assemblages in pools vary with elevation, due primarily to environmental gradients (biotic and abiotic) across rock platforms [18,19]. However, limited data are available examining whether seasonal shifts in fish assemblages occur across pools at different tidal elevations, with increased knowledge needed in this area, to better understand how rising temperatures and sea levels are likely to influence pool fish assemblages.
The major objective of the current study was to assess how fish assemblages in pools vary with temperature and tidal elevation, using responses to seasonal temperature variations and differing pool elevations as surrogates for assessing the likely effects of future changes to ocean temperatures and sea levels. We examined whether seasonal variations in pool fish assemblages occurred consistently at three tidal elevations. We hypothesised that seasonal variations in assemblages would occur across all elevations, with increased abundance of tropical species during periods with higher ocean temperatures; and that higher species richness would occur in pools at lower elevations, due to their greater connectivity to the ocean. Distance-based linear modelling was applied to the fish assemblage data to determine the factors having the greatest influence on tidal pool fish assemblages, examining the relative influence of ocean and air temperatures, tidal elevation, pool area, and pool depth.
2. Materials and Methods
2.1. Study Site
Surveys of fish assemblages were conducted at four sites in Coffs Harbour, Australia (Arrawarra, Mullaway, Woolgoolga, and Woopi Point; Figure 1). These sites were selected for their extensive and easily accessible intertidal rock platforms. Nine haphazardly selected pools were sampled at each site, with the same nine pools sampled in each season. All pools were selected to have a minimum depth of 0.20 m and a minimum surface area of 1 m2, to ensure pool volumes were adequate to sustain several fish, as per Harasti et al. [10], with no maximum limits on depth or area applied. At each site, three pools were selected at each of three tidal elevations, above lowest astronomical tide (low: 0.0–0.5 m, medium: 0.5–1.0 m, and high: 1.0–1.5 m), covering most of the tidal range in the study region (~2.0 m). Elevation was calculated from the forecast tidal height at the time when pools first became immersed by a rising tide. Sampling was conducted seasonally (every three months) from Winter 2020 (July) until Autumn 2021 (April). Surveys were timed so that all pools were naturally disconnected from the ocean when surveyed, to prevent fish entering or leaving and to minimise wave impacts during sampling. The depth, length (L) and width (W) of each pool was recorded, with the area (A) of pools estimated as A = L × W. Study pools varied in area from 5.3–91.0 m2 with depths ranging from 0.20 to 0.89 m (Table 1).
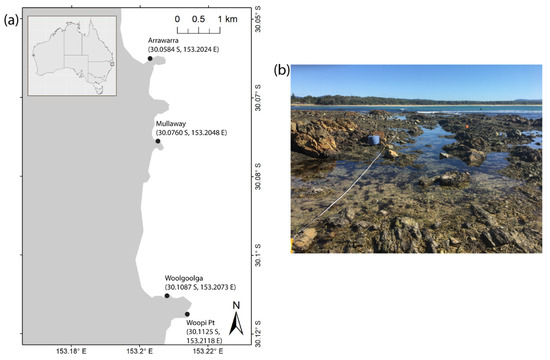
Figure 1.
(a) Study sites for tidal pool fish surveys in Coffs Harbour, Australia. (b) Typical rock platform at Arrawarra.

Table 1.
Tidal pool areas, depths, substrates, and dominant habitat types for survey sites in Coffs Harbour, Australia.
2.2. Sampling Methods
Baited remote underwater video (BRUV) was selected for sampling fish in pools, as this method causes minimal disruption and performs well in comparison to removal methods [20]. BRUV sampling was conducted following the methodology applied by Harasti et al. [10], with 15 min deployments used to maximise sampling efficiency [9,21]. All deployments were conducted within 2 h of low tide, between 06.00 and 18.00 hrs. Each BRUV deployment used a GoPro HERO 4 camera facing along a 30 cm weighted arm towards a mesh bag, with the bag holding 3 pilchards for bait. Cameras were set to record a 170° field of view at a resolution of 1920 × 1080 pixels. A BRUV was positioned in the deepest part of each pool, facing out into the pool. Post-processing was conducted using SeaGIS 5.01 Eventmeasure software with fish abundance measured as the maximum number of any species visible in a single frame (MaxN) as is commonly applied for BRUV sampling [22,23].
A preliminary investigation, in Winter 2020, identified no significant differences in pool temperatures among sites. Therefore, subsequent temperature data were collected for a one-week period in each season, for pools at high and low elevations at the Mullaway site, with air temperatures recorded in a nearby shaded location. Temperature data were sampled at 30 min intervals, using Hobo MX2201 data loggers (hobodataloggers.com.au, accessed on 20 July 2022). Ocean temperature data were extracted, for waters immediately offshore from the Mullaway site, using the E.U. Copernicus Marine Service Information (marine.copernicus.eu), based on the Global Ocean daily mean product (PHY_001_024).
2.3. Statistical Analysis
Distance-based linear modelling (DistLM) was used to examine relationships among environmental explanatory variables and fish assemblages [24]. Potential alternate models were examined using the “BEST” procedure, with the Akaike information criteria (AIC) used to select the most parsimonious model. Six explanatory variables were selected for testing in models, ocean temperature, air temperature, pool temperature, tidal elevation, pool area, and pool depth, with these variables chosen for their ecological importance to tidal pool fish assemblages. Temperatures influence physiology and regulate (among others) reproductive cycles, tidal elevation influences physico-chemical variability during emersion periods, while larger and deeper pools typically provide higher microhabitat and food availability. Correlations among explanatory variables were examined, prior to modelling, to determine whether excessive correlations existed (i.e., |r| > 0.7) as recommended by Dormann et al. [25]. The highest correlation occurred between air temperature and pool temperature (|r| = 0.95) and, as this was above the threshold, only pool temperature was included in subsequent testing in models.
Permutational analysis of variance (PERMANOVA), using PRIMER 7 PERMANOVA+ software Version 7.0.21 [24], was used to test for differences in fish assemblages (i.e., multivariate data on abundances of all fish species), among seasons and elevations, using square-root transformed data and the Bray–Curtis similarity index. Analyses were conducted using a three-factor design with the factors, seasons (4 levels, fixed), elevations (3 levels, fixed) and site (4 levels, random). PERMANOVA analyses were also conducted to test for differences in fish species richness and abundance among seasons, pool elevations, pool areas and pool depths.
The RELATE module was used to examine Spearman’s rank correlations between assemblage patterns and modelled distance matrices representing a seasonal cycle (cyclicity test) and a progressive change with elevation (seriation test) [26]. Non-metric multi-dimensional scaling (nMDS) analyses were used to visualise differences among boot-strap averaged fish assemblages, among seasons, and among elevations. Similarity percentages (SIMPER) analyses were conducted to identify those species making the largest contributions to differences among seasons and among elevations. The thermal distributions of fish species were used to determine whether species were temperate or tropically affiliated, with species preferred thermal distributions determined from the Fishbase database (www.fishbase.se, accessed on 10 May 2022). Species with a mean preferred temperature > 24.8 °C (i.e., mean annual water temperature in Coffs Harbour +2 S.D.) were deemed to be tropical immigrants.
3. Results
A total of 3454 fishes from 66 species (27 families) were detected over the four sampling periods in the 36 pools examined (see Supplementary Table S1). The most common species were Microcanthus strigatus (Cuvier, 1831), Myxus elongatus (Günther, 1861), and Istigobius decoratus (Herre, 1927), which accounted for 62% of all fish observed. The most species-rich families were Labridae (8 species), Pomacentridae (7 species), and Muraenidae (7 species). Average species richness was 6.48 ± 0.29 species per pool and average relative abundance was 24.0 ± 1.7 fish per pool.
3.1. Influence of Explanatory Variables on Pool Fish Assemblages
Modelling identified significant relationships between all explanatory variables and variations in fish assemblages (Table 2), with the best overall model for predicting variations in fish assemblages (i.e., lowest ΔAIC) using all variables and explaining 20.6% of the variation among samples. Ocean temperature was found to have the greatest influence on explanatory power, followed by pool area, elevation, pool depth, and pool temperature (Table 2).
Table 2.
Distance-based linear modelling marginal tests for significant relationships (p) between explanatory variables and variations for fish assemblages (significant values in bold). Prop. = proportion of variation explained by each variable.
3.2. Seasonal Patterns in Pool Fish Assemblages
PERMANOVA analyses of variations in fish assemblages among seasons and elevations showed significant differences among seasons (p = 0.003), among elevations (p = 0.023), and among sites (p < 0.001). No significant interactions existed among seasons and elevations (p = 0.376), indicating that the differences among seasons occurred consistently across all elevations. RELATE testing for a cyclic pattern (seasonality) in fish assemblages identified a significant cyclic pattern across all sites (p < 0.001, ρ = 0.18, Figure 2). Four species accounted for >40% of the differences in fish assemblages among seasons, with greater abundances of temperate M. strigatus in spring and summer, temperate M. elongatus in autumn and winter, tropical I. decoratus in winter and spring, and tropical Abudefduf vaigiensis (Quoy and Gaimard, 1825) in summer and autumn. Seasonal cyclic variations were also driven by increased species richness and an increased proportion of tropical species in Autumn, compared with other seasons (Figure 3a), with species richness significantly higher in Autumn than in all other seasons (p < 0.001, all tests). No significant differences in species richness were found among the remaining seasons (p > 0.332, all tests, Figure 3a). Contrastingly, there was no significant difference in fish abundances among seasons (p = 0.701). However, there was a significant increase in tropical fish abundance in Autumn, compared with other seasons (p < 0.001 all tests) and a concomitant significant reduction in temperate fish abundance during this period (p < 0.043 all tests, Figure 3b).
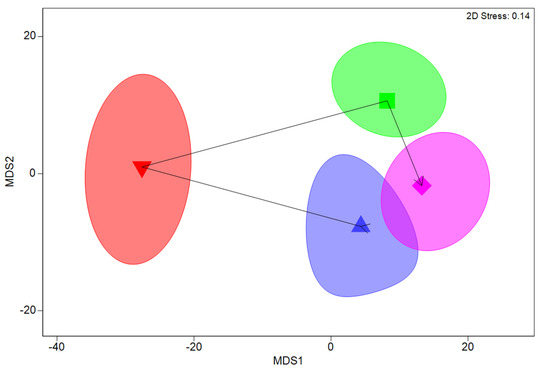
Figure 2.
Non-metric multidimensional scaling plot showing relative similarity of average fish assemblages across different seasons in pools in Coffs Harbour. Symbols indicate seasonal mean assemblages; summer (blue triangle), autumn (red inverted triangle), winter (green square), and spring (magenta diamond). Ellipses indicate 95% confidence intervals for averages obtained by bootstrap averaging.
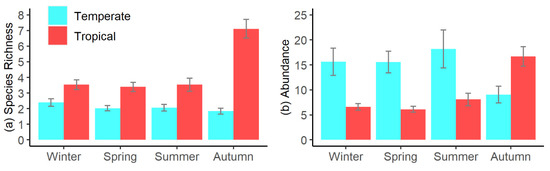
Figure 3.
Seasonal variations in tidal pool fish (a) average species richness and (b) abundance, for pools in Coffs Harbour, Australia. Data collected using mini-baited remote underwater videos, with abundance as total MaxN across all species.
3.3. Influence of Elevation, Pool Area, and Pool Depth
RELATE testing for a progressive shift in fish assemblages with increasing elevation identified a significant shift (seriation) in fish assemblages among elevations across all sites (p < 0.001, ρ = 0.102, Figure 4). However, no accompanying significant variations in tropical and temperate species richness (p = 0.845, Figure 5a) or abundance (p = 0.785, Figure 5b) occurred among elevations. Rather, examination of the species driving the shifts in assemblages, among elevations, identified that these shifts were primarily driven by changes in the abundance of four common species, with increased abundances of M. strigatus and I. decoratus at medium and high elevations, compared to low pools; increased numbers of M. elongatus at the medium elevation, compared to high and low pools; and increased numbers of A. vaigiensis at the low elevation, compared to medium and high pools. These four taxa accounted for >40% of the differences in fish assemblages among elevations.
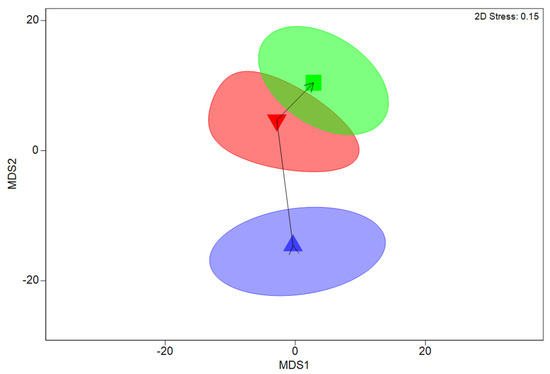
Figure 4.
Non-metric multidimensional scaling plot showing relative similarity of average fish assemblages at different elevations in tidal pools at four sites in Coffs Harbour. Symbols indicate mean assemblages for elevations above lowest astronomical tide; Low (Blue triangles, 0.0–0.5 m), Medium (red inverted triangle, 0.5–1.0 m), and High (green square, 1.0–1.5 m). Ellipses indicate 95% confidence intervals for averages obtained by bootstrap averaging.
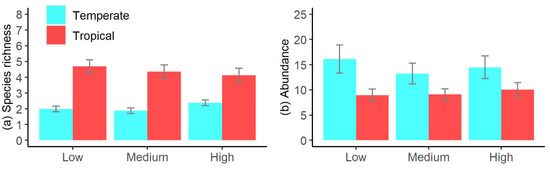
Figure 5.
Effects of elevation on tidal pool fish (a) average species richness and (b) abundance, for fish in tidal pools in Coffs Harbour, Australia. Data collected using mini-baited remote underwater videos, with abundance as total MaxN across all species. Low = 0.0–0.5 m, Medium = 0.5–1.0 m, and High = 1.0–1.5 m above lowest astronomical tide.
Examining the effects of pool area and depth on assemblages identified that, across all pools, significant increases in species richness (p < 0.001) and abundance (p < 0.001) occurred with increasing pool area (Figure 6a,b). Contrastingly, no significant effects of pool depth on species richness (p = 0.809) or abundance (p = 0.798) were detected. Across all pools the average species richness per unit pool area was 0.40 ± 0.04 species per m2 and the average relative abundance per unit area was 0.64 ± 0.07 fish per m2.
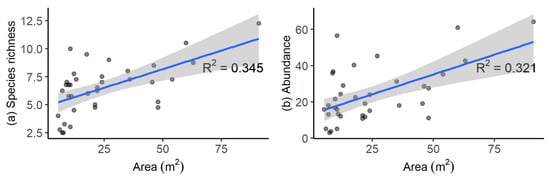
Figure 6.
Relationships for tidal pools in Coffs Harbour, Australia between (a) pool area and average fish species richness, (b) area and average total abundance (MaxN). Data collected using mini-baited remote underwater videos. Solid lines show significant positive linear relationships with shaded areas showing standard errors.
4. Discussion
Variations in both temperature and elevation were found to significantly influence pool fish assemblages, indicating the susceptibility of these assemblages to climate change induced rises in ocean temperatures and sea levels. This raises serious conservation concerns for pool fishes and their associated ecosystems, particularly as pools play important roles as nursery areas, feeding grounds, and places of shelter for endemic and threatened fish species [9,14,15,27].
Our examination of temporal variations in pool fish assemblages demonstrated that assemblages varied seasonally across all elevations, supporting our hypothesis of the presence of seasonal cyclicity. Modelling also demonstrated that the observed shifts in assemblages were most strongly correlated with seasonal variations in ocean temperature. These findings are consistent with previous research, which also identified that pool assemblages shift seasonally [13,16,17]. Generally, we found fish species richness and abundance were highest in autumn, coincident with warmer ocean temperatures, with the highest species richness primarily attributable to increased diversity of tropical species. These increases were accompanied by greater tropical fish abundance, with an accompanying decline in the numbers of temperate fishes. Similar patterns have been observed in other studies, which have identified higher species richness and higher abundance of tropical species when waters were warmest, during summer and autumn [17,28,29]. This shift in the ratio of temperate to tropical fishes, over summer and autumn, potentially indicates that tropical species out-compete temperate fishes in pools when ocean temperatures are at their warmest, with competition for resources among tidal pool fishes known to be influenced by environmental conditions [30]. Alternatively, tropical fishes have a greater natural affinity with the warmer conditions in pools that occur over this period and may actively enter pools seeking warmer water, while temperate species may actively depart, seeking cooler water. Concerningly, permanent shifts from temperate to tropical ecosystems (tropicalisation) have been observed in sub-tidal fish assemblages in the study region [31], raising apprehensions that this may also occur in tidal pools under future climate conditions. Globally, tropicalisation of temperate marine ecosystems is occurring, driven by warming oceans [32], with this trend set to accelerate in south-eastern Australia where ocean temperatures are increasing at a rate 2–4 times greater than the global average [33].
Importantly, fish assemblages were also found to be influenced by tidal pool elevation at all the sites examined. This finding has important conservation implications, as it indicates that pools at higher elevations contain distinct assemblages which may be lost as sea levels rise, in locations where there are no opportunities for retreat. Unique fish assemblages associated with pool elevation have been reported from other locations around the world, with environmental gradients across elevations (i.e., variations in physico-chemical parameters, such as salinity, dissolved oxygen, and nutrients) found to be one of the drivers of the variations in assemblages [18,19,34,35]. Salinity, in particular, tends to increase with elevation and has been linked to increased species richness and abundance [19]. These gradients govern the relative proportions of resident and transient fish species, with higher level pools generally having a larger proportion of resident species, whereas low level pools tended to shelter larger numbers of transient tropical species [19]. However, results of the present study are contrary to this, with little difference in transient tropical fish species richness and abundance occurring among pool elevations. Rather, differences among elevations resulted from seasonal shifts in the presence and abundance of a range of temperate and tropical species. This is consistent with observations reported by Davis [16], who found that vertical migration of fish occurred among pools, in response to changes in water level and environmental conditions.
Consequently, vertical migrations of fish are to be expected as sea levels gradually rise with climate change, with the increased immersion of existing pools significantly altering their environmental conditions and, potentially, reducing the ability of these pools to support current fish assemblages. Fish from higher pools will be displaced by fish from lower pools, as these need to move to more suitable habitats, leading to a cascade of vertical species migrations, but only where opportunities for these retreats exist. Importantly, the suitability of pools for facilitating these vertical migrations will depend on pool area and, to a lesser extent, depth. Study results indicate that the size of pools has an important effect in structuring fish assemblages, with larger pools generally supporting higher species richness and abundance of fishes. Similar patterns have been observed in pools in other regions, with fish species richness increasing with pool volume [36,37,38] and depth influencing pool use [34]. The projected effects of sea-level rise on pool habitats at study sites were explored in an earlier work by Thorner et al. [6], using LIDAR maps and high-resolution imagery to project various sea-level rise scenarios. Results indicated that, with a projected one metre sea level rise, there is likely to be a substantial decline in tidal pool habitat availability in the study region, with this pattern also likely to occur in other regions where shoreward retreat on rock platforms is restricted [6].
5. Conclusions
Our results highlight the importance of considering the elevation and size of pools, and the potential for the formation of new pool habitat, when considering protection of tidal pools on intertidal rock platforms, particularly where mitigation of climate change effects is required. Concerningly, the results of this study highlight the very real prospect that distinct fish assemblages, occurring in pools at higher elevations, will be ‘squeezed’ out by rising sea levels and by increased competition from tropical fish species. The continued existence of these distinct assemblages will be reliant on the availability of newly formed pools, at higher elevations, as sea levels rise, and on the ability of pool fishes to shift poleward among rock platforms. Consequently, assessment of the potential for new pools to form is of critical conservation importance, particularly in areas where pools shelter endemic and threatened species. Future conservation planning assessments should consider both the number and the size of existing and potential new pools and should evaluate whether there will be enough new pools forming, to replace those submerged by rising sea levels.
Supplementary Materials
The following supporting information can be downloaded at: https://www.mdpi.com/article/10.3390/ecologies3040037/s1, Table S1: Fish species in tidal pools in Coffs Harbour, Australia, measured using mini-baited remote underwater videos.
Author Contributions
Conceptualization, T.R.D. and M.N.; methodology, T.R.D. and M.N.; formal analysis, T.R.D. and M.N.; investigation, T.R.D.; resources, T.R.D.; data curation, T.R.D.; writing—original draft preparation, T.R.D. and M.N.; writing—review and editing, T.R.D. and M.N.; visualization, T.R.D.; project administration, T.R.D. and M.N.; funding acquisition, T.R.D. All authors have read and agreed to the published version of the manuscript.
Funding
This research was funded by the NSW Marine Estate Management Strategy, Initiative 3.
Institutional Review Board Statement
The animal study protocol was approved by the Ethics Committee of the NSW Department of Primary Industries (ACEC REF 10/09, 4 December 2019).
Informed Consent Statement
Not applicable.
Data Availability Statement
Not applicable.
Conflicts of Interest
The authors declare no conflict of interest. The funders had no role in the design of the study; in the collection, analyses, or interpretation of data; in the writing of the manuscript; or in the decision to publish the results.
References
- Helmuth, B.; Mieszkowska, N.; Moore, P.; Hawkins, S.J. Living on the edge of two changing worlds: Forecasting the responses of rocky intertidal ecosystems to climate change. Annu. Rev. Ecol. Evol. Syst. 2006, 37, 373–404. [Google Scholar] [CrossRef]
- Pitt, N.R.; Poloczanska, E.S.; Hobday, A.J. Climate-driven range changes in Tasmanian intertidal fauna. Mar. Freshw. Res. 2010, 61, 963–970. [Google Scholar] [CrossRef]
- Kaplanis, N.J.; Edwards, C.B.; Eynaud, Y.; Smith, J.E. Future sea-level rise drives rocky intertidal habitat loss and benthic community change. PeerJ 2020, 8, e9186. [Google Scholar] [CrossRef] [PubMed]
- Schaefer, N.; Mayer-Pinto, M.; Griffin, K.J.; Johnston, E.L.; Glamore, W.; Dafforn, K.A. Predicting the impact of sea-level rise on intertidal rocky shores with remote sensing. J. Environ. Manag. 2020, 261, 110203. [Google Scholar] [CrossRef]
- Jackson, A.C.; McIlvenny, J. Coastal squeeze on rocky shores in northern Scotland and some possible ecological impacts. J. Exp. Mar. Biol. Ecol. 2011, 400, 314–321. [Google Scholar] [CrossRef]
- Thorner, J.; Kumar, L.; Smith, S.D.A. Impacts of climate-change-driven sea level rise on intertidal rocky reef habitats will be variable and site specific. PLoS ONE 2014, 9, e86130. [Google Scholar] [CrossRef]
- Underwood, A.J. Structure of a rocky intertidal community in New South Wales: Patterns of vertical distribution and seasonal changes. J. Exp. Mar. Biol. Ecol. 1981, 51, 57–85. [Google Scholar] [CrossRef]
- Chappuis, E.; Terradas, M.; Cefalì, M.E.; Mariani, S.; Ballesteros, E. Vertical zonation is the main distribution pattern of littoral assemblages on rocky shores at a regional scale. Estuar. Coast. Shelf Sci. 2014, 147, 113–122. [Google Scholar] [CrossRef]
- Davis, T.R.; Larkin, M.F.; Harasti, D. Application of non-destructive methods for assessing rock pool fish assemblages on Lord Howe Island, Australia. Reg. Stud. Mar. Sci. 2018, 24, 251–259. [Google Scholar] [CrossRef]
- Harasti, D.; McLuckie, C.; Gallen, C.; Malcolm, H.; Moltschaniwskyj, N. Assessment of rock pool fish assemblages along a latitudinal gradient. Mar. Biodivers. 2018, 48, 1147–1158. [Google Scholar] [CrossRef]
- Smith, S.D.A. Rapid assessment of invertebrate biodiversity on rocky shores: Where there’s a whelk there’s a way. Biodivers. Conserv. 2005, 14, 3565–3576. [Google Scholar] [CrossRef]
- Compaire, J.C.; Montes, J.; Gonçalves, J.M.S.; Soriguer, M.C.; Erzini, K. Site fidelity of fish on a rocky intertidal in the south of Portugal. J. Sea Res. 2022, 183, 102202. [Google Scholar] [CrossRef]
- Dias, M.; Roma, J.; Fonseca, C.; Pinto, M.; Cabral, H.N.; Silva, A.; Vinagre, C. Intertidal pools as alternative nursery habitats for coastal fishes. Mar. Biol. Res. 2016, 12, 331–344. [Google Scholar] [CrossRef]
- Mendonca, V.; Flores, A.A.V.; Silva, A.C.F.; Vinagre, C. Do marine fish juveniles use intertidal tide pools as feeding grounds? Estuar. Coast. Shelf Sci. 2019, 225, 106255. [Google Scholar] [CrossRef]
- Harasti, D.; Gallen, C.; Malcolm, H.; Tegart, P.; Hughes, B. Where are the little ones: Distribution and abundance of the threatened serranid Epinephelus daemelii (Günther, 1876) in intertidal habitats in New South Wales, Australia. J. Appl. Ichthyol. 2014, 30, 1007–1015. [Google Scholar] [CrossRef]
- Davis, J.L.D. Changes in a tidepool fish assemblage on two scales of environmental variation: Seasonal and El Nino Southern Oscillation. Limnol. Oceanogr. 2000, 45, 1368–1379. [Google Scholar] [CrossRef]
- Barreiros, J.P.; Bertoncini, Á.; Machado, L.; Hostim-Silva, M.; Santos, R.S. Diversity and seasonal changes in the ichthyofauna of rocky tidal pools from Praia Vermelha and São Roque, Santa Catarina. Braz. Arch. Biol. Technol. 2004, 47, 291–299. [Google Scholar] [CrossRef]
- Andrades, R.; Reis-Filho, J.A.; Macieira, R.M.; Giarrizzo, T.; Joyeux, J.-C. Endemic fish species structuring oceanic intertidal reef assemblages. Sci. Rep. 2018, 8, 10791. [Google Scholar] [CrossRef]
- Griffiths, S.P.; West, R.J.; Davis, A.R. Effects of intertidal elevation on the rockpool ichthyofaunas of temperate Australia. Environ. Biol. Fishes 2003, 68, 197–204. [Google Scholar] [CrossRef]
- Wong, M.Y.L.; Gordon, P.; Paijmans, K.C.; Rees, M.J. Finding rockpool fishes: A quantitative comparison of non-invasive and invasive methods for assessing abundance, species richness and assemblage structure. Environ. Biol. Fishes 2019, 102, 81–94. [Google Scholar] [CrossRef]
- Piggott, C.V.H.; Depczynski, M.; Gagliano, M.; Langlois, T.J. Remote video methods for studying juvenile fish populations in challenging environments. J. Exp. Mar. Biol. Ecol. 2020, 532, 151454. [Google Scholar] [CrossRef]
- Willis, T.J.; Millar, R.B.; Babcock, R.C. Detection of spatial variability in relative density of fishes: Comparison of visual census, angling, baited underwater video. Mar. Ecol. Prog. Ser. 2000, 198, 249–260. Available online: http://www.int-res.com/abstracts/meps/v198/p249-260/ (accessed on 20 July 2022). [CrossRef]
- Whitmarsh, S.K.; Fairweather, P.G.; Huveneers, C. What is Big BRUVver up to? Methods and uses of baited underwater video. Rev. Fish Biol. Fish. 2017, 27, 53–73. [Google Scholar] [CrossRef]
- Anderson, M.J.; Gorley, R.N.; Clarke, K.R. PERMANOVA+ for PRIMER: Guide to Software and Statistical Methods; PRIMER-E Ltd.: Plymouth, UK, 2008. [Google Scholar]
- Dormann, C.F.; Elith, J.; Bacher, S.; Buchmann, C.; Carl, G.; Carré, G.; Marquéz, J.R.G.; Gruber, B.; Lafourcade, B.; Leitão, P.J.; et al. Collinearity: A review of methods to deal with it and a simulation study evaluating their performance. Ecography 2013, 36, 27–46. [Google Scholar] [CrossRef]
- Clarke, K.R.; Gorley, R.N. PRIMER v7: User Manual/Tutorial; PRIMER-E Ltd.: Plymouth, UK, 2015. [Google Scholar]
- Beckley, L.E. The fish community of East Cape tidal pools and an assessment of the nursery function of this habitat. Afr. Zool. 1985, 20, 21–27. [Google Scholar] [CrossRef]
- Beckley, L.E. Species composition and recruitment of tidal pool fishes in KwaZulu-Natal, South Africa. Afr. Zool. 2000, 35, 29–34. [Google Scholar] [CrossRef][Green Version]
- Arakaki, S.; Tokeshi, M. Short-term dynamics of tidepool fish community: Diel and seasonal variation. Environ. Biol. Fishes 2006, 76, 221–235. [Google Scholar] [CrossRef]
- Paijmans, K.C.; Wong, M.Y.L. Linking animal contests and community structure using rockpool fishes as a model system. Funct. Ecol. 2017, 31, 1612–1623. [Google Scholar] [CrossRef]
- Vergés, A.; Doropoulos, C.; Malcolm, H.A.; Skye, M.; Garcia-Pizá, M.; Marzinelli, E.M.; Campbell, A.H.; Ballesteros, E.; Hoey, A.S.; Vila-Concejo, A.; et al. Long-term empirical evidence of ocean warming leading to tropicalization of fish communities, increased herbivory, loss of kelp. Proc. Natl. Acad. Sci. USA 2016, 113, 13791–13796. [Google Scholar] [CrossRef]
- Vergés, A.; Steinberg, P.D.; Hay, M.E.; Poore, A.G.B.; Campbell, A.H.; Ballesteros, E.; Heck, K.L.; Booth, D.J.; Coleman, M.A.; Feary, D.A.; et al. The tropicalization of temperate marine ecosystems: Climate-mediated changes in herbivory and community phase shifts. Proc. R. Soc. B 2014, 281, 20140846. [Google Scholar] [CrossRef]
- Hobday, A.J.; Pecl, G.T. Identification of global marine hotspots: Sentinels for change and vanguards for adaptation action. Rev. Fish Biol. Fish. 2014, 24, 415–425. [Google Scholar] [CrossRef]
- Davis, J.L.D. Spatial and seasonal patterns of habitat partitioning in a guild of southern California tidepool fishes. Mar. Ecol. Prog. Ser. 2000, 196, 253–268. [Google Scholar] [CrossRef][Green Version]
- Cox, T.E.; Baumgartner, E.; Philippoff, J.; Boyle, K.S. Spatial and vertical patterns in the tidepool fish assemblage on the island of Oahu. Environ. Biol. Fishes 2011, 90, 329–342. [Google Scholar] [CrossRef]
- Mahon, R.; Mahon, S.D. Structure and resilience of a tidepool fish assemblage at Barbados. Environ. Biol. Fishes 1994, 41, 171–190. [Google Scholar] [CrossRef]
- White, G.E.; Hose, G.C.; Brown, C. Influence of rock-pool characteristics on the distribution and abundance of inter-tidal fishes. Mar. Ecol. 2015, 36, 1332–1344. [Google Scholar] [CrossRef]
- González-Murcia, S.; Erdmann, S.; Larios, R.A. Is this rock pool suitable habitat? Fish diversity in intertidal rock pools of El Zonte, El Salvador. Rev. Mex. Biodivers. 2020, 91, e913099. [Google Scholar] [CrossRef]


Publisher’s Note: MDPI stays neutral with regard to jurisdictional claims in published maps and institutional affiliations. |
© 2022 by the authors. Licensee MDPI, Basel, Switzerland. This article is an open access article distributed under the terms and conditions of the Creative Commons Attribution (CC BY) license (https://creativecommons.org/licenses/by/4.0/).