Article

Laser Trapping Technique for Measuring Ionization Energy and Identifying Hemoglobin Through Charge Quantification in Blood Samples

by
Endris M. Endris
1,*,
Deresse A. Adem
1,2,
Horace T. Crogman
3 and
Daniel B. Erenso
4
1
Department of Physics, Addis Ababa University, Addis Ababa P.O. Box 1176, Ethiopia
2
Department of Physics, Wolkite University, Wolkite P.O. Box 07, Ethiopia
3
Department of Physics, California State University Dominguez Hills, Carson, CA 90747, USA
4
Department of Physics and Astronomy, Middle Tennessee State University, Murfreesboro, TN 37132, USA
*
Author to whom correspondence should be addressed.
Biophysica 2025, 5(4), 56; https://doi.org/10.3390/biophysica5040056 (registering DOI)
Submission received: 18 September 2025 / Revised: 12 October 2025 / Accepted: 18 October 2025 / Published: 18 November 2025
(This article belongs to the Special Issue Biophysical Methods to Study Membrane Models, Cells, and Tissues)

Abstract

We present a proof-of-concept study using a laser trapping (LT) approach to characterize hemoglobin variants through controlled dielectric breakdown of red blood cell membranes. Using a 1064 nm infrared laser, we analyzed 62 cells from each of four hemoglobin types (Hb AS, Hb FA, Hb FSC, Hb AC), measuring the ionization time, cell area, and trap displacement to calculate the apparent threshold ionization energy (TIE*) and apparent threshold radiation dose (TRD*). Post-ionization trajectories and radiation intensity measurements provided charge distribution profiles for each variant. Our results indicate variant-specific differences in TRD* and charge-to-volume ratios across adults and infants (p < 0.05), while the TIE* values remained largely consistent. Charge analysis revealed statistically significant variation between some groups, suggesting that TRD* and charge-based parameters may offer sensitive markers of hemoglobin heterogeneity. This work demonstrates the feasibility of laser trapping as a complementary single-cell method for hemoglobin analysis. While limited in sample size, the approach highlights the potential of TIE* and TRD* measurements for differentiating hemoglobin variants and suggests future applications in hemoglobinopathy screening and diagnostic research.

1. Introduction

Hemoglobin (Hb) is a protein in red blood cells responsible for transporting oxygen and facilitating the removal of carbon dioxide. Adult hemoglobin (Hb A), the primary oxygen carrier in humans, consists of two alpha and two beta chains, with glutamic acid at the sixth position of the beta-globin chain. Fetal hemoglobin (Hb F), predominant in fetuses, has two alpha and two gamma chains, with serine replacing glutamic acid at the same position in the gamma chain, and Hb F gradually decreases after birth [1]. Sickled hemoglobin (Hb S) arises from a mutation in which valine replaces glutamic acid at the sixth position of the beta-globin chain, causing abnormal hemoglobin polymerization and red blood cell sickling under hypoxic conditions [2,3]. Hemoglobin C (Hb C) arises from a mutation where lysine substitutes for glutamic acid at the same position, introducing a positive charge that alters red blood cell shape but typically does not cause sickling [4].
These specific amino acid substitutions lead to distinct charge differences among the hemoglobin variants. In Hb S, the substitution of valine for negatively charged glutamic acid reduces the molecule’s overall negative charge [5]. In Hb C, the replacement of glutamic acid with positively charged lysine introduces a net positive shift [6]. In contrast, the substitution of serine in Hb F has a minimal effect on the overall charge compared with Hb A. These charge alterations contribute to distinct structural and functional differences among the variants, affecting red blood cell deformability, aggregation, and circulation dynamics [7,8].
High-performance liquid chromatography (HPLC) is a widely used technique for identifying and quantifying hemoglobin variants in red blood cell samples [9]. This technique is based on ion-exchange chromatography combined with spectrophotometric detection. Sample preparation involves hemolyzing a small volume of whole blood to disrupt red blood cell membranes and release hemoglobin. The resulting hemolysate is introduced into a positively charged column, where, under alkaline pH, hemoglobin molecules—each with differing levels of negative charge—interact via cation exchange.
Hb F, having the weakest net charge, elutes first, while Hb C, due to its altered charge properties, exhibits delayed elution and stronger retention in the column. This elution profile enables the effective identification and quantification of hemoglobin variants, supporting the screening of hemoglobinopathies and monitoring of disorders such as sickle cell disease [10].
HPLC typically requires analyte concentrations between 0.1 and 1 µg/mL, which limits its sensitivity for detecting low-abundance hemoglobin variants [11,12]. Additionally, electrophoresis is also commonly used to detect hemoglobin variants. For example, in screening for β-thalassemia traits, Hb A2 levels above 4% serve as a reliable marker—even in individuals with iron deficiency [13]. Despite its widespread use, HPLC often requires extensive sample preparation, including filtration and centrifugation steps, which are time-consuming and increase the risk of sample loss [14,15]. Although HPLC is faster than older manual techniques, its run times can still vary from minutes to hours depending on sample complexity and the specific protocol used [16,17,18].
In contrast, LT techniques offer significant advantages [15]. Originally developed to study the elastic properties of human red blood cells [19,20], LT has only recently been applied to the quantification of hemoglobin in blood samples [21]. Unlike HPLC, laser trapping provides higher sensitivity, enabling detection at the single-cell level with minimal sample preparation. This capability makes it a promising method for applications where rapid and precise hemoglobin quantification is required.
It is important to note that infrared light at 1064 nm does not directly ionize biomolecules. Instead, the mechanism involves hyperthermia from water absorption and field-induced dielectric breakdown of the red blood cell membrane, leading to charge accumulation and eventual ejection from the trap [21,22]. Recognizing this, our study evaluated both thermal and field effects to ensure that the measured parameters truly reflect the hemoglobin-dependent differences in cellular response.
Despite advances in HPLC and electrophoresis, current hemoglobin analysis methods remain limited in sensitivity, sample requirements, and ability to capture single-cell variability. Laser trapping offers a unique opportunity to overcome these challenges by enabling charge and ionization energy measurements at the individual cell level. In this proof-of-concept study, we investigated the feasibility of using laser trapping to differentiate hemoglobin variants (Hb A, Hb F, Hb S, and Hb C) through the quantification of apparent threshold ionization energy (TIE*), apparent threshold radiation dose (TRD*), and charge development. Our goal was to demonstrate that these biophysical parameters provide a sensitive and precise means of distinguishing hemoglobin types, laying the groundwork for future diagnostic applications in hemoglobinopathies such as sickle cell disease. Because membrane composition and mechanics evolve over the ~120-day RBC lifespan (e.g., loss of surface sialylation, increased rigidity), aging is expected to modulate both the threshold ionization energy and the charge readout in our measurements.

2. Experimental Method: Hemoglobin Analysis and Single-Cell Manipulation

2.1. Hemoglobin Quantitation and Sample Preparation

Our study harnessed biophysical techniques to probe hemoglobin variants, starting with meticulous sample preparation. De-identified ethylenediaminetetraacetic acid (EDTA) blood samples were obtained from four individuals in one family (two parents and their twin infants) through the Meharry Sickle Cell Center (MSCC) at Meharry Medical College (MMC), a major hemoglobinopathy testing center in Nashville, Tennessee. The blood samples were collected via venipuncture or finger stick. Whole blood was stored at 2–4 °C immediately after collection and processed within 24 h at the MSCC. All laser trapping experiments were initiated within 4 h of venipuncture; no sample exceeded 12 h total storage prior to measurement. A biological material transfer agreement was established between MTSU and Meharry Medical College to facilitate the study. In this study, we focused on structural hemoglobin variants (e.g., Hb A, Hb S, Hb C) due to the technique’s sensitivity to charge differences. While oxidized/reduced and glycated hemoglobin are important circulating forms, their detection requires modifications to the current setup such as enhanced sensitivity and spectroscopic integration. These adaptations will be explored in future studies.
Hemoglobin quantitation for these de-identified blood samples was conducted at MSCC. Hemoglobin types and relative percentages for each of the four-blood samples were determined using High-Performance liquid chromatography (HPLC), with the results summarized in Table 1.

2.2. Laser Trapping and Single Cell Ionization

Laser trap setup. As illustrated in Figure 1, the experimental setup closely resembled those used in previous biomedical laser trapping studies [1,2,3,4,5]. In our research, we employed a 1064 nm Spectra-Physics V-extreme Nd laser, which produces a linearly polarized beam with a maximum power of 8 W and a 4 mm beam size at the laser port. The laser’s power is modulated using a polarizer (P) and half-wave plate (W) combination.
The beam is directed through mirrors (M1 and M2), a 20× beam expander, and lenses (L1 and L2) to collimate and adjust the beam size, optimizing the conditions for a stronger optical trap. Mirrors (M3 and M4) align the beam, and M5 is positioned to create a steerable trap at the microscope’s focal plane. The collimated beam is then coupled to the microscope through a dichroic mirror (DM), which reflects the laser beam at a 45-degree angle for normal incidence at a 100× oil immersion objective lens with a 1.25 numerical aperture. Simultaneously, the DM transmits imaging light from an Olympus Tl4 halogen lamp, enabling live image capture via a PC-controlled digital camera integrated into the microscope. In our configuration, the RBC major axis aligns parallel to the beam polarization during trapping; we verified this by rotating the half-wave plate and observing re-alignment of the cell’s major axis. The trapping beam at the sample plane was Gaussian with waist w = 282.26 μ m measured by [knife-edge/bead-scan] calibration, corresponding to a focal area A = π w 2 = [ 0.25 ]   μ m 2 (used in Equation (2)). During each run the incident power at the trap was held constant; across sessions, it varied slightly due to alignment (see Section 2.3.7).
For cell trapping and ionization experiments, power measurements were taken at two points, one after L4 and at the objective lens (sample stage). The average power at the trapping site was measured for different hemoglobin variants: 355.80 mW for Hb AS, 374.55 mW for Hb AC, 361.50 mW for Hb FSC, and 358.95 mW for Hb FA, with an efficiency of approximately 15% maintained throughout the measurements.
The mechanism of single-cell ionization involves the cell membrane, primarily composed of phospholipids containing hydrophilic (polar phosphate) and hydrophobic (non-polar alkyl chain) components. In an aqueous environment, lipids spontaneously form a bilayer structure, influencing the movement of ions across the membrane. Under an external field, the membrane undergoes reversible electroporation, increasing conductivity and permeability. Exposure to an intense, rapidly fluctuating electric field produced by the laser, combined with heat from light absorbed by RBCs, results in irreversible electroporation and cellular ionization. The gradual buildup of charge on the trapped cell leads to a rising electrostatic force, causing the cell to be ejected from the trap upon complete dielectric breakdown. The radiation energy absorbed by the cell during this process determines the threshold ionization energy required to kill the cell [22,23,24].
Cells require a specific osmotic balance, pH control, and nutrients to survive and function properly in culture. Water alone lacks the necessary salts, ions, and buffering capacity to maintain this balance, which can lead to cell damage or death. Fetal bovine serum (FBS) provides essential proteins and growth factors to preserve cell integrity. To ensure the integrity of the cells and to trap and ionize only a single cell at a time, blood samples were diluted in FBS. A dilution ratio of 1 μL of blood to 1000 μL of FBS was used. Higher concentrations could interfere with the single-cell ionization process, as the laser’s high-intensity gradient force might pull multiple cells or other particles into the trap. Even with this dilution, it was necessary to move the microscope stage during ionization to isolate the trapped cell and prevent nearby cells from being drawn into the trap.
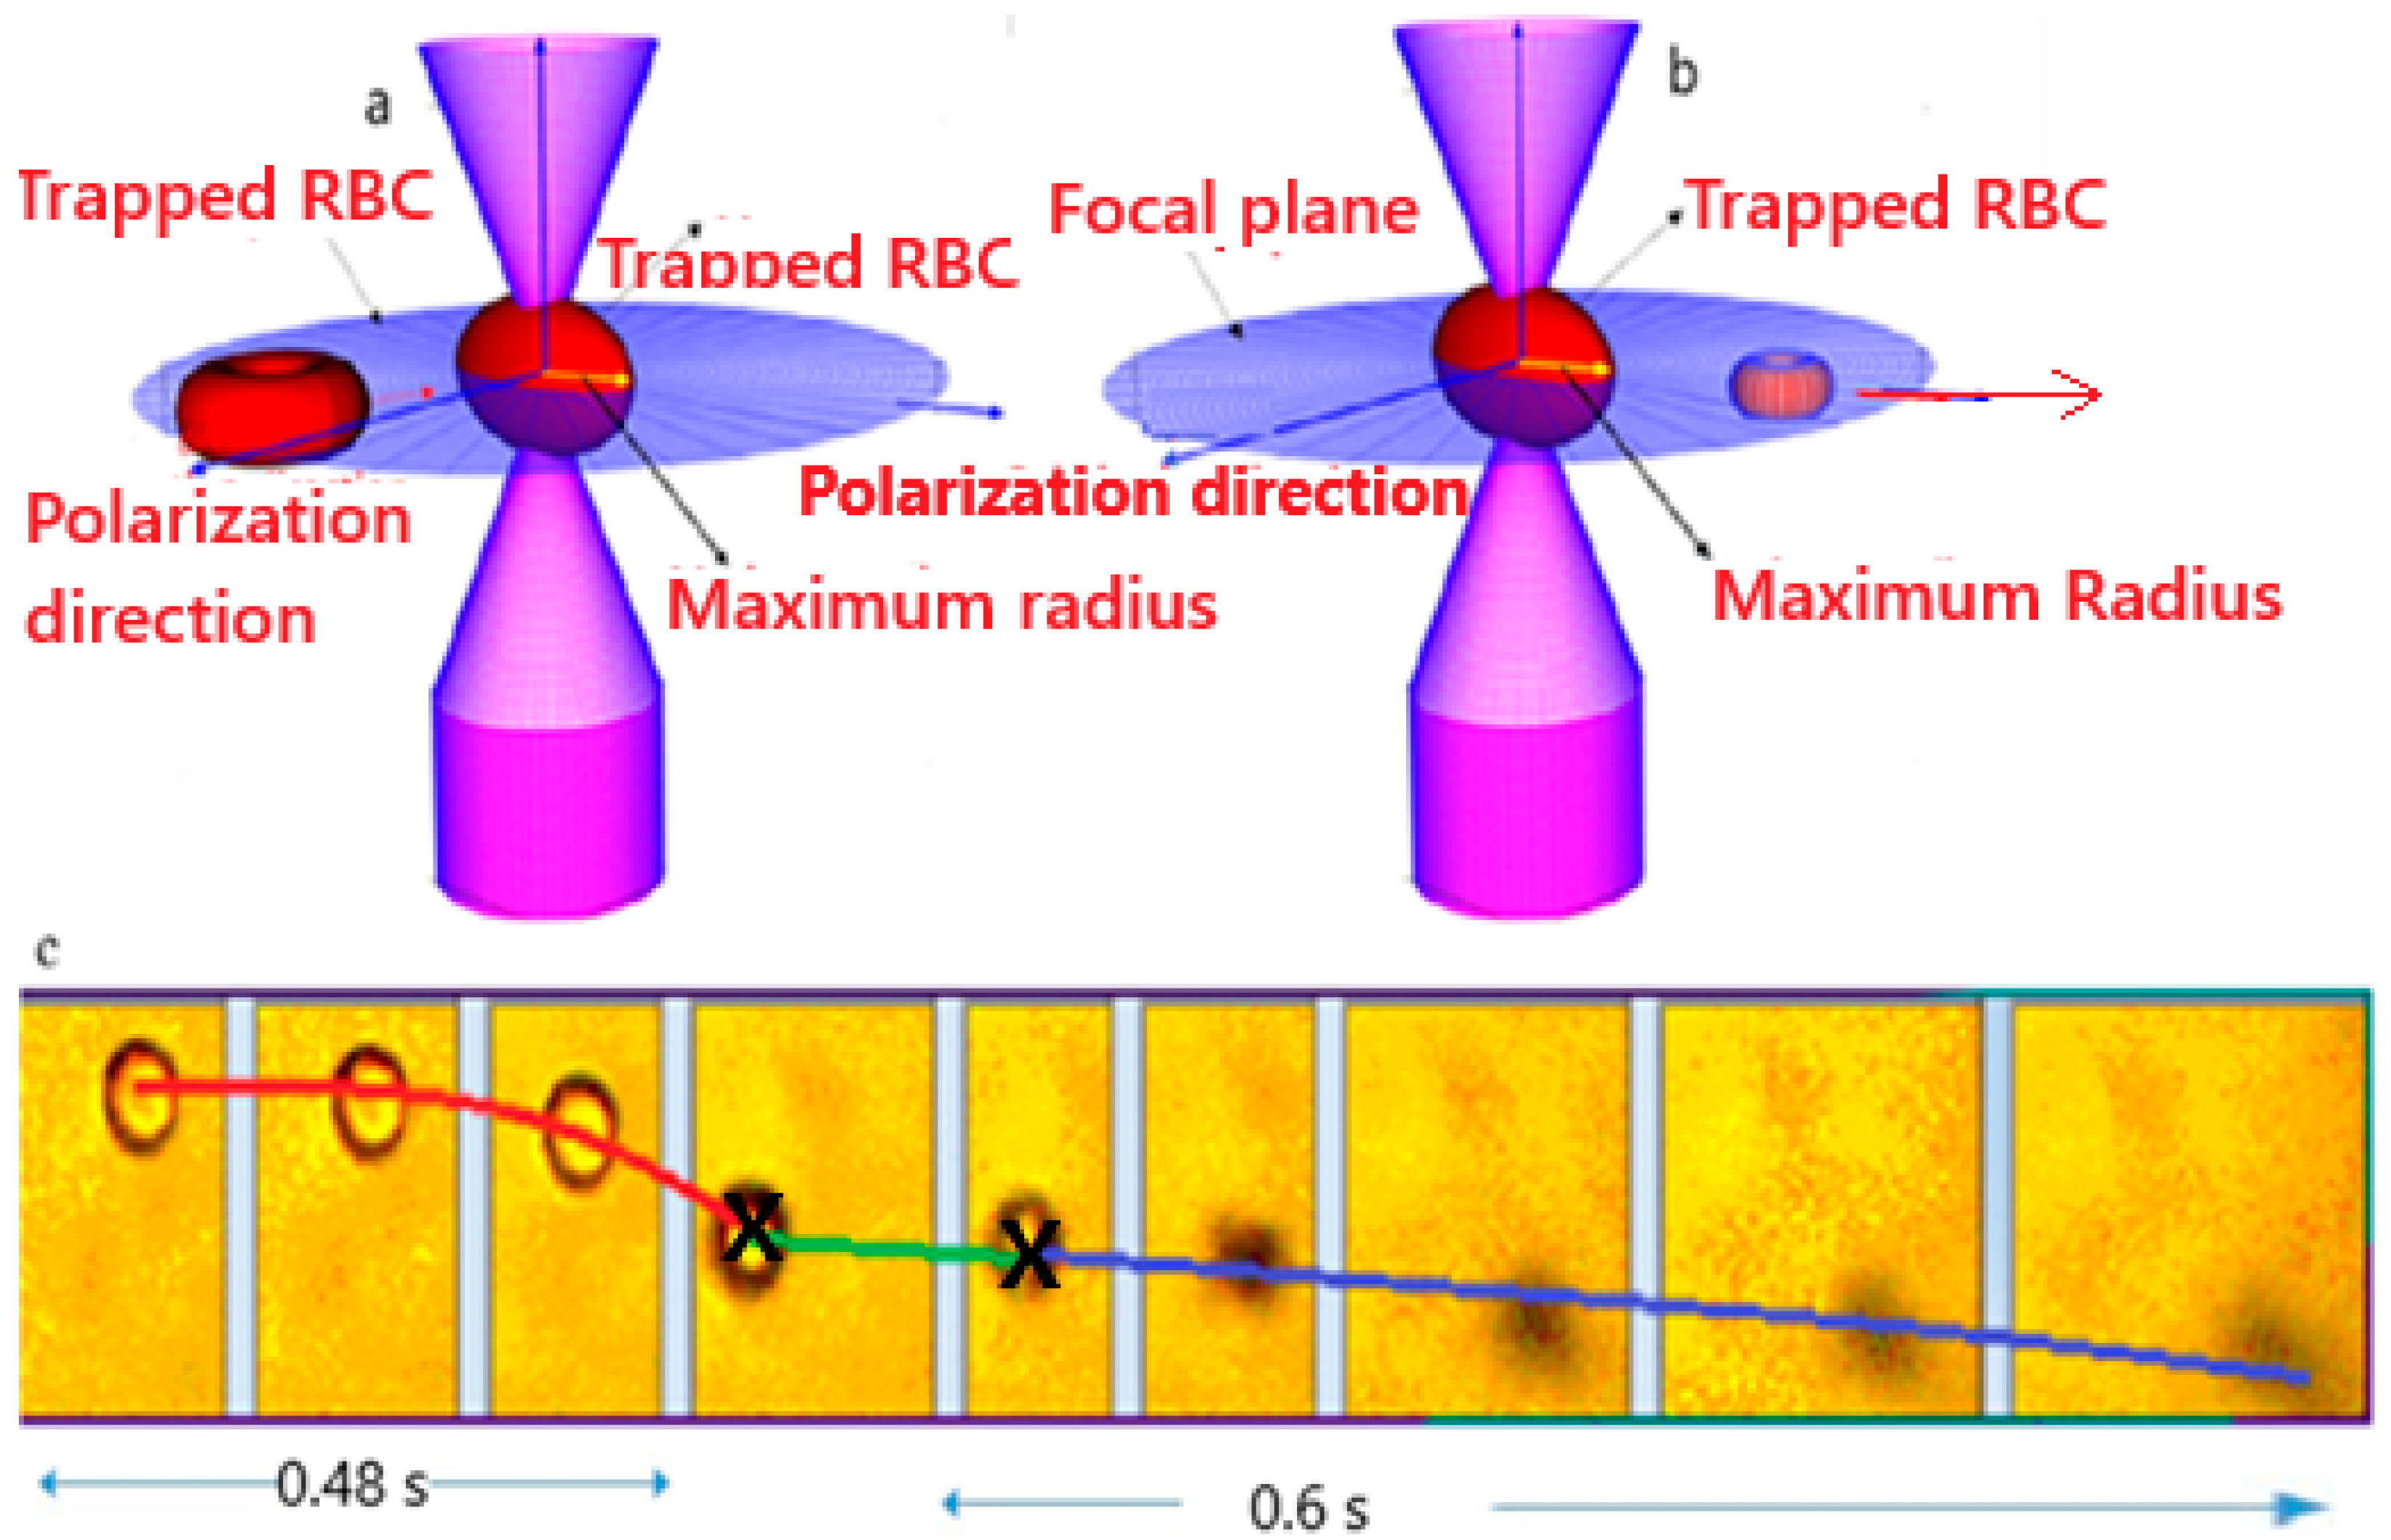
The ionization process begins by placing the diluted samples on a well slide on the microscope stage and activating the laser. Each red blood cell (RBC) is recorded in real time using a digital camera attached to the microscope, capturing the trapping, ionization, and ejection of the cell from the trap. The camera records at 0.12 s per frame. Selected frames illustrating the process for the four RBC samples are shown in Figure 2.
In Figure 2a, a red line tracks the position of the RBC as it accelerates towards the trap. Once the RBC becomes trapped, it remains in the trap until ionization occurs, as indicated by a green horizontal line showing its position from entry to just before ionization. After the cell is fully charged and experiences an electrostatic force, it is ejected from the trap when this force surpasses the trapping (gradient) force. The post-ionization trajectory of the RBC is illustrated by a blue line, tracing its positions over time as it moves away from the trap. By measuring each cell’s size, duration to stay in the trap, and displacement during ejection, the research aims to estimate the threshold ionization energy, radiation dose, and charge for each cell. All of the size and position measurements initially recorded in pixels were accurately converted to micrometers. This conversion was achieved using a precise conversion factor of 7.27 × 10⁻⁸ m/pixel [21]. To establish this conversion factor, Image-Pro Plus 6.2 software was utilized, and the factor was derived by measuring images containing silicon beads of a known diameter (3.1 × 10⁻⁶ m).
In addition to medium conditions (osmolarity, pH, viscosity), the intrinsic membrane state—which changes with RBC aging—can influence the TIE*, TRD*, and the net cellular charge. The TIE*, TRD*, and net cellular charge are modulated by the osmolarity, pH, and viscosity of the medium.
Ionization energy: Higher osmolarity increases ionic screening and can lower the ionization threshold; in hypertonic media, RBCs shrink and concentrate intracellular ions [6]. Lower pH increases protonation, stabilizing charged species and reducing the energy required for ionization [25].
Radiation dose: Acidic conditions raise radionuclide solubility and bioavailability [26], whereas elevated viscosity slows diffusion and can create local exposure “hotspots” [27]. Osmolarity may also indirectly affect the dose via medium density.
Cellular charge: Lower pH protonates sialic-acid carboxyls, reducing the net negative surface charge [26]. Osmolarity-driven volume changes inversely affect the intracellular charge density—hypertonic increases, hypotonic decreases [25]. Increased viscosity impedes ion mobility and hinders charge equilibration (e.g., Donnan effect) [27].
Charge number analyses: A strong electric field can induce intense dipole oscillations in human cellular material, causing the atoms within the material to vibrate. As these vibrations increase, the bonds between atoms may break, leading to ionization. In biological tissues, polar molecules such as water and cellular components align and oscillate in response to the electric field. As the field strength rises, the increased vibrations can cause the breakdown of atomic bonds and result in ionization.
This breakdown of the cell membrane leads to the development of charge on RBCs, generating an electrostatic force that can overcome the trapping force, pulling the RBCs out of the optical trap [21]. The forces acting during the ejection of RBCs from the trap include the trapping force, drag induced force, and electrostatic force. Based on these forces, the equation of motion is formulated, where the trapping force constant (k) and the charge developed on the RBCs (q) are unknown. By measuring the displacement versus time as the RBCs are ejected from the trap, the values of the charge (q) and trapping constant (k) were determined for each cell. This was conducted by fitting the displacement function r(t), derived from the equation of motion to the experimental data using a nonlinear fitting model in Mathematica.
The charge measurements of normal adult hemoglobin (Hb AA) and normal infant hemoglobin (Hb FA) were used as baselines to quantify hemoglobin variants S, C, and F in blood samples, including Hb AS, Hb AC, Hb FSC, and Hb FA.

2.3. Theoretical Model

For the theoretical model, we considered three forces acting on the cell with mass m ejected from the trap at a distance r from the center of the trap, at a given time t. These forces were the electrostatic force, F E , the drag force, F D , and trapping force of the laser, F T . The electrical force and the trap force depend on the electric field strength at the position of the cell r measured from the center of the trap.

2.3.1. The Electrical Force

The electrical force resulting from membrane breakdown can vary widely depending on the magnitude of the charge developed, and the dielectric properties of the surrounding medium. Membrane breakdown typically occurs when the membrane can no longer resist the electrical stress applied to it, causing it to lose its dielectric properties. This electrical force can be remarkably powerful, especially when substantial charges are involved, which can enhance the formation of a stronger dipole moment. This force can be written as [19,28].
F e = q   E ( r ) y
where E r = E o e r t 2 w o 2 .
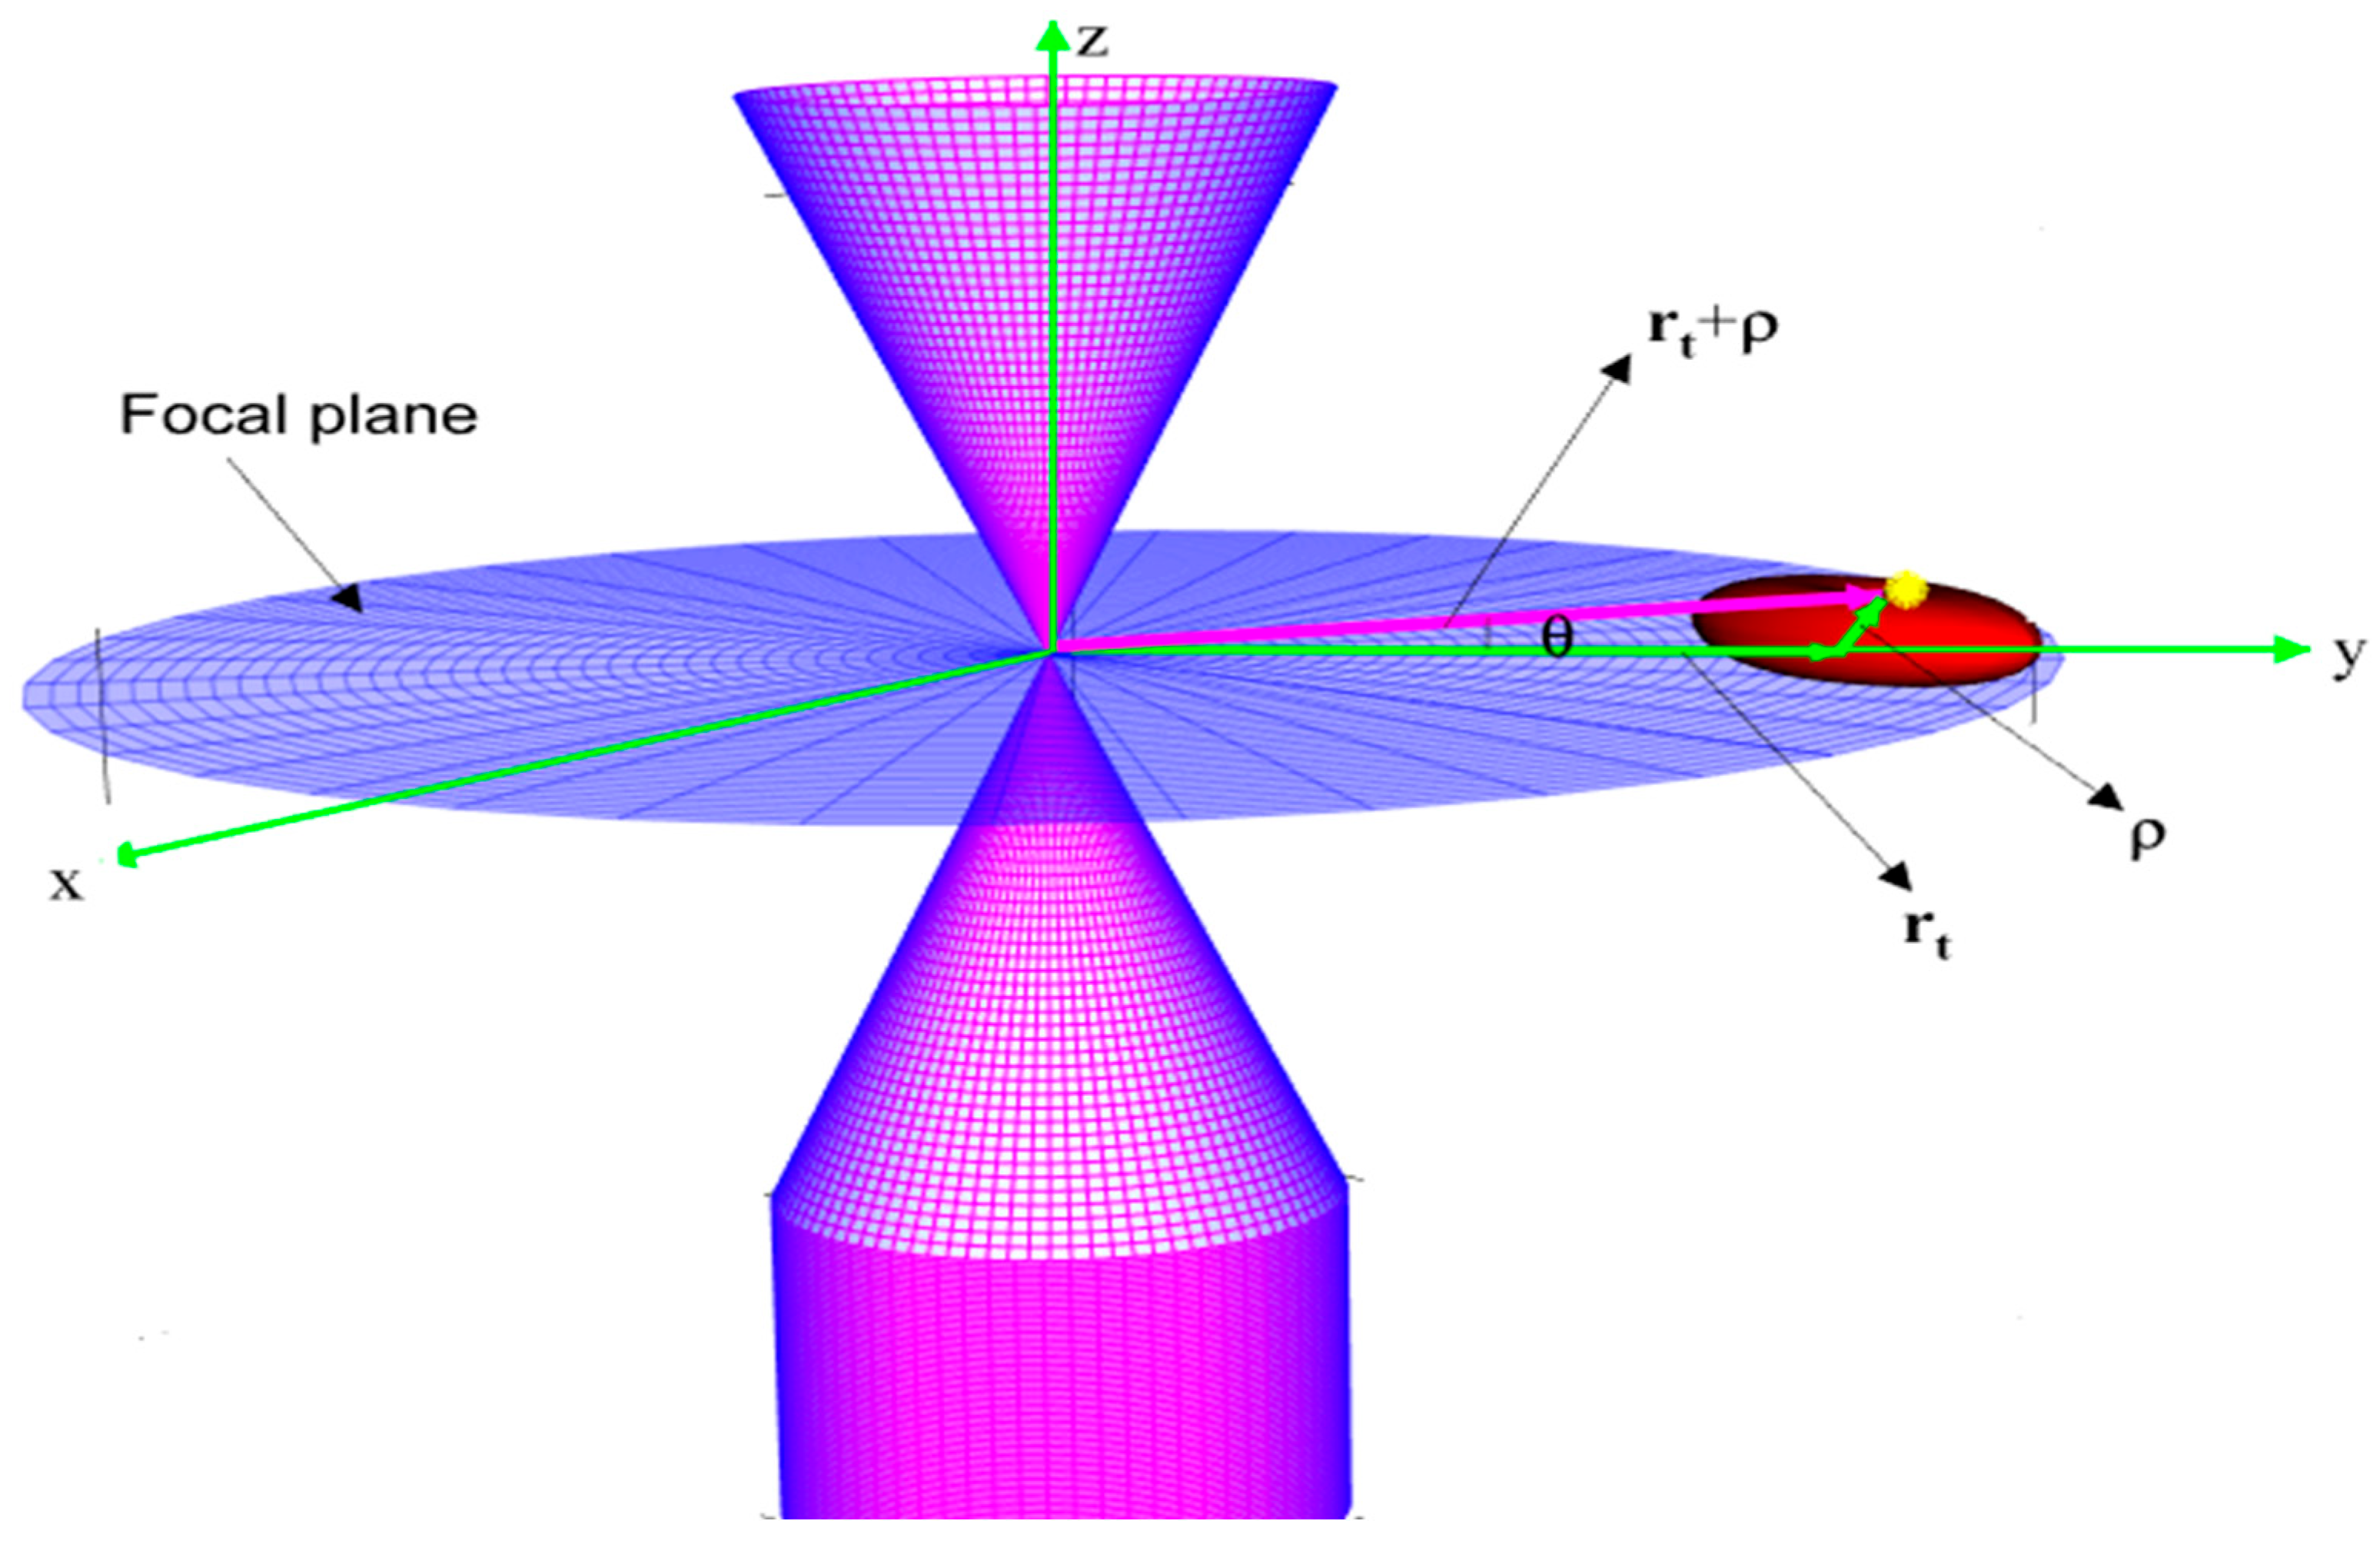
Where   r t 2 = x 2 + y 2 , w is the minimum spot size of the laser beam. We wish to note that in this model we considered a Gaussian linearly polarized electromagnetic wave in the radial direction (s) propagating in the positive z-direction as shown in Figure 3. We also set the center of mass of the cell at the origin and assumed that the cell remained confined to the x-y plane at, z = 0. The electrostatic force on the cell decreases as it moves away from the trap due to the exponential decay of the field with distance, as captured by   E o e r t 2 w o 2 . Additionally, recombination reduces the cell’s charge q, further weakening the force.
The amplitude of the electric field, Eo, can be determined from the power, P, measured at the trap location using the relation,
E o = 2 P ν μ o A
where μ o is the magnetic permeability of a free space, v is the speed of light in the medium that the cell is suspended in, and A = πw2 is the beam size at the trap location determined using the beam radius at the back of the objective lens and the numerical aperture of the objective lens, which was 1.25.

2.3.2. The Drag Force

As shown in Figure 3, we considered an RBC with a biconcave shape, and the drag force can be determined as in Ref. [29],
F = 0.88 μ D v
where D is the erythrocyte diameter moreover, µ is the viscosity of the fluid that the cell is suspended in, which was FBS.

2.3.3. Radiation Pressure Force

For stable trapping, the gradient force must overcome the scattering force in the axial direction. This balance ensures that particles are held at a stable position slightly beyond the focal point of the laser beam.
F s c a t = n c P Q s c a t c = 128 π 5 r 6 3 λ 4 n c m 2 1 m 2 + 2 2 I o c z ^
where n m , P s c a t ,   m = n c n m , and I o are the refractive index of the medium, scattering power, ratio of the refractive index of cell to medium, and the incident intensity of the laser. The radiation pressure force in an optical trap acts along the z-direction, perpendicular to the transverse gradient (trapping) force, as well as to the hydrodynamic drag force, and the electrostatic forces resulting from the charge on the red blood cell. For a typical red blood cell, this scattering force induced by radiation pressure is in the order of 10−9 N. The radiation force is partially countered by the gradient force as a result, it drives the cell toward the upper surface of the slide, where friction arises, ultimately prolonging the time the cell remains in the trap.

2.3.4. Gravitational and Buoyancy Force

The gravitational and buoyancy force on the RBC is in the −z and +z direction respectively. The net force on the cell should be
F n e t = ( ρ R B C ρ B ) V g
The result is 1.15 × 10⁻¹³ N.

2.3.5. The Trapping Force

To derive the trapping force, we considered the energy and forces associated with an electric dipole within an elliptical biconcave red blood cell (RBC) subjected to an external electric field. The energy associated with a single dipole within an RBC in an external electric field can be calculated using the formula   u = p · E e x t . where u represents the potential energy, p is the single dipole moment of an RBC, and E is the applied electric field.
p d i p = 4 ε o r m a x 3 ε ε o ε ε 1 E
The polarization, which is the dipole moment per unit volume of an elliptical biconcave RBC.
V o = π 8 t t h i c k A o 1.88 × 10 17 m 3 , ε and ε 1 are the electrical permittivity of RBC and the surrounding medium, which can be written as
P = 4 ε o r m a x 3 V o ε ε 1 ε + ε 1 E
where ttick is the thickness of the RBC, and the potential energy from the single dipole of RBC is d U = P · E d V , and P is the polarization. The potential energy of the entire dipole within the RBC is
U = 4 ε o r m a x 3 V o ε ε 1 ε + ε 1 E 2 d V
E 2 = E o 2 e 2 r t 2 + ρ 2 + 2 r t ρ c o s θ w o 2
where wo is the minimum spot size of the beam and ρ is the vector from the center of the RBC to a point dipole of the segment of RBC.
The force generated by the potential energy stored in the red blood cell can be determined by taking the gradient of the potential energy with respect to position,
F = U
and using the Taylor series expansion and keeping the first term, we can approximate the electrostatic force as
F k r t
where k 64 ε o r m i n r m a x 2 A o n c ε P w w o 4 ε ε 1 ε + ε 1 k is the trap stiffness.

2.3.6. General Equation of Motion as the Trap Is Ejected from the Trap

Based on the outcomes of Equations (1), (3) and (11), the equation of motion for a red blood cell (RBC) being ejected from the trap can be expressed as a damped harmonic oscillator influenced by electrostatic and optical forces. The governing second-order differential equation is:
d 2 r ( t ) d t 2 + β d r ( t ) d t + k r t = q o E o m
where:
  • β = 0.88 μ D is the drag coefficient;
  • k is the trap stiffness;
  • q 0 is the cell charge;
  • E 0 is the amplitude of the electric field;
  • m is the cell mass.
Assuming the RBC begins at rest (zero initial velocity) and is positioned at the center of the trap, the analytical solution to Equation (11) is:
r t = ( q E o / k ) 1 e x p ( β 2 m t ) c o s h β 2 4 k m 2 m t + β β 2 4 k m s i n h β 2 4 k m 2 m t
which describes the time-dependent radial displacement of the RBC from the trap center after ionization.
To determine the RBC mass m , we first approximated its volume by modeling the cell as a spheroid with concave caps. The cell volume VRBC can be estimated based on the measured radius and calculated using [30]:
V R B C = π 4 t ( D 2 D t 16 + t 2 6 )
where D is the diameter and t is the thickness of the RBC.
We used a fixed RBC density of 1.110 g/mL to compute the mass for dose normalization (Methods Section 2.3). In practice, density varies with donor age and RBC age and can be higher in sickled cells (≈1.14 g/cm3). Future work will incorporate density-aware normalization and age stratification (e.g., density fractionation or reticulocyte gating). The mass is then given by   m   =   ρ V . The amplitude of the electric field E 0 at the trap site is calculated from the laser properties as given by Equation (2).
This formulation allows us to model the optical trapping dynamics based on physical parameters such as viscosity, cell geometry, and field strength. While the trap stiffness   k and the charge q developed on the RBC must be extracted from experimental data, the model provides a useful framework for interpreting the observed motion of ejected cells.
The trap stiffness ( k ) and the charge ( q ) developed on each red blood cell can be determined from Equation (12) using the NonlinearModelFit function in Mathematica. The model yields a high degree of accuracy, with an average R2 value of 0.99 across all four hemoglobin variants.
As previously noted, the trap stiffness k is proportional to the cell’s polarization, which is significantly diminished by radiation-induced damage sustained while the cell is held in the optical trap. This residual polarization also depends on the cell’s size and the strength of the polarizing electric field. Importantly, the effect of the electric field weakens as the cell moves away from the trap center due to the Gaussian intensity profile of the laser and the beam waist reduction caused by the high numerical aperture of the microscope objective.

2.3.7. Cell Volume and Mass

Cell volume was computed from image-measured geometry via Equation (14); with RBC density, mass M c follows and was used for dose calculations.

2.3.8. Energy and Dose Metrics (TIE* and TRD*)

During each run the incident power at the sample plane was held constant; across sessions it ranged from 356 to 375 mW due to alignment differences (see Section 2.2). We computed the apparent threshold ionization energy (TIE*) and apparent threshold radiation dose (TRD*) using Equations (14) and (15), respectively. Power definitions and measurement: P trap denotes the optical power at the sample plane (trap site) (measured with a calibrated microsensor at focus) and P transmitted ( t ) is the time-resolved power through the chamber with a trapped cell. The net body force Δ ρ V g (with Δ ρ 0.11   g / mL and V 90 f L   was 10 13 N—three orders of magnitude smaller than axial radiation pressure n P / c 10 10 N at our powers. We therefore neglected the gravity/buoyancy in the in-plane ejection model; as they only set a small axial offset.
Apparent deposited power (no baseline). During each run the incident power at the sample plane P trap ( t ) was held constant; the transmitted power with the cell in the beam is P trans ( t ) . In the absence of a no-cell baseline, we can define the apparent deposited power
P app ( t ) = P trap ( t ) P trans ( t ) ,
and compute apparent energy and dose
T I E * = 0 t ion P app ( t ) d t , T R D * = T I E * M c .
where m c e l l is the cell mass (or an effective mass based on volume  ×  density if mass is not directly measured). These values upper-bound the absolute deposition (objective/chamber losses are included in P app ) but preserve between-variant comparisons because path losses are constant within a session. During each run, the incident power at the trap was held constant ( P trap ); across sessions it varied slightly due to alignment (see Section 2.2). In the representative dataset in Figure 4, we recorded P trap = 0.806   W and a pre-ionization mean transmitted power P trans = 0.640   W , giving an apparent deposited power P app = P trap P trans = 0.166   W .
We interpreted apparent TIE as the total optical energy deposited in the cell up to the onset of escape t i o n —the moment when the electric/ejection force first overcomes the optical trap’s restoring force (and any small opposing term). In our overdamped regime (Re ≪ 1), escape is governed by a force balance, not by an energy-equality:
F e l e c ( t ) lectric / ejection k x t trap   restorin + F 0 small   opposin ,   t = t i o n .
Operationally, we measure
F e l e c ( t ) = γ e f f v ( t ) + k x ( t ) + F 0 ,
using x ( t ) and v ( t ) from the tracking and k , γ e f f , F 0 from the Equation (13) fit. The apparent TIE is what quantifies the photonic energy delivered to the cell up to the instant the threshold inequality is first satisfied. Note that T I E * is not the mechanical work against the trap; in an overdamped fluid the deposited energy is dissipated largely as heat, while the escape condition itself is set by the force balance above. In the overdamped regime (Re ≪ 1), inertia and gravity are negligible over the observed time scales; in-plane escape trajectories are therefore not ballistic and appear locally straight in projection.
For context, we also report the trap’s potential energy at the threshold,
U t r a p t h r = 1 2 k x 2 ( t i o n ) ,
and the ratio ρ = U t r a p t h r / T I E * (dimensionless) to show that T I E * is a biophysical charging/ionization threshold, and not a mechanical energy barrier. Radiation pressure (Equation (4)) sets the axial position; after ionization, the electric/ejection force (Equation (1)) grows along the polarization axis, and at t i o n , exceeds the restoring force k x (Equations (12) and (13)) to initiate escape.
The absorbed component during a run is then obtained from the difference between the incident and transmitted powers. Thus, the integral in Equation (15) represents the energy absorbed by the cell from trapping up to t ion . TRD* (Equation (16)) is computed as the TIE* divided by cell mass M c from Equation (14). (power was monitored at two positions: behind L4 and at the sample plane; the sample-plane power was used for the trap-site term).

2.4. Image Analysis and Tracking

Videos were recorded at Δ t 0.12 s per frame. Pixels were converted to micrometers using a bead-based calibration ( c p x = 0.0727   μ m / p i x e l ; 3.1   μ m beads). Each frame was flat-field corrected and background-subtracted; red blood cells (RBCs) were segmented by adaptive thresholding followed by morphological closing. Per frame we extracted the in-plane centroid and major-axis orientation via ellipse/PCA fitting. Tracks were linked frame-to-frame with the bounded nearest-neighbor association and projected onto the beam-polarization axis to form a 1-D displacement x ( t ) = [ r ( t ) r ( t 0 ) ] e ^ p o l . Velocities for visualization used central differences on lightly smoothed trajectories (window 5 frames), which did not affect the parameter estimates.
We defined three timestamps: t c a p (onset of stable capture), t i o n (ionization/escape onset), and t e x i t (leaving the trap’s linear region). Operationally, t i o n is the first of three consecutive frames for which v ( t ) exceeds a noise threshold determined from pre-ionization motion, and x ( t ) becomes monotonically increasing in the escape direction.
Mechanistic note. Radiation pressure (Equation (4)) sets the axial position; after ionization, the electric/ejection force (Equation (1)) grows along the polarization axis, and at t i o n , exceeds the restoring force k x (Equations (11) and (12)) to initiate escape. Before ionization, radiation pressure positions cells h ≈ 1–3 µm beneath the upper coverslip; we therefore treated near-wall drag implicitly via the fitted effective drag. Our recordings were acquired at ~10 fps ( Δ t 0.10 s). For typical post-ionization time constants ( τ 0.3 1 s), increasing to 50 fps ( Δ t 0.02 s) would reduce the t i o n timing quantization by ~5× and decrease the standard errors in k and γ e f f by ~10–20% (simulation estimate). The effect on TIE* is minimal because P t r a p is constant and P t r a n s ( t ) varies slowly at these scales.

2.5. Parameter Estimation Procedure

Parameter estimation and model form. Post-ionization trajectories x ( t t i o n ) were fit by nonlinear least squares (Levenberg–Marquardt) to the closed-form solution of Equation (12): a single-exponential approach to x with time constant τ = γ e f f / k . Bounds enforced physical constraints on k , γ e f f , and F 0 . Fit quality was summarized by R 2 and parameter standard errors; the median R 2 was [0.992] (IQR [0.97–0.99]) across cells.
Inputs. Time-stamped series { t k } , measured the P t r a p ( t k ) , P t r a n s ( t k ) , and tracked displacement x ( t k ) along e ^ p o l . The ionization time t i o n was identified from the kinematics (see Section 2.3).
Steps.
  • Construct P a b s ( t k ) using the boxed equation above.
  • Choose the fitting domain. Use data from t t i o n (post-ionization ejection).
  • Model choice. Fit either the velocity form
v m o d e l ( t k ) = μ e f f [ κ P a b s ( t k ) F 0 ]
to smoothed finite-difference velocities, or the displacement form
x m o d e l ( t k ) = x ( t i o n ) + μ e f f j : t j [ t i o n , t k ] [ κ P a b s ( t j ) F 0 ] Δ t
using trapezoidal integration (preferred when noise makes differentiation unstable).
4.
Parameters. θ = { κ , γ e f f , F 0 , x ( t i o n ) } with constraints κ 0 , γ e f f > 0 .
5.
Estimation. Nonlinear least squares (Levenberg–Marquardt) minimizing k ( x d a t a ( t k ) x m o d e l ( t k ) ) 2 (or the analogous sum for velocities).
6.
Pooling strategy. Because optical geometry is shared within an experiment, κ is estimated globally across cells from the same run, while γ e f f and F 0 vary per cell to capture near-wall and morphological variability.
7.
Uncertainty. Report fit SEs and mean ± SD across cells. Goodness of fit (RMSE and R 2 ) is summarized in the Section 3.
8.
Derived quantities. Using the same P a b s ( t ) , compute TIE* (integral up to t i o n ) and TRD* ( T I E * / m c e l l ) for each cell; then report the group means ± SD by variant.

3. Results

Using the captured images of the cells before they were trapped, the maximum and minimum diameter of the RBCs were measured. In our study, we approximated the trapped RBCs as elliptical bi-concave shapes to calculate their volumes individually. This approximation allowed us to determine the volume of each cell. Using the commonly accepted density of red blood cells, which is 1.110 g/mL [28,31], we were able to determine the mass of each cell across the four distinct blood samples. The calculated masses were 9.66 × 10⁻¹⁴ kg, 9.82 × 10⁻¹⁴ kg, 6.63 × 10⁻¹⁴ kg and 6.54 × 10⁻¹⁴ kg for Hb AS, Hb AC, Hb FSC and Hb FA, respectively.

3.1. Data Analysis

In the HPLC analysis of the male parent, hemoglobin quantitation revealed Hb AS with 42.8% Hb S and 52.3% Hb A, while the female parent had Hb AC with 41.09% Hb C and 55.4% Hb A. These findings indicate that both parents carry sickle cell traits (SCT), as nearly half of their hemoglobin consisted of abnormal, genetically mutated genes (S and C).
For the infant daughter, hemoglobin quantitation showed Hb FA with 70.1% Hb F and 29.1% Hb A, indicating that she had a normal hemoglobin profile. In contrast, the infant son’s quantitation revealed Hb FSC with 82.6% Hb F, 7.1% Hb S, and 7.1% Hb C, indicating the presence of sickle cell anemia (SCA), as he carries two abnormal, genetically mutated hemoglobin genes (S and C). Pairwise comparisons used two-sample t-tests; equality of variances was assessed by Levene’s test, and Welch’s t-test was used where variances were unequal. We used α = 0.05 for significance. Where shown on the figures, significance markers were *, p < 0.05 ; **, p < 0.01 ; and ***, p < 0.001 .
Table 2, shows the measurements for TRD*, TIE*, radius, and Z-number (charge number = charge of RBC/electron charge) for each of the four samples Hb AS (male, 38 years), Hb AC (female, 30 years), Hb FSC (male 75 days, baby), and Hb FA (female 82 days, baby). TRD* and TIE* across the four study groups provided a comprehensive view of intergroup variation in radiation response characteristics.
For TRD*, the mean values revealed a generational trend with infants exhibiting higher thresholds than adults. Fathers demonstrated a mean TRD* of 0.75 J/ng (SD = 0.40, SE = 0.056, 95% CI [0.66, 0.85]). Mothers had a slightly higher mean TRD* of 0.89 J/ng (SD = 0.49, SE = 0.075, 95% CI [0.73, 1.05]). Notably, Baby Boys showed a marked increase in TRD*, with a mean of 1.31 J/ng (SD = 0.72, SE = 0.102, 95% CI [1.15, 1.47]), and Baby Girls had the highest mean TRD* at 1.42 J/ng (SD = 0.890, SE = 0.13, 95% CI [1.20, 1.64]). These findings suggest that infants may possess greater tolerance to radiation exposure, potentially due to differences in cellular structure, hemoglobin content, or DNA repair mechanisms, though further mechanistic investigation is warranted.
Similarly, the TIE* results support this generational distinction. Fathers exhibited a mean TIE* of 178.00 mJ (SD = 86.93, SE = 12.29), with a 95% CI of 153.42 to 202.58. Mothers followed closely with a mean of 183.78 mJ (SD = 81.39, SE = 11.51, 95% CI [160.76, 206.80]). In the infant group, Baby Boys displayed a mean TIE* of 190.02 mJ (SD = 117.68, SE = 16.64, 95% CI [156.74, 223.30]), while Baby Girls had the highest mean TIE* at 201.90 mJ (SD = 107.98, SE = 15.27, 95% CI [171.36, 232.44]). These results indicate a modest but consistent increase in TIE* in the younger population. The broader confidence intervals in TIE*, particularly among infants, also reflect greater variability in response due to cell size variation within the group. Taken together, the results underscore statistically and biologically relevant differences between age groups, with infants exhibiting both higher TRD* and TIE* than adults.
The charge measurements for the various hemoglobin (Hb) variants exhibited notable differences. Hb AS had a mean charge of 2891.71 ± 1116.28 (SE = 140.63, 95% CI = [2610.60, 3172.82]), while Hb AC showed a higher mean charge of 3149.23 ± 1195.17 (SE = 174.47, 95% CI = [2798.38, 3500.08]). The mean charge for Hb FSC was 2971.38 ± 1014.17 (SE = 127.81, 95% CI = [2715.80, 3226.96]), and for Hb FA, the mean charge was 2428.87 ± 814.38 (SE = 102.64, 95% CI = [2223.61, 2634.13]). Additionally, the charge-to-volume ratios varied across the groups. Hb AS had an average charge/mass ratio of 13.79 ± 4.64 (SE = 0.71, 95% CI = [12.96, 15.96]), while Hb AC had a slightly higher mean ratio of 16.83 ± 3.98 (SE = 0.66, 95% CI = [15.18, 17.76]). Hb FSC exhibited a significantly higher charge/mass ratio with a mean of 23.34 ± 8.33 (SE = 1.27, 95% CI = [20.53, 25.49]), and Hb FA had an intermediate value of 18.56 ± 6.42 (SE = 0.98, 95% CI = [16.90, 20.74]). These variations in charge and charge-to-mass ratios suggest distinctive electrostatic properties among the hemoglobin variants, which could provide valuable insights into their structural and functional characteristics.
The analysis of hemoglobin quantification based on the charge magnitude in both adult and infant blood samples is presented in Table 3, which includes the hemoglobin variants Hb AS, Hb AC, Hb FSC, and Hb FA. The average charge number for healthy hemoglobin (Hb AA) was determined to be 1711.75 ± 648.67 z-units. Using this as a reference, the proportions of Hb C and Hb S in the adult samples were calculated. The results showed that in the Hb AS sample, Hb S accounted for 42.94% of the total hemoglobin, while Hb A made up 57.04%. In the Hb AC sample, Hb C represented 45.82%, with Hb A comprising 54.17%. These findings provide a clear quantification of the hemoglobin variants relative to Hb AA in adult blood samples. For infant samples, Hb FSC consisted of 76.98% Hb F, with Hb C and Hb S contributing 11.51%. In the Hb FA sample, 74.43% was Hb F, and 20% was Hb A. These data offer valuable insights into the distribution of hemoglobin variants in infant blood relative to Hb F.

3.1.1. Trajectories of Optically Trapped RBC Motion from Four Blood Samples as a Function of Time

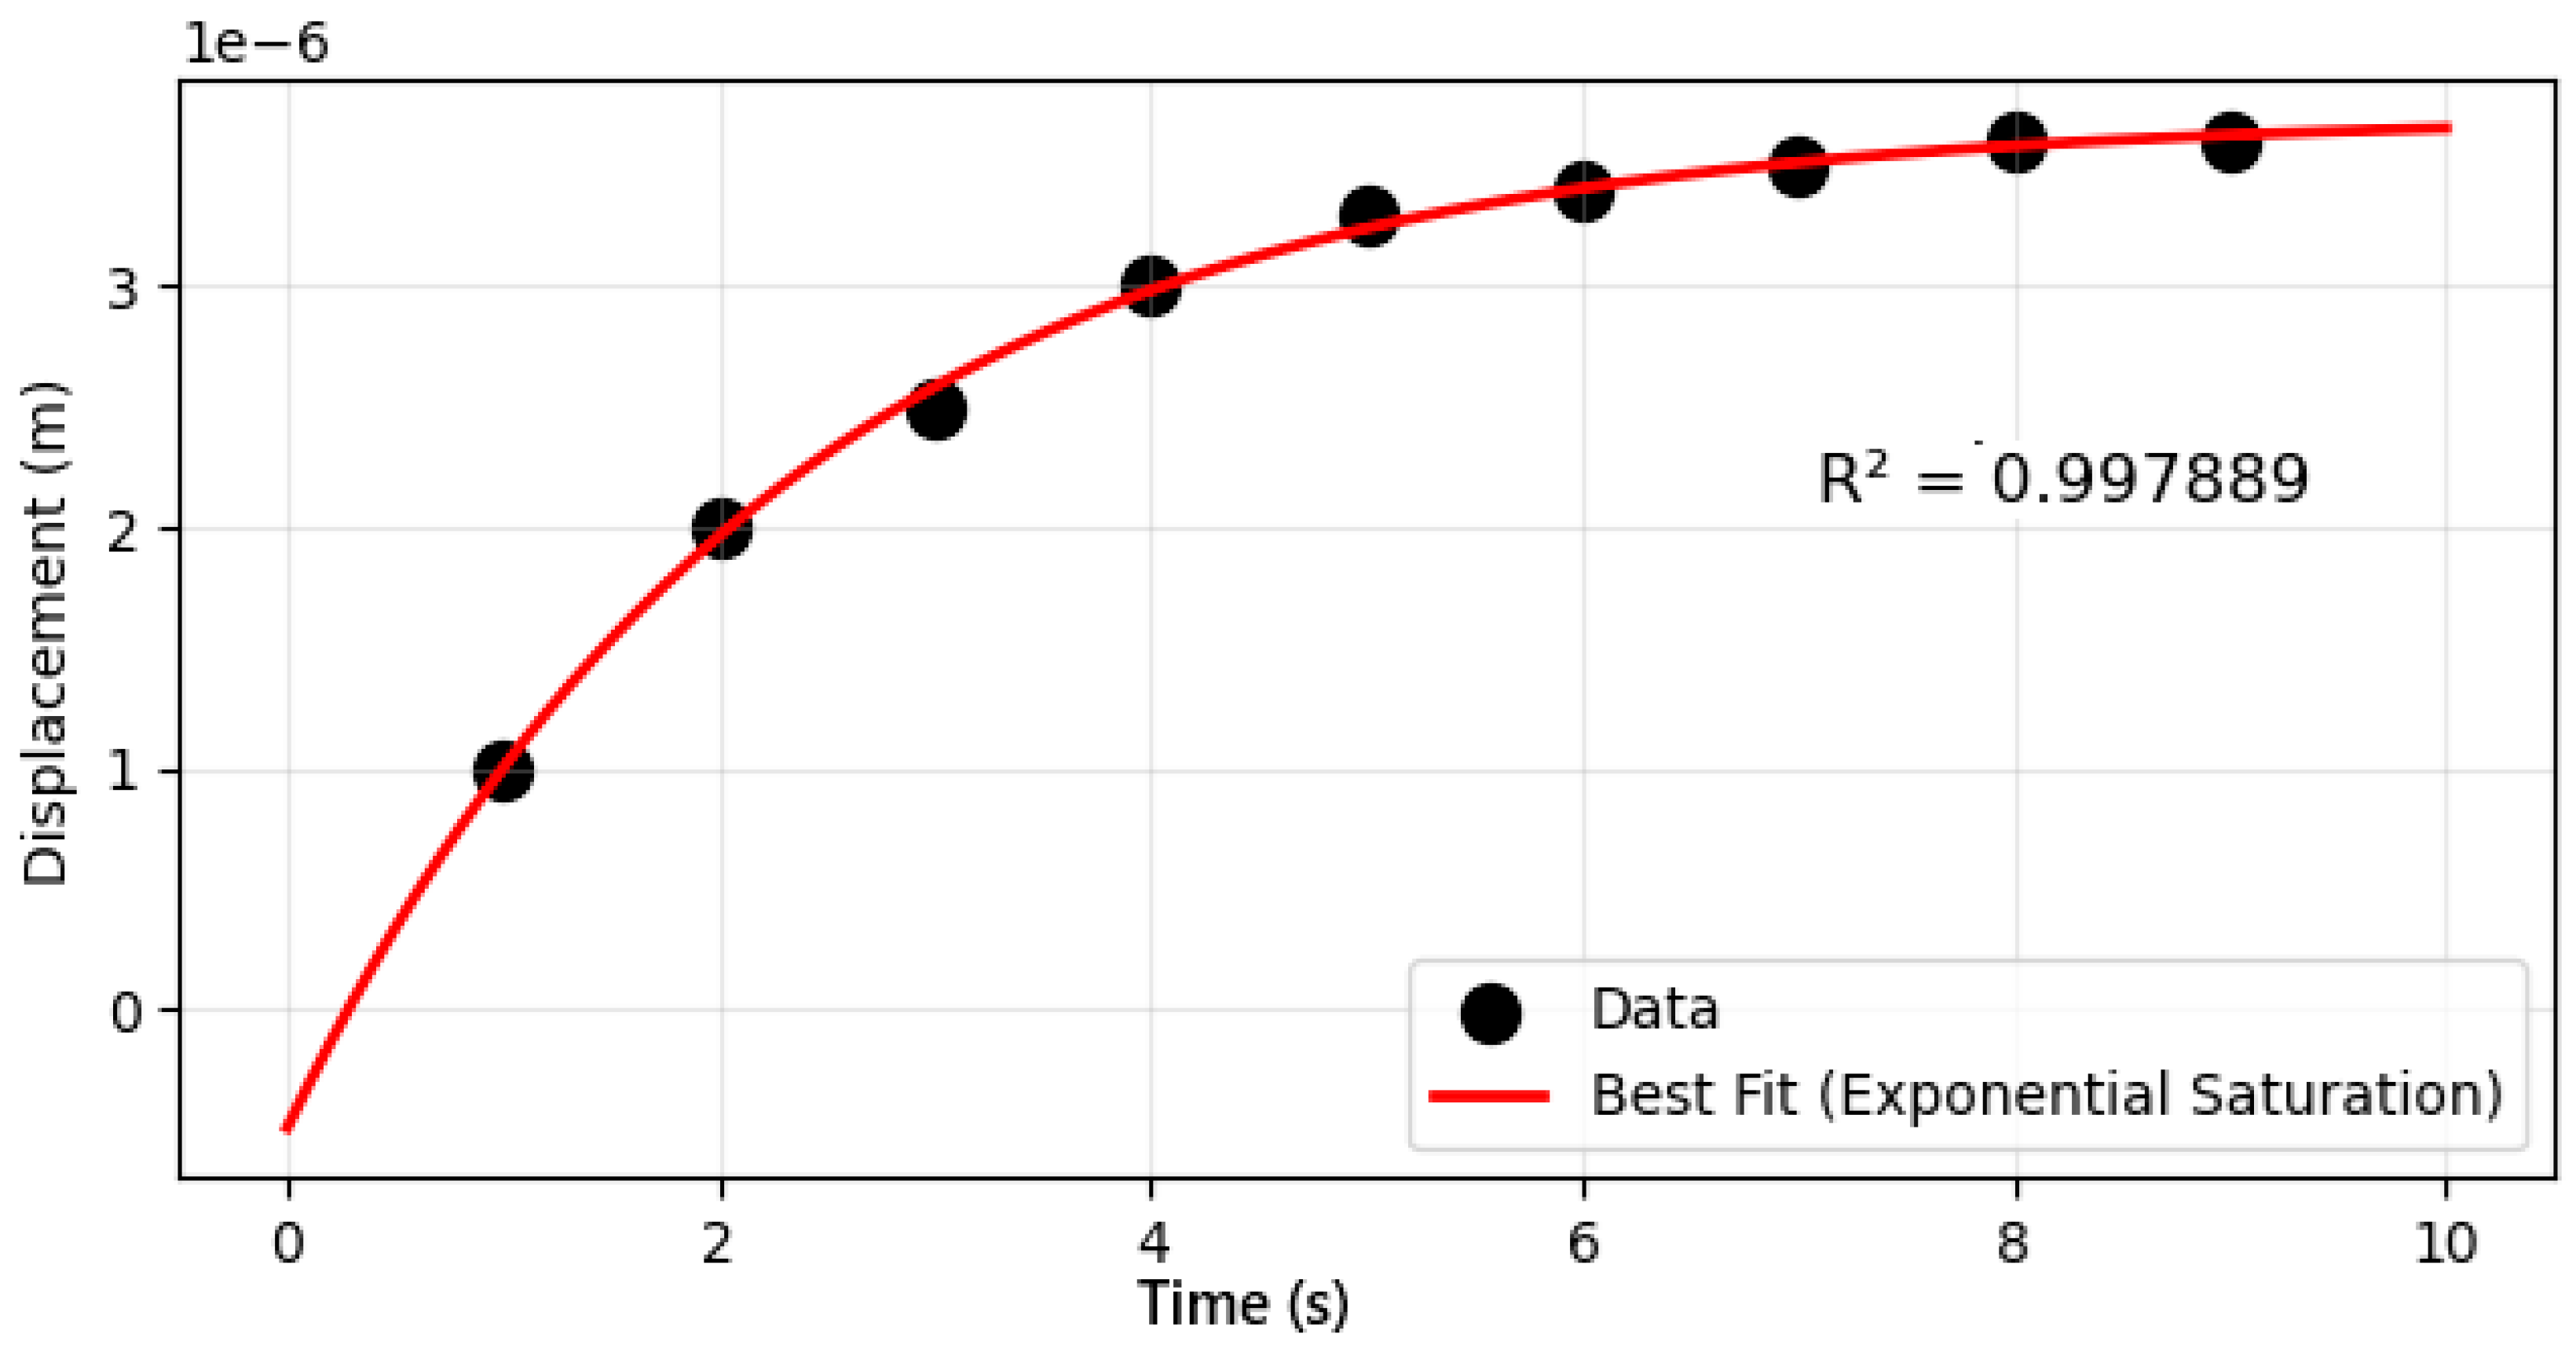
Figure 4 the scattered presents the experimental displacement trajectory of a single red blood cell (RBC) after being ejected from an optical trap. The data points illustrate how the cell moves away from the trap, initially experiencing rapid displacement due to the release of optical trapping forces, followed by a gradual deceleration as hydrodynamic drag dominates the motion. The trajectory may also reflect minor influences from electrostatic interactions, particularly if the RBC membrane carries a net charge or if the surrounding medium contains ions that induce repulsive or attractive forces. Variability in the experimental data likely arises from factors such as Brownian motion, cell deformation, and heterogeneity in cellular properties, which introduce noise and deviations from an idealized path.
In contrast, Figure 4 the solid line displays the theoretically predicted displacement based on a model incorporating optical, drag, and electrostatic forces. The optical force component, which initially confines the cell, diminishes rapidly upon trap release, while the drag force modeled by Stokes’ law opposes motion proportionally to the cell’s velocity and medium viscosity. Electrostatic forces introduced push the cell way from the trap. The theoretical curve typically exhibits a smooth, exponential-like decay, assuming a biconcave cell shape, uniform medium properties, and negligible inertial effects. A close agreement between the experimental and theoretical plots would validate the model’s assumptions, whereas discrepancies could highlight unaccounted complexities such as non-Newtonian fluid behavior, cell asymmetry, or dynamic charge interactions. Together, these graphs provide insight into the balance of forces governing RBC dynamics post-ejection, bridging experimental observations with physical principles.
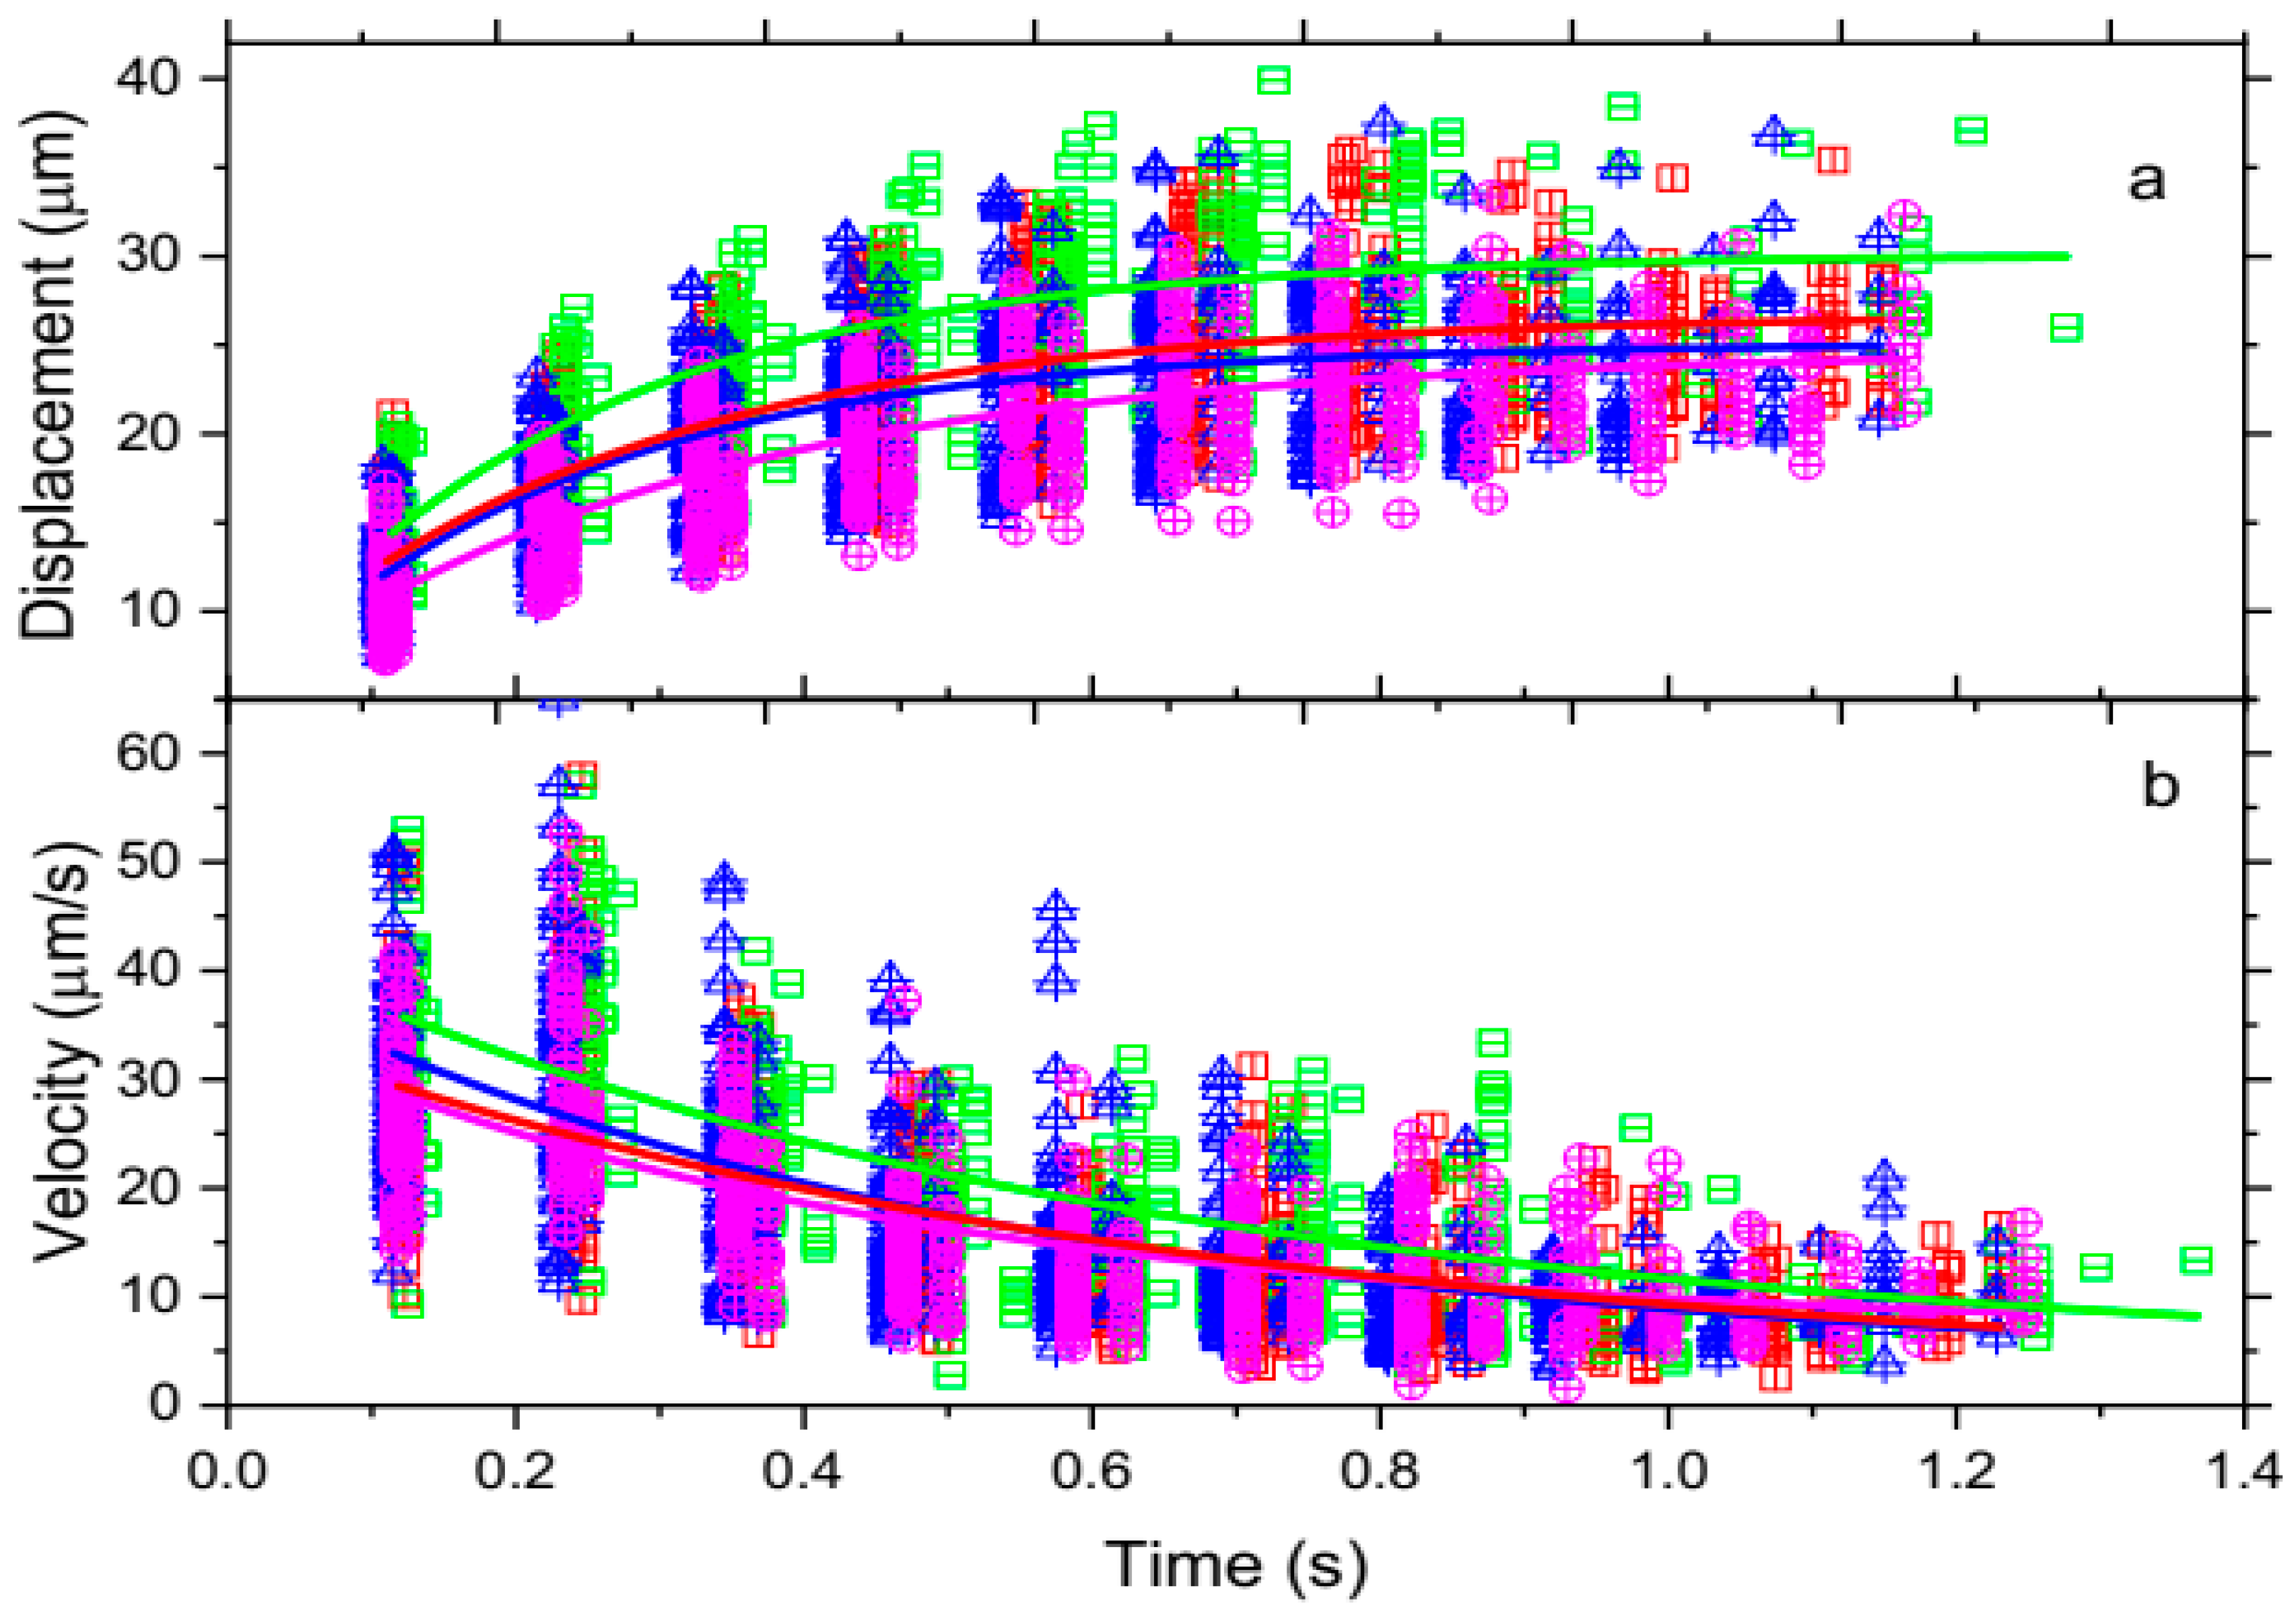
It is important to note that RBC displacement data were collected from randomly selected cells of varying sizes, without enforcing uniformity in cell size. Each panel in Figure 4 represents the same hemoglobin type but RBCs of different sizes. The observed sparseness in data values within the same hemoglobin type arises from charge differences among the cells, which are inherently linked to variations in RBC size. Since cell size plays a critical role in charge development, the charge distribution across the RBCs varies, contributing to the spread observed in the data points.
Figure 5a,b presents the theoretical displacement r(t) and velocity v(t) as functions of time for different hemoglobin variants (Hb AS, Hb AC, Hb FSC, and Hb FA), demonstrating the response of hemoglobin-variant red blood cells to optical forces and laser-induced ionization, and confirming the experimental results shown in Figure 6. The initial rapid increase in displacement followed by saturation suggests a dynamic equilibrium between the applied radiation pressure and the internal restoring forces. The larger displacements observed for Hb AC and Hb AS cells indicate lower effective charge-to-mass ratios or higher polarizability relative to Hb FSC and Hb FA. The displacement trend (Hb AC > Hb AS > Hb FSC > Hb FA) highlights how structural variations among hemoglobin types influence optical force coupling, ionization dynamics, and momentum transfer under external electromagnetic fields.
Correspondingly, the velocity profiles showed a rapid initial response followed by exponential decay, reflecting the immediate acceleration under optical and electrostatic forces and subsequent energy dissipation governed by the cells’ viscoelastic properties. Higher initial velocities for Hb AC and Hb AS suggest greater net optical forces or reduced internal mechanical resistance compared with Hb FSC and Hb FA. Over time, all variants approached a low steady-state velocity, indicating a damping regime dominated by the mechanical properties of the membrane. The observed velocity hierarchy (Hb AC > Hb AS > Hb FSC > Hb FA) further implies differences in biophysical characteristics such as deformability, mass distribution, and membrane fluidity among the hemoglobin variants, impacting their dynamic behavior under external perturbations.
The data in Figure 5 were fitted using nonlinear curve fitting models to represent the velocity and acceleration graphs for the hemoglobin variants Hb AS, Hb AC, Hb FSC, and Hb FA. Each dataset exhibited distinct charge numbers corresponding to the respective hemoglobin variants. Additionally, 62 data points for each variant were plotted without applying any data reduction method. Figure 6 compares displacement versus time in panel (a) and velocity versus time in panel (b) for the four hemoglobin types, with all data points scattered across both panels. The motion of ejected charged RBCs is governed by electrostatic, drag, and trapping forces. The drag and trapping forces work together to limit RBC cell displacement, as shown in Figure 5a. Simultaneously, the ejected cells experience a charge drop due to radiative damping or recombination. As a result, the velocity of the cells gradually reduce from their initial maximum speed to a resting condition, which was observed in Figure 6b. The velocity–time graph provides a clear distinction among the hemoglobin types: Hb AC exhibited the highest speed among the four samples, followed by Hb FSC and then Hb AS. Interestingly, the velocity–time depiction discerns Hb FA, characterized by healthy hemoglobin, as having the slowest speed among the observed hemoglobin variants. Residual gaps between the theoretical and experimental trajectories are expected from near-wall hydrodynamics (increased drag vs. free Stokes) and time-dependent charge recombination not captured by the simple model.

3.1.2. Laser-Induced Ionization Dynamics of Single Red Blood Cells

As defined in the Methods, Section 2.3.7, we computed TIE* and TRD* using Equations (14) and (15) from the measured P trap ( t ) , P trans ( t ) , and M c ; values reported here are apparent (no baseline). Radiation pressure (Equation (4)) sets the axial position; after ionization, the electric/ejection force (Equation (1)) grows along the polarization axis, and at t i o n , exceeds the restoring force k x (Equations (11) and (12)) to initiate escape.
Displaying the TIE* and TRD* as functions of cell radius offers a visual representation of how these thresholds vary concerning the size of the cells. Creating a graph with cell radius on the x-axis and TIE*/TRD* values on the y-axis provides a clear illustration of how these energy thresholds change concerning cell size.
The results in Figure 7a–d display the TIE* and TRD* versus radius of the four hemoglobin variants. To clearly determine the relationship between TIE* and TRD* with the radius of RBCs, we performed a statistically valid data reduction using the graphical data analysis software Origin 2024. The reduced data are shown in Figure 7a,b for the TRD* and TIE*. In this statistical reduction method, we first sorted the data by radius in ascending order. Then, a reduction was made by subgrouping the data with radius-increment and calculating the average radius, TIE*, and TRD* for each subgroup. These results are shown in Figure 7a,b for TRD* and TIE*, respectively. The full dataset presented in Figure 7c,d revealed a clear trend: TRD* decreases while TIE* increases with increasing RBC radius. This correlation is consistent with previously reported biomechanical patterns observed in malignant cell lines, indicating that similar physical principles may underlie cellular deformation across various cell types [23,24,31]. The reduced data in Figure 7a,b demonstrated a clear discrimination between all four hemoglobin variants (Hb AS, Hb AC, Hb FSC, Hb FA) through their distinct TRD* and TIE* profiles. Additionally, utilizing pie charts can visually represent the proportion or distribution of TIE* and TRD*, as seen in Figure 7e,f respectively. This visualization method helps in understanding how the TIE* and TRD* values are distributed among the different hemoglobin variants.
We compared the TRD* across fathers, mothers, baby boys, and baby girls using two-sample t-tests for each pair; the equality of variances was assessed (Levene’s test), and Welch’s t-test was used when variances were unequal. Significant pairwise differences in TRD* were observed for father vs. mother (p = 0.007), father vs. baby boy (p = 0.0001), father vs. baby girl (p = 0.0001), mother vs. baby girl (p = 0.001), and baby boy vs. baby girl (p = 0.01); mother vs. baby boy was not significant (p = 0.23). As a global check, a one-way ANOVA across the four groups supported the presence of between-group differences. TIE* did not differ significantly between groups at α = 0.05 .
In contrast to TRD*, the analysis of TIE* parameters among the four groups did not reveal statistically significant differences at the 0.05 level, suggesting similar TIE* profiles across all groups.
Principal component analysis of the variables (Hb AS, Hb AC, Hb FSC, Hb FA) revealed that the first two principal components explained 60.6% of the total variance (PC1: 33.2%, eigenvalue = 1.330; PC2: 27.4%, eigenvalue = 1.094), both exceeding the Kaiser criterion (eigenvalue > 1). The scree plot in Figure 8 showed a characteristic elbow after the second component, supporting the retention of these two meaningful dimensions. The eigenvector analysis revealed that PC1 was dominated by strong positive loading from Hb FA (0.643) and moderate positive loading from F (0.359), contrasting with negative loadings from Hb AC (−0.532) and B (−0.417).
PC2 showed a distinct pattern with positive loadings from both Hb AS (0.688) and Hb AC (0.562), opposing negative loadings from Hb FSC (−0.419) and Hb FA (−0.191). Visualization of the biplot in Figure 8 clearly demonstrated these relationships, showing Hb FA and Hb FA vectors oriented in the positive PC1 direction while Hb AC and Hb FSC vectors were pointed negatively. Along PC2, Hb FA and Hb AC vectors projected positively, forming a distinct quadrant separate from Hb FSC and Hb FA. This orthogonal separation in the biplot space suggests that these principal components capture independent sources of variation in the data. The remaining components (PC3: 22.6%, PC4: 16.8%) each explained progressively smaller portions of variance.
Moving on to Figure 7b,d, these graphs show TIE* versus radius, with the maximum radius demonstrating a rise in TIE*. Similarly, hemoglobin Hb AS and Hb AC require the least TIE*, whereas Hb FA ionizes with high energy. In Figure 7e,f, pie charts illustrate the distribution of TRD* and TIE* respectively. The percentages for Hb AS (red), Hb AC (green), Hb FSC (blue), and Hb FA (magenta) in the TRD* pie chart were 18.44%, 19.91%, 29.58%, and 32.07% respectively. For TIE*, the corresponding percentages were 23.62%, 24.38%, 25.21%, and 26.79%. Notably, the findings in both the TRD* and TIE* pie charts aligned with those obtained from the reduced data shown in Figure 7a,b.

3.1.3. Charge Profiles of Single Hemoglobin Variants

As previously mentioned, the NonlinearModelFit function was used to determine the trapping coefficient and the charge developed on each cell. In Figure 7a, it is evident that the charge developed in the RBCs of babies with hemoglobin types Hb FSC and Hb FA showed little change with cell size. Conversely, for the RBCs of the father (Hb AS) and mother (Hb AC), the charge increased with cell size. This suggests a size-dependent effect on the charge developed in RBCs, varying between hemoglobin types, potentially indicating distinct physiological or biochemical characteristics.
In Figure 7, the charge distribution for various ionized hemoglobin (Hb) is expressed in Z numbers (e = 1.602 × 10⁻¹⁹ C). Pairwise differences in the charge-to-volume ratio were tested using two-sample t-tests (Welch’s correction when variances were unequal). Significant differences were observed for father vs. baby boy (p = 0.0001), father vs. baby girl (p = 0.012), mother vs. baby boy (p = 0.0001), mother vs. baby girl (p = 0.0009), and baby girl vs. baby boy (p = 0.04); father vs. mother was not significant (p = 0.09).
For charge only, most pairwise comparisons were not significant (father vs. mother p = 0.44, father vs. baby boy p = 0.32, baby girl vs. baby boy p = 0.40, mother vs. baby boy p = 0.09), borderline for father vs. baby girl (p = 0.07), and significant for mother vs. baby girl (p = 0.01).
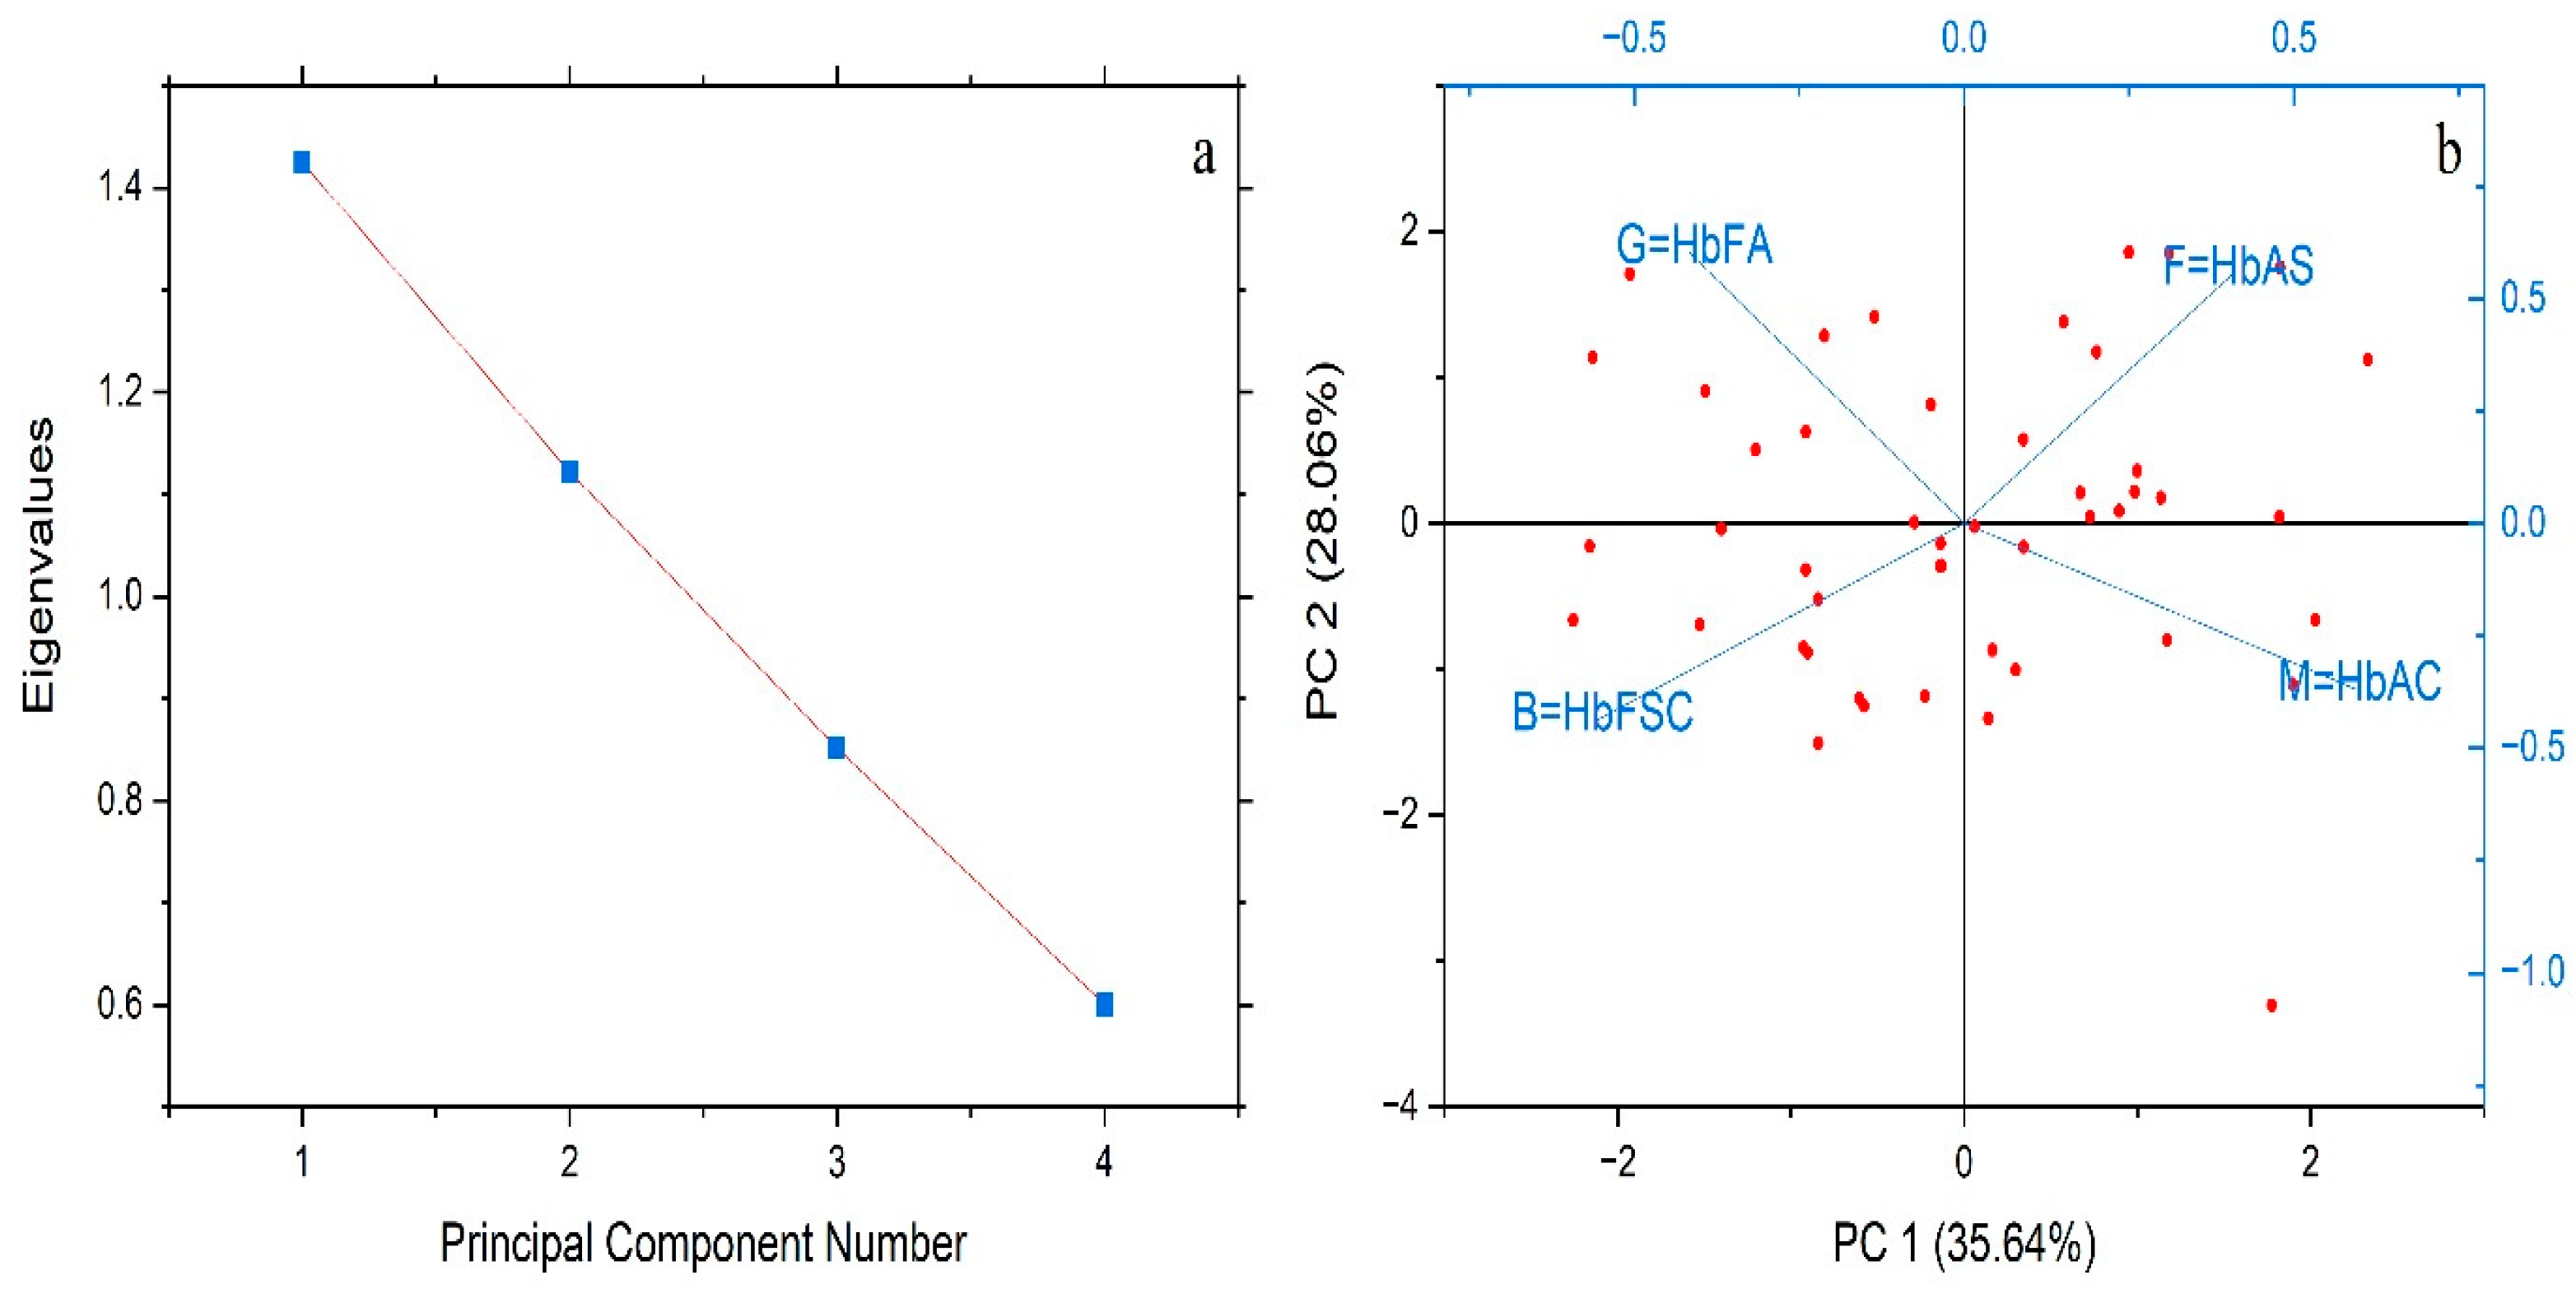
Principal component analysis (PCA) of the standardized variables (Hb AS, Hb AC, Hb FSC, Hb FA) revealed that the first two principal components explained 63.7% of the total variance (PC1: 35.6%; PC2: 28.1%), with eigenvalues of 1.425 and 1.122 respectively, both exceeding the Kaiser criterion threshold of 1. PC1 was characterized by positive loadings from HbAC (0.593) and Hb AS (0.408) and negative loadings from Hb FSC (−0.555) and Hb FA (−0.417), representing a contrast between these variable pairs. PC2 showed a different pattern, with positive loadings from Hb FA (0.603) and Hb AS (0.557) and negative loadings from Hb FSC (−0.436) and Hb AC (−0.368). The scree plot (Figure 9a confirmed the significance of the first two principal components, exhibiting a distinct elbow after PC2, beyond which additional components contributed minimally to the total variance. Visualization of the results through a biplot (Figure 9b demonstrated distinct clustering patterns, with Hb AC and Hb AS variables projecting positively along PC1 while Hb FSC and Hb FA were oriented negatively, providing clear separation of these variable influences in the reduced dimensional space. The remaining components (PC3 and PC4) accounted for only 36.3% of the variance (21.3% and 15.0% respectively) and were not considered.
The observed significant standard deviations in the charge distribution across cells can indeed be attributed to considerable variations in cell sizes. The diverse sizes among these cells play a crucial role in the broader range of charge distributions observed within each hemoglobin variant. This variability in size significantly affects how these red blood cells (RBCs) interact with the laser beam, altering their ionization levels and subsequently leading to more pronounced differences in the measured charges expressed in Z numbers. The interaction between the varying sizes of RBC types and the laser beam directly influences the ionization process, creating variations in the charges observed and contributing to the larger deviations in their distribution.
The data presented in Figure 10a,b showed a dissimilarity in the slopes observed within the linear fittings corresponding between infants and adults. This discrepancy in slope between the two age groups denotes a considerable divergence in the relationship between the charge developed and size of RBCs, potentially indicating distinct physiological or developmental characteristics influencing the charge distribution within red blood cells. Further investigation into these differing trends may unveil crucial insights into age-specific variations in cellular behavior or hemoglobin-related properties, providing valuable information for diagnostic or developmental studies.
In the displayed figures, specifically, the data in Figure 10 concerning the diameter, charge (expressed in Z numbers), and charge density (Z number/volume) for all four red blood cells (RBCs) samples, are presented. Figure 10c,d displays the complete dataset for the four hemoglobin types, while Figure 10a,b shows the reduced data obtained using the same method used in the Figure 7 reduction method. In Figure 10b, the linear fitting demonstrates that the charge density exhibits a decreasing pattern corresponding to the cell size. Interestingly, the slope of the parents were larger compared with the babies. This observation implies that as the size of the cell increases, the charge density decreases, suggesting a distinct relationship between the cell size and the distribution of charge within the cell.
Moreover, the steeper slope observed for the parental variants of hemoglobin compared with the babies’ hemoglobin suggests a more pronounced or rapid decline in charge density concerning the increase in cell size for the parental variants. This discrepancy in slope between parental and offspring hemoglobin could signify differing ionization properties or charge distributions within the RBCs of these respective groups.

4. Discussion

This study demonstrates that hemoglobin variants can be distinguished at the single-cell level using laser trapping to measure the TIE*, TRD*, and charge development. By focusing on these biophysical parameters, our results highlight measurable differences between hemoglobin types that are consistent with, but complementary to, established techniques such as HPLC and electrophoresis. Importantly, we frame this as a proof-of-concept validation of the LT approach, recognizing that the small sample size limits broad generalization. Nonetheless, the data provide evidence that TRD* and charge-to-volume ratios in particular may serve as sensitive biophysical markers for hemoglobin heterogeneity.
Hemoglobin variations, such as Hb A, Hb S, and Hb C, differ in ionic charge due to unique mutations in the beta-globin chain. Hb C differs from Hb A and Hb S has a higher positive charge [32]. Hb S inserts a hydrophobic valine residue at the same location as Hb C, resulting in less change in the overall positive charge. The alteration from a negatively charged glutamic acid to an uncharged valine in the beta chain of hemoglobin does indeed lead to changes in the overall charge of the hemoglobin molecule [32]. This mutation causes a reduction in the net negative charge of the hemoglobin molecule, as valine is uncharged while glutamic acid carries a negative charge at physiological pH.
The mutation of Hb C increased in positive charge within the hemoglobin molecule. Lysine is a positively charged amino acid at physiological pH due to its amino group, which carries a positive charge. This change in the beta chain of hemoglobin leads to an increase in the overall positive charge of the hemoglobin molecule. Hb S having larger cross sections for monomer, dimer, and tetramer ions, along with higher levels of hydrogen-deuterium exchange (HDX) in tetramer ions compared with Hb A and Hb F, is quite significant in understanding the structural and chemical differences among these hemoglobin variants [33]. This suggests that, Hb S molecules occupy a larger area compared with Hb A and Hb F molecules when interacting with an ionizing agent.
The analysis from Figure 8e and Table 2 illustrates a distinct order in the average charges of different hemoglobin types, consistent with results from the HPLC analysis. Hb AC exhibited the highest average charge, attributed to its higher C hemoglobin concentration, aligning with the findings [34]. Following this pattern, Hb FSC showed a moderately lower charge due to a slightly lower C hemoglobin concentration compared with Hb AC. Additionally, the comparison between Hb AS and Hb FA highlighted a higher charge for Hb AS, attributed to the larger surface area occupied by Hb S molecules during interaction with an ionizing agent, which agrees with the result, differing from Hb A and Hb F. These findings underscore how hemoglobin concentration and molecular interactions with ionizing agents contribute to the observed charge distinctions among various hemoglobin types.
Electrophoresis is used to separate hemoglobin variants by putting a specimen on a gel or supporting medium and an applying an electric field. Under a given pH, every hemoglobin will have an assigned net charge and travel to the opposite pole. Migration rate depends on the size of the charge, with highly charged hemoglobins migrating the fastest [35].
Alkaline electrophoresis (8.4–8.6 pH) is a standard screening test. All of them had various net negative charges at this pH and migrated toward the positive pole (anode). The most positively charged among the four was Hb A and it migrated the farthest. HbS was less negatively charged than HbA and migrated farther and farther until it reached the end near the center. Hb C with a positively substituted lysine, was most least negatively charged and migrated the slowest among the four. Acid electrophoresis (6.0–6.2 pH) was employed as a confirmatory test. In this acidic pH, the relative charges of the hemoglobins are altered, hence one can dissociate variants that co-migrate on alkaline electrophoresis (e.g., Hb S and Hb D). This provides a higher specificity for an individual’s diagnosis [36].
Analytical performance for the quantification of Hbs A, S, C, and F was assessed using clinical blood samples. The method showed high precision, with all coefficients of variation (CVs) below 3%, and a broad analytical measuring range for each variant (A: 2–86%, F: 1–89%, S: 5–90%, C: 3–92%). These results were consistent with, and in some cases exceeded, those obtained with traditional methods [37].
Indeed, measuring the charge developed on different RBC hemoglobin types provides a means to identify based on the quantification of charge magnitudes. This method offers a way to differentiate and categorize hemoglobin variants by assessing their specific charge magnitude. Various adult hemoglobin types show a direct relation between charge development and cell size, while in infants, charge development in red blood cells is not significantly linked to cell size. This dissimilarity in charge development between adult and infant hemoglobin implies unique characteristics in infants that separate charge development from cell size. These differences suggest distinctive physiological or developmental traits in infants that impact how charge develops in their red blood cells. Due to this the identification and quantification of hemoglobin were measured using charge number and not charge density.
The key advantage of our laser trapping technique over the existing methods lies in its ability to measure the charge and ionization energy of individual cells. This capability offers additional insights into hemoglobin structural variants, which are challenging to detect using other techniques.
The study involved a small sample size, as the primary aim was to assess the precision and applicability of the laser trapping technique in hemoglobin quantification. The focus was not on conducting an extensive clinical study, but rather on validating the instrumentation for future applications. Additionally, our current study focused on identifying and quantifying structural hemoglobin variants using a laser trapping technique. While oxidized/reduced and glycated hemoglobin are clinically significant, the current technique’s sensitivity to subtle chemical modifications limits our ability to detect these forms. Future work will aim to adapt the methodology, potentially integrating spectroscopic techniques, to expand the detection capabilities to include these modified hemoglobin types.
While techniques like HPLC, spectrophotometry, and electrophoresis are useful for quantification, they lack the sensitivity to measure physical parameters such as charge and ionization energy capabilities unique to our laser trapping method. Additionally, this approach could complement these techniques in clinical settings where more detailed hemoglobin analysis is necessary.
A major limitation of this study is that the analysis was restricted to samples from a single family and a single collection event. This narrow design was intentional, as the goal was not clinical generalization but to establish a tightly controlled proof-of-concept validation of the LT method. Future studies must extend this approach to larger and more diverse cohorts, ideally across multiple centers, to determine its true diagnostic utility. Future studies with larger and more diverse cohorts will be essential to validate the broader applicability of the technique. We stress that this study represents a preliminary proof-of-concept, intended to establish feasibility rather than provide definitive clinical validation.

5. Conclusions

This study establishes laser trapping (LT) as a proof-of-concept technique for analyzing hemoglobin variants at the single-cell level. By measuring TRD*, TIE*, and charge-to-volume ratios in red blood cells (RBCs), we demonstrated that these parameters can successfully discriminate between Hb A, Hb F, Hb S, and Hb C. Our findings also revealed meaningful differences between adults and infants, with infant RBCs showing distinct trends in charge development that were not strongly linked to cell size, suggesting possible developmental or physiological influences.
Importantly, this method provides complementary insights into HPLC, electrophoresis, and spectrophotometry by directly quantifying physical parameters such as charge and ionization energy—properties that are not accessible with current gold standards. The ability to capture single-cell variability offers an additional level of sensitivity that may be valuable for identifying hemoglobin heterogeneity in clinical contexts.
While the present work was limited to samples from a single family, it validates the feasibility of LT for variant-specific analysis. Future studies must expand to larger, more diverse populations to confirm the broader applicability of this approach. Moreover, adapting LT to detect chemically modified hemoglobin species, including oxidized and glycated forms, could significantly enhance its clinical utility.
Taken together, these findings highlight LT as a promising platform for hemoglobinopathy research and potential diagnostic development. With refinement and validation, this technique could contribute to earlier detection, improved monitoring, and more personalized treatment strategies in conditions such as sickle cell disease and thalassemia.

Author Contributions

Conceptualization, D.B.E.; Methodology, E.M.E., D.A.A. and D.B.E.; Software, E.M.E.; Validation, H.T.C., E.M.E. and D.B.E.; Formal analysis, H.T.C., E.M.E., D.A.A. and D.B.E.; Investigation, E.M.E. and D.A.A.; Resources, D.B.E. and E.M.E.; Writing—original draft preparation, H.T.C., E.M.E., D.A.A. and D.B.E.; writing—review and editing, H.T.C., E.M.E., D.A.A. and D.B.E.; Visualization, H.T.C. and E.M.E.; Supervision, D.B.E.; Project administration, D.B.E. All authors have read and agreed to the published version of the manuscript.

Funding

This research received no external funding.

Institutional Review Board Statement

Ethical review and approval were waived for this study because the blood samples were provided in fully de-identified form by the Meharry Sickle Cell Center (MSCC). No identifiable information was accessed or collected, and the use of such de-identified human biological materials does not require additional IRB approval under institutional and national ethical guidelines (see U.S. Department of Health & Human Services, 45 CFR 46.104, Exemption Category 4).

Informed Consent Statement

Patient consent was waived because all blood samples were de-identified prior to transfer to the research laboratory. No personal or clinical data were available to the investigators, in accordance with 45 CFR 46.104(d)(4) of the U.S. Department of Health & Human Services regulations. The references: https://www.hhs.gov/ohrp/regulations-and-policy/regulations/45-cfr-46/index.html (accessed on 13 September 2025).

Data Availability Statement

The datasets generated and/or analyzed during the current study are available from the corresponding author upon reasonable request.

Acknowledgments

We are thankful to the Meharry Sickle Cell Center (MSCC) at Meharry Medical College (MMC) for providing Sickle Cell samples and HPLC support, as well as Middle Tennessee State University for accessing to the Laser Trapping (LT) laboratory. The authors employed DeepSeek and ChatGPT (Free Version) for grammar correction while preparing this manuscript. The authors are solely responsible for the content of this publication, having reviewed and edited the final product.

Conflicts of Interest

The authors declare no conflicts of interest.

References

  1. Sharma, S.; Hashmi, M.; Chakraborty, R. StatPearls [Internet]; StatPearls Publishing: Treasure Island, FL, USA, 2021. [Google Scholar]
  2. Kato, G.J.; Piel, F.B.; Reid, C.D.; Gaston, M.H.; Ohene-Frempong, K.; Krishnamurti, L.; Smith, W.R.; Panepinto, J.A.; Weatherall, D.J.; Costa, F.F.; et al. Sickle Cell Disease. Nat. Rev. Dis. Primers 2018, 4, 18010. [Google Scholar] [CrossRef]
  3. Needs, T.; Gonzalez-Mosquera, L.F.; Lynch, D.T. Beta Thalassemia. In StatPearls; StatPearls Publishing: Treasure Island, FL, USA, 2018. [Google Scholar]
  4. Bachir, D.; Ga Bachir, D.; Galactéros, F. The Management of Sickle Cell Disease. Orphanet J. Rare Dis. 2004, 1, 1–7. [Google Scholar] [CrossRef]
  5. Cohn, E.J.; Edsall, J.T. Proteins, Amino Acids and Peptides as Ions and Dipolar Ions; Reprinted in Ergebn. Physiol 1947, 43, 1–89; Reinhold Publishing Corporation: New York, NY, USA, 1943. [Google Scholar] [CrossRef]
  6. Havinga, E. Comparison of the Phosphorus Content, Optical Rotation, Separation of Hemes and Globin, and Terminal Amino Acid Residues of Normal Adult Human Hemoglobin and Sickle Cell Anemia Hemoglobin. Proc. Natl. Acad. Sci. USA 1953, 39, 59–64. [Google Scholar] [CrossRef] [PubMed]
  7. Scheinberg, I.H.; Harris, R.S.; Spitzer, J.L. Differential Titration by Means of Paper Electrophoresis and the Structure of Human Hemoglobins. Proc. Natl. Acad. Sci. USA 1954, 40, 777–783. [Google Scholar] [CrossRef] [PubMed]
  8. Kutlar, A.; Kutlar, F.; Wilson, J.B.; Headlee, M.G.; Huisman, T.H.J. Quantitation of Hemoglobin Components by High-Performance Cation-Exchange Liquid Chromatography: Its Use in Diagnosis and in the Assessment of Cellular Distribution of Normal and Abnormal Hemoglobin Variants. Am. J. Hematol. 1984, 17, 39–53. [Google Scholar] [CrossRef]
  9. Cooper, J.; Devito, D.; Solomon, R.; Brown, C.; Crogman, H.; Farone, A.; Farone, M.; Erenso, D.; Aguinaga, M.D.P. Laser Trapping for Single Red Blood Cell (RBC) Ionization and Measurement of Charge. In Biomedical Optics; BT3A.34; Optica Publishing Group: Washington, DC, USA, 2014. [Google Scholar]
  10. Ashkin, A. Applications of Laser Radiation Pressure. Science 1980, 210, 1081–1088. [Google Scholar] [CrossRef]
  11. Easterling, L.F.; Yerabolu, R.; Kumar, R.; Alzarieni, K.Z.; Kenttämaa, H.I. Factors Affecting the Limit of Detection for HPLC/Tandem Mass Spectrometry Experiments Based on Gas-Phase Ion–Molecule Reactions. Anal. Chem. 2020, 92, 7471–7477. [Google Scholar] [CrossRef]
  12. Snyder, L.R.; Kirkland, J.J.; Dolan, J.W. Introduction to Modern Liquid Chromatography, 3rd ed.; John Wiley & Sons: Hoboken, NJ, USA, 2010; ISBN 978-0-470-16054-0. [Google Scholar]
  13. Khera, R.; Singh, T.; Khurana, N.; Gupta, N.; Dubey, A. HPLC in Characterization of Hemoglobin Profile in Thalassemia Syndromes and Hemoglobinopathies: A Clinicohematological Correlation. Indian J. Hematol. Blood Transfus. 2015, 31, 110–115. [Google Scholar] [CrossRef]
  14. Ali, A.H. High-Performance Liquid Chromatography (HPLC): A Review. Ann. Adv. Chem. 2022, 6, 10–20. [Google Scholar] [CrossRef]
  15. Pellizzaro, A.; Welker, G.; Scott, D.; Solomon, R.; Cooper, J.; Farone, A.; Farone, M.; Mushi, R.S.; del Pilar Aguinaga, M.; Erenso, D. Direct Laser Trapping for Measuring the Behavior of Transfused Erythrocytes in a Sickle Cell Anemia Patient. Biomed. Opt. Express 2012, 3, 2190–2199. [Google Scholar] [CrossRef]
  16. Dolan, J. How Much Retention Time Variation Is Normal? LC Resources: Lafayette, CA, USA, 2014; Available online: https://www.chromatographyonline.com (accessed on 13 September 2025).
  17. Sammartano, A.; Migliari, S.; Serreli, G.; Scarlattei, M.; Baldari, G.; Ruffini, L. Validation of the HPLC Analytical Method for the Determination of Chemical and Radiochemical Purity of Ga-68-DOTATATE. Indian J. Nucl. Med. 2023, 38, 1–7. [Google Scholar] [CrossRef] [PubMed]
  18. Alquadeib, B.T. Development and Validation of a New HPLC Analytical Method for the Determination of Diclofenac in Tablets. Saudi Pharm. J. 2019, 27, 66–70. [Google Scholar] [CrossRef]
  19. Kelley, M.; Cooper, J.; Devito, D.; Mushi, R.; Aguinaga, M.D.P.; Erenso, D.B. Laser Trap Ionization for Identification of Human Erythrocytes with Variable Hemoglobin Quantitation. J. Biomed. Opt. 2018, 23, 055005. [Google Scholar] [CrossRef]
  20. Muhammed, E.; Cooper, J.; Devito, D.; Mushi, R.; del Pilar Aguinaga, M.; Erenso, D.; Crogman, H. Elastic Property of Sickle Cell Anemia and Sickle Cell Trait Red Blood Cells. J. Biomed. Opt. 2021, 26, 096502. [Google Scholar] [CrossRef]
  21. Muhammed, E.; Chen, L.; Gao, Y.; Erenso, D. Chemo-Treated 4T1 Breast Cancer Cells Radiation Response Measured by Single and Multiple Cell Ionization Using Infrared Laser Trap. Sci. Rep. 2019, 9, 17547. [Google Scholar] [CrossRef] [PubMed]
  22. Goangul, M.S.; Erenso, D.B.; Gao, Y.; Chen, L.; Eshun, K.O.; Alvarez, G.; Crogman, H.T. Assessing Radiation Effects on Chemo-Treated BT20 and 4T1 Breast Cancer, and Neuroblastoma Cell Lines: A Study of Single and Multiple-Cell Ionization via Infrared Laser Trapping. Radiat 2024, 4, 85–100. [Google Scholar] [CrossRef]
  23. Goangul, M.S.; Stewart, W.C.; Erenso, D.; Crogman, H.T. The Radiation Response Measurement of a Single and Multiple Cell Ionization of Neuroblastoma Cells by Infrared Laser Trap. J. Radiat. Res. 2023, 64, 113–125. [Google Scholar] [CrossRef]
  24. Kelley, M.; Gao, Y.; Erenso, D. Single Cell Ionization by a Laser Trap: A Preliminary Study in Measuring Radiation Dose and Charge in BT20 Breast Carcinoma Cells. Biomed. Opt. Express 2016, 7, 3438–3448. [Google Scholar] [CrossRef]
  25. Bogdanova, A.; Kaestner, L.; Simionato, G.; Wickrema, A.; Makhro, A. Heterogeneity of Red Blood Cells: Causes and Consequences. Front. Physiol. 2020, 11, 392. [Google Scholar] [CrossRef]
  26. Gurkan, U.A. Biophysical and Rheological Biomarkers of Red Blood Cell Physiology and Pathophysiology. Curr. Opin. Hematol. 2021, 28, 138–149. [Google Scholar] [CrossRef]
  27. Igbineweka, N.E.; van Loon, J.J.W.A. Gene-Environmental Influence of Space and Microgravity on Red Blood Cells with Sickle Cell Disease. NPJ Genom. Med. 2024, 9, 44. [Google Scholar] [CrossRef]
  28. Muhammed, E.; Erenso, D.B.; Gao, Y.; Chen, L.; Kelley, M.; Vazquez, C.; Gale, M.; Nichols, C.; Crogman, H.T. Measurement of Charge and Refractive Indices in Optically Trapped and Ionized Living Cells. Tomography 2022, 8, 70–88. [Google Scholar] [CrossRef] [PubMed]
  29. Ishikawa, T.; Kawabata, N.; Imai, Y.; Tsubota, K.-I.; Yamaguchi, T. Numerical Simulation of a Low-Hematocrit Blood Flow in a Small Artery with Stenosis. J. Biomech. Sci. Eng. 2007, 2, 12–22. [Google Scholar] [CrossRef]
  30. Udroiu, I. Estimation of Erythrocyte Surface Area in Mammals. arXiv 2014, arXiv:1403.7660. [Google Scholar] [CrossRef]
  31. Norouzi, N.; Bhakta, H.C.; Grover, W.H. Sorting Cells by Their Density. PLoS ONE 2017, 12, e0180520. [Google Scholar] [CrossRef]
  32. Piskin, E.; Cianciosi, D.; Gulec, S.; Tomas, M.; Capanoglu, E. Iron Absorption: Factors, Limitations, and Improvement Methods. ACS Omega 2022, 7, 20441–20456. [Google Scholar] [CrossRef]
  33. Kang, Y.; Douglas, D. Gas-Phase Ions of Human Hemoglobin A, F, and S. J. Am. Soc. Mass Spectrom. 2011, 22, 1187–1196. [Google Scholar] [CrossRef] [PubMed]
  34. Gerritsma, J.; Sinnige, D.; Drieze, C.; Sittrop, B.; Houtsma, P.; Ulshorst-Jansen, N.H.; Huisman, W. Quantitative and Qualitative Analysis of Haemoglobin Variants Using Capillary Zone Electrophoresis. Ann. Clin. Biochem. 2000, 37, 380–389. [Google Scholar] [CrossRef] [PubMed]
  35. Papadea, C.; Cate, J.C., 4th. Identification and Quantification of Hemoglobins A, F, S, and C by Automated Chromatography. Clin. Chem. 1996, 42, 57–63. [Google Scholar] [CrossRef]
  36. Sridhar, A.; Idowu, M. Hemoglobin Electrophoresis in Sickle Cell Disease: A Primer for the Clinician. Lab. Med. 2021, 52, 321–326. [Google Scholar]
  37. Ghosh, K.; Ghosh, K.; Agrawal, R.; Nadkarni, A.H. Recent Advances in Screening and Diagnosis of Hemoglobinopathy. Expert. Rev. Hematol. 2020, 13, 13–21. [Google Scholar] [CrossRef] [PubMed]
Figure 1. Schematic of the 1064 nm laser trap set-up. Laser power (8 Watts) was modulated by a half-wave plate (W) and polarizer (P). Mirrors M1–M4 redirect the beam, while beam expanders adjust the beam diameter. Additional converging lenses (L1 and L2) adjust the beam diameter to match the objective lens window. Steering mirror M5, along with lenses L3 and L4, position the trap on the microscope’s focal plane.
Biophysica 05 00056 g001
Figure 2. (a) Schematic representation of a trapping and (b) ejected RBC (c) successive images describing the trajectories of RBC (red line) as it moves toward the trap (X) and as it recedes from the trap (X). A cross (×) in the middle denotes the actual optical trap. Dielectrophoretic forces enable the cell to be successfully captured. After it is charged and ejected from the trap (blue). The trapping model in (a,b) was created using the 3D parametric function plot in Origin. (c) Created from sequential images of RBCs being trapped and ejected. Images are processed and designed using Paint.
Biophysica 05 00056 g002
Figure 3. Schematic for the position at a given instant of time for an ionized and ejected RBC along the direction of polarization y ^ in the y direction, θ is the angle between the polarization direction and the vector r t (from the center of the trap to center of RBC) and dv is at the x-y plane. The figure was created using the 3D parametric function plot in Origin 2019 https://www.originlab.com/.
Biophysica 05 00056 g003
Figure 4. Ejection kinematics: experiment and model. Displacement with experimental data (points) and model fits (solid lines) overlaid. (power at trap P t r a p = 0.806   W ; pre-ionization mean P t r a n s = 0.640   W ).
Biophysica 05 00056 g004
Figure 5. Theoretical model graphs of RBC ejection dynamics for four hemoglobin variants: (a) Displacement and (b) Velocity.
Biophysica 05 00056 g005
Figure 6. Measured displacement (a) and velocity (b) of RBCs after laser-induced ejection for four hemoglobin variants. Hb AS (red), Hb AC (green), Hb FSC (blue), and Hb FA (magenta).
Biophysica 05 00056 g006
Figure 7. Biomechanical profiling of hemoglobin variants via apparent energy/dose. (a) TRD* and (b) TIE* distributions from radius-binned, reduced data; full point clouds are shown in (c,d), respectively. (e) Variant-wise composition of TRD* and (f) variant-wise composition of TIE* (pie charts). Data for four hemoglobin variants: Hb AS, Hb AC, Hb FSC, Hb FA. Values are apparent (no baseline; Methods, Section 2.3.7). Distributions show the variant-specific differences in radiation response and charge development.
Biophysica 05 00056 g007
Figure 8. (a) Scree plot showing the variance explained by each principal component, and (b) biplot highlighting the significant differences in sample distributions.
Biophysica 05 00056 g008
Figure 9. (a) Scree plot illustrating the variance explained by each principal component. (b) Biplot displaying the distribution of samples, highlighting significant differences among them.
Biophysica 05 00056 g009
Figure 10. Charge number and charge density versus radius for four hemoglobin variants: Hb AS (red), Hb AC (green), Hb FCS (blue), and Hb FA (magenta). The graphs in (a,b) are the reduced data. The graphs in (c,d) are the data for all 62 cells. The box plot in (e) is for the Z number and (f) is the charge density. Significance: *, p < 0.05 ; **, p < 0.01 ; ***, p < 0.001 ; and ****, p < 0.0001 . (two-sample t-tests; Welch’s correction where variances were unequal).
Biophysica 05 00056 g010
Table 1. Relative percentage of hemoglobin types by HPLC.
Hb Fractions ProfileHb ASHb ACHb FSCHb FA
SexMFMF
Age38 years30 years75 days82 days
Hb fractions profile relative percentage of hemoglobin types by HPLC
Hb A (%)53.2055.410.0029.10
Hb A2 (%)3.603.100.200.80
Hb C (%)0.0041.097.100.00
Hb F (%)0.400.4082.6070.10
Hb S (%)42.800.007.100.00
Table 2. The values for the basic statistical parameters for the diameter, TIE*, TRD*, and charge for four RBC samples.
Blood SampleMeasurement ParameterMeanSDMinimumMaximum
Hb ASTRD* (J/ng)0.750.380.031.63
TIE* (mJ) 178.0091.988.71358.86
Radius (µm) 8.730.646.5010.33
Trap stiffness k (N/m)4.89 × 10−34.14 × 10−44.04 × 10−36.76 × 10−3
Z-number2943.32991.961363.305432.73
Z-number/volume13.794.646.3727.10
Hb ACTRD* (J/ng)0.890.550.272.67
TIE* (mJ)183.78103.8685.63534.79
Radius (µm)8.351.136.5511.11
Trap stiffness k (N/m)5.00 × 10−36.74 × 10−43.86 × 10−36.23 × 10−3
Z-number3333.47839.731656.665943.2
Z-number/volume37.879.1224.8072.63
Hb FATRD* (J/ng)1.421.951.121.64
TIE* (mJ)201.9097.42102.93205.86
Radius (µm)6.900.755.229.10
Trap stiffness k (N/m)9.49 × 10−33.13 × 10−34.05 × 10−31.80 × 10−2
Z-number2428.87814.382223.612634.13
Z-number/volume18.786.426.4636.51
Hb FSCTRD* (J/ng)1.310.650.373.32
TIE* (mJ)190.0194.2185.22596.56
Radius (µm)6.910.885.249.28
Trap stiffness k (N/m)9.74 × 10−34.09 × 10−33.22 × 10−32.40 × 10−2
Z-number3006.58704.581337.815633.66
Z-number/volume23.348.33018.8039.41
Table 3. Quantification of hemoglobin in the Hb AS and Hb AC blood sample.
Blood TypesHb ASHb ACHb FSCHb FA
Hb SZ-number1264.0003460
Percent, %42.94%011.51%0
Hb CZ-number01420.113460
Percent, 045.82%11.51%0
Hb AZ-number1679.321679.320492.1
Percent,57.04%54.17%020%
Hb FZ-number002314.61828
Percent,0076.98 74.42
Disclaimer/Publisher’s Note: The statements, opinions and data contained in all publications are solely those of the individual author(s) and contributor(s) and not of MDPI and/or the editor(s). MDPI and/or the editor(s) disclaim responsibility for any injury to people or property resulting from any ideas, methods, instructions or products referred to in the content.