Article

Comprehensive Experimental Analysis of Tear Fluid Composition and Structure by Using Novel Physical Methods with Diagnostic Potential for Inflammatory Diseases

by
Daria Kondrakhova
1,2,*,
Vladimíra Tomečková
3,
Oleksandr Dobrozhan
4,5,
Ondrej Milkovič
6,7,
Hoydoo You
8,
Tatiana Kimáková
9 and
Vladimír Komanický
1,*
1
Institute of Physics, Department of Condensed Matter Physics, Faculty of Science, Pavol Jozef Šafárik University Košice, Park Angelinum 9, 04154 Košice, Slovakia
2
Division of Ceramic and Non-Metallic Systems, Institute of Materials Research, Slovak Academy of Sciences, Watsonova 47, 04001 Košice, Slovakia
3
Department of Medical and Clinical Biochemistry, Faculty of Medicine, Pavol Jozef Šafárik University Košice, Trieda SNP 1, 04011 Košice, Slovakia
4
Department of Electronics and Computer Technology, Sumy State University, 40007 Sumy, Ukraine
5
Department of Applied Physics and Electromagnetism, University of Valencia, 46100 Burjassot, Spain
6
Institute of Materials Research, Slovak Academy of Sciences, Watsonova 47, 04001 Košice, Slovakia
7
Institute of Experimental Physics, Slovak Academy of Sciences, Watsonova 47, 04001 Košice, Slovakia
8
Argonne National Laboratory, 9700 S. Cass Avenue, Lemont, IL 60439, USA
9
Department of Public Health and Hygiene, Faculty of Medicine, Pavol Jozef Šafárik University Košice, Trieda SNP 1, 04011 Košice, Slovakia
*
Authors to whom correspondence should be addressed.
Biophysica 2025, 5(4), 48; https://doi.org/10.3390/biophysica5040048
Submission received: 1 September 2025 / Revised: 21 October 2025 / Accepted: 22 October 2025 / Published: 25 October 2025
(This article belongs to the Collection Feature Papers in Biophysics)

Abstract

This study explored the use of physical methods, namely X-ray diffraction, atomic force microscopy, and energy-dispersive X-ray spectroscopy, to analyze the structure and composition of tear fluid desiccates. Tear samples were collected from patients with dry eye syndrome, glaucoma, and multiple sclerosis. Our results revealed significant differences in the crystallization patterns, chemical composition, and morphology of tear fluid among the disease groups compared to healthy individuals. XRD analysis identified variations in salt crystallization within tear fluid desiccates. AFM provided nanoscale morphological visualization. EDX determined the presence of key chemical elements. Our findings showed that changes in crystallization and unbalance of ionic composition in tear fluid may serve as potential markers for diagnosing ocular diseases. This study highlights the potential of these techniques for non-invasive diagnostics and contributes to the development of innovative strategies for monitoring structural properties in tear fluid desiccates of analyzed inflammatory, and neurodegenerative diseases.

Graphical Abstract

1. Introduction

In recent decades, noninvasive diagnostic methods have gained popularity for assessing patients’ health through the analysis of biological fluids. The analysis of biological fluids, such as blood, saliva, and urine, plays a critical role in the diagnosis of numerous diseases. Recently, tear fluid has emerged as an important non-invasive medium for medical analysis due to its rich biochemical composition [1,2,3]. Tear fluid consists of lipids, electrolytes, proteins, peptides, and glycoproteins, which together comprise 1–2% of its mass, while the remaining 98–99% is water, with metabolic, immunological, regulatory, and protective function. It plays a crucial role in maintaining eye health by providing lubrication and protection to the ocular surface [4,5]. Changes in composition of tear fluid can reflect both local and systemic disorders, providing valuable insights into ocular and systemic health [6,7,8].
Tear fluid has metabolic, immunological, and protective functions. It represents a promising yet still underexplored biological fluid that is not routinely analyzed in clinical biochemical practice. Studies show that the concentration of glucose in tear fluid correlates with its level in the blood. In addition to proteins, tear fluid contains also amino acids, with 3–4 times higher levels than in blood serum [2]. At the same time, there is no hemoglobin in the tear fluid, which makes it convenient for certain types of analysis. There is also an established link between trace element levels and diseases such as diabetic retinopathy and glaucoma [9,10,11]. However, research on the quantitative determination of metallic trace elements in tear fluid remains limited. Numerous studies have shown that changes in tear fluid associated with different ocular pathologies can be detectable with various methods [8,12,13,14,15]. For instance, increased lipid content in tear fluid has been linked to cataract formation, likely due to the disruption of glucose and lipid metabolism in the ocular surface. Additionally, glaucoma has been associated with dysregulated catecholamine secretion in tear fluid, which may reflect the underlying neurodegenerative processes involved in the disease [16,17]. Retinal detachment is characterized by elevated alkaline phosphatase activity. The inflammatory diseases of the anterior segment of the eye significantly alter the concentration of inorganic ions and trace elements [18]. However, despite its high potential, tear fluid is not yet routinely used in clinical and biochemical diagnostics.
Pathological gut microbiota can cause chronic inflammation, disrupting the blood–brain barrier and leading to neuroinflammation. This inflammation can affect tear fluid production, causing dryness and ocular irritation [19,20]. Multiple sclerosis reduces tear production due to central nervous system damage, leading to dry eyes. This disease also alters the ocular microbiota, further destabilizing the tear film [21,22]. Susac syndrome is a rare disorder that impacts the ocular circulation and brain’s regulation of tear production, leading to dry eye symptoms [23]. Glaucoma increases intraocular pressure and disrupts tear film stability, often resulting in dry eye symptoms. Medications used for glaucoma can also impair tear production. Recent studies show altered ocular microbiota in glaucoma patients, affecting tear film health [19]. Dry eye syndrome (DES) involves compromised tear production, leading to dryness, irritation, and inflammation. It is linked to high osmolarity (salt imbalance) and inflammation, which destabilizes the tear film. The ocular microbiota also worsens inflammation and affects tear film stability. The brain plays a key role in tear regulation, influencing the severity of DES symptoms [24].
In diabetic retinopathy, the glucose concentration in tear fluid is elevated more significantly than in diabetes without retinopathy [9]. During liver diseases, bilirubin levels in tear fluid increased 2–3 days earlier than in blood plasma [25]. Additionally, methods for determining the coagulation and fibrinolytic activity in tear fluid during ocular vascular pathology have been developed [26]. In addition to biochemical and immunological methods, structural analysis based on the study of tear fluid desiccated crystalline structures has been experimentally studied. Non-invasive, accessible, and informative analysis of tear fluid is attractive to researchers.
In our previous works, we consistently studied the diagnostic value of structural, spectral, and proteomic characteristics of tear fluid. Samples from patients with major depressive disorder (MDD) [27], multiple sclerosis (SM) [13], and diabetes mellitus (DM) [28] were analyzed. These studies used spectroscopic and microscopic methods, including fluorescence spectroscopy, circular dichroism, Raman spectroscopy, infrared (IR) spectroscopy, atomic force microscopy (AFM), photothermal AFM-IR spectroscopy, and mass spectrometry. The obtained results showed a number of characteristic changes: decreased levels of tryptophan and phenylalanine, redistribution of α- and β-structures of proteins, changes in the morphology of dried droplets, including a decrease in roughness and a violation of the symmetry of dendritic structures. Mass spectrometric and proteomic analyses revealed changes in the expression of proteins involved in inflammation, lipid metabolism, antioxidant protection, and immune regulation. In particular, using photothermal AFM-IR spectroscopy in a study of patients with diabetes mellitus, shifts in amide bands I and II were recorded, indicating changes in the secondary structure of proteins. These spectral differences made it possible to reliably distinguish between samples of patients and healthy donors with high sensitivity and specificity. The obtained data were also used to build diagnostic models.
Thus, the above-mentioned works laid the foundation for further study of the physicochemical and morphological characteristics of tear fluid using structure-sensitive methods. The present study continues this approach and aims to comprehensively analyze dried tear fluid using X-ray diffraction (XRD), AFM, and energy dispersive X-ray spectroscopy (EDX). The use of these methods allows us to identify differences in surface morphology, crystal structure, and ionic composition between tear fluid samples from healthy donors and patients with dry eye syndrome, glaucoma, multiple sclerosis, and diabetes mellitus. The obtained data demonstrate the potential of physical methods as a non-invasive tool for early diagnosis of inflammatory and neurodegenerative diseases.

2. Results

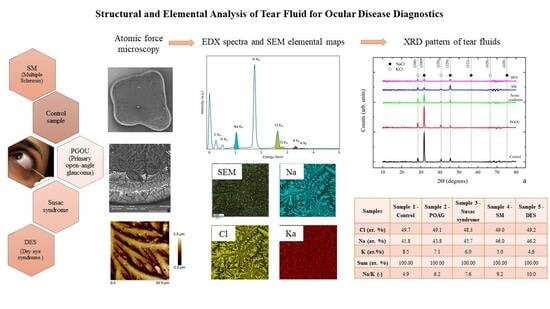
2.1. EDX and AFM Analysis of Tear Fluid Microdesiccates from Patients with Inflammatory and Neurodegenerative Diseases

The morphological analysis of microdesiccates of tear fluid encompassed not only the central zone, where fern-like crystalline grains may form but also the entire sample [29]. In the work [29], these authors proposed a division into zones. Based on the analysis of over 20 samples of tear fluid dried on the glass surface, the authors established patterns of formed morphological structure. They found that the microdesiccates of tears from different individuals exhibited a common four-zonal morphological structure. This structure included an outer amorphous Zone I, Zone II with crystalline grains, and a central Zone III with larger, variably branched, chaotically distributed fern-like crystals, and a transitional band between Zones I and II.
In our study, despite some variations in detail among microdesiccates from different tear samples, a common four-domain organization was also observed with typical fern-like crystalline grains. These fern-like structures are used for diagnosing “dry eye” by polarizing microscope known as the fern test [30]. However, its application is limited due to the influence of external factors and interpretational discrepancies. The aim of our study is to provide a comprehensive description of the morphology of dried tears from donors, which could enhance the interpretation of results and diagnostics.
The obtained results (Figure 1) from the studied samples (f–j) are consistent with previous observations by authors [31,32] concerning the structural and morphological characteristics of the tear microdesiccates structural details. There is a clear presence of three main components, namely zones I, II, and III, along with a transitional band for each sample. Zone I is the outermost component of the microdesiccate and consists of a hyaline amorphous material that surrounds the entire dried tear fluid [29,31,32]. In this zone, some morphological changes were observed depending on the sample. Zone II consists of well-defined crystalline grains growing centripetally from evenly spaced points near Zone I (Figure 1f–j). In our study, grains in the form of fern and leaf shapes are predominant. Zone II, together with the transitional band, occupied more than 40% of the area of a typical tear microdesiccate. The center of the dried tear fluid sample, according to [29] can be classified as Zone III. In this zone, typical fern-like structures were mostly observed, differing in strength, length, and branching. Zone III occupied the largest area of the microdesiccate. The structures in this zone have radial growth and terminate upon contact with the crystalline grains from Zones II and III [31].
Our samples also showed the presence of a transitional band. According to the classification [29], the transitional band is located between Zones I and II. The band provides “attachment points” for the grains in Zone II. For additional analysis of morphology and surface roughness of tear fluid, AFM was used to study the microdesiccates of tears. Heterogeneous structures were identified, probably correspond to aggregates of proteins and lipids. When comparing the dried tear fluid surfaces from patients with various diseases, structural morfology differences were observed (Figure 1k–o).
In the tear fluid of control (Sample 1), dendritic structures with small crystals were distributed across their surface. The crystals measured approximately 2.0 × 2.5 µm2 in lateral size and up to 700 nm in height. The main branches were 200–250 µm in length, while the lateral branches reached about 80 µm. The average branch height was around 1 µm, with a thickness of approximately 9 µm. Surface roughness, reported as the arithmetical mean roughness Rₐ from AFM line profiles (scan window 92.5 × 92.5 µm2 for all samples), was relatively high in the control sample (Ra ≈ 500 nm).
For Sample 2 (POAG), the tear fluid surface roughness was comparable to that of the control sample with an average Ra ≈ 500 nm. This sample exhibited a similar fern-like dendritic morphology, with main branches around 150–200 µm in length and approximately 10 µm in width. As in the control sample, Sample 2 also contained small discrete crystals, although in considerably lower quantities, with crystal heights reaching up to 1 µm.
Sample 3 (Susac syndrome) displayed distinct morphological features characterized by fern-like structures composed of small, well-defined crystals. The average length of the main branches was approximately 100 µm, with lateral branches measuring around 35–50 µm. As shown in Figure 1, the branches in this sample were shorter and narrower than those observed in the tear desiccates of the control sample. Additionally, individual crystals measuring 4–5 µm in size and up to 3 µm in height were observed, similar to the previous samples. The average surface roughness for this sample was Ra ≈ 360 nm.
The surface morphology of the tear fluid in patients with multiple sclerosis (Sample 4) demonstrated a highly branched dendritic structure, differing in branch length, thickness, and surface roughness from the tear fluid samples of healthy individuals. On the surface of the dendrites, as in previous samples, isolated crystals were observed, mostly distributed uniformly along the main branches. These crystals reached heights of up to 900 nm, while the average branch height was around 200 nm. Sample 4 had shorter dendrite branches, with an average length of approximately 90 µm and a width of 3–3.5 µm, while the lateral branch length was about 7 µm. Furthermore, Sample 4 displayed lower surface roughness than other tear fluid samples, particularly when compared to the control sample (Ra ≈ 150 nm).
The sample from a patient with dry eye syndrome also displayed individual crystals located along the center of the main branches, like the previous sample. The desiccant morphology of Sample 5 was characterized by a highly branched dendritic structure with an average main branch length of up to 150 µm and a width of around 10 µm. Lateral branches ranged from 5 to 12 µm in length. The average surface roughness of this sample was Ra ≈ 200 nm, with individual crystals reaching heights of up to 700 nm.
All examined samples exhibited dendritic crystal growth, but differences were observed in branch length, morphology, and surface roughness. These variations in crystal structure are crucial in the fern-like formation test, which helps identify biochemical characteristics of the tear film, such as the composition of salts and polymers influencing crystallization [33]. Structural changes in these crystals, including differences in size and shape, can be affected by the tear composition and environmental conditions, making this method valuable for diagnosing various conditions, including dry eye disease and keratoconjunctivitis [34].
To confirm the elemental composition, EDX was conducted. A quantitative assessment of the elemental composition of the tear fluid droplets in our samples was carried out using EDX analysis. Figure 2 presents typical EDX spectra of the tear fluid. Key elements identified included carbon (C), oxygen (O), chlorine (Cl), sodium (Na), and potassium (K). These elements are the primary components of tear fluid and correspond to its biochemical makeup. The significant presence of silicon (Si) is due to the use of silicon substrates for the study. The presence of oxygen (O) peaks on EDX spectra is due to the surface silicon thick oxide layer (approximately 100 nm) of used substrate. The presence of carbon in high concentrations in all samples indicated the organic nature of the tear fluid, which contains various proteins, lipids, and other organic compounds. These organic molecules made up a substantial portion of the tear’s composition, making carbon the dominant element in the EDX analysis (Table 1).
The EDX results also show peaks for elements Na, K, and Cl. These elements in physiological tear fluid exist in the ionic form of dissolved NaCl and KCl salts in water. According to [35,36], the presence of Na+, K+, Cl ionic in tear fluid is essential for maintaining its osmotic balance. Additionally, the compounds of these ions play a crucial role in sustaining proper cellular function and contribute to the electrolyte composition of the tear fluid. Our data show that fern-like crystals predominantly consist of sodium chloride and potassium chloride (Figure 2), which is consistent with the results of other studies [37]. It has been established that these crystals are covered by mucins and high molecular weight proteins, which regulate their formation. Furthermore, the crystal structure is significantly influenced by the ratio of monovalent ions (such as sodium) to divalent ions (such as calcium and magnesium) [34]. The Na/K ratio was calculated for each sample to provide insights into the dynamic imbalance of these key elements in tear fluid (Table 1) during the ocular pathologies.
The Na/K ratio varied significantly across different samples, ranging from 4.9 to 10.0. This variation may be attributed to individual physiological differences, the health condition of the person, or their diet. The balance of these electrolytes is crucial for the normal functioning of eye cells and tear production.
Under normal conditions, a balanced level of sodium (Na+) and potassium (K+) ions is essential to maintain osmotic pressure and ensure the proper function of the eye’s Goblet cells, Meibomian gland cells, lacrimal gland cells, and avascular retina. However, under conditions such as dry eye syndrome or inflammatory processes, this balance can be disrupted, leading to changes in electrolyte concentrations in the tears [38].
Low potassium ion concentration in the tears of glaucoma patients (Sample 2) shows promise as a biomarker, with potential for screening and prevention of blindness. Low extracellular potassium can disrupt corneal epithelium integrity and induce apoptosis, while age-related potassium channel dysfunction may exacerbate glaucoma risk. Elevated [Na+] levels in glaucoma patients’ tears could be a compensatory response. The age-dependent decrease in tear [K+] highlights the need for improved collection methods and standardized testing. Further research into potassium’s role in glaucoma progression is essential for diagnostic and therapeutic advances [38].
Elevated Na/K ratios ranging from 7.6 to 10.0 (Samples 3–5) may indicate the presence of dry eye syndrome (DES) or inflammatory eye diseases, as supported by our previous AFM studies, in which changes in the sample structure were shown depending on the disease. Samples 3–5 were obtained from patients with neurological and autoimmune disorders, where a dysfunctional lipid layer in the tear film leads to accelerated tear evaporation. This is often caused by meibomian gland dysfunction. As a result, sodium levels increase while potassium concentrations decrease, leading to altered Na/K ratios [39].
The Na+/K+-ATPase, commonly referred to as the sodium–potassium pump, maintains osmotic balance and membrane potential by actively exporting Na+ out of the cell and importing K+ into the cell against their concentration gradients; it is observed in meibomian and lacrimal glands. Age-related reductions in its expression are linked to meibomian gland dysfunction in DES (Sample 5). This pump actively maintains sodium and potassium gradients critical for cell signaling, volume regulation, and tear secretion [35,36].
Tear film electrolytes, including potassium, support corneal function and conjunctival goblet-cell density. Ionic imbalances, particularly in avascular tissues like the cornea, can disrupt homeostasis, emphasizing the pump’s role in ocular health and disease [39].
The tear film’s innermost mucous layer, composed of mucins, electrolytes, and water from goblet cells, ensures lubrication and protection. Goblet cell function is compromised in ocular diseases like DES, which affects the cornea, glands, and tears. Ionic imbalances in dry eye syndrome disrupt protein processes and intensify inflammation, creating a feedback loop [40,41].
The tear hyperosmolarity is characteristic phenomenon observed in patients with DES [42]. In samples where the Na/K ratio is lower (e.g., sample 1 with Na/K = 4.9), the tear film showed normal properties, which could indicate the absence of pronounced pathologies.
Changes in the Na/K ratio and chloride content indicate that the composition of tear fluid may change depending on physiological conditions, health status, or external factors. Further research is needed to determine the exact factors influencing the Na/K ratio, including potential correlations with specific diseases or nutrient deficiencies. The significant presence of other elements, such as Cl, also plays a role in the overall ionic balance and physiological function of tear fluid.
EDX analysis of dried tear samples offers important insights into the chemical composition of tears, highlighting the presence of key organic molecules (carbon and oxygen), electrolytes (sodium, potassium, and chloride), and potential environmental contaminants. Meanwhile, AFM allowed for the visualization of nanostructural features. These methods can be valuable for further research in the diagnosis of eye diseases and the development of therapeutic strategies.

2.2. Analysis of Tear Fluid Crystallization Patterns in Ocular Diseases Using X-Ray Diffraction

Studies using X-ray diffraction to analyze dried tear samples from patients with various conditions have been conducted to quantitatively assess the crystalline structure of salts and organic components remaining after tear evaporation. As noted in the previous section, tear fluid contains various salts that can crystallize upon drying in patients with various eye diseases. The study of tear fluid using XRD shows differences in salt crystallization and crystal structures of NaCl, and KCl.
XRD analysis allows the precise identification of these salts as a diffraction pattern of their unique phase crystalline composition. Additionally, tear fluid contains organic substances such as proteins, lipids, and mucins, which may be amorphous, that can produce a more diffuse (broad) signal in XRD analysis. This broad “amorphous” signal is associated with protein structures or lipids present in the tear film and a lack of crystalline structure. These studies provide insights into the changed electrolyte balance in tear fluid as a response to various diseases. The patterns obtained from five different samples are presented in Figure 3 on a linear scale. Vertical tick marks indicate the reference 2θ positions (Cu Kα) taken from the ICDD Powder Diffraction File-2 (PDF-2; formerly JCPDS) [43] for NaCl and KCl, both crystallizing in the rock-salt (B1) structure, space group Fm–3m (225). (Note: PDF-2 tabulates maximum intensities; our quantitative analyses are based on integral intensities (Iint), in cps·deg after background subtraction; see Materials and Methods.)
Figure 3. Grazing-incidence XRD (ω = 1.0°) patterns of tear fluids from five samples, plotted on a linear scale. Each curve is shifted vertically for clarity. Markers indicate the positions of the NaCl (●) and KCl (○) reflections (200, 220, 222, 420). Vertical tick marks indicate the reference 2θ positions (Cu Kα) from the ICDD Powder Diffraction File-2 (PDF-2; formerly JCPDS) [43] for NaCl and KCl (both rock-salt, Fm–3m (225)). XRD patterns are shown in counts per second (cps).
Biophysica 05 00048 g003
The studied samples (Samples 2–5) are from tear fluid collected from patients with inflammatory and neurodegenerative diseases. Both clear crystalline structures of salts NaCl and KCl, can be identified by their characteristic reflections in the XRD patterns. The concentration of these salts may vary in patients with different diseases, such as dry eye syndrome or glaucoma, leading to changes in Na/K ratios [38,39].
In patients with dry eye or inflammatory eye diseases, a significant decrease in the integral intensities of the NaCl reflections but no significant change in potassium (KCl) content have been observed. This could suggest an imbalance in osmotic pressure and a modification in the ratio of salt composition of the tear fluid. The relationship between XRD integral intensity and disease type is shown in Table 2. The decrease in Na+ and increase in KCl can be attributed to ion exchange or redox processes, where Na+ is replaced by K+, possibly driven by the electrochemical properties of the ions, as described in Beckett’s series of metals. Conversely, stronger non-covalent interactions, induced by the positive electrostatic charge of the cation, could promote electrochemical reactions of ions with proteins [44].
As shown in Table 2, the NaCl lattice constant is that of pure NaCl, a = 5.64 Å, within the instrumental resolution while that of KCl is slightly contracted by 0.2% compared to that of pure KCl lattice constant of 6.292 Å. The difference is small but indicates that the KCl grains include small amount of NaCl, approximately 0.6% in composition. Note this is a crude estimation and we have no direct evidence of Na impurities in KCl crystals. The lattice constants of the 5 samples were essentially the same within the measurement accuracy in terms of the Na impurities. KCl and NaCl phase fractions were calculated from the integral intensities (Iint) (integrated areas) of the 200 and 220 reflections of each phase, where the Iint is the reflection area (cps·deg) obtained after background subtraction; no Cu-Kα2 correction was applied (see Materials and Methods for details). Because this correction was not applied and measurement geometry/texture can affect absolute intensities, the fractions should be regarded as semi-quantitative and interpreted together with within-pattern normalized values and intensity ratios. According to Table 2, the control sample (Sample 1) shows a high NaCl fraction with a normal KCl fraction, reflecting a balanced tear composition in healthy individuals. In Figure 3, the NaCl 200 and 220 reflections are prominent, indicating abundant crystalline NaCl. By contrast, the KCl 200 and 220 reflections exhibit lower integral intensities (Figure 3), which is consistent with the physiological Na+/K+ ratio in the tear film [45].
In patients with Primary Open-Angle Glaucoma (POAG) (Sample 2), a noticeable decrease in the integral intensities of the NaCl reflections suggests reduced sodium crystallization in the tear fluid, potentially due to impaired tear secretion and altered osmotic pressure (Figure 3). Simultaneously, the increased KCl crystallization indicates a shift in the ionic balance, which is commonly observed in glaucoma patients due to changes in tear film dynamics [16,19]. Furthermore, the increase in crystal texture to 0.87 may reflect the formation of larger KCl crystallites, possibly linked to disease-related changes in tear composition (Table 2).
In the XRD analysis of tear fluid from a patient with Susac Syndrome (Sample 3), a notable decline in the Iint of the NaCl 200 and 220 reflections suggests a significant reduction in sodium crystallization compared to the control sample, likely associated with altered tear secretion and osmotic pressure, which may act as impurities to NaCl hindering crystallization (Figure 3). The reduction in NaCl texture size may be associated with the strong binding of sodium to proteins, resulting in its greater association with proteins in tear fluid compared to potassium (Table 2).
However, the consistent KCl fractions suggest that impurities are not a significant factor in KCl crystallization. The hinderance of the NaCl crystallization may reflect the disease’s impact on microcirculation. The NaCl/KCl crystallization ratio may influence disease progression and its retinal effects [38]. The overall decrease in crystal texture points to a more disrupted tear film structure. These findings highlight the role of Na/K imbalances in the pathology of the syndrome.
XRD analysis of tear fluid from SM patients (Sample 4) shows a marked decrease in the Iint of the NaCl 200 and 220 reflections, indicating a significant deficiency in clean balanced electrolyte, reflecting impaired tear production (Figure 3). This phenomenon may result from increased sodium binding to proteins in tear fluid under the chronic inflammation typical of SM, which hinders NaCl crystallization and leads to a reduction in its free concentration. This also intensifies osmotic balance changes, contributing to ionic composition imbalances. Simultaneously, an increase in KCl levels suggests shifts in the ionic composition, while the reduction in crystal texture to 0.55 indicates a disrupted tear film structure (Table 2). This electrolyte imbalance is further associated with the inflammatory processes typical of SM, affecting both tear composition and ocular health [46].
In patients with Dry Eye Syndrome (DES) (Sample 5), there are notably low levels of sodium chloride (NaCl) and decreased levels of potassium chloride (KCl) (Table 2, Figure 3), indicating hyperosmolarity and ionic imbalance [39,41,47,48]. The minimal integral intensities of the NaCl 200 and 220 XRD reflections in tear samples suggest a significant decreased amount of water in electrolytes, which may result from the hyperosmolarity characteristic of DES (Figure 3). Concurrently, the KCl fraction rises (up to 0.36), pointing to alterations in osmotic balance caused by chronic dryness and inflammation. Additionally, the crystal texture in these samples is the lowest among all tested (0.41), which suggests the disruption of the lipid layer of the eye in DES patients (Table 2). This ionic imbalance contributes to tear film instability and exacerbates ocular surface inflammation, emphasizing the importance of maintaining proper osmotic conditions for ocular health [41,49]. Changes in the salt ratio, in turn, influence the structural properties of tear fluid, which was previously demonstrated in our study through AFM analysis of the surface of dried tear fluid samples. Similar results were reported by the authors [37], who emphasized the crucial role of salts and polymers in tear fluid as key factors influencing the crystallization of fern-like structures. These findings were based on microscopic photographic analysis of tear crystal samples conducted within the framework of a fern formation test.
In addition to the analyzed tear fluid samples from five patients, XRD were conducted on four additional samples obtained from healthy subjects to confirm the representativeness of the data. Figure 4 shows the XRD pattern of these samples, highlighting the crystalline structure of the salt components present in the tear fluid of healthy people.
Figure 4. Grazing-incidence XRD (ω = 1.0°) patterns of dried tear samples from healthy controls (ages 29, 48, 49, 79 years old) plotted on a linear scale; curves are vertically offset for clarity. Tick marks indicate reference 2θ positions (Cu Kα) from ICDD PDF-2 (formerly JCPDS) [43] for NaCl and KCl (rock-salt, Fm–3m (225)). Measured under the same GIXRD conditions as Figure 3; Si substrate reflections are suppressed by the grazing-incidence geometry. XRD patterns are shown in counts per second (cps).
Biophysica 05 00048 g004
As shown in Figure 4, all XRD patterns exhibit distinct diffraction reflections corresponding to the crystalline structures of NaCl and KCl, with the most intense reflections observed in the control sample from the 79-year-old subject. These findings indicate a normal osmotic balance and the absence of pathological changes in the tear fluid. Minor variations in reflection intensity and 2θ position likely reflect individual physiological differences. The presence of characteristic NaCl reflections at 200 and 220 aligns with the XRD results (Table 2, Figure 3), where the control sample (Sample 1) shows the highest NaCl 200/220 reflection intensities and minimal evidence of ionic imbalance. No Si substrate reflections are visible because the patterns were recorded in grazing-incidence XRD with ω = 1.0°, which minimizes the Si (100) diffracted volume and does not fulfill the symmetric Bragg condition for the substrate (see Materials and Methods).
Findings indicate that patients with eye diseases exhibit reduced crystallization of NaCl compared to healthy controls. Overall, variations in the intensities of NaCl and KCl, along with changes in crystal texture observed through XRD, can serve as important in-dicators of ocular diseases and alterations in the osmotic, and electrolyte composition of tear fluid. The results of XRD showed increased amounts of KCl, while the texture of NaCl decreased, could be explained by several factors, including ion exchange and electrochemical properties [24,39,45,47,49].
In addition to XRD analysis, the pole density (Pi) and orientation factor (f) were calculated. These values are essential for understanding the texture and anisotropy of the sample, which affect its properties. These calculations identify crystallization patterns for NaCl and KCl, validating previous findings on tear film disruptions and eye health. The crystallization patterns provide further evidence of tear film abnormalities, potentially linking them to specific eye diseases. The sample texture was evaluated using the Harris method, ideal for samples with a texture axis perpendicular to the substrate surface [50,51]. In this case, the pole density can be calculated by using the following formula:
P i =   I i I 0 i 1 N i   =   1 N I i I 0 i ,
where Ii and I0i are the integral intensities of the i-th reflection for the sample and the reference standard, respectively.
N is the number of lines present in the X-ray diffractogram.
The pole density (ordinate axis in Figure 5) measures how crystallites in the sample are oriented relative to a reference direction. A pole figure represents this orientation distribution: a high pole density indicates that many crystallites are aligned in the same direction, while a lower density suggests a more random orientation.
The pole density (Pi) calculations presented in Figure 5 confirm our XRD analysis results and provide insights into the changes in crystal growth orientation of NaCl and KCl across different samples, depending on the disease. This structural anisotropy reflects key disturbances in the tear film. Our previous studies using AFM, XRD, and EDX methods confirmed that the disease can affect the structural characteristics of the tear film. For example, changes in crystallite orientation may result from tear film instability, leading to increased evaporation or uneven tear break-up [37]. These disturbances are reflected in the crystallization patterns observed in the NaCl and KCl samples.
The pole densities Pi for NaCl and KCl in Samples 1–5 (Figure 5) vary between the 200 and 220 reflections. For NaCl, Pi of the 200 reflection exceeds Pi of the 220 one in Samples 3–5, indicating stronger alignment in the orientation along [100] crystallographic direction (note that [200] and [100] are equivalent; see Figure 5a). As mentioned earlier, this may be due to disrupted tear secretion and changes in osmotic pressure [38,44]. For KCl, a gradual increase of Pi is observed across Samples 1–5 (Figure 5b), which indicates a shift in ionic balance characteristic of patients with eye diseases [24].
In addition to pole density, we also calculated the orientation factor for all five samples. This dimensionless quantity reflects the degree of crystallographic orientation in a sample, providing insights into the structural arrangement of biomolecules or crystals. In the context of tear fluids, the orientation factor may be influenced by biochemical composition and structural alterations caused by various diseases. Understanding these factors helps elucidate molecular interactions and potential crystallization processes during the drying of tear fluids.
The orientation factor is a parameter for assessing the structural organization of dried tear fluids, offering insights into molecular alignment during crystallization. Biologically, variations in the orientation factor may reflect underlying pathological changes in tear composition, particularly in relation to protein aggregation or lipid alterations. Crystallographically, these differences can be quantified and interpreted through orientation factor calculations, providing a powerful tool for diagnosing and understanding tear-related diseases.
The orientation factor (f) was calculated from the alignment of specific reflections (e.g., NaCl 200, KCl 220) with respect to the sample surface. High values of the orientation factor indicate strong crystal alignment, which may correlate with the severity of the disease. The orientation factor can be derived from the pole figures by analyzing the intensity of specific reflections. All important textures share the same indices, which correspond to the highest Pi value. In crystallography, the orientation factor is typically calculated using the following formula:
f   = 1 N i   =   1 N P i 1 2
In this context, the orientation factor reflects how well the molecules in the tear fluid align during the drying process. In diseased states, such as dry eye syndrome or ocular surface inflammation, the composition and structure of tear proteins, and lipids may be altered, affecting their orientation and crystallization behavior.
High orientation factors indicate a more ordered crystalline structure, which could serve as a signature of certain pathological conditions. The relationship between the orientation factor (f) and the disease in dried tear fluid samples is shown in Figure 6.
The graphs in Figure 6 (for KCl and NaCl samples) display the orientation factor of dried tear fluid samples from patients with different conditions. The ordinate axis represents the orientation factor in arbitrary units (a.u.), while the abscissa axis denotes the sample numbers. For KCl, the orientation factor increases with greater molecular alignment, peaking at Sample 5, which provides insight into the structural organization of tear fluid components upon drying.
In contrast, the orientation factors for NaCl show significant variability, with noticeable fluctuations across samples. The decrease in the orientation factor for NaCl aligns with previous results and is associated with a shift in texture component from {200} to {220}.

3. Discussion

The present study’s analysis of dried tear samples using XRD reveals significant alterations in the crystallization patterns of electrolytes among patients with various ocular diseases compared to healthy controls. These findings align with and extend previous research emphasizing the critical role of electrolyte balance in maintaining tear film stability and ocular surface health.
In patients with SM, a notable reduction in the Iint of the NaCl 200 and 220 reflections (see Table 2 and Figure 3) suggests a depletion of free sodium and chloride ions in the tear fluid, consistent with an ionic imbalance. This may be attributed to increased sodium binding to tear proteins, a process likely driven by chronic inflammation, consistent with earlier reports linking inflammatory conditions to altered tear composition [23,38,52]. The increase in the KCl fraction together with reduced crystal texture (f ≈ 0.55) further indicates a shift toward a less ordered structure (see Table 2 and Figure 6). This pattern is consistent with tear film structural compromise, which has been associated with impaired tear-film function and ocular-surface damage [24,41,48,49].
The DES group exhibited even more pronounced reductions in the Iint of the NaCl and KCl reflections (see Table 2 and Figure 3), together with the lowest measured crystal texture 0.41 (see Table 2), highlighting the marked structural compromise of the tear film. These results correspond well with the hyperosmolarity and lipid layer damage documented in the literature as key pathogenic mechanisms in DES [24,39,41]. The impaired lipid layer disrupts tear film integrity, exacerbating evaporation, and inflammation, as reflected in the altered crystallization patterns observed.
In contrast, healthy control samples displayed clear, well-defined NaCl and KCl diffraction reflections, indicative of normal osmotic balance and tear film architecture, with minor inter-individual variations likely attributable to physiological differences. This contrast reinforces the potential of XRD-based analysis as a diagnostic tool to detect early or subtle tear film abnormalities.
Calculations of pole density (Pi) and orientation factor (f) provided additional insight into the molecular organization within the tear film. Enhanced orientation of NaCl and KCl crystals in certain crystallographic planes among patients with ocular diseases underscores the structural anisotropy induced by ionic imbalances and inflammation. These parameters, as sensitive markers of tear film disruption, could complement existing diagnostic criteria and offer novel quantitative metrics for monitoring disease progression and therapeutic efficacy.
Taken together, these findings confirm that ocular diseases profoundly influence tear fluid electrolyte composition and crystallization behavior. The imbalance between sodium and potassium ions, and the accompanying structural changes destabilize the tear film, promoting chronic inflammation and ocular surface pathology. This work supports and expands upon existing models of tear film dysfunction and underscores the importance of maintaining osmotic and electrolyte homeostasis for ocular health.
We acknowledge that each disease was represented by a single individual, and therefore the present results should be considered as original proof-of-concept with personalized approach. Although the sample size is limited, the study focuses on individual uniqueness, which aligns with the principles of personalized medicine. Particularly noteworthy is the inclusion of a sample from a patient with Susac syndrome, a rare autoimmune disease, which provides a unique and valuable contribution to the analysis.
Another key advantage of this work is the application of novel and original physical techniques, including X-ray diffraction, atomic force microscopy, and energy-dispersive X-ray spectroscopy. These methods are not yet used in clinical practice and remain experimental, but they demonstrate strong potential for revealing detailed structural and chemical differences in tear fluid associated with various pathological states. Together, these findings lay important groundwork for future large-scale studies, and in the next phase, we aim to validate and expand these observations by investigating structural and compositional differences in tear fluid using a larger number of samples, ideally supported by statistical analysis.
Future research directions should explore longitudinal monitoring of tear fluid crystallization patterns in patients undergoing treatment to evaluate the potential of these parameters as biomarkers for therapeutic response. Additionally, expanding the sample size and including a broader range of ocular surface diseases could further validate, and refine the diagnostic utility of XRD analysis. Investigating the molecular mechanisms underlying sodium binding to tear proteins and its impact on tear film stability may also uncover new therapeutic targets.
In conclusion, the application of XRD and texture analysis to tear fluid offers a promising avenue for non-invasive, sensitive assessment of ocular surface health, with potential implications for early diagnosis, disease monitoring, and personalized treatment strategies.
To our knowledge, this is the first study to apply a combination of XRD, AFM, EDX, and SEM for the analysis of tear fluid microdesiccates in patients with inflammatory and neurodegenerative diseases. The novelty of this approach lies in its ability to assess the structural anisotropy, nanoscale surface morphology, and orientation factor (f) of salt crystals in dried tear fluid samples—parameters that are not accessible using conventional biochemical assays. EDX elemental mapping provided spatially resolved insight into the distribution and concentration of key tear film ions (Na+, K+, Cl), revealing condition-specific changes such as increased Na/K ratios and decreased potassium, and chloride levels in samples from patients with multiple sclerosis and dry eye syndrome. These results align with previous studies linking tear electrolyte imbalances to ocular surface pathology and systemic disease processes [16,24,48,53]. Furthermore, XRD analysis confirmed alterations in crystal texture and orientation between pathological and control samples, reinforcing the hypothesis that structural characteristics of tear fluid desiccates reflect disease-specific molecular changes. The presented application of this methodology provides a novel, non-invasive, label-free analytical platform with strong potential for future development of personalized diagnostic tools based on tear fluid analysis.

4. Materials and Methods

The morphology of the tear fluid desiccate surface samples was examined using a high-resolution Zeiss Gemini DSM 982 Scanning Electron Microscope (Carl Zeiss, Oberkochen, Germany) equipped with a Schottky emitter operating at 5 kV. The chemical composition of the desiccated samples was determined using energy-dispersive spectroscopy (Oxford Instruments X-act; Oxford Instruments, Oxford, UK). Phase mapping of selected microstructures was performed by electron backscatter diffraction using an Oxford NordlysMax2 detector (Oxford Instruments, Abingdon, Oxfordshire, UK).
To determine the phase state of the samples examined in this study, X-ray diffraction analysis was performed. The XRD patterns were obtained using a Rigaku RU-200 rotating anode X-ray machine with an R-axis IV 2D area detector (Rigaku Corp., Tokyo, Japan) and a monochromatized Kα-modified copper anode (λ = 0.15406 nm, U = 40 kV, I = 40 mA).
XRD patterns were collected in grazing-incidence geometry with the incidence angle fixed at ω = 1.0°. The detector arm was scanned over 2θ = 20–80° in step-scan mode (Δ2θ = 0.02°; 1 s per step). The incident slit was adjusted to keep the beam footprint within the 10 × 10 mm2 substrate.” Standard instrument settings were used for the divergence and receiving slits. Phase identification relied on the agreement of 2θ positions and indexing of the observed reflections with ICDD PDF-2 (formerly JCPDS) reference entries [43]. Relative intensities in the PDF-2 (Imax) were considered qualitatively only; quantitative analyses in this work are based on integral intensities (Iint, cps·deg) after background subtraction. No Cu–Kα2 correction was applied.
To estimate phase fractions, we integrated the areas of the 200 and 220 reflections for each phase after linear background subtraction, yielding Iint in cps·deg.
Identical acquisition and fitting procedures were used for all samples. The KCl fraction QKCl was defined as
Q K C l = I K C l , 200 + I K C l , 220 I N a C l , 200 + I N a C l , 220 + I K C l , 200 + I K C l , 220 ,
where I denotes the reflection integral intensities (cps·deg) after background subtraction.
The NaCl fraction was defined as QNaCl = 1 − QKCl. Because the measurement geometry and preferred orientation (texture) can affect absolute intensities, these fractions are considered semi-quantitative; therefore, we also report within-pattern normalized values and intensity ratios. An atomic force microscope Dimension Icon® (Bruker, Camarillo, CA, USA) was used to identify and compare structural changes in tear fluid samples from healthy individuals and patients with various diseases. Desiccated tear fluid samples (2 µL) were analyzed in tapping mode using silicon probes (MicroMasch, Berkley, CA, USA, NSC35 series) with tip radius ~10 nm. The measurements were performed in air at room temperature (~21 °C). The cantilevers used (MicroMasch NSC35 series) had a nominal resonance frequency of approximately 150 kHz. The cantilever oscillation amplitude during scanning was approximately 50 nm, with the amplitude setpoint maintained at ~70% of the free amplitude. Each sample was scanned at two different positions—in the center and at the edge of the dried tear fluid area—to account for possible spatial heterogeneity. The data were processed using ScanAsyst™ 8.15 software (Bruker, Billerica, MA, USA).
The samples selected for our research included healthy control subjects (n = 4) and experimental patients (n = 4) diagnosed with primary open-angle glaucoma, Susac syndrome, multiple sclerosis, and dry eye syndrome. The age of participants ranged from 29 to 79 years. Exact demographics at the time of sampling were as follows. Controls: C1 (male, 29 years old (y.o.); 23 January 2025), C2 (female, 48 y.o.; 17 January 2025), C3 (female, 49 y.o.; 17 January 2025), C4 (female, 79 y.o.; 16 January 2025). Patients: P2 (POAG; female, 81 y.o.; 13 May 2021), P3 (Susac syndrome; male, 31 y.o.; 4 March 2021), P4 (SM; female, 49 y.o.; 10 May 2021), P5 (DES; female, 48 y.o.; 1 September 2024). For each patient with a diagnosed condition, a healthy age-matched donor was selected, ensuring comparability between the groups. Patients were excluded from tear fluid collection if they met any of the following criteria: presence of severe ophthalmological conditions, use of contact lenses, or severe systemic diseases such as cancer, cardiovascular disorders, neurodegenerative, or autoimmune diseases. The study was conducted in accordance with the Declaration of Helsinki. Ethical approval for the study was granted by the Ethics Committee of the Louis Pasteur University Hospital in Košice (protocol code 2020/EK/06042) for studies involving human tear fluid on 25 June 2020. Additional consent for conducting the research was granted by the Ethics Committee at Pavol Jozef Šafárik University in Košice, Slovakia. Written informed consent was obtained from all participants.
Unstimulated tear fluid samples from the left eye were collected using glass microcapillaries (ACCU-FILL 90 MICROPET, Becton, Dickinson and Co., Clay Adams, South San Francisco, CA, USA), from eight volunteers who agreed to participate in the study and provided informed consent. This collection method using 2 µL glass microcapillary tubes, following the procedure described by J. Nättinen et al. (2018) [54]. The influence of the diurnal rhythm was taken into account by collecting all tear fluid samples during the first half of the day under standardized conditions. This method was chosen to minimize dilution by saline and to preserve the native structure of the samples during subsequent measurements. All collected samples were stored at −80 °C until further analysis.
Before analysis, each tear sample (2 µL) was subsequently deposited onto cleaned silicon substrates (10 × 10 mm2) with (100) orientation and dried at laboratory temperature (25 °C) without fixation or airflow. Because both the deposited volume (2 µL) and the spreading area (10 × 10 mm2) were fixed for all specimens, the average thickness of the dried films was approximately the same across samples. Drying inevitably produces faceted crystallites and ring-like deposits, so minor thickness variations occur; however, these do not affect our analysis, which relies on integrated intensities areas expressed as within-pattern normalized values and on within-phase intensity ratios To minimize the impact of ambient humidity, samples were stored in a vacuum desiccator between measurements to ensure stable environmental conditions and prevent moisture-induced alterations. The same preparation protocol was applied to all samples to ensure consistency.
Silicon substrates were cleaned using a two-step ultrasonic cleaning procedure: first, in acetone for 5 min, followed by a second cleaning in isopropanol under the same conditions. After cleaning, the substrates were dried with nitrogen gas under pressure. All experiments were carried out at a relative humidity of 41%.

5. Conclusions

A comprehensive analysis of tear fluid using X-ray diffraction, atomic force microscopy, and energy dispersive spectroscopy revealed differences in crystallization, ionic composition, and morphology of desiccants in healthy individuals and patients with inflammatory and neurodegenerative diseases (dry eye syndrome, glaucoma, multiple sclerosis). Crystallization abnormalities and increased Na/K ratio are considered as potential diagnostic markers of various eye diseases.
AFM provided high-resolution nanoscale visualization of morphological differences in microdesiccants of tear fluid, while EDX provided quantitative elemental analysis (Na, K, Cl). Increased Na/K ratio and disorganized crystal structure were identified as potential markers of conditions such as dry eye syndrome, primary open-angle glaucoma, and multiple sclerosis. We sugest, that changes in NaCl crystal texture are closely related to the increased ability of sodium to form strong interactions with proteins, leading to its tighter binding under pathological conditions.
Despite the individual approach to the samples, this personalized study identified clear differences in the composition and morphology of tear fluid between experimental samples, confirming the feasibility and diagnostic potential of using XRD, AFM, and EDX for tear fluid analysis in patients with various diseases.
This study demonstrates that physical methods of analysis provide detailed information on the structural and elemental composition of tear fluid and have high potential for the development of effective non-invasive diagnostic strategies. Future studies should focus on longitudinal analysis of tear fluid, namely, long-term observation of its changes in the same patients over time, in order to more deeply study its diagnostic potential, as well as assess the clinical applicability of the data obtained for disease monitoring.

Author Contributions

Conceptualization, V.K. and D.K.; methodology, D.K., V.T., T.K. and O.D.; software, O.M.; validation, V.K. and H.Y.; formal analysis, O.D. and D.K.; investigation, D.K., O.M. and H.Y.; resources, V.K.; data curation, D.K.; writing—original draft preparation, D.K.; writing—review and editing, V.K. and V.T.; visualization, D.K.; supervision, V.K.; project administration, V.K.; funding acquisition, V.K. All authors have read and agreed to the published version of the manuscript.

Funding

This work was supported by grant from the Slovak Research and Development Agency under contract APVV-23-0049. The X-ray measurements performed at Argonne (HY) were supported by the U.S. Department of Energy (DOE), Office of Basic Energy Science (BES), Materials Sciences, and Engineering Division under contract no. DE-AC02-06CH11357.

Institutional Review Board Statement

The study was performed following the Declaration of Helsinki. Signed written informed consent was obtained from all participants. The study was approved on 25 June2020 by the ethical committee of Louis Pasteur University Hospital in Košice, (protocol code 2020/EK/06042) for studies involving human tear fluid. The consent to conduct this research was granted by the Ethics committee at the Pavol Jozef Šafárik University in Košice, Slovakia.

Informed Consent Statement

Informed consent was obtained from all subjects involved in the study.

Data Availability Statement

The original contributions presented in this study are included in the article. Further inquiries can be directed to the corresponding authors.

Conflicts of Interest

The authors declare no conflicts of interest.

Abbreviations

The following abbreviations are used in this manuscript:
XRDX-ray Diffraction
AFMAtomic Force Microscopy
EDXEnergy-Dispersive X-ray Spectroscopy
POAGPrimary Open-Angle Glaucoma
SMMultiple Sclerosis
DESDry Eye Syndrome
Na+/K+-ATPaseThe sodium–potassium pump
Na+Sodium Ion
K+Potassium Ion
NaClSodium Chloride
KClPotassium Chloride
CCarbon
ClChlorine
OOxygen
PiPole Density
fOrientation Factor
ωIncidence angle
ImaxMaximum intensities
IintIntegral intensities

References

  1. Adigal, S.S.; Rizvi, A.; Rayaroth, N.V.; John, R.V.; Barik, A.; Bhandari, S.; George, S.D.; Lukose, J.; Kartha, V.B.; Chidangil, S. Human Tear Fluid Analysis for Clinical Applications: Progress and Prospects. Expert Rev. Mol. Diagn. 2021, 21, 1077–1089. [Google Scholar] [CrossRef]
  2. Ravishankar, P.; Daily, A. Tears as the Next Diagnostic Biofluid: A Comparative Study between Ocular Fluid and Blood. Appl. Sci. 2022, 12, 2884. [Google Scholar] [CrossRef]
  3. Barmada, A.; Shippy, S.A. Tear Analysis as the Next Routine Body Fluid Test. Eye 2020, 34, 1731–1733. [Google Scholar] [CrossRef]
  4. Pflugfelder, S.C.; Stern, M.E. Biological Functions of Tear Film. Exp. Eye Res. 2020, 197, 108115. [Google Scholar] [CrossRef]
  5. Masoudi, S. Biochemistry of Human Tear Film: A Review. Exp. Eye Res. 2020, 220, 109101. [Google Scholar] [CrossRef]
  6. von Thun und Hohenstein-Blaul, N.; Funke, S.; Grus, F.H. Tears as a Source of Biomarkers for Ocular and Systemic Diseases. Exp. Eye Res. 2013, 117, 126–137. [Google Scholar] [CrossRef]
  7. You, J.; Willcox, M.D.; Madigan, M.C.; Wasinger, V.; Schiller, B.; Walsh, B.J.; Graham, P.H.; Kearsley, J.H.; Li, Y. Chapter Four—Tear Fluid Protein Biomarkers. Adv. Clin. Chem. 2013, 62, 151–196. [Google Scholar] [CrossRef] [PubMed]
  8. Thomas, K.M.; Ajithaprasad, S.; N, M.; Pavithran, S.; Chidangil, S.; Lukose, J. Raman Spectroscopy Assisted Tear Analysis: A Label-Free, Optical Approach for Noninvasive Disease Diagnostics. Exp. Eye Res. 2024, 243, 109913. [Google Scholar] [CrossRef]
  9. Ansari, P.; Tabasumma, N.; Snigdha, N.N.; Siam, N.H.; Panduru, R.V.N.R.S.; Azam, S.; Hannan, J.M.A.H.; Abdel-Wahab, Y.H.A. Diabetic Retinopathy: An Overview on Mechanisms, Pathophysiology, and Pharmacotherapy. Diabetology 2022, 3, 159–175. [Google Scholar] [CrossRef]
  10. Perumal, N.; Funke, S.; Kegel, M.; Scieranski, M.; Pfeiffer, N.; Grus, F.H. In-Depth Protein Profiling and Identification of Tear Fluid Biomarkers in the Glaucomatous Eye. Investig. Ophthalmol. Vis. Sci. 2015, 56, 3656. [Google Scholar] [CrossRef]
  11. Li, Y.; Mitchell, W.; Elze, T.; Zebardast, N. Association Between Diabetes, Diabetic Retinopathy, and Glaucoma. Diabetes Ther. 2021, 21, 38. [Google Scholar] [CrossRef]
  12. Camerlingo, C.; Lisitskiy, M.; Lepore, M.; Portaccio, M.; Montorio, D.; Del Prete, S.; Cennamo, G. Characterization of Human Tear Fluid by Means of Surface-Enhanced Raman Spectroscopy. Sensors 2019, 19, 1177. [Google Scholar] [CrossRef]
  13. Tomečková, V.; Tkáčiková, S.; Talian, I.; Kondrakhova, D.; Zakutanská, K.; Fabriciová, G.; Hovan, A.; Skirková, M.; Komanický, V.; Tomašovičová, N. Experimental Analysis of Tear Fluid and Its Processing for the Diagnosis of Multiple Sclerosis. Sensors 2023, 23, 5251. [Google Scholar] [CrossRef]
  14. Wuens, J.Y.; Sze, Y.H.; Bian, J.F.; Lam, T.C. Critical Role of Mass Spectrometry Proteomics in Tear Biomarker Discovery for Multifactorial Ocular Diseases (Review). Int. J. Mol. Med. 2021, 47, 83. [Google Scholar] [CrossRef]
  15. Wang, Q.; Hu, L.; Jiao, C.; Wang, X.; Wang, Y.; Sun, K.; Li, L.; Fan, Y. A Hydrogel-Based Biosensor for Stable Detection of Glucose. Biosens. Bioelectron. 2023, 221, 114908. [Google Scholar] [CrossRef]
  16. Nättinen, J.; Aapola, U.; Nukareddy, P.; Uusitalo, H. Clinical Tear Fluid Proteomics—A Novel Tool in Glaucoma Research. Int. J. Mol. Sci. 2022, 23, 8136. [Google Scholar] [CrossRef] [PubMed]
  17. Winiarczyk, M.; Biela, K.; Michalak, K.; Winiarczyk, D.; Mackiewicz, J. Changes in Tear Proteomic Profile in Ocular Diseases. Int. J. Environ. Res. Public Health 2022, 19, 13341. [Google Scholar] [CrossRef] [PubMed]
  18. Hagan, S.; Martin, E.; Enríquez-de-Salamanca, A. Tear Fluid Biomarkers in Ocular and Systemic Disease: Potential Use for Predictive, Preventive, and Personalised Medicine. EPMA J. 2016, 7, 15. [Google Scholar] [CrossRef] [PubMed]
  19. Spörri, L.; Uldry, A.-C.; Kreuzer, M.; Herzog, E.L.; Zinkernagel, M.S.; Unterlauft, J.D.; Zysset-Burri, D.C. Exploring the Ocular Surface Microbiome and Tear Proteome in Glaucoma. Int. J. Mol. Sci. 2024, 25, 6257. [Google Scholar] [CrossRef]
  20. Zhao, Y.; Qiu, P.; Shen, T. Gut Microbiota and Eye Diseases: A Review. Medicine 2024, 103, e39866. [Google Scholar] [CrossRef]
  21. Yang, Q.; Yu, H.; Xu, L.; Yu, M.; Zhang, Y. Relationship Between Gut Microbiota and Multiple Sclerosis: A Scientometric Visual Analysis from 2010 to 2023. Front. Immunol. 2024, 15, 1451742. [Google Scholar] [CrossRef]
  22. Ahmad, I.; Omura, S.; Khadka, S.; Sato, F.; Park, A.-M.; Rimal, S.; Tsunoda, I. Gut Microbiota in a Viral Model of Multiple Sclerosis: Modulation and Pitfalls by Oral Antibiotic Treatment. Cells 2025, 14, 871. [Google Scholar] [CrossRef]
  23. Fotovat-Ahmadi, N.; Siddiqui, O.; Ong, J.; Thanitcul, C.; Reinhardt, C.; Cologna, S.M.; Aakalu, V.K. The Ocular Surface Tear Film as a Biomarker for Systemic Health. Ocul. Surf. 2025, 37, 283–300. [Google Scholar] [CrossRef]
  24. Harrell, C.R.; Feulner, L.; Djonov, V.; Pavlovic, D.; Volarevic, V. The Molecular Mechanisms Responsible for Tear Hyperosmolarity-Induced Pathological Changes in the Eyes of Dry Eye Disease Patients. Cells 2023, 12, 2755. [Google Scholar] [CrossRef]
  25. Castillo-Castañeda, S.M.; Cordova-Gallardo, J.; Chavez-Pacheco, J.L.; Ramírez-Mejía, M.M.; Rivera-Espinosa, L.; Méndez-Sánchez, N. Bilirubin Molecular Species Play an Important Role in the Pathophysiology of Acute-on-Chronic Liver Failure. Int. J. Mol. Sci. 2024, 25, 8181. [Google Scholar] [CrossRef] [PubMed]
  26. Tamhane, M.; Cabrera-Ghayouri, S.; Abelian, G.; Viswanath, V. Review of Biomarkers in Ocular Matrices: Challenges and Opportunities. Pharm. Res. 2019, 36, 40. [Google Scholar] [CrossRef]
  27. Krajčíková, K.; Semančíková, E.; Zakutanská, K.; Kondrakhova, D.; Mašlanková, J.; Stupák, M.; Stupák, M.; Talian, I.; Tomašovičová, N.; Kimáková, T.; et al. Tear Fluid Biomarkers in Major Depressive Disorder: Potential of Spectral Methods in Biomarker Discovery. J. Psychiatr. Res. 2021, 138, 75–82. [Google Scholar] [CrossRef]
  28. Kondrakhova, D.; Unger, M.; Stadler, H.; Zakutanská, K.; Tomašovičová, N.; Tomečková, V.; Horák, J.; Kimakova, T.; Komanický, V. Determination of Diabetes Mellitus Disease Markers in Tear Fluid by Photothermal AFM-IR Analysis. Nanomedicine 2025, 64, 102803. [Google Scholar] [CrossRef] [PubMed]
  29. López-Solís, R.; Traipe-Castro, L.; Salinas-Toro, D.; Srur, M.; Toledo-Araya, H. Microdesiccates Produced from Normal Human Tears Display Four Distinctive Morphological Components. Biol. Res. 2013, 46, 299–305. [Google Scholar] [CrossRef] [PubMed]
  30. Almutleb, E.S.; El-Hiti, G.A.; Al-Dawas, H.A.; Alanzi, M.K.; Alquwayi, M.; Alotaibi, A.G.; Baashen, M.A.; Altoaimi, B.H.; Alanazi, S.A.; Masmali, A.M. Effect of Monovalent Electrolyte Solutions on the Human Tear Fering Pattern. PLoS ONE 2023, 18, e0280853. [Google Scholar] [CrossRef]
  31. Traipe-Castro, L.; Salinas-Toro, D.; López, D.; Zanolli, M.; Srur, M.; Valenzuela, F.; Cáceres, A.; Toledo-Araya, H.; López-Solís, R. Dynamics of Tear Fluid Desiccation on a Glass Surface: A Contribution to Tear Quality Assessment. Biol. Res. 2014, 47, 25. [Google Scholar] [CrossRef] [PubMed]
  32. Traipe Salas, F.; Traipe Castro, L.; Salinas Toro, D.; López, D.; Valenzuela, F.; Cartes, C.; Toledo Araya, H.; Pérez, C.; López Solís, R. Progress in Tear Microdesiccate Analysis by Combining Various Transmitted Light Microscope Techniques. Biol. Res. 2016, 49, 28. [Google Scholar] [CrossRef] [PubMed]
  33. Golding, T.R.; Baker, A.T.; Rechberger, J.; Brennan, N.A. X-ray and Scanning Electron Microscopic Analysis of the Structural Composition of Tear Ferns. Cornea 1994, 13, 58–66. [Google Scholar] [CrossRef]
  34. Kogbe, O.; Liotet, S. An Interesting Use of the Study of Tear Ferning Patterns in Contactology. Ophthalmologica 1987, 194, 150–153. [Google Scholar] [CrossRef]
  35. Pirahanchi, Y.; Jessu, R.; Aeddula, N.R. Physiology, Sodium Potassium Pump. In StatPearls; StatPearls: Treasure Island, FL, USA, 2023. Available online: https://www.ncbi.nlm.nih.gov/books/NBK537088/ (accessed on 4 October 2024).
  36. Almássy, J.; Diszházi, G.; Skaliczki, M.; Márton, I.; Magyar, Z.É.; Nánási, P.P.; Yule, D.I. Expression of BK Channels and Na+-K+ Pumps in the Apical Membrane of Lacrimal Acinar Cells Suggests a New Molecular Mechanism for Primary Tear-Secretion. Ocul. Surf. 2019, 17, 272–277. [Google Scholar] [CrossRef]
  37. Wu, Y.; Wang, C.; Wang, X.; Mou, Y.; Yuan, K.; Huang, X.; Jin, X. Advances in Dry Eye Disease Examination Techniques. Front. Med. 2022, 8, 826530. [Google Scholar] [CrossRef]
  38. Ekweremadu, E.N.; Ezeh, C.O. Tear and Serum Electrolyte Concentrations as a Biomarker in Primary Glaucoma Subjects. Life Res. 2021, 4, 5. [Google Scholar] [CrossRef]
  39. Ashok, N.; Khamar, P.; D’Souza, S.; Gijs, M.; Ghosh, A.; Sethu, S.; Shetty, R. Ion Channels in Dry Eye Disease. Indian J. Ophthalmol. 2023, 71, 1215–1226. [Google Scholar] [CrossRef]
  40. Farid, R.M.; El-Salamouni, N.S.; El-Kamel, A.H.; El-Gamal, S.S. Lipid-Based Nanocarriers for Ocular Drug Delivery. In Nanostructures for Drug Delivery; Micro and Nano Technologies; Elsevier: Amsterdam, The Netherlands, 2017; pp. 495–522. [Google Scholar] [CrossRef]
  41. Lindgren, E.S.; Cil, O.; Verkman, A.S.; Pasricha, N.D. Ocular Surface Ion Transport and Dry Eye Disease. Curr. Ophthalmol. Rep. 2022, 10, 188–197. [Google Scholar] [CrossRef] [PubMed]
  42. Sarmout, M.; Xiao, Y.; Hu, X.; Rakhmetova, A.; Koole, L.H. A Novel Approach to Achieve Semi-Sustained Drug Delivery to the Eye through Asymmetric Loading of Soft Contact Lenses. Heliyon 2023, 9, e16916. [Google Scholar] [CrossRef]
  43. International Centre for Diffraction Data (ICDD). Powder Diffraction File (PDF-2). Available online: https://www.icdd.com/pdf-2/ (accessed on 24 January 2025).
  44. Park, D.; Jung, Y. Atomic-Scale Understanding of Alkali Metal Cation Effects on Electro-Catalytic Reactions. Chem. Catal. 2024, 4, 100823. [Google Scholar] [CrossRef]
  45. Ekweremadu, E.N.; Eze, C.O.; Kamah, J.M. Tear Electrolytes Concentration in Hospital-Derived African Subjects. J. Ophthalmic Res. Ocul. Care 2021, 4, 78–85. [Google Scholar] [CrossRef]
  46. Kaur, G.; Singh, N.K. Inflammation and Retinal Degenerative Diseases. Neural Regen. Res. 2022, 18, 513–518. [Google Scholar] [CrossRef] [PubMed]
  47. Yusifov, T.N.; Abduragimov, A.R.; Narsinh, K.; Gasymov, O.K.; Glasgow, B.J. Tear Lipocalin is the Major Endonuclease in Tears. Mol. Vis. 2008, 14, 180–188. Available online: http://www.molvis.org/molvis/v14/a23 (accessed on 25 July 2025).
  48. Liu, H.; Begley, C.; Chen, M.; Bradley, A.; Bonanno, J.; McNamara, N.A.; Nelson, J.D.; Simpson, T. A Link Between Tear Instability and Hyperosmolarity in Dry Eye. Investig. Ophthalmol. Vis. Sci. 2009, 50, 3671–3679. [Google Scholar] [CrossRef]
  49. Woodward, A.M.; Senchyna, M.; Argüeso, P. Differential Contribution of Hypertonic Electrolytes to Corneal Epithelial Dysfunction. Exp. Eye Res. 2012, 100, 98–100. [Google Scholar] [CrossRef]
  50. Warren, B.E. X-Ray Diffraction; Dover: New York, NY, USA, 1990; p. 253. [Google Scholar]
  51. Umansky, Y.S. Crystallography, X-Ray Photography and Electron Microscopy; Metallurgy: Moscow, Russia, 1982; p. 632. [Google Scholar]
  52. Rajan, A.; Vishnu, J.; Shankar, B. Tear-Based Ocular Wearable Biosensors for Human Health Monitoring. Biosensors 2024, 14, 483. [Google Scholar] [CrossRef]
  53. Ponzini, E.; Santambrogio, C.; De Palma, A.; Mauri, P.; Tavazzi, S.; Grandori, R. Mass Spectrometry-Based Tear Proteomics for Noninvasive Biomarker Discovery. Mass Spectrom. Rev. 2022, 41, 842–860. [Google Scholar] [CrossRef]
  54. Nättinen, J.; Jylhä, A.; Aapola, U.; Enríquez-de-Salamanca, A.; Pinto-Fraga, J.; López-Miguel, A.; González-García, M.J.; Stern, M.E.; Calonge, M.; Zhou, L.; et al. Topical Fluorometholone Treatment and Desiccating Stress Change Inflammatory Protein Expression in Tears. Ocul. Surf. 2018, 16, 84–92. [Google Scholar] [CrossRef] [PubMed]
Figure 1. Comparison of the morphology of tear fluid microdesiccates from representative individual subjects (Samples 1–5). Subfigures (aj) show scanning electron microscopy (SEM) images that reveal noticeable differences in surface morphology while preserving a common underlying pattern. In each sample, three main zones (Zones I–III) and a transitional band are distinguishable; for illustration, these zones are explicitly indicated as examples in panels f and h. Subfigures (ko) present (AFM topography maps (left) with corresponding height profiles (right), acquired on oriented Si(100) substrates, demonstrating a variety of morphological forms and length scales. Scale bars are shown in SEM panels (aj).
Biophysica 05 00048 g001
Figure 2. SEM images (ae) of tear fluid microdesiccates with corresponding EDX elemental maps (Na, K, Cl) on Si(100) substrates, respectively, acquired over the same field of view as in (ae). The corresponding EDX spectrum from five representative samples on the left.
Biophysica 05 00048 g002
Figure 5. Pole density Pi for five samples of desiccated tear fluid, calculated for the 200 and 220 reflections of (a) NaCl and (b) KCl. Samples: 1—control; 2—POAG; 3—Susac syndrome; 4—SM; 5—DES. Marker shapes correspond to the two reflections as indicated in the in-figure legends.
Biophysica 05 00048 g005
Figure 6. Dependence of the orientation factor for dried tear fluid Samples 1–5: (a) NaCl; (b) KCl.
Biophysica 05 00048 g006
Table 1. Elemental composition (at. %) and Na/K ratio, obtained from the Kα lines, of five representative tear fluid microdesiccate samples obtained from EDX.
Elemental CompositionSample 1—
Control
Sample 2—
POAG
Sample 3—
Susac Syndrome
Sample 4—SMSample 5—DES
C 53.949.847.648.941.9
Si 22.129.532.131.242.9
O 10.09.48.89.88.7
Cl 7.05.55.64.93.2
Na 5.94.95.34.63.0
K 1.20.80.70.50.3
Na/K 4.96.17.69.210.0
Table 2. Integral intensities (Iint, cps·deg) of NaCl and KCl reflections in five tear fluid samples based on the type of disease, obtained after linear background subtraction (no Cu–Kα2 correction).
SamplesSample 1—
Control
Sample 2—
POAG
Sample 3—
Susac Syndrome
Sample 4—SMSample 5—DES
Reflection2θ (deg)Integral intensity, Iint (cps·deg)
NaCl 20031.702073.001479.00582.00161.00139.00
NaCl 22045.50265.00140.00191.00320.00137.00
KCl 20028.40276.00352.00237.00169.00142.00
KCl 22040.60205.00210.00122.0080.0027.00
 
SamplesS1S2S3S4S5
Reflection2θ (deg)Normalized Intensity (within pattern, %)
NaCl 20031.701.000.710.280.080.07
NaCl 22045.500.130.070.090.160.07
KCl 20028.400.130.170.110.080.07
KCl 22040.600.070.100.060.040.01
KCl fraction0.150.260.310.330.36
NaCl fraction QNaCl = 1 − QKCl0.850.740.690.670.66
Sample texture0.840.870.670.550.41
Disclaimer/Publisher’s Note: The statements, opinions and data contained in all publications are solely those of the individual author(s) and contributor(s) and not of MDPI and/or the editor(s). MDPI and/or the editor(s) disclaim responsibility for any injury to people or property resulting from any ideas, methods, instructions or products referred to in the content.

