Abstract
Icariin (ICA) is widely recognized for its health benefits. In this work, we examined the intermolecular interactions between ICA and proteinase K (PK) via multi-spectroscopic techniques and molecular simulations. The experimental findings revealed that ICA quenched the fluorescence emission of PK by forming a noncovalent complex. Both hydrogen bonding and van der Waals interactions are essential for the complex’s formation. Then Förster resonance energy transfer (FRET), competitive experiments, and synchronous fluorescence spectroscopy were adopted to verify the formation of the complex. Molecular docking studies demonstrated that ICA could spontaneously bind to PK by hydrogen bonding and hydrophobic interactions, which is consistent with the spectroscopic results. The PK-ICA complex’s dynamic stability was evaluated using a 50 ns molecular dynamics (MD) simulation. The simulation results revealed no significant structural deformation or positional changes throughout the entire simulation period. The complex appears to be rather stable, as seen by the average root-mean-square deviation (RMSD) fluctuations for the host protein in the PK-ICA complex of 1.08 Å and 3.09 Å. These outcomes of molecular simulations suggest that ICA interacts spontaneously and tightly with PK, consistent with the spectroscopic findings. The approach employed in this research presents a pragmatic and advantageous method for examining protein–ligand interactions, as evidenced by the concordance between empirical and theoretical findings.
1. Introduction
Icariin (ICA, Figure 1) is a main glycoside of quercetin that is isolated from Epimedium grandiflorum, a typical traditional Chinese herbal medicine with extensive medical uses for many years [1]. ICA has been widely used for its potent biological activities in treating or preventing cardiovascular diseases, osteoporosis, cartilage degradation, and sexual dysfunction [2,3]. According to recent reports, ICA may offer therapeutic and preventative benefits for the neurological system [4]. For instance, in animal models of Alzheimer’s disease, ICA can decrease the levels of amyloid precursor protein (APP) and β-site APP cleaving enzyme 1 and inhibit the development of amyloid β [4]. Moreover, ICA is considered as a potential anticancer agent for treating and preventing endometrial, cervical, lung, and various other cancers [5]. It has been documented that ICA can inhibit tumor cell growth, modulate the human immune system, and reverse drug resistance [6,7].
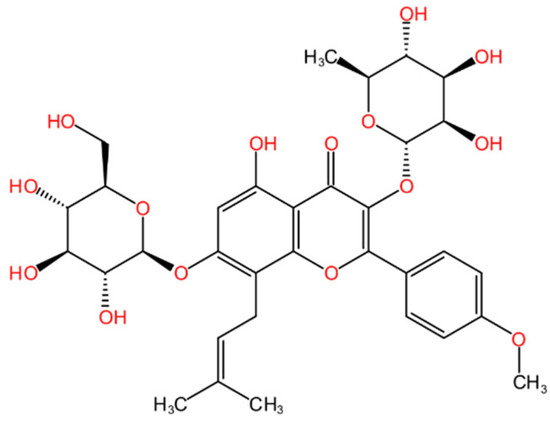
Figure 1.
Chemical structure of ICA.
Proteinase K (PK) is the principal proteolytic enzyme produced by the fungus Tritirachium album Limber [8]. This proteolytic enzyme exhibits preferential cleavage at the carboxyl-terminal peptide bonds of specific amino acid residues, demonstrating substantial hydrolytic activity toward both naturally folded and denatured protein substrates [9]. PK is extensively exploited due to its broad substrate specificity and strong activity in different applications such as nucleic acid purification, in vitro diagnostic tests, protein breakdown, food processing industries, and biological control against parasites [10]. The presence of two tryptophan residues (Trp8 and Trp212) in PK enables spectroscopic assays [11]. Furthermore, PK maintains activity over a wide pH range (4–12), with an optimal pH around 8.0 in 25–65 °C, whereas SDS and urea are present [12].
Few studies have looked at how flavonoids affect the stability, action, and structure of PK, despite a wealth of studies on the drug’s uses in biology, industry, and agriculture [11]. To further explore the interaction mechanism between typical flavonoids like ICA and proteins like PK, we applied spectroscopic approaches including UV–Vis spectroscopy and fluorescence spectroscopy in this study. These experimental methods were complemented by in silico techniques such as molecular docking and molecular dynamics (MD) simulations, which provided additional insights into their binding behavior.
We hold the view that this research will offer significant novel insights into the manner in which ICA influences the structural stability of PK. Moreover, this study is expected to serve as a valuable reference for optimizing the pharmacological activities of flavonoids, as well as for exploring the potential synergistic applications of PK in combination with flavonoids.
2. Experiment
2.1. Reagents
PK, ICA, tris(hydroxymethyl)aminomethane (Tris), NaCl, ethanol, ibuprofen (IBU), cytisine (CYT), and hydrochloric acid (HCl) were obtained commercially from Shanghai Macklin Biochemical Co., Ltd. (Shanghai, China) All reagents were of analytical grade or higher and used directly. Ultrapure water (18.2 MΩ·cm) was utilized in the preparation of the sample solution.
2.2. Spectroscopic Measurement
Fluorescence spectroscopy measurements were routinely conducted using a 25 mM Tris-HCl buffer (pH 8.0) containing 3.46 μM PK and varying concentrations of ICA (0–6.25 μM) at controlled temperatures of 290 K, 300 K, or 310 K. The variations in PK’s fluorescence emission at various temperatures were examined using an Agilent Cary Eclipse fluorescence spectrometer. Spectroscopic measurements were performed with an excitation wavelength at 278 nm, and fluorescence emission was detected across the spectral range of 290 to 450 nm [13]. The excitation and emission slits were set at 5 nm and the spectral resolution is 1 nm. For synchronous fluorescence experiments, the parameters for ∆λ were set as both 60 and 15 nm.
UV–Vis absorption spectra spanning 220 to 400 nm were obtained using a Hitachi UH5300 UV–Vis spectrometer (Hitachi, Tokyo, Japan) with a 1 nm bandwidth and a 0.5 nm data interval [14].
2.3. Site-Tagged Competition Studies Using Cytisine and Ibuprofen
PK was initially incubated with either IBU or CYT at a concentration of 3.46 μM in site-tagged competition assays. The resulting mixture was then combined with ICA at varying concentrations (0–6.25 μM) and incubated for 1 h at room temperature. Excitation of PK-IBU and PK-CYT was performed at 265 nm and 280 nm, respectively. Fluorescence spectral data were analyzed by applying the Stern–Volmer equation.
2.4. Förster Resonance Energy Transfer Studies
The energy transfer efficiency was quantified by analyzing the spectral correlation between the acceptor molecule’s (ICA) ultraviolet-visible absorption characteristics and the donor fluorophore’s (PK) emission profile. Fluorescence investigations were performed using a precisely optimized PK concentration of 3.46 μM to maintain optimal detection sensitivity. Spectrophotometric analysis of the PK-ICA complex was conducted at stoichiometric 1:1 molar ratio, utilizing high-purity deionized water as the reference medium for baseline correction.
2.5. Molecular Docking Studies
PK’s three-dimensional structure was retrieved from the Protein Data Bank (entry ID 2ID8). The geometry of ICA were obtained from the Crystallography Open Database (https://www.crystallography.net (accessed on 22 September 2024), entry 7221959) and fully optimized using DFT calculations at B3LYP/6-31G(d,p) level via the Gaussian 16 package [15]. AutoDock 4.2 was employed for the molecular docking analyses [16]. The rotatable bonds and non-polar hydrogen atoms of ICA were maintained according to the default settings of Autodock. A cubic grid with dimensions of 126 × 126 × 126 Å3 and a grid spacing of 0.375 Å was utilized for the docking process. The Lamarckian Genetic Algorithm (LGA) was employed to determine the optimal binding site for the ligand. The LGA parameters were configured as 300 genetic algorithm operations, a maximum of 2.5 × 10⁶ energy evaluations, and a population size of 150. All other parameters were set to their standard default values. The PoseView web service was used to identify non-covalent interactions between PK and ICA in the molecular docking results [17].
2.6. Molecular Dynamics Studies
In this study, molecular dynamics simulations were performed on the lowest binding energy pose of molecular docking results of PK-ICA using Desmond 2022.4 (DE Shaw Research, New York, NY, USA) [18]. The root-mean-square deviation (RMSD) obtained from trajectory analysis after the molecular dynamics (MD) simulation was used to measure each system’s deviation from the initial complex structure. Fluctuations in the RMSD value reflected local conformational changes in the main chain of protein residues induced by mutations. A minimal RMSD variation indicated that the material’s conformation remained stable throughout the simulation timeframe [19]. A cubic simulation box with dimensions of 10 × 10 × 10 Å was constructed, containing 7350 TIP3P water molecules, with the energy-optimized molecular docking complex centered geometrically. Five chloride anions were added to the system to maintain charge neutrality. Molecular dynamics simulations were conducted under isothermal-isobaric (NPT) conditions at 300 K and 1.01325 bar, employing the Martyna–Tobias–Klein barostat (2 ps relaxation time) coupled with the Nose–Hoover thermostat (1 ps relaxation time). The equations of motion were integrated using a 2 fs timestep with isotropic pressure scaling applied throughout the simulation. System relaxation and energy minimization were performed following Desmond’s standard protocol. After 1 ns of equilibration, 50 ns of production dynamics were conducted to sample the system’s conformational space.
3. Results and Discussions
3.1. Fluorescence Quenching Mechanism
Fluorescence spectroscopy is an efficient technique for analyzing the composition and binding characteristics of protein-ligand complexes in solution [20]. PK serves as a major source of intrinsic protein fluorescence owing to its two tryptophan residues, Trp8 and Trp212. Upon interaction with an external quenching agent, the microenvironment of these tryptophan residues in PK alters, leading to a steady decrease in fluorescence intensity. The occurrence of the inner filter effect (IFE) can compromise the quantitative reliability of the fluorescence method [21]. In this study, all fluorescence intensity data were calculated using Equation (1).
where Aex and Aem denote the ultraviolet–visible absorption measurements at specific excitation and emission wavelengths, respectively, Fcorr refers to the system’s fluorescence intensity after inner filter effect correction, and Fobs signifies the raw fluorescence intensity before any corrections. As shown in Figure 2, under 278 nm excitation, the PK-ICA complex displayed a characteristic fluorescence emission peak at 332 nm, with the spectral profile exhibiting concentration-dependent alterations upon interaction with increasing ICA concentrations.
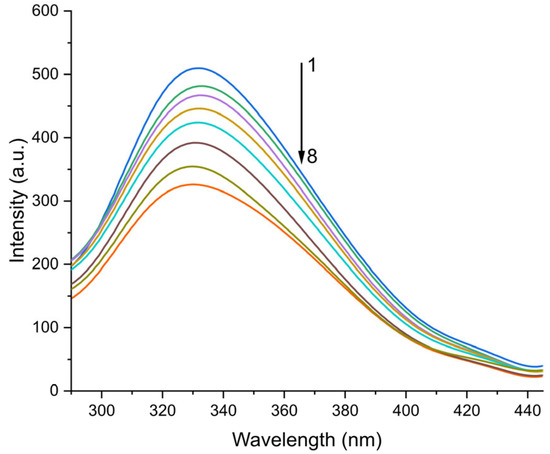
Figure 2.
The fluorescence emission spectra of 3.46 μM PK at pH 8.0 recorded at 300 K in the presence of varying ICA concentrations. The ICA concentrations spanned a range from 0.0 to 6.25 μM, specifically 0.0, 0.625, 1.25, 1.875, 2.5, 3.75, 5.0, and 6.25 μM (denoted as samples 1 to 8).
Within the temperature ranging from 290 to 310 K, an inverse correlation is observed between the fluorescence emission intensity of PK. Significantly, a notable decrease in PK’s fluorescence emission intensity is detected with increasing ICA concentration, evidencing the phenomenon of fluorescence quenching. These results imply that ICA acts as a quenching agent, exerting a substantial regulatory effect on the fluorescence emission intensity of PK.
The Stern–Volmer equation (Equation (2)) [22] was used in physical chemistry to describe the relationship between the fluorescence intensity of a substance and the concentration of a quencher. Therefore, in this paper, the Stern–Volmer equation was utilized to analyze the quenching mode of the PK-ICA quenching system.
where F and F0 represent the fluorophore PK’s emission intensities with and without the quencher (ICA), respectively, [Q] is the quencher’s concentration. In the absence of a quencher, the average lifetime of the fluorophore is τ0, whereas biological macromolecules generally exhibit a lifetime of approximately 1 × 10⁻⁸ s [23]. The quenching rate constant is denoted as Kq, while the Stern–Volmer quenching constant is symbolized by Ksv.
Normally, the fluorescence quenching mechanism comprises two processes: dynamic quenching and static quenching [24], while static quenching arises from the formation of a host–guest complex and dynamic quenching is initiated by collisions between the quencher and biological macromolecules. As shown in Figure 3a, analysis of fluorescence emission data for PK at different ICA concentrations across temperatures of 290 K, 300 K, and 310 K revealed an apparent linear relationship between F0/F and [Q]. The Stern–Volmer equation constants for the PK-ICA system at these temperatures are summarized in Table 1.
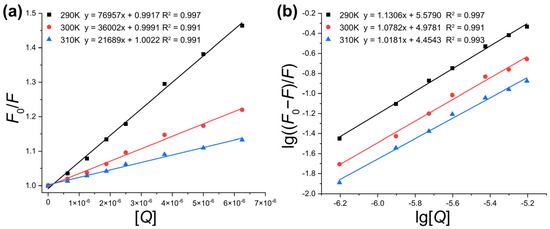
Figure 3.
(a) Stern–Volmer plots for PK-ICA; (b) double logarithmic plots of PK-ICA.

Table 1.
Stern–Volmer constants (Ksv), binding constant (KA), and number of binding sites (n) for the interactions of PK with ICA.
Temperature effects on the protein–quencher interaction are commonly used to distinguish static or dynamic quenching mechanisms. As reported [25], the dynamic Stern–Volmer quenching constant KSV increases with temperature, while the static quenching constant KSV decreases. The reduction in KSV with increasing temperature observed here indicates that static quenching dominates the quenching of PK by ICA. Furthermore, the maximum collision quenching constant Kq for biomolecules is reported to be 2 × 10¹⁰ L·mol−1·s−1 [26]. The Kq values in Table 1 exceed this threshold by two orders of magnitude, confirming that static quenching via stable host–guest complex formation underlies the quenching of PK by ICA.
It is generally assumed that ligands bind independently to a series of equivalent sites on a macromolecular host [27]. As presented in Table 1, Equation (3) was employed to determine the number of binding sites (nA and the binding constant; KA for the interaction between ICA and PK).
The plot of lg[(F0 − F)/F] versus lg[Q] is depicted in Figure 3b. The observed reduction in binding constants KA with increasing temperature indicates that the PK-ICA complex exhibits decreased stability at higher temperatures. The obtained KA values, on the order of 105 L·mol−1, suggest strong interactions between PK and ICA. Additionally, the nA values consistently approached 1.0, implying that the PK-ICA complexes maintain a 1:1 stoichiometric ratio across all tested temperatures.
In the macromolecule–ligand system, host–guest interactions include hydrophobic forces, electrostatic interactions, van der Waals forces, hydrogen bonds, and other non-bonding forces [28]. Thermodynamic parameters were derived using the van’t Hoff equation (Equations (4) and (5)) to characterize the interaction nature in the PK-ICA complex. This analysis was based on the binding constants (KA) at 290 K, 300 K, and 310 K, respectively [29].
where R denotes the universal gas constant (8.314 J·mol−1·K−1), ∆H and ∆S represent the changes in enthalpy and entropy during the fluorescence quenching process, respectively. In Equation (5), the symbol ∆G indicates the Gibbs free energy change associated with the complexation process. The host–guest complex can exhibit three distinct types of non-covalent interaction patterns [22], which are determined by the magnitude and sign of ∆H and ∆S. When both ∆H and ∆S are positive, hydrophobic interactions dominate the complex formation. By contrast, when both ∆H and ∆S are negative, the complex is stabilized by hydrogen bonds and van der Waals forces. If ∆H is slightly negative or positive and ∆S is positive, this implies that electrostatic interactions play a predominant role.
Table 2 shows a negative value for ∆G, indicating that the PK-ICA complex forms spontaneously. Both ∆H and ∆S are negative, demonstrating that the binding interaction between PK and ICA is exothermic. The formation of the PK-ICA complex is primarily driven by non-covalent interactions, specifically van der Waals forces and hydrogen bonding, which play a key role in stabilizing the structure.

Table 2.
Calculated thermodynamic quantities for PK-ICA complexes.
3.2. Förster Resonance Energy Transfer
Förster resonance energy transfer (FRET) enables non-radiative energy transfer between molecules over-extended distances, typically ranging from 10 to 100 Å. In this process, a fluorescent “donor” molecule absorbs a photon and subsequently transfers the energy non-radiatively to an “acceptor” molecule [30]. FRET principles facilitate the calculation of distances and energy transfer between PK (donor) and ICA (acceptor). At 290 K, the UV–Vis absorption spectrum of ICA and the fluorescence emission spectrum of PK exhibited spectral overlap, allowing determination of the binding distance and energy transfer efficiency using Equation (6).
where E denotes the energy transfer efficiency between the donor and the acceptor, R0 for the Förster distance corresponding to 50% energy transfer efficiency, and r for the binding distance among the donor PK and the acceptor ICA. R0 can be calculated using Equation (7) [31].
Herein, K2 denotes the spatial orientation factor characterizing the relative orientation of transition dipoles between the donor and acceptor in space, commonly assumed to be 2/3. Φ represents the fluorescence quantum yield of the donor PK, with a value of 0.094 [32]. The parameter n signifies the medium’s average refractive index, where the typical average for water and organic materials is 1.336 [33]. Equation (8) is employed to calculate the spectral overlap integral (J) between the fluorescence emission spectrum of PK and the absorption spectrum of ICA [31].
At wavelength λ, the molar absorption coefficient of the acceptor is ε(λ), with a wavelength span of ∆λ, and the donor’s corrected fluorescence intensity within this wavelength range is FD(λ). The calculated FRET parameters are shown in Table 3.

Table 3.
Calculated spectral overlap integral (J), critical distance (R0), energy transfer efficiency (E) and binding distance (r) for PK-ICA.
According to Förster’s theory of non-radiative energy transfer, three key factors govern the efficiency of energy transfer: the donor’s fluorescence quantum yield, the spectral overlap between the donor’s emission spectrum and the acceptor’s UV–Vis absorption spectrum, and the optimal intermolecular distance (2–7 nm) between donor and acceptor [34]. As shown in Figure 4 and Table 3, the binding distance between PK and ICA falls within the range of 0.5 R0 < r < 2 R0, confirming the occurrence of energy transfer from PK to ICA. Moreover, the measured binding distance r directly correlates with the formation of the PK-ICA complex and the observed fluorescence quenching of PK, indicating a static quenching mechanism.
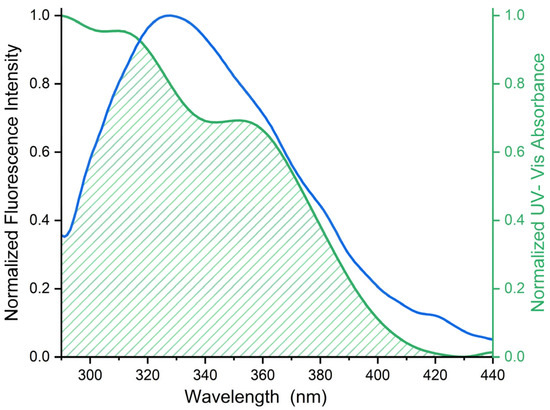
Figure 4.
Normalized fluorescence emission and UV–Vis absorption spectrum of the FRET pair (PK in black and ICA in green) with schematized spectral overlaps. The concentration of PK and ICA is 3.46 μM.
3.3. Synchronous Fluorescence Spectroscopy
Synchronous fluorescence analysis is widely employed in investigating the impacts of small-molecule chemicals on protein structures, owing to its high selectivity and minimal interference from light scattering. When the excitation-emission wavelength differences (∆λ) are fixed at 15 nm and 60 nm, respectively, synchronous fluorescence spectroscopy enables the identification of Tyr and Trp residues, which serve as the primary sources of fluorescence emission in the host structure of PK [35]. In this technique, shifts in the maximum emission wavelength (λmax) can disclose alterations in the microenvironmental polarity of the fluorophore induced by the quencher. Specifically, a red shift in λmax indicates an increase in environmental polarity, whereas a blue shift reflects enhanced hydrophobicity.
To investigate the effect of ICA on the structure of PK, synchronous fluorescence spectroscopy was performed with Δλ values of 15 nm and 60 nm. As illustrated in Figure 5, the characteristic emission peaks of both Tyr and Trp residues exhibit progressive quenching with increasing ICA concentration, indicating a conformational rearrangement of PK within the ICA-PK complex. Specifically, Figure 5a shows no significant shift in the λmax of Tyr residues, whereas Figure 5b demonstrates a slight blue shift in Trp fluorescence (from 274.06 nm to 272.96 nm). These findings suggest that ICA induces conformational changes in PK and modulates the microenvironment of Trp residues toward a more hydrophobic state.
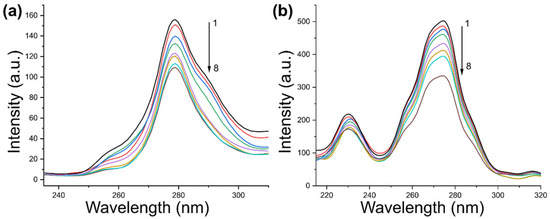
Figure 5.
The synchronous fluorescence spectra of PK-ICA at different ∆λ: (a) 15 nm and (b) 60 nm. The concentrations of ICA from 1 to 8 are 0.0, 2.5, 5.0, 7.0, 10.0, 15.0, 20.0, and 25.0 μM, respectively.
3.4. Competitive Binding
Competitive binding is a well-established approach for identifying ligand-binding sites on host proteins [36]. In this study, ibuprofen (IBU) and cytisine (CYT) were selected to perform competitive binding experiments aimed at determining the binding site of ICA on PK [11]. The fluorescence emission intensity of the PK-IBU (or PK-CYT) complex decreased progressively upon the addition of ICA (0–6.25 μM) to a solution containing equimolar concentrations (3.46 μM) of PK and IBU (or CYT). Using Equations (1) and (2), the Stern–Volmer (Ksv) values for ICA-mediated quenching of the PK-IBU (or PK-CYT) complexes were calculated, and the results are shown in Table 4.

Table 4.
Equilibrium binding constants in site-competitive displacement experiments.
The Ksv values for the PK-IBU and PK-CYT complexes were 60.9% and 18.8% of the value for uncomplexed PK (7.70 × 10⁴ L mol−1), respectively. This reflects that some protein binding sites are occupied by IBU and CYT, the free ICA concentration relatively increases, the effective collision probability of ICA with protein decreases, and the apparent quenching efficiency drops. The above indicates that both IBU and CYT exhibit competitive binding with ICA for binding sites on PK. The results further suggest that ICA may displace IBU (or CYT) from PK by targeting the same binding site. As reported previously, neutral molecules such as CYT and IBU tend to form hydrogen bonds and hydrophobic interactions with macromolecular hosts [11,37]. Notably, due to its smaller molecular size, CYT demonstrates stronger binding to the hydrophobic pocket of PK [11]. These findings imply that ICA can competitively displace IBU or CYT from PK complexes to different extents via hydrophobic interactions and hydrogen bonding, a conclusion corroborated by thermodynamic analyses.
3.5. Molecular Docking
Computational molecular docking is widely recognized as one of the most commonly employed methods for predicting the binding mode of host–ligand complexes [38]. To better understand the interactions between the host and the guest and to investigate the possible binding strategy of ICA with PK, molecular docking was used to determine how ligands bind to the host. The PK-ICA docking pose with the lowest binding energy is shown in Figure 6. It is known that ICA could be docked into a hydrophobic pocket of PK and fits deeply into the PK surface. This conformation aligns well with the findings from previous site-marker experiments. Within the flexible docking binding sites of ICA, there were possible hydrogen bond interactions between the glucoside moiety of ICA and Gly66 (2.90 Å), Asn67 (2.57 Å), as well as Trp212 (3.10 Å). Similarly, hydrogen bond interactions also occur between the rhamnoside moiety of ICA and Ser224 (2.59, 2.88 and 3.19 Å), Asn161 (2.78 Å). Hydrogen bond interaction may also exist between the carbonyl group of ring C in ICA and His69 (2.61 Å). Additionally, residues of Ile220 and Ser221 contribute extra hydrophobic forces to stabilize the PK-ICA complex. These findings indicate that ICA binds to PK through hydrophobic and hydrogen bond interactions, which is consistent with the aforementioned binding model.
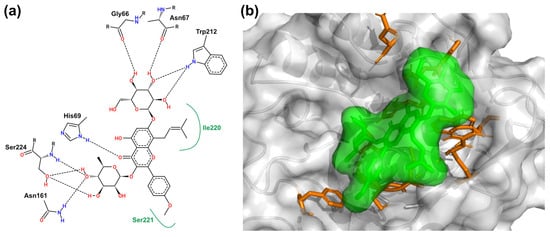
Figure 6.
(a) The lowest binding energy pose for PK-ICA. Black dashes indicate hydrogen binding and green solid lines indicate hydrophobic interactions. (b) Three-dimensional diagram of the interaction between some residues of PK and ICA. ICA is presented in green, and the amino acid residues of PK that interact with ICA are shown as sticks in orange.
3.6. Molecular Dynamics
Molecular dynamics (MD) simulation enables the investigation of protein conformational changes over specific time scales in the presence of ligands, serving as a powerful tool to evaluate the dynamic stability of macromolecular–ligand docking results [39]. To assess the dynamic stability of the PK-ICA complexes, 50 ns all-atom MD simulations were conducted at 300 K using the lowest binding energy pose of molecular docking. The equilibrium state of the complex system was evaluated via the root-mean-square Deviation (RMSD) profile [40]. As shown in the RMSD plots of Figure 7a, the MD simulations of the host (PK) and ligand (ICA) at 300 K exhibited stability throughout the simulation. During the initial 2 fs, the RMSD values of PK alpha carbon (Cα) atoms and ICA increased rapidly, indicating the transition from dynamic instability to stability. The RMSD of PK remained constant between 2 fs and 50 ns, whereas the RMSD of ICA plateaued at an average of 1.24 Å by 2 ns and reached equilibrium at 7.4 ns. In the 10–50 ns interval, the average RMSD values for PK and ICA were 1.13 Å and 3.31 Å, respectively. The convergence of RMSD trends evidenced the high structural stability of the complex, demonstrating minimal conformational changes in both PK and ICA.
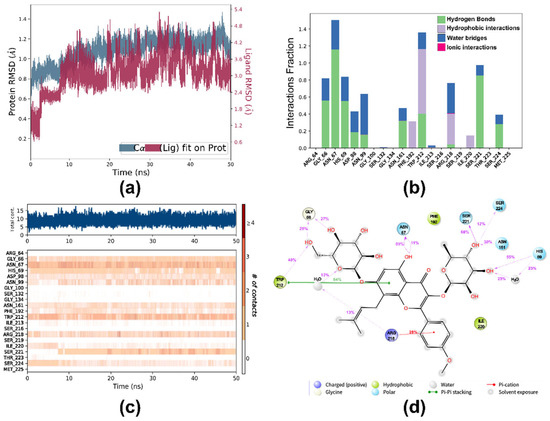
Figure 7.
(a) The plot of RMSD versus time for the alpha carbon (Ca) atoms (in blue) and heavy atoms of ICA (in red); (b) histogram plot showing interacting residues of PK with ICA during a 50 ns MD simulation; (c) timeline representation of the interactions and contacts between PK and ICA during a 50 ns MD simulation; (d) detailed interactions between ICA and PK residues during a 50 ns MD simulation.
As demonstrated in Figure 7b,c, during the MD simulation, ICA bound to PK showed a combination of polar interactions (hydrogen bonds and water bridges) and non-polar (hydrophobic) interactions. Initially, ICA had limited contact with PK, but after several nanoseconds, more frequent contacts with the ligand were established, indicating that the PK-ICA complex remained stable throughout the entire simulation period. As presented in Figure 7d, the residues Gly66, Asn67, His69, Asn161, Trp212, Ser221, and Ser224 formed hydrogen bond interactions with ICA during the MD simulation. Water-bridged hydrogen bonding interactions were observed between the residues His69, Arg218, and the ligand. The residues Phe192, Ile220, and Trp212 exhibited hydrophobic interactions with ICA. Additionally, Arg218 formed a π-cation interaction with ICA, and Trp212 showed a π-π stacking interaction (64%) during the MD simulation. Notably, ICA formed hydrogen bonding, hydrophobic, and π-π stacking interactions with the residue Trp212, suggesting the presence of strong intermolecular interactions around Trp212. This finding is consistent with the results from FRET and synchronous fluorescence spectroscopy analyses.
4. Conclusions
This study employed PK as the fluorescent probe and ICA as the quencher to conduct fluorescence spectroscopic analyses and molecular modeling investigations. Fluorescence spectroscopy analysis confirmed that the formation of the PK-ICA complex followed a static quenching mechanism. The binding mode and association constant of the PK-ICA complex were determined using double logarithmic plots. Additionally, temperature was found to impact the stability of the PK-ICA complex, with increased temperatures leading to reduced stability. Thermodynamic calculations revealed negative values for ∆H and ∆S, indicating that the complexation process was exothermic. The complex formation was primarily driven by hydrogen bonding and van der Waals forces. The negative ∆G value suggested that the complexation occurred spontaneously. FRET experiments demonstrated that ICA bound closely to PK with high energy transfer efficiency. Synchronous fluorescence spectroscopy indicated that the polarity around Trp residues in PK shifted, leading to conformational changes and increased hydrophobicity. Molecular docking results illuminated the probable host–ligand interactions and binding poses between PK and ICA. Molecular dynamics (MD) simulations further validated the stability of the PK-ICA complex over a 50 ns simulation period. Notably, during the MD simulation, the PK-ICA complex maintained high stability through hydrogen bonding, hydrophobic interactions, and π-π stacking between the Trp212 residue and the ligand simultaneously.
These findings offer critical insights into the interaction mechanism between PK and ICA, which is essential for understanding the pharmaceutical applications of ICA and traditional medicine containing ICA. Specifically, the characterization of the binding properties, stability, and driving forces of the PK-ICA complex provides a molecular basis for elucidating how ICA exerts its pharmacological effects through interactions with target proteins like PK. This not only enhances the comprehension of ICA’s biological activities but also lays a foundation for the rational design and development of ICA-related therapeutic agents. Furthermore, the integrated experimental-computational approach validated herein establishes a robust framework for elucidating interactions between bioactive natural products and their protein targets, accelerating the development of ICA-based therapeutics.
Author Contributions
Conceptualization, Z.Y.; methodology, H.Z. and Z.Y.; software, Z.H.; validation, H.Z. and Y.Q.; formal analysis, H.Z.; investigation, L.L.; resources, L.L.; data curation, Z.H.; writing—original draft preparation, H.Z.; writing—review and editing, D.T.U.; visualization, H.Z. and Z.H.; supervision, Z.Y.; project administration, Z.Y.; funding acquisition, Z.Y. and Z.H. All authors have read and agreed to the published version of the manuscript.
Funding
This research was funded by the National Natural Science Foundation of China, grant number 22404116, the Fundamental Research Funds for the Universities of Liaoning Province, grant numbers JYTMS20231697, LJ212410166040 and SYNU2024027, and the Key Discipline Project for Doctoral Program Construction of Shenyang Normal University in 2025 (099-52501002).
Data Availability Statement
The authors agree to share anonymized data upon reasonable request by researchers.
Conflicts of Interest
The authors declare no conflicts of interest.
References
- Wang, H.; Sun, K.; Tan, W.; Gao, J.; Yuan, L.; Wen, J.; Deng, W. Icariin promoted ferroptosis by activating mitochondrial dysfunction to inhibit colorectal cancer and synergistically enhanced the efficacy of PD-1 inhibitors. Phytomedicine 2025, 136, 156224. [Google Scholar] [CrossRef]
- He, C.; Wang, Z.; Shi, J. Pharmacological effects of icariin. Adv. Pharmacol. 2020, 87, 179–203. [Google Scholar] [CrossRef]
- Jiang, W.; Kaixi, D.; Rensong, Y.; Lei, M. Therapeutic effects of icariin and icariside II on diabetes mellitus and its complications. Crit. Rev. Food Sci. Nutr. 2024, 64, 5852–5877. [Google Scholar] [CrossRef]
- Jin, J.; Wang, H.; Hua, X.; Chen, D.; Huang, C.; Chen, Z. An outline for the pharmacological effect of icariin in the nervous system. Eur. J. Pharmacol. 2019, 842, 20–32. [Google Scholar] [CrossRef]
- Tan, H.-L.; Chan, K.-G.; Pusparajah, P.; Saokaew, S.; Duangjai, A.; Lee, L.-H.; Goh, B.-H. Anti-cancer properties of the naturally occurring aphrodisiacs: Icariin and its derivatives. Front. Pharmacol. 2016, 7, 191. [Google Scholar] [CrossRef] [PubMed]
- Liu, F.-Y.; Ding, D.-N.; Wang, Y.-R.; Liu, S.-X.; Peng, C.; Shen, F.; Zhu, X.-Y.; Li, C.; Tang, L.-P.; Han, F.-J. Icariin as a potential anticancer agent: A review of its biological effects on various cancers. Front. Pharmacol. 2023, 14, 1216363. [Google Scholar] [CrossRef] [PubMed]
- Dongye, Z.; Wu, X.; Wen, Y.; Ding, X.; Wang, C.; Zhao, T.; Li, J.; Wu, Y. Icaritin and intratumoral injection of CpG treatment synergistically promote T cell infiltration and antitumor immune response in mice. Int. Immunopharmacol. 2022, 111, 109093. [Google Scholar] [CrossRef] [PubMed]
- Morihara, K.; Tsuzuki, H. Specificity of Proteinase K from Tritirachium album Limber for Synthetic Peptides. Agric. Biol. Chem. 1975, 39, 1489–1492. [Google Scholar] [CrossRef]
- Klubthawee, N.; Wongchai, M.; Aunpad, R. The bactericidal and antibiofilm effects of a lysine-substituted hybrid peptide, CM-10K14K, on biofilm-forming Staphylococcus epidermidis. Sci. Rep. 2023, 13, 22262. [Google Scholar] [CrossRef]
- Hosseini-Koupaei, M.; Shareghi, B.; Saboury, A.A.; Davar, F.; Raisi, F. The effect of spermidine on the structure, kinetics and stability of proteinase K: Spectroscopic and computational approaches. RSC Adv. 2016, 6, 105476–105486. [Google Scholar] [CrossRef]
- Liu, K.; Zhang, Y.; Zhang, W.; Liu, L.; Yu, Z. A study on the interactions of proteinase K with myricetin and myricitrin by multi-spectroscopy and molecular modeling. Int. J. Mol. Sci. 2023, 24, 5317. [Google Scholar] [CrossRef]
- Paudyal, S.; Sigdel, G.; Shah, S.K.; Sharma, S.K.; Grubb, J.D.; Micic, M.; Caseli, L.; Leblanc, R.M. Interfacial behavior of Proteinase K enzyme at air-saline subphase. J. Colloid Interface Sci. 2022, 616, 701–708. [Google Scholar] [CrossRef] [PubMed]
- Jafari, A.; Shareghi, B.; Farhadian, S.; Tirgir, F. Evaluation of maltose binding to proteinase K: Insights from spectroscopic and computational approach. J. Mol. Liq. 2019, 280, 1–10. [Google Scholar] [CrossRef]
- Saqib, S.; Faryad, S.; Afridi, M.I.; Arshad, B.; Younas, M.; Naeem, M.; Zaman, W.; Ullah, F.; Nisar, M.; Ali, S.; et al. Bimetallic assembled silver nanoparticles impregnated in aspergillus fumigatus extract damage the bacterial membrane surface and release cellular contents. Coatings 2022, 12, 1505. [Google Scholar] [CrossRef]
- Frisch, M.J.; Trucks, G.W.; Schlegel, H.B.; Scuseria, G.E.; Robb, M.A.; Cheeseman, J.R.; Scalmani, G.; Barone, V.; Petersson, G.A.; Nakatsuji, H.; et al. Gaussian 16 Rev. C.02; Gaussian, Inc.: Wallingford, CT, USA, 2016. [Google Scholar]
- Morris, G.M.; Huey, R.; Lindstrom, W.; Sanner, M.F.; Belew, R.K.; Goodsell, D.S.; Olson, A.J. AutoDock4 and AutoDockTools4: Automated docking with selective receptor flexibility. J. Comput. Chem. 2009, 30, 2785–2791. [Google Scholar] [CrossRef]
- Stierand, K.; Rarey, M. Drawing the PDB: Protein-ligand complexes in two dimensions. ACS Med. Chem. Lett. 2010, 1, 540–545. [Google Scholar] [CrossRef]
- Bowers, K.J.; Chow, E.; Xu, H.; Dror, R.O.; Eastwood, M.P.; Gregersen, B.A.; Klepeis, J.L.; Kolossvary, I.; Moraes, M.A.; Sacerdoti, F.D.; et al. Scalable algorithms for molecular dynamics simulations on commodity clusters. In Proceedings of the 2006 ACM/IEEE conference on Supercomputing, Tampa, FL, USA, 11–17 November 2006; p. 84. [Google Scholar] [CrossRef]
- Gupta, D.; Kumar, M.; Sharma, P.; Mohan, T.; Prakash, A.; Kumari, R.; Kaur, P. Effect of double mutation (L452R and E484Q) on the binding affinity of monoclonal antibodies (mAbs) against the RBD—A target for vaccine development. Vaccines 2023, 11, 23. [Google Scholar] [CrossRef]
- Guo, D.; Zhang, B.; Liu, R. Investigation of the effects of nanoAg on the enzyme lysozyme at the molecular level. RSC Adv. 2016, 6, 36273–36280. [Google Scholar] [CrossRef]
- Wang, T.; Zeng, L.-H.; Li, D.-L. A review on the methods for correcting the fluorescence inner-filter effect of fluorescence spectrum. Appl. Spectrosc. Rev. 2017, 52, 883–908. [Google Scholar] [CrossRef]
- Hosseini-Koupaei, M.; Shareghi, B.; Saboury, A.A.; Davar, F. Molecular investigation on the interaction of spermine with proteinase K by multispectroscopic techniques and molecular simulation studies. Int. J. Biol. Macromol. 2017, 94, 406–414. [Google Scholar] [CrossRef]
- Lakowicz, J.R.; Weber, G. Quenching of fluorescence by oxygen. Probe for structural fluctuations in macromolecules. Biochemistry 1973, 12, 4161–4170. [Google Scholar] [CrossRef]
- Song, X.; Zhao, Q.; Hou, X.; Liu, S.; Luo, L.; Ren, Y. Three luminescent Zn/Cd-based MOFs for detecting antibiotics/nitroaromatic compounds and quenching mechanisms study. J. Mol. Struct. 2025, 1324, 140813. [Google Scholar] [CrossRef]
- Deepa, H.R.; Thipperudrappa, J.; Suresh Kumar, H.M. Effect of temperature on fluorescence quenching and emission characteristics of laser dyes. J. Phys. Conf. Ser. 2020, 1473, 012046. [Google Scholar] [CrossRef]
- Ma, Y.-J.; Wu, J.-H.; Li, X.; Xu, X.-B.; Wang, Z.-Y.; Wu, C.; Du, M.; Song, L. Effect of alkyl distribution in pyrazine on pyrazine flavor release in bovine serum albumin solution. RSC Adv. 2019, 9, 36951–36959. [Google Scholar] [CrossRef]
- Grabowska, O.; Samsonov, S.A.; Kogut-Günthel, M.M.; Żamojć, K.; Wyrzykowski, D. Elucidation of binding mechanisms of bovine serum albumin and 1-alkylsulfonates with different hydrophobic chain lengths. Int. J. Biol. Macromol. 2024, 266, 131134. [Google Scholar] [CrossRef]
- Ahmad, E.; Sen, P.; Khan, R.H. Structural stability as a probe for molecular evolution of homologous albumins studied by spectroscopy and bioinformatics. Cell Biochem. Biophys. 2011, 61, 313–325. [Google Scholar] [CrossRef]
- Zhang, X.; Li, L.; Xu, Z.; Liang, Z.; Su, J.; Huang, J.; Li, B. Investigation of the interaction of naringin palmitate with bovine serum albumin: Spectroscopic analysis and molecular docking. PLoS ONE 2013, 8, e59106. [Google Scholar] [CrossRef] [PubMed]
- Clegg, R.M. Fluorescence resonance energy transfer and nucleic acids. Methods Enzymol. 1992, 211, 353–388. [Google Scholar] [CrossRef] [PubMed]
- Zehetmayer, P.; Hellerer, T.; Parbel, A.; Scheer, H.; Zumbusch, A. Spectroscopy of single phycoerythrocyanin monomers: Dark state identification and observation of energy transfer heterogeneities. Biophys. J. 2002, 83, 407–415. [Google Scholar] [CrossRef] [PubMed]
- Dolashka, P.; Dimov, I.; Genov, N.; Svendsen, I.; Wilson, K.S.; Betzel, C. Fluorescence properties of native and photooxidised proteinase K: The X-ray model in the region of the two tryptophans. Biochim. Et Biophys. Acta (BBA) Protein Struct. Mol. Enzymol. 1992, 1118, 303–312. [Google Scholar] [CrossRef]
- Ma, L.; Yang, F.; Zheng, J. Application of fluorescence resonance energy transfer in protein studies. J. Mol. Struct. 2014, 1077, 87–100. [Google Scholar] [CrossRef] [PubMed]
- Sanders Joshua, C.; Holmstrom Erik, D. Integrating single-molecule FRET and biomolecular simulations to study diverse interactions between nucleic acids and proteins. Essays Biochem. 2021, 65, 37–49. [Google Scholar] [CrossRef]
- Bobone, S.; van de Weert, M.; Stella, L. A reassessment of synchronous fluorescence in the separation of Trp and Tyr contributions in protein emission and in the determination of conformational changes. J. Mol. Struct. 2014, 1077, 68–76. [Google Scholar] [CrossRef]
- Sahoo, D.K.; Dasgupta, S.; Kistwal, T.; Datta, A. Fluorescence monitoring of binding of a Zn (II) complex of a Schiff base with human serum albumin. Int. J. Biol. Macromol. 2023, 226, 1515–1522. [Google Scholar] [CrossRef]
- Wani, T.A.; Bakheit, A.H.; Zargar, S.; Alamery, S. Mechanistic competitive binding interaction study between olmutinib and colchicine with model transport protein using spectroscopic and computer simulation approaches. J. Photochem. Photobiol. A Chem. 2022, 426, 113794. [Google Scholar] [CrossRef]
- Agu, P.C.; Afiukwa, C.A.; Orji, O.U.; Ezeh, E.M.; Ofoke, I.H.; Ogbu, C.O.; Ugwuja, E.I.; Aja, P.M. Molecular docking as a tool for the discovery of molecular targets of nutraceuticals in diseases management. Sci. Rep. 2023, 13, 13398. [Google Scholar] [CrossRef] [PubMed]
- Hu, X.; Zeng, Z.; Zhang, J.; Wu, D.; Li, H.; Geng, F. Molecular dynamics simulation of the interaction of food proteins with small molecules. Food Chem. 2023, 405, 134824. [Google Scholar] [CrossRef]
- Lu, S.-Y.; Jiang, Y.-J.; Lv, J.; Wu, T.-X.; Yu, Q.-S.; Zhu, W.-L. Molecular docking and molecular dynamics simulation studies of GPR40 receptor–agonist interactions. J. Mol. Graph. Model. 2010, 28, 766–774. [Google Scholar] [CrossRef]
Disclaimer/Publisher’s Note: The statements, opinions and data contained in all publications are solely those of the individual author(s) and contributor(s) and not of MDPI and/or the editor(s). MDPI and/or the editor(s) disclaim responsibility for any injury to people or property resulting from any ideas, methods, instructions or products referred to in the content. |
© 2025 by the authors. Licensee MDPI, Basel, Switzerland. This article is an open access article distributed under the terms and conditions of the Creative Commons Attribution (CC BY) license (https://creativecommons.org/licenses/by/4.0/).