Abstract
This study extends the application of photothermal spectroscopy to explore heat transfer dynamics in biological fluids, focusing on the examination of artificial vitreous humor (VH) models of human VH and an endogenous sample of cervine (deer) VH. The research integrates previously established methods for analyzing thermal lensing through photothermal deflection. By visualizing convective and conductive heat transfer processes in the artificial components of human VH, one gains insights into the dynamic behavior of heat transfer in the VH. Relevance extends to clinical cases where pathology requires replacement of endogenous VH with an artificial VH substitute. Several VH substitutes identified in the literature were chosen for this study based on their physical properties and relative abundance in the VH. Individual component fluids, and mixtures of these components, were analyzed at various concentrations based on their physiological concentration ranges in the human VH as they varied with age, sex, and certain disease states. By way of comparison to endogenous biological VH, a sample of VH obtained from a female white-tailed deer eye was analyzed, enhancing the understanding of heat transfer in artificial components of the VH compared to endogenous VH. There is a vast array of ophthalmological procedures that utilize an external heat source interacting with endogenous or artificial VH. The data found in this study will progress the understanding of heat transfer within artificial VH components in comparison to endogenous VH and contribute to the advancement of certain ophthalmological procedures.
1. Introduction
In recent years, an increasing number of studies have focused on heat transfer within the human eye, driven by the growing use of lasers in various ophthalmological procedures [1,2,3]. Advancement of these techniques requires an understanding of the effects that electromagnetic radiation may have on the human eye. Due to the limited amount of blood flow in ocular tissue, and the required stationary position of the eye during surgical procedures, cooling is restricted during procedures such as transpupillary thermotherapy (TTT), a laser treatment that targets choroidal melanomas. The choroid is the second most common sign of malignant melanoma in the body, and choroidal melanomas are the most common intraocular malignant tumor [4]. As the laser beam is directed to these malignant tumors in the vascular layer of the posterior wall of the eye, there is a higher risk of thermal damage to the non-malignant regions it traverses [1]. Despite the advantageous absence of ionizing radioactive exposure used in brachytherapy, when TTT is used to treat larger tumors, it is more likely to result in relapse than brachytherapy and other alternative procedures [1]. Moreover, potential adverse outcomes of TTT include protein denaturation, changes in the optical properties of the VH, and the formation of new blood vessels in the eye that can cause pressure buildup and, in some cases, the need for the eye to be surgically removed [1].
A factor that may be valuable in determining patient eligibility for TTT is vitreous humor (VH) viscosity. The viscosity of VH often decreases with age as VH liquifies [1,5,6]. Kleinberg et al. report postnatal changes in VH show a positive correlation between age and VH liquefaction [5]. At birth, the human VH is in an entirely gel state due to the collagen fibril network. With age, however, the collagen fibrils aggregate as they degrade, contributing to VH liquefaction. Consequently, the total viscosity of VH decreases as collagen concentration decreases [6]. Autopsies have shown that the liquid portion in the VH increases from 0 mL at birth to about 2 mL by age 80 [5]. That is about 45% of the total volume of VH that liquefies throughout the human lifespan. The liquefaction process contributes to alterations in constituent concentrations. A decrease in viscosity is likely to result in a higher degree of convective heat transfer and a lower degree of conductive heat transfer. This concept is illustrated visually in Figure 9 of the work by Garcia et al. who examined computational models of laser-induced heat transfer within the VH [1].
To better understand the effectiveness of TTT and similar procedures, it is necessary to elucidate not only the contributions of viscosity to convective movement within the VH, but also the effects of variances in the chemical composition of the VH on heat transfer. There is a scarcity of research that analyzes VH in vivo. Consequently, a majority of the literature on the chemical makeup of VH is based on the examination of post-mortem VH. The components determined to be the most abundant in the VH from the literature and the dominant contributors to its physical properties include water; hyaluronic acid (HA); collagens I, II, III, V, X; albumin; ascorbic acid (AA); lactic acid (LA); and glucose [5,6,7,8,9]. Although the constituents that make up the VH are highly conserved, the concentration of each constituent varies widely by age, sex, health status, and location in the VH. For example, collagen and HA concentrations are higher in the posterior region of the eye compared to anterior regions [5,6,7]; AA and albumin concentrations differ by sex with AA higher in females and albumin higher in males [9]; glucose and LA concentrations have been reported as higher in individuals with diabetes compared to healthy individuals [10].
Despite the challenges posed by the variety in VH chemical makeup and lack of in vivo analysis, and to maintain focus, the range of concentrations for each individual constituent of artificial VH examined in this study was established by identifying the most valid parameters based on known physiological values and components used in artificial vitreous substitutes [5,11,12]. Several mixtures containing various artificial VH components were also analyzed, with the concentrations of each constituent selected to reflect young, middle-aged, and older male and female adults, and those with high blood glucose levels. In addition to these complex mixtures, a simplified series consisting solely of collagen and HA was also examined. This pair was selected due to its prominence in the VH and its key role in determining VH structural integrity, viscosity, and optical properties. Prior studies have shown that HA and collagen interact to form three-dimensional networks that significantly influence the optical characteristics of the VH [5,13]. These endogenous interactions were not reproducible using the artificial vitreous components of this study. VH from a deer eye was obtained as an endogenous biological sample comparison to the artificial VH components.
To supplement existing computational data [1], this paper contributes experimental findings using a photothermal spectroscopic technique recently developed by Lopez et al. [14] and Biebighauser et al. [15], allowing for the visualization of laser-induced convective and conductive heat transfer within various artificial VH components, component mixtures, and an endogenous sample of cervine (deer) VH. Photothermal spectroscopy is a broad category of methods that utilize the conversion of light (typically laser light) into heat energy for chemical and physical characterization of liquids [16,17,18,19]. This technique is similar to one recently employed by Singhal and Goswami [20] and is utilized in the current work to measure the heat transfer within the VH. The principal physical phenomenon exploited is thermal lensing [21] in which heat is transferred into the third harmonic of the C–H and O–H stretching modes [22,23,24,25]. The thermal lensing technique works by using an externally focused laser to create spatially non-uniform heating within the sample, which generates a local refractive index gradient that acts like a lens.
In this study, a collimated high-energy IR laser produces a thermal cylindrical lens that passes through the sample cuvette. As heat is transferred from the excitation beam into the sample, a temperature gradient is generated within the sample. This temperature gradient, in turn, leads to a change in the refractive index of the medium which is illuminated by a probe beam passing through the sample perpendicular to the excitation beam. The change in refractive index is captured on a camera facing the probe beam on the opposite side of the sample. The probe beam illuminates the sample by passing a visible, red divergent laser through the cuvette containing the sample. The probe beam diverges enough to illuminate the entire length of the excitation beam within the sample and multiple millimeters above and below the beam. The refracted light allows for visualization of the changes in refractive index and thus heat within the sample over time.
2. Methods
2.1. Experimental Setup
The experimental setup follows that used in a work by Biebighauser et al. [15]. The details most relevant to the current study are reviewed here. Figure 1 displays a schematic of the photothermal system utilized in this study. The excitation laser in this experiment was the QSL103A Q-Switched Picosecond Microchip Laser System by Thorlabs (Newton, NJ, USA) emitting light at a 1030 nm wavelength (note: TTT typically employs an 810 nm laser [3]). The contact time the laser had with each sample was regulated by a computer-controlled solenoid-actuated shutter.
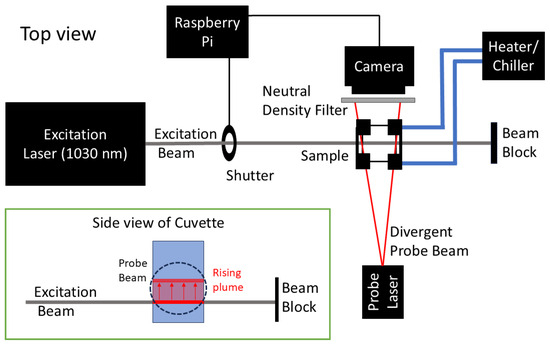
Figure 1.
Schematic representation of the experimental apparatus. The excitation beam was generated by a 1030 nm Q-Switched Picosecond Microchip Laser System QSL103A (Thorlabs, Newton, NJ, USA). This produces a rising plume, indicated by red arrows, within the sample. A continuous wave, 650 nm laser diode provided the probe beam. The shutter mechanism, driven by a solenoid, was controlled via a Raspberry Pi 4 computer. An Arducam camera, equipped with a 5 MP Omnivision OV5647 sensor with a neutral density filter in place, was also interfaced with the computer for image acquisition. Temperature control was achieved using an FTS RS33AL10 heater/chiller, (FTS Systems Inc., Marbletown, NY, USA) circulating ethylene glycol, which maintained a stability of ±0.5 °C throughout data acquisition.
A low-power diode laser from HiLetgo (Shenzhen, China) generated the probe beam at a wavelength of 650 nm. An Arducam (Kowloon, Hong Kong, China) camera equipped with a 5 MP OmniVision OV5647 sensor (OmniVision Technologies, Santa Clara, CA, USA) served as the principal component of the imaging system. To increase the frame rate of the camera to 97.1 frames per second, it was configured to function at a resolution of pixels, giving 7.71 m/pixel resolution.
The coordination of the shutter mechanism and storage of camera data were controlled by a Raspberry Pi 4 microcomputer (Raspberry Pi Holdings PLC, Pencoed, Wales). This microcomputer ran custom-designed software modified to fit this experiment. This software can be accessed through https://github.com/ulnessd (accessed on 10 October 2024) [15].
2.2. Sample Preparation
To model age-related and regional variations in collagen concentration within the VH, collagen was tested across a range of 25–500 g/mL using commercial collagen I, II, III, V, X supplements (Revive Naturals LLC, Suffern, NY, USA) as a substitute for endogenous collagen. The concentrations of commercial sodium hyaluronic acid (Micro Ingredients, Montclair, CA, USA) varied from 25 to 530 g/mL to reflect the wide range reported in the literature [5,6,7]. L-ascorbic acid (Fisher Scientific, A61, Waltham, MA, USA) was examined over a range of 66–500 g/mL to capture possible physiological concentrations in the VH. Bovine serum albumin (Fisher BioReagents, BP9706, Fair Lawn, NJ, USA) was used in place of human albumin and tested at concentrations between 80 and 5600 g/mL. To represent glucose levels in the VH, D-(+)-glucose (Sigma-Aldrich, G8270, St. Louis, MO, USA) was examined at concentrations ranging from 90 to 2430 g/mL. All listed constituents were diluted to their target concentrations using serial dilution with reverse osmosis water, as detailed in Table 1. Additionally, lactic acid (85% FCC, Sigma-Aldrich, W261106, St. Louis, MO, USA)/Na-DL-lactate (60% (w/w), Sigma-Aldrich, L1375, St. Louis, MO, USA) samples were prepared, including 0.1 M lactate (approximately M LA), 60% stock Na-DL-lactate, and 85% stock LA. The 0.1 M lactate sample is listed in Table 1, with its concentration partitioned into acidic (LA) and basic (lactate) components.

Table 1.
This table displays the concentrations of individual artificial VH components and the mixtures of collagen and HA that were tested in this study. The concentration values are based on information found in the literature described in the Introduction. Data for additional concentrations are collected in the Supplementary Materials.
HA and collagen were mixed in various concentrations as listed in Table 1. The concentrations of the more complex artificial VH mixtures are listed in the Supplementary Materials.
Whole globe enucleation was performed on female white-tailed deer (Odocoileus virginianus) specimens shortly after ethical harvest by licensed hunters in hunting zone 260 of MN, USA. The specimens were field-dressed and transported to a cold, indoor location within 30 min after time of death for the collection of ocular samples. The palpebral tissues were resected to expose the ocular adnexa. The bulbar conjunctiva was incised at the limbus and the Tenon’s capsule was dissected to expose the surface of the sclera. A spoon was inserted between the sclera and the orbit to apply posterior-to-anterior leverage, allowing controlled rotation of the globe while preserving the integrity of the eye. This manipulation exposed the extraocular attachments for transection, with a short segment of each insertion preserved to maintain scleral integrity. The optic nerve was visualized and transected with minimal residual attachment to the globe using an anterior approach. Each globe was removed from the orbit, rinsed in cold saline and placed in a bag of cold saline (4 °C) packed on ice to preserve the physiological state of the vitreous body.
Using aseptic technique, VH extraction was performed in a tissue culture hood. The sample was rinsed with saline and excess tissue was removed to expose the sclera. A longitudinal incision was made along the coronal plane of the globe. The VH was collected, along with the attached lens and iris pigment epithelium (IPE). Due to the viscoelastic properties of the VH, forceps were used to grasp the lens for purchase and the majority of the vitreous body was separated from the IPE and the lens using dissecting scissors. With minimal loss of VH, sample purity was prioritized during separation to ensure exclusion of IPE. VH was transferred to a fluorimeter cuvette, with care taken to prevent disruption of the hyaluronic acid-collagen fibril network.
Each sample was pipetted into a 1 cm × 1 cm fluorimeter cuvette. The cuvette was then placed into an in-house constructed brass jacket. An FTS model RS33AL10 heater/chiller (FTS Systems Inc., Marbletown, NY, USA) enabled the thermoregulation of the sample by heating/cooling the ethylene glycol flowing through the jacket. Relative to the reservoir temperatures, the sample temperatures were calibrated from 0 °C to 70 °C with a ±0.5 °C stability during the data acquisition [15].
2.3. Data Collection and Analysis
The following experimental protocol was applied to all the samples run throughout this investigation. The samples were run 15 times at 20 °C (room temperature) and 15 times at 37 °C (human body temperature). Individual runs consisted of an initial background collection phase of 2.0 s where the shutter was closed. Following this, there was an active phase of 12.0 s where the shutter was open, and the laser passed through the sample. Finally, there was a 120 s or 60.0 s recovery time when the shutter was closed before the next run began. Glucose and AA samples had a 60.0-s recovery time due to their less viscous nature and faster restoration to their initial state.
Each run was followed by a 4.0 s delay before beginning the subsequent run. This continued until all 15 runs of a given constituent, concentration, and temperature were complete.
A collection of custom-written programs was utilized to conduct data analysis. These programs can be accessed at https://github.com/ulnessd (accessed on 11 October 2024). The first step in data analysis was to process the video data captured by the camera into a heat map. Heatmaps were then visually examined across component concentrations to identify trends. The details for video processing can be found in reference [15].
3. Results and Discussion
Results for collagen, HA, and their mixtures, along with a female white-tailed deer VH at room temperature (20 °C) and human body temperature (37 °C) are presented and discussed below. Additional results for AA, LA, bovine serum albumin (BSA), and glucose are collected in the Supplementary Materials.
3.1. Heat Maps
As mentioned in the previous section, the majority of data will be represented by heat maps, images exhibiting compressed video files of the data. For reasons of brevity, the heat maps of only the lowest concentration and highest concentration of each component will be displayed. By way of example, the heat map for 500 g/mL of collagen at 37 °C is pictured and explained in Figure 2. The dynamic heat transfer within the sample is illustrated in the heat map and several distinct features that were utilized in the analysis are apparent.
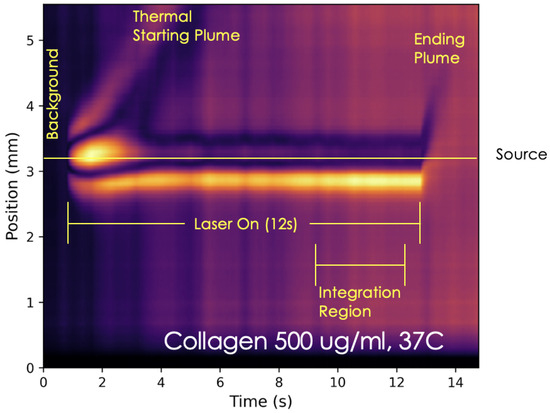
Figure 2.
By way of example, a labeled heatmap of the 500 g/mL of collagen at 37 °C is pictured. This heatmap depicts a rising thermal starting plume and laser-induced heat source in this sample. Each consecutive pixel column displayed in the heat map is a compressed frame of the averaged raw video files. These columns/frames are in chronological order from left to right across the heat map. At about 1 s, thermal expansion is pictured when heat is dumped into the sample as the shutter opens and the active phase is initiated. The heatmap depicts the rise of the thermal starting plume frame by frame as one progresses to the right. In these frames, heat is transferred upward in the sample as a thermal plume. Between 3 and 4 s, the top of the plume head can be visualized exiting the frame. The horizontal yellow line represents the axis along which the laser (source) is passing through the sample during the active phase. At about 13 s, the shutter closes and the heated fluid that was in contact with the laser rises in what is termed the ending plume. The vertical extent of the probe beam creates an illumination window of about 5.5 mm. The vertical axis is zeroed at the bottom of the illumination window and the laser is always positioned near the middle of the illumination window. The color range from black to bright yellow captures the absolute value of the difference in probe light intensity as counts on each pixel of the camera relative to background. The count is under complete experimental control.
The heat map is a measure of the difference in probe light intensity (referred to as “signal strength” for brevity) at a vertical position in the cuvette and time, t. The measurement is difference in counts on each pixel row of the camera at a given time point relative to that of the background (shutter closed). Since absolute count number is under complete experimental control, one adjusts the probe light intensity to allow for the largest dynamic range in the signal strength. For the heat map, the count difference range is captured by a color scale that runs from black (no difference relative to background) to bright yellow (normalized maximal absolute difference relative to background).
The vertical extent of the probe beam creates an illumination window of about 5.5 mm. The vertical axis is zeroed at the bottom of the illumination window (lower down in the cuvette) and the laser is always positioned near the middle of the illumination window. For the example shown in Figure 2. The laser is positioned roughly 3.1 mm above the bottom of the illumination window and 2.4 mm from the top.
Beginning on the left of the image shown in Figure 2, there is an initial background collection phase where the shutter is closed. This is illustrated by the dark sector in the first second of the heat map. Following the background collection phase is the 12 s period where the laser passes through the sample, called the active phase, where the shutter is open. Some notable features during this phase are the thermal starting plume head and heat source, which can be identified by distinct bright regions representative of elevated temperature. The laser passes through the sample along the yellow horizontal line in the diagram. Above and below this line is the observable vertical heat transfer within the sample manifested by the thermal lens effect. A greater heat transfer in a particular region is indicated by brighter colors bending outward from the cylindrical region where the laser passes through the sample. Heat transfer of a relatively conductive nature is suggested by a symmetrical appearance of the zones above and below the laser heat source. In contrast, heat maps depict a more asymmetrical appearance across the horizontal laser-heated region when the heat transfer in the given sample is of a relatively more convective nature.
The plume rises following the limited initial thermal expansion of the fluid as heat is dumped from the external heat source into the sample. After the heated region reaches its maximum thermal expansion, the heat begins to dissipate outward into the rest of the solution. In this diagram, the time of shutter closure is about 13 s. Following the closure of the shutter, there is a rapid ascension of the laser region which is termed as the thermal ending plume. These heat maps give valuable insight into the dynamic transfer of heat via thermal plumes under specified sample conditions [15].
Heatmaps were further analyzed by examining integration regions as shown on Figure 2. For a more quantitative representation of the heat transfer, a custom-written program was utilized to generate line plots of the signal intensity as a function of vertical positioning in the raw video files over a defined integration region. This program can be accessed via https://github.com/ulnessd (accessed on 15 May 2025). Plots were made for the various concentrations of the collagen and HA series, their mixtures, and the deer eye sample. The examined integration region was the time in the averaged raw video files capturing the region of the heat map after the initial thermal plume had ascended and before the laser was turned off.
3.2. Ascorbic Acid, Lactic Acid, Bovine Serum Albumin, and Glucose
Various physiologically relevant concentration ranges of AA, LA, BSA, and glucose were tested. Results are shown in Supplementary Materials. A visualized trend in the heat maps appears to be that as AA concentration and temperature increase, there is a more pronounced thermal plume rising. This is likely due to the stronger signal in the raw video files and the higher concentrations of AA within water. When control samples of distilled water were run, there tended to be a weaker thermal lensing signal which is due to hydrogen bonding restricting the heat absorption of water. When a higher concentration of AA is introduced, hydrogen bonding is disrupted by the acid–base reactions between water and AA. Additionally, AA absorbs light more effectively, resulting in a stronger signal and thus a higher resolution in the heat map generated [15]. The heat maps for BSA and glucose all show marked asymmetry across the horizontal line representing the source and thus display substantial convective movement within every sample. This is likely due to the low viscosity of these solutions. At physiological concentrations, LA shows substantial asymmetry that is moderately sensitive to temperature, compared to the more viscous stock solutions of much higher concentration, which display less symmetry and more evidence of conduction. Additionally, results show that varying the concentration of BSA or glucose within the physiological range in the VH does not have a significant impact on the extent of convective movement when examined in isolation from other components. It is important to note that the BSA examined is bovine and not human serum albumin. Human serum albumin would likely more accurately represent the protein in human VH in comparison to BSA.
3.3. Collagen
The lowest concentration range tested was 25 g/mL and the highest was 1200 g/mL though only the range from 25 g/mL to 500 g/mL is presented in this paper—closer to physiological range. There were no notable outliers in the data for concentrations tested within this range. Heat maps for all collagen concentrations tested can be found in the Supplementary Materials. Figure 3 represents the heat maps produced from the raw video files of collagen at 25 g/mL and 500 g/mL at room temperature (20 °C) and body temperature (37 °C). Slight differences in the relevant features in the images can be depicted visually. The heat maps all show significant asymmetry across the horizontal line representing the source and thus display substantial convective movement within every sample. This is likely due to the low viscosity of these solutions.
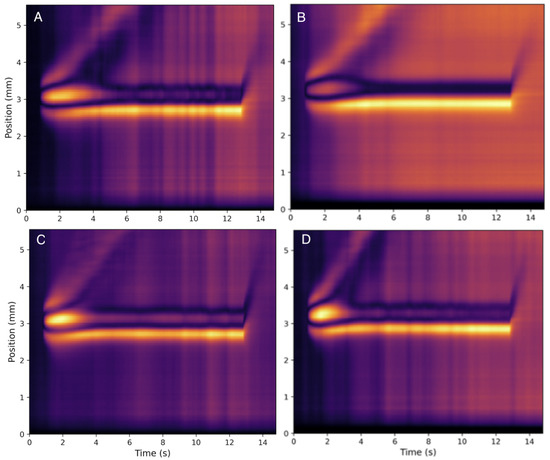
Figure 3.
Heat maps for collagen at (A) 25 g/mL collagen at 20 °C, (B) 500 g/mL collagen at 20 °C, (C) 25 g/mL collagen at 37 °C, and (D) 500 g/mL collagen at 37 °C. One notices similar strong convective behavior, as indicated by the pronounced rising thermal plume, for both concentrations and both temperatures with only a mild sensitivity to both parameters.
Figure 4 shows the line plot of the heat transfer profile for the selected integration region across the collagen concentrations and temperatures that were examined. The integration region was chosen to be from 9.5 to 12.5 s in the heat map, as this region characterized the center of the heat map after the initial thermal plume had ascended and before the laser was turned off. An image of these line plots is shown in Figure 4. The normalized signal peak on the left at approximately 2.8 mm reflects the accumulation of signal intensity due to thermal conduction in the downward direction. The absence of a significant peak on the right at approximately 3.7 mm is indicative of convective flow in the rising plume. This pattern of asymmetry is present in all collagen concentrations tested and is indicative of convective heat transfer.
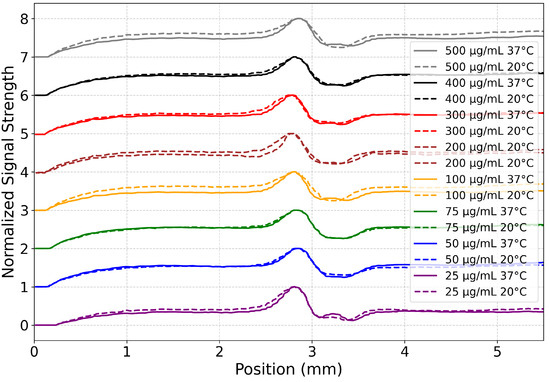
Figure 4.
Collagen heat transfer profiles across concentrations and temperatures for 9.5–12.5 s on the heat maps shown in Figure 3. Normalized (between 0 and 1) signal strength from collagen samples at varying concentrations (25–500 g/mL) was plotted from the raw video files. Data are vertically offset by concentration to aid the eye. The central minimums denote the laser heat source across all curves. Each concentration is assigned a unique color, with solid lines representing samples at 37 °C and dashed lines for those at 20 °C. This visualization highlights both concentration- and temperature-dependent changes in heat transfer as a function of vertical position in the raw video files, with a position of 0 mm marking the bottom of the video frame and ≈5.5 mm marking the top. The laser itself is at ≈3.2 mm.
3.4. Hyaluronic Acid
The lowest concentration range tested was 25 g/mL and the highest was 5000 g/mL, though only the range from 25 g/mL to 530 g/mL is presented in this paper—closer to physiological range. There were no notable outliers in the data of the concentrations tested within this range. Heat maps for all HA concentrations tested can be found in the Supplementary Materials. Figure 5 represents the heat maps produced from the raw video files of HA at 25 g/mL and 530 g/mL at room (20 °C) and body temperature (37 °C). Noticeable differences in the relevant features of the heat maps can be depicted visually, in contrast to those of collagen. Some apparent trends are that the heat maps become more symmetric across the horizontal as temperature decreases and as concentration increases. The more symmetrical the heat map is in appearance, the greater the degree of conductive heat transfer. In the 530 g/mL of HA at 20 °C heat map, heat is being conducted away from the laser heat region almost exclusively. There is also a significant difference in conductive heat transfer pictured between the 25 g/mL at room temperature and the 25 g/mL at body temperature. Figure 6 shows the line plot of the heat transfer profile for the selected integration region across the HA concentrations and temperatures that were examined. The integration region was chosen to be from 9.5 to 12 s in the heat map, as this region characterized the center of the heat map after the initial thermal plume had ascended and before the laser was turned off. The plots show a peak in signal intensity on the left side of the laser path and the absence of a peak on the right. The normalized signal peak on the left at approximately 2.8 mm reflects signal intensity accumulation due to thermal conduction in the downward direction. The absence of a significant peak on the right at approximately 3.8 mm is indicative of convective flow in the rising plume. This pattern of asymmetry is present in all HA concentrations tested and is indicative of convective heat transfer.
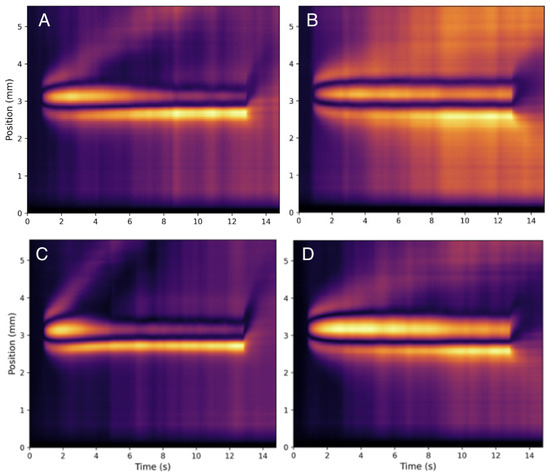
Figure 5.
Heat maps for HA at (A) 25 g/mL HA at 20 °C, (B) 530 g/mL HA at 20 °C, (C) 25 g/mL HA at 37 °C, and (D) 530 g/mL HA at 37 °C. One notices distinct convective behavior for both concentrations and both temperatures indicating a stronger sensitivity to both parameters as compared with collagen (see Figure 3).
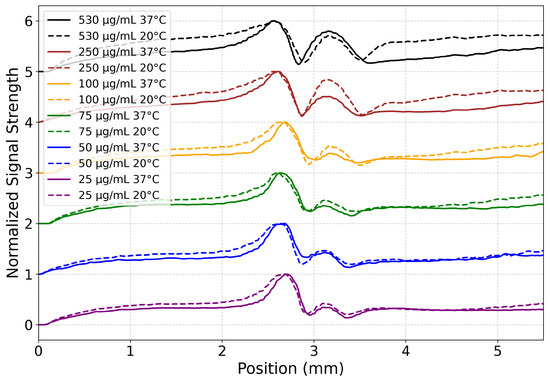
Figure 6.
HA heat transfer profiles across concentrations and temperatures for 9.5–12.0 s on the heat maps shown in Figure 5. Normalized (between 0 and 1) signal strength from HA samples at varying concentrations (25–530 g/mL) was plotted from the raw video files. Data are vertically offset by concentration to aid the eye. Each concentration is assigned a unique color, with solid lines representing samples at 37 °C and dashed lines for those at 20 °C. This visualization highlights both concentration- and temperature-dependent changes in heat transfer as a function of vertical position in the raw video files, with a position of 0 mm marking the bottom of the video frame and ≈5.5 mm marking the top. The laser itself is at ≈3.2 mm.
3.5. Hyaluronic Acid and Collagen Mixtures
Of the various mixtures analyzed in this study, one was a series of varying collagen and HA concentrations in combination to analyze the effects of the two constituents in summation on heat transfer within the VH. This series was a simplified model of endogenous VH that was run. Figure 7 shows heat maps of several HA and collagen mixtures, including an average collagen concentration with high and low HA concentrations and an average HA concentration with high and low collagen concentrations. Although these samples were run at both room and body temperatures, only the heat maps at body temperature are displayed since they better represent in vivo VH. Noticeable differences in relevant features of the images can be visually depicted. The heat map of the mixture with the highest concentrations of HA (B) appeared to be more symmetrical across the horizontal line representing the laser heat source and thus displays a higher degree of conductive movement relative to the other mixtures. This is likely due to the low viscosity of this mixture. Another notable observation is that the thermal starting plume’s ascension in the high collagen, average HA mixture (C), appears to be less distinct than the high collagen, average HA mixture (D). This is likely indicative of a higher degree of conductive heat transfer in (C) compared to (D), despite the presence of a lower concentration of collagen in (C).
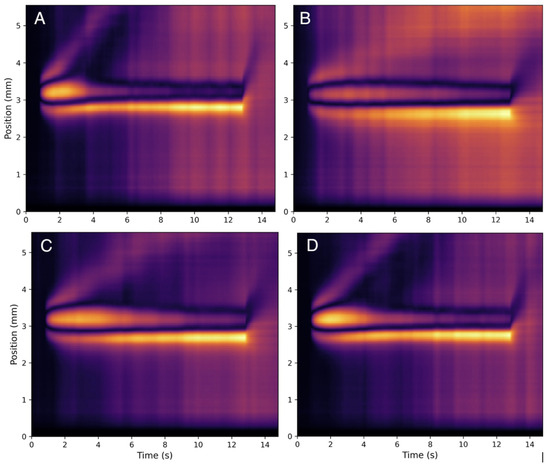
Figure 7.
Heat maps for HA and collagen mixtures at body temperature at varying concentrations of HA and collagen. Pictured are the heat maps (A) 120 g/mL collagen and 100 g/mL HA mixture at 37 °C, (B) 120 g/mL collagen and 400 g/mL HA mixture at 37 °C, (C) 50 g/mL collagen and 200 g/mL HA mixture at 37 °C, and (D) 300 g/mL collagen and 200 g/mL HA mixture at 37 °C.
Figure 8 shows the line plot of the heat transfer profile for the selected integration region across the HA and collagen mixtures and temperatures that were examined. The integration region was chosen to be from 9.5 to 12.0 s in the heat map, as this region characterized the center of the heat map after the initial thermal plume had ascended and before the laser was turned off. The plots show a peak in signal intensity on the left side of the laser path and the absence of a peak on the right, most similar to the profile shown by collagen alone.
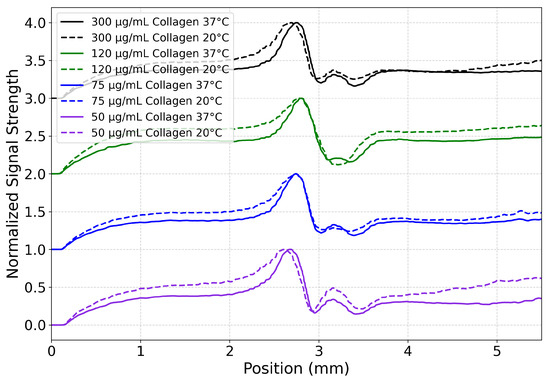
Figure 8.
HA/collagen heat transfer profiles for several mixtures at 20 °C (dashed line) and 37 °C (solid line). The time integration range is 9.5–12.0 s. For all mixtures in this study, an asymmetry in the profiles indicates strong convection. Normalized (between 0 and 1) signal strength was plotted from the raw video files. Data are vertically offset by concentration to aid the eye. A position of 0 mm is marking the bottom of the video frame and ≈5.5 mm is marking the top. The laser itself is at ≈3.2 mm.
These results give us insight into how interactions between HA and collagen in VH contribute to the dynamics of heat transfer. A higher concentration of HA in the VH may result in a higher degree of conductive heat transfer, likely due to an increase in viscosity. However, an increase in collagen concentration in the presence of HA in the VH may decrease the amount of conductive heat transfer from an external laser heat source in some cases. It was hypothesized by Vulpe et al. that this was due to an increase in the disruption of the entanglement of HA molecules as the collagen concentration increased, leading to a reduction in viscosity [13].
It is important to note that one cannot fully replicate the three-dimensional structures that are formed between HA and collagen in endogenous VH [5,13]. These three-dimensional structures likely contribute to the optical and thermal properties of the VH, thus limiting our ability to model endogenous VH with artificial VH mixtures.
3.6. Female White-Tailed Deer Vitreous Humor
Female white-tailed deer VH was obtained via legal and ethical hunting practices and generated the heat map pictured in Figure 9 when run through the photothermal system described at 20 °C and 37 °C. These heat maps display a significant symmetry across the horizontal of the heated region. The symmetry represents almost exclusive conductive heat transfer in these samples. Although this is deer VH, it is the closest model of human VH obtainable for this study. The image likely closely represents the heat transfer within human VH, which is made up of the components mentioned earlier in this study. Moreover, it supports the expectation of nearly exclusive conductive heat transfer in a healthy human VH.
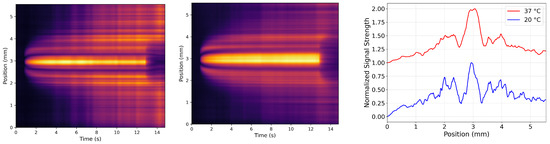
Figure 9.
Heat maps for the extracted VH of a female white-tailed deer at 20 °C (left) and 37 °C (middle). The (right)-most panel shows the normalized signal strength (integrated for 5 s to 12.0 s) with 20 °C the bottom curve and 37 °C the top curve. (The curves are offset vertically to aid the eye). Clearly, the deer vitreous does not offer as clean of a thermal lensing signal as the pure components. Nonetheless, the symmetry of the profiles indicates conduction is the primary avenue for heat flow. By way of example, silicone oil is shown in Supplementary Materials as an example of strong symmetry.
Female white-tailed deer VH was acquired following legal and ethical hunting protocols and represents the most physiologically relevant model of endogenous human VH accessible for this study. Four sets of deer eyes were collected; however, due to sample limitations, only one endogenous VH sample was ultimately analyzed. Two sets of eyes exhibited substantial intravitreal hemorrhage, rendering them unsuitable for photothermal analysis. Of the remaining globes, three were excluded due to insufficient extracted vitreous volume or pigment contamination during extraction. Thus, the clearest and most intact vitreous body was selected for imaging with the photothermal system, and its heat maps are displayed in Figure 9.
When analyzed at 20 °C and 37 °C (Figure 9), this sample displayed marked symmetry across the horizontal axis of the heated region, consistent with samples demonstrating nearly exclusive conductive heat transfer. This observation supports expectations based on the viscoelastic nature of healthy VH.
While only one deer VH sample was usable, its behavior speaks to the complexity of endogenous vitreous, especially in comparison to the artificial VH formulations featured throughout this study. Endogenous VH contains a heterogeneous matrix of HA-collagen fibrillar networks, hyalocytes, proteins, and other macromolecular and cellular constituents that cannot be fully replicated in current artificial models. These features likely contribute to the apparent signal noise observed in the deer heat maps, as compared to the cleaner profiles seen in artificial HA and collagen samples. Despite this complexity, the observed dominance of conductive transfer aligns with the hypothesis that intact, healthy VH—due to its structured matrix and higher viscosity—primarily conducts heat in vivo.
4. Conclusions
Despite the various computational models of laser-induced heat transfer in human VH in the literature, there are limited experimental data supporting these models. The methods of this study describe a photothermal spectroscopy system that can be successfully utilized to generate experimental data. Additionally, the results of this experiment reveal the contributions of individual components to the overall heat transfer within the VH.
Some notable findings presented include the influence of component concentrations and temperature on heat transfer within artificial VH. Through the analysis of heat maps, the concentration of HA is recognized as the most significant influence on the extent of conductive heat transfer within artificial VH. However, increasing collagen concentration in the presence of HA in the VH may, in some cases, reduce relative conductive heat transfer from an external laser source. This effect is hypothesized to result from greater disruption of HA molecular entanglement as collagen concentration increases, leading to reduced viscosity [13]. The temperature of these samples also appears to significantly affect the extent of conductive movement. Another interesting finding was an increase in observed convective movement when the concentration of AA was increased. Based on the literature [15], it is hypothesized that this is due to the acidic nature of AA and its molecular characteristic of absorbing light more effectively than water.
The findings mentioned contribute applicable knowledge to ocular procedures involving lasers in the medical field. These findings will improve the understanding of thermal damage and the success of ocular laser procedures, in particular the practice of transpupillary thermotherapy (TTT) to target choroidal melanomas. A better understanding of the influence of the various physiological components on cooling through convection in the VH during TTT informs physicians on patient eligibility criteria for these procedures. A situation that limits the direction application of this work to TTT is the difference in wavelength of the laser, and the amount of energy transfer from the laser to the samples can depend strongly on wavelength. A future direction is to examine the heat transfer profiles within samples using different wavelengths.
This study also suggests a number of other potential directions for future investigations. The most evident is running additional combinations of the individual VH components to further observe the summation of the effects the physiological components have on heat transfer. This would allow for further analysis of samples modeling complete artificial VH to compare to computational models in the literature [1,2]. The complexity of endogenous VH in artificial samples could be better modeled by incorporating additional macromolecular components or matrix structuring. Moreover, testing additional endogenous VH samples would provide stronger biological validation of observed trends. It may also be beneficial to examine endogenous VH from humans or from species with VH composition more similar to humans than white-tailed deer, in order to obtain more representative data. Additionally, more work is needed to quantitatively convert the signal to directly determine the ratio of conductive heat flow to convective heat flow. Finally, this study also demonstrates how photothermal spectroscopy can be employed to examine heat transfer in biological fluids. In future work, the photothermal system described can be applied to examine the effects of laser-induced heating on individual biological fluids throughout the body.
Supplementary Materials
The following supporting information can be downloaded at https://www.mdpi.com/article/10.3390/biophysica5030031/s1, Document S1: Collection of heatmaps for all samples studied.
Author Contributions
Conceptualization, D.J.U., K.S., J.P. and R.A.; methodology, D.J.U. and K.S.; software, D.J.U.; validation, K.S., D.J.U., R.A. and J.P.; formal analysis, K.S., D.J.U., R.A. and J.P.; investigation, J.P., R.A., K.S. and D.J.U.; resources, R.A., K.S. and D.J.U.; data curation, J.P., R.A., K.S. and D.J.U.; writing—original draft preparation, J.P.; writing—review and editing, J.P., R.A., K.S. and D.J.U.; visualization, J.P., K.S. and D.J.U.; supervision, K.S. and D.J.U.; project administration, K.S. and D.J.U.; funding acquisition, K.S. and D.J.U. All authors have read and agreed to the published version of the manuscript.
Funding
This research received no external funding.
Data Availability Statement
The following supporting information is contained in the Supplementary Materials link: Full sample list with heat maps for the samples analyzed in this study. Raw data video files and .h264 files are available upon request.
Acknowledgments
Thelma Berquó is acknowledged for proofreading the initial draft. Internal funding for this work was provided by the Office of Undergraduate Research, Scholarship, and Creative Activity; Chemistry Department Endowed Research Fund; and Neuroscience Program at Concordia College, Moorhead, MN, USA.
Conflicts of Interest
The authors declare no conflicts of interest.
Abbreviations
The following abbreviations are used in this manuscript:
| AA | Ascorbic Acid |
| BSA | Bovine Serum Albumin |
| HA | Hyaluronic Acid |
| LA | Lactic Acid |
| TTT | Transpupillary Thermotherapy |
| VH | Vitreous Humor |
References
- Garcia, O.P.; Lyra, P.R.M.; Fernandes, A.; de Cássia Fernandes de Lima, R. The influence of the vitreous humor viscosity during laser-induced thermal damage in choroidal melanomas. Int. J. Therm. Sci. 2019, 136, 444–456. [Google Scholar] [CrossRef]
- Garcia, O.P.; Lyra, P.R.M.; Torres, V.L.L.; Fernandes, A.; de Cássia Fernandes de Lima, R. Identification of the main factors in the 3-D simulation of laser-induced thermal damage in choroidal melanomas. Int. J. Therm. Sci. 2021, 160, 106679. [Google Scholar] [CrossRef]
- Li, D.; Feng, J.; Zhao, P.; Chen, B.; Wang, G.; Yao, L.; Zheng, Y. Quantitative investigation on the effects of eyeball geometry, blood perfusion and natural convection in retinal laser surgery. Int. J. Therm. Sci. 2024, 203, 109132. [Google Scholar] [CrossRef]
- Singh, P.; Singh, A. Choroidal Melanoma. Oman J. Ophthalmol. 2012, 5, 3–9. [Google Scholar] [CrossRef]
- Kleinberg, T.T.; Tzekov, R.T.; Stein, L.; Ravi, N.; Kaushal, S. Vitreous Substitutes: A Comprehensive Review. Surv. Ophthalmol. 2011, 56, 300–323. [Google Scholar] [CrossRef]
- Le Goff, M.M.; Bishop, P.N. Adult vitreous structure and postnatal changes. Eye 2008, 22, 1214–1222. [Google Scholar] [CrossRef]
- Lee, B.; Litt, M.; Buchsbaum, G. Rheology of the vitreous body: Part 3. Concentration of electrolytes, collagen and hyaluronic acid. Biorheology 1994, 31, 339–351. [Google Scholar] [CrossRef]
- Hostiuc, S.; Negoi, I.; Hostiuc, M. Markers of hyperglycemia in the vitreous humor. A systematic review and meta-analysis. J. Forensic Leg. Med. 2021, 83, 102250. [Google Scholar] [CrossRef]
- Schwab, C.; Paar, M.; Fengler, V.H.; Ivastinovic, D.; Haas, A.; Seidel, G.; Glatz, W.; Malle, E.M.; Weger, M.; Velikay-Parel, M.; et al. Gender differences in albumin and ascorbic acid in the vitreous antioxidant T system. Free Radic. Biol. Med. 2020, 146, 257–263. [Google Scholar] [CrossRef]
- Mieno, H.; Marunaka, Y.; Inaba, T.; Kojima, K.; Yoneda, K.; Nagata, K.; Sotozono, C. pH balance and lactic acid increase in the vitreous body of diabetes mellitus patients. Exp. Eye Res. 2019, 188, 107789. [Google Scholar] [CrossRef]
- Donati, S.; Caprani, S.M.; Airaghi, G.; Vinciguerra, R.; Bartalena, L.; Testa, F.; Mariotti, C.; Porta, G.; Simonelli, F.; Azzolini, C. Vitreous Substitutes: The Present and the Future. BioMed Res. Int. 2014, 2014, 351804. [Google Scholar] [CrossRef]
- Gao, Q.Y.; Fu, Y.; Hui, Y.N. Vitreous substitutes: Challenges and directions. Int. J. Opthalmol. 2015, 8, 437–440. [Google Scholar]
- Vulpe, R.; Le Cerf, D.; Dulong, V.; Popa, M.; Peptu, C.; Verestiuc, L.; Picton, L. Rheological study of in-situ crosslinkable hydrogels based on hyaluronanic acid, collagen and sericin. Mater. Sci. Eng. C 2016, 69, 388–397. [Google Scholar] [CrossRef]
- Dominguez Lopez, J.; Gealy, M.W.; Ulness, D.J. Photothermal Imaging of Transient and Steady State Convection Dynamics in Primary Alkanes. Liquids 2023, 3, 371–384. [Google Scholar] [CrossRef]
- Biebighauser, J.; Dominguez Lopez, J.; Strand, K.; Gealy, M.W.; Ulness, D.J. Frustrated Laser-Induced Thermal Starting Plumes in Fresh and Salt Water. Liquids 2023, 4, 332–351. [Google Scholar] [CrossRef]
- Bialkowski, S.E.; Astrath, N.G.C.; Proskurnin, M.A. Photothermal Spectroscopy Methods, 2nd ed.; Wiley: Hoboken, NJ, USA, 2019. [Google Scholar]
- Liu, M.; Franko, M. Thermal Lens Spectrometry: Still a Technique on the Horizon? Int. J. Thermophys. 2016, 37, 67. [Google Scholar] [CrossRef]
- Bertolotti, M.; Li Voti, R. A Note on the History of Photoacoustic, Thermal Lensing, and Photothermal Deflection Techniques. J. Appl. Phys. 2020, 128, 230901. [Google Scholar] [CrossRef]
- Proskurnin, M.A.; Khabibullin, V.R.; Usoltseva, L.O.; Vyrko, E.A.; Mikheev, I.V.; Volkov, D.S. Photothermal and optoacoustic spectroscopy: State of the art and prospects. Physics-Uspekhi 2022, 65, 270–312. [Google Scholar] [CrossRef]
- Singhal, S.; Goswami, D. Thermal Lens Study of NIR Femtosecond Laser-Induced Convection in Alcohols. ACS Omega 2019, 4, 1889–1896. [Google Scholar] [CrossRef]
- Gordon, J.P.; Leite, R.C.C.; Moore, R.S.; Porto, S.P.S.; Whinnery, J.R. Long-Transient Effects in Lasers with Inserted Liquid Samples. J. Appl. Phys. 1965, 36, 3–8. [Google Scholar] [CrossRef]
- Long, M.E.; Swofford, R.L.; Albrecht, A.C. Thermal Lens Technique: A New Method of Absorption Spectroscopy. Science 1976, 191, 183–185. [Google Scholar] [CrossRef]
- Fang, H.L.; Swofford, R.L. The Thermal Lens in Absorption Spectroscopy. In Ultrasensitive Laser Spectroscopy; Kliger, D.S., Ed.; Academic Press: New York, NY, USA, 1983. [Google Scholar]
- Fang, H.L.; Swofford, R.L. Highly Excited Vibrational States of Molecules by Thermal Lensing Spectroscopy and the Local Mode Model. II. Normal, Branched, and Cycloalkanes. J. Phys. Chem. 1980, 73, 2607–2617. [Google Scholar] [CrossRef]
- Fang, H.L.; Meister, D.M.; Swofford, R.L. Overtone Spectroscopy of Nonequivalent Methyl C-H Oscillators. Influence of Conformation on Vibrational Overtone Energies. J. Phys. Chem. 1984, 88, 410–416. [Google Scholar] [CrossRef]
Disclaimer/Publisher’s Note: The statements, opinions and data contained in all publications are solely those of the individual author(s) and contributor(s) and not of MDPI and/or the editor(s). MDPI and/or the editor(s) disclaim responsibility for any injury to people or property resulting from any ideas, methods, instructions or products referred to in the content. |
© 2025 by the authors. Licensee MDPI, Basel, Switzerland. This article is an open access article distributed under the terms and conditions of the Creative Commons Attribution (CC BY) license (https://creativecommons.org/licenses/by/4.0/).