Review

Quantitative Characterization of Nonspecific Interactions Between Macromolecules in Complex Media: Comparison of Experiment, Theory, and Simulation

Laboratory of Biochemistry and Genetics, Department of Health and Human Services, National Institute of Diabetes and Digestive and Kidney Diseases, National Institutes of Health (NIH), Bldg 8, Rm 2A-04, 9000 Rockville Pike, Bethesda, MD 20892, USA
Biophysica 2025, 5(3), 25; https://doi.org/10.3390/biophysica5030025
Submission received: 9 May 2025 / Revised: 28 May 2025 / Accepted: 16 June 2025 / Published: 24 June 2025
(This article belongs to the Special Issue Investigations into Protein Structure)

Abstract

A brief summary of the effect of nonspecific interactions upon chemical equilibria in solutions containing a high total concentration of macromolecular solutes comparable to that found in biological fluid media is presented. Analyses of experimental measurements permitting relatively direct quantitation of the free energy of nonspecific intermolecular interaction in solutions of one or two macrosolutes are described, and a table listing published experimental studies of both homo- and hetero-interactions is provided. Methods for calculating the free energy of nonspecific interaction via theory and computer simulation are described. Recommendations for further progress in both measurement and calculation of interaction free energies are presented.

1. Introduction

During much of the 20th century, interactions between biological macromolecules were studied in solutions dilute in macromolecules, and in many cases, experimental results were extrapolated to infinite macromolecular dilution in order to characterize the equilibrium or kinetic behavior of a single macromolecule interacting with another single macromolecule in a bath of solvent and small molecules. However, it has gradually been recognized that in real biological fluid media, the equilibria and kinetics of such reactions may be altered qualitatively by the presence of collectively high concentrations of other macromolecules, termed ‘background’ species, that do not participate directly in the reaction of interest, but nonetheless interact nonspecifically with the reactants [1]. In the present work we address four topics: (1) Presentation of a concise review of the effect of nonspecific interactions between individual reactants and background species upon the equilibria of specific macromolecular reactions. (2) Description of several experimental methods for quantifying the magnitude of nonspecific interactions and listing examples of published results. (3) Description of theoretical and computational approaches to calculating the strengths and consequences of nonspecific interactions between macromolecular solutes (macrosolutes). (4) Recommendations for progress in both experimental and simulation approaches to the quantitative characterization of nonspecific interactions in complex media.

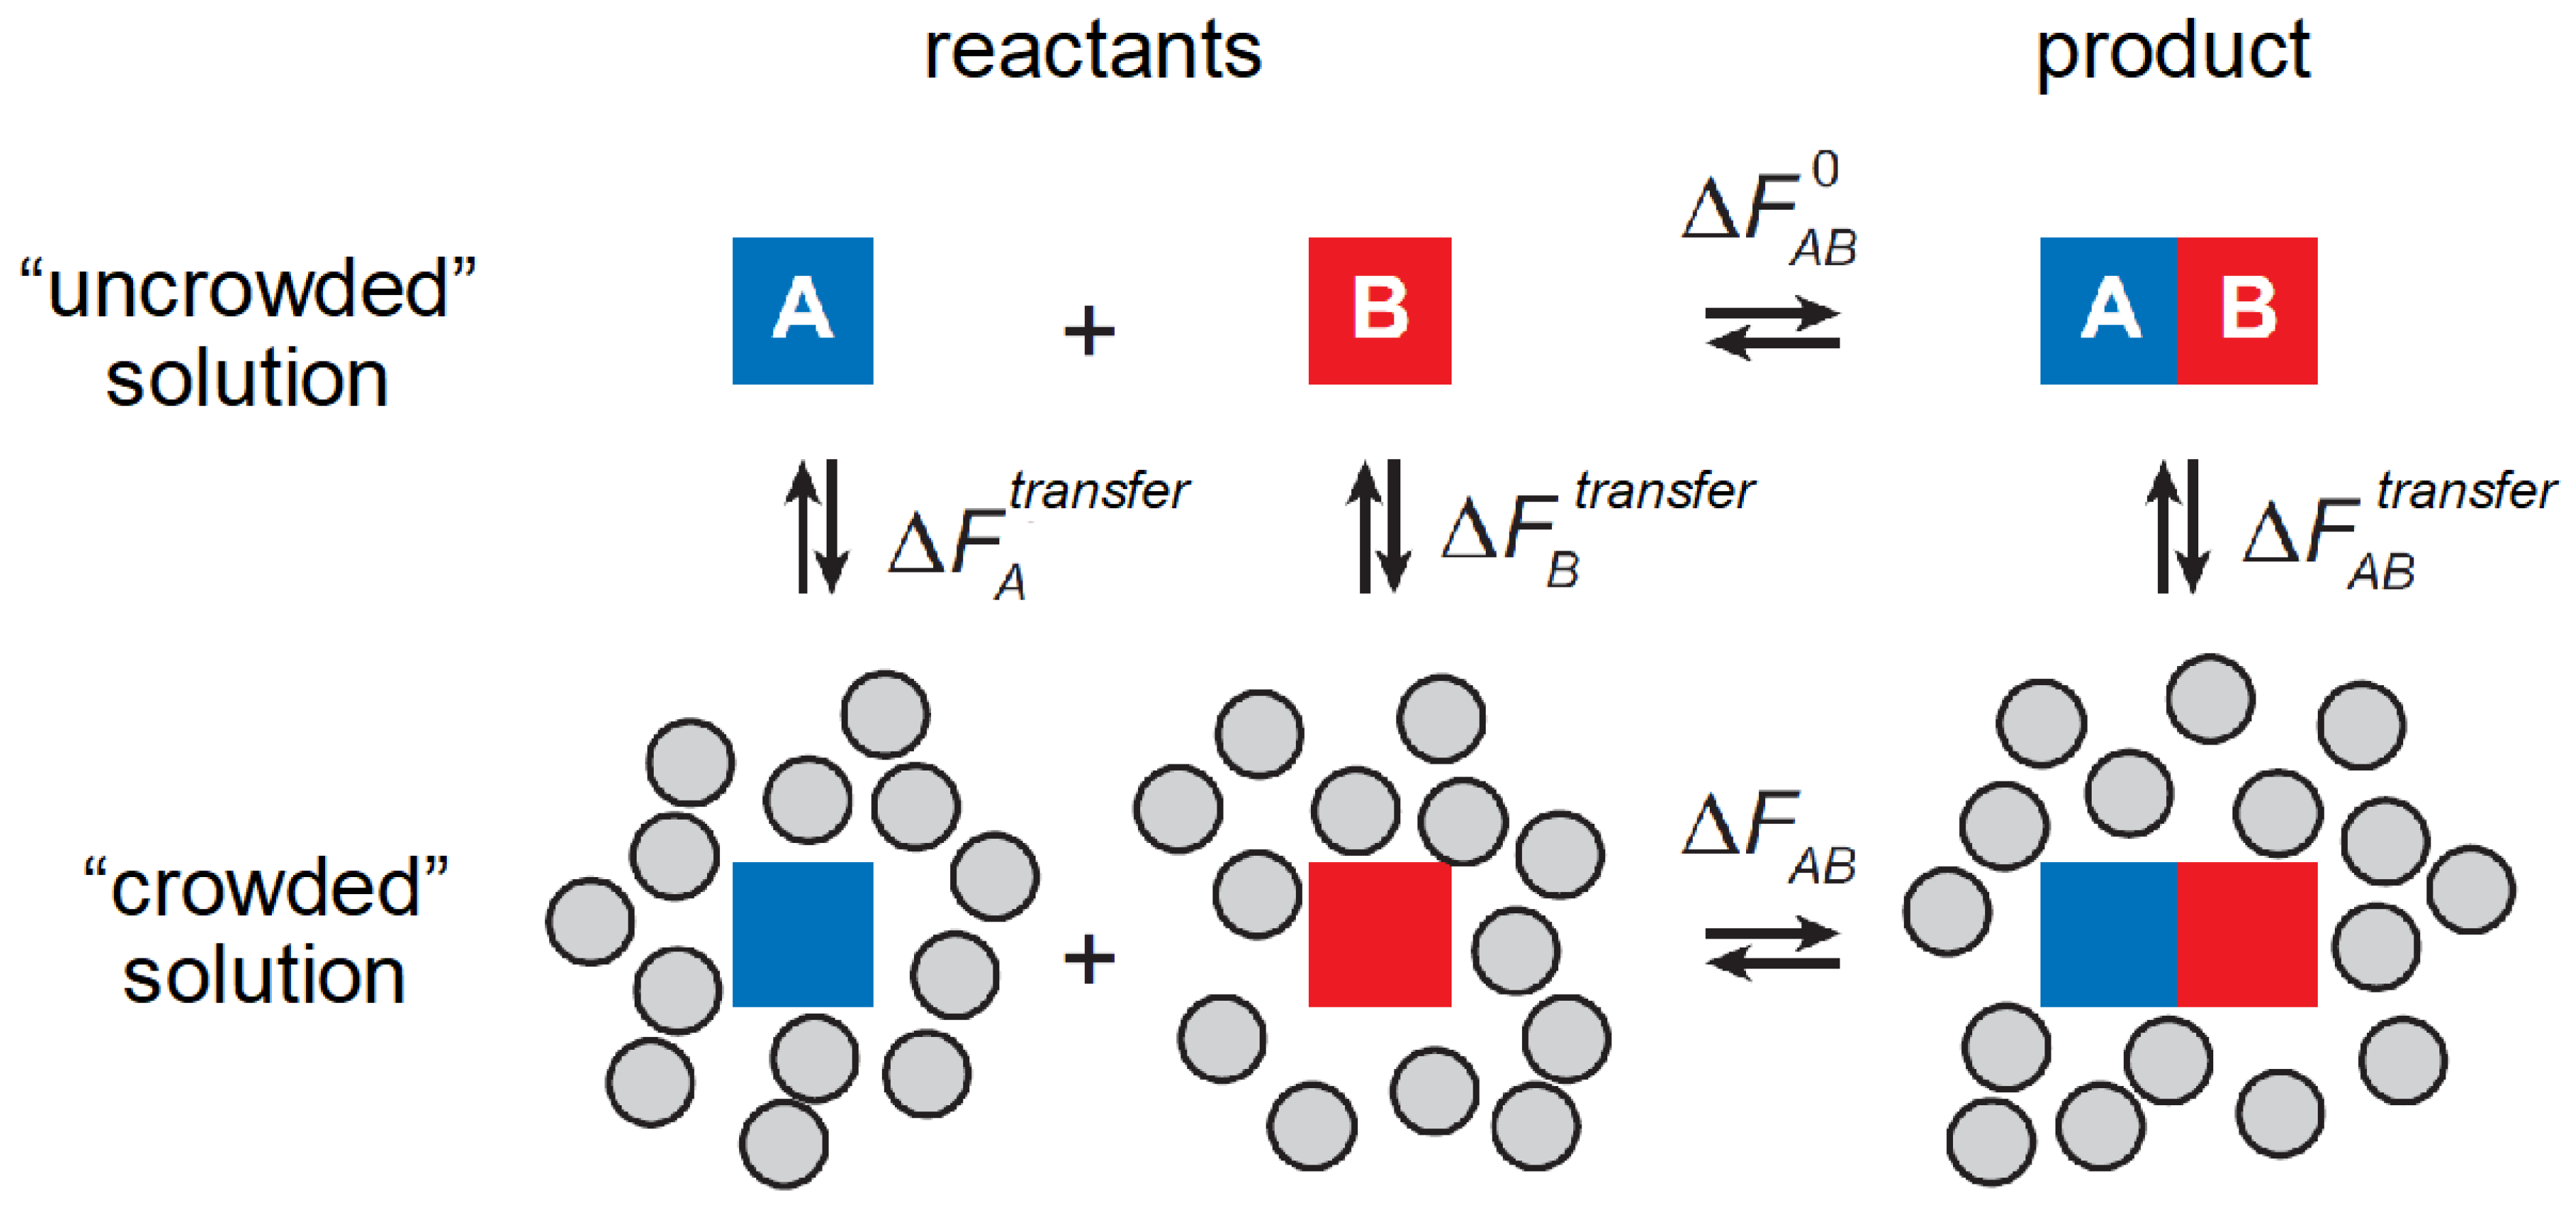
2. Introduction to the Thermodynamic Characterization of Nonspecific Interactions

The term “protein–protein interaction” or PPI has been commonly used in the literature to describe those strongly attractive interactions that result in the formation of complexes so stable that they have been identified by their persistence outside of equilibrium conditions (i.e., in the absence of individual reactants) [2,3]. This terminology is unfortunately misleading. In general, interaction between two bodies means one body is sensitive to the presence of the second body. It follows that every macromolecule in a solution interacts with every other macrosolute and small molecule cosolute in its immediate environment, even if the only interaction is steric repulsion. Interactions between macrosolutes may be ranked in order of their respective free energies, as illustrated in Figure 1.
The most attractive of these interactions are typically multivalent, resulting from the spatial juxtaposition of individually weak determinants (such as individual amino acid sidechains) that collectively create a binding site or a binding interface, and usually result in saturable binding and the formation of stable, structured complexes. The theoretical and experimental characterization of attractive interactions leading to specific binding in dilute solution has been studied intensively for the better part of a century and is documented in numerous reviews and textbooks (see for example [5,6]). The present work is concerned with less attractive attractions that may lead to unstructured clustering of macrosolutes or the formation of condensed phases, and repulsive electrostatic and excluded volume interactions that do not lead to clustering, but may have a substantial effect upon the chemical reactivity and distribution of individual macrosolutes in the solution, as discussed below. These weaker interactions generally arise from gross physical properties of the interacting macromolecules, such as molecular size, shape, and the intramolecular distribution of electrostatic charge as a function of pH, rather than detailed chemical structure at the atomic level [7,8].
We consider a solution of one or more species of macrosolutes and one or more species of small molecule solutes. The free energy of interaction between a molecule of macrosolute species i and all of the other macrosolute molecules in this solution (including other molecules of species i) is equal to the free energy change of the system upon transfer of a molecule of species i from an ideal or “uncrowded” solution containing no other macrosolutes to a non-ideal or “crowded” solution containing one or more species of macrosolutes, i.e., the difference between the chemical potential of species i in the crowded and uncrowded solutions:
Δ F i t r a n s f e r c M , c S , T = R T ln γ i c M , c S , T = μ i c M , c S , T μ i 0 , c S , T
The free energy of transfer Δ F may refer to either the Gibbs or Helmholtz free energy, depending upon whether the introduction of species i takes place under constraints of constant pressure or constant volume [In an aqueous solution that is essentially incompressible under normal laboratory conditions, the difference between Gibbs and Helmholtz free energies is ordinarily negligible. The quantitative development to follow assumes a constant volume system, and the free energies so calculated are formally Helmholtz free energies]. In Equation (1), μ i denotes the chemical potential of species i, c M , c S denotes the array of molar concentrations of all macrosolutes (subscript M) and small molecule solutes (subscript S), γ i the thermodynamic activity coefficient of species i, T the absolute temperature, and R the molar gas constant. It should be noted that the free energy of interaction between a molecule of species i and other macrosolute molecules so defined includes contributions resulting from redistributions of water and small molecule solutes accompanying the introduction of i to the solution, and thus refers strictly to the free energy of interaction in an implicit solvent of specified composition under specified experimental conditions, and not in a solution of different composition, pH, salinity, or temperature.
The influence of nonspecific interactions upon chemical equilibria is illustrated by the simple example depicted schematically in Figure 2, the hetero-association of two monomeric macrosolute molecules to form a heterodimer in dilute solution, and in a solution containing a substantial concentration of background macrosolutes.
The free energies of hetero-association in the uncrowded and crowded solutions are denoted by Δ F A B 0 and Δ F A B , respectively. Since the free energy of the system is a state function, we may construct the thermodynamic cycle indicated in Figure 2, according to which
Δ F A B Δ F A B 0 = Δ F A B t r a n s f e r Δ F A t r a n s f e r Δ F B t r a n s f e r
Combination of Equations (1) and (2) together with the equilibrium relation Δ F = R T ln K yields
ln K A B = ln K A B o + ln γ A c M , c S , T + ln γ B c M , c S , T ln γ A B c M , c S , T
where K A B and K A B 0 , respectively, denote the association equilibrium constants for formation of the heterodimer in the crowded and dilute (ideal) solutions. In this example, the difference between the logarithms of the equilibrium constants for hetero-association in nonideal and ideal solutions is equal to the difference between the sum of free energies of transfer of the individual reactants and the free energy of transfer of the product. This result may be generalized to an arbitrary reversible reaction between nreactants species of reactants denoted Ri and nproducts species of products denoted Pj
i = 1 n r e a c t a n t s n i R i K e q j = 1 n p r o d u c t s n j P j
according to which the generalized equivalent of Equation (3) is [9,10].
ln K e q = ln K e q 0 + i = 1 n r e a c t a n t s n i ln γ i j = 1 n p r o d u c t s n j ln γ j
The logarithm of the thermodynamic activity coefficient of species i is proportional to the free energy of interaction between a molecule of i and all other macrosolute molecules. For the present purpose we classify all solutes as either macrosolutes or small molecule solutes. As described above, water and small molecule solutes are treated together as an implicit homogeneous solvent. Then, ln γ i may be expanded in powers of macrosolute concentrations as follows:
ln γ i c M , c S , T = j = 1 n M B i j c S , T c j + j = 1 n M k = 1 n M B i j k c S , T c j c k + O ( j , k , , T )
where cj and ck respectively denote the molar concentrations of macrosolute species j and k, and the summations are carried out over all nM species of macrosolute, including species i. Further, ln γ i may be expanded in powers of weight/volume concentrations:
ln γ i w M , w S , T = j = 1 n M C i j w S , T w j + j = 1 n M k = 1 n M C i j k w S , T w j w k + O ( j , k , , T )
where wX denotes the weight/volume concentration of solute species X (typically in units of g/l), C i j = B i j / M j , and C i j k = B i j k / M j M k , and M X denotes the molar mass of X. Equations (2)–(7) thus make explicit the effect of nonspecific interactions between reactants and products with background species upon the equilibrium constant.
Thus the first term on the rhs of Equations (6) and (7) indicates the energetic contribution of the interaction of a single molecule of i and a single molecule of each of the macrosolutes present in solution; the second term indicates the energetic contribution of the simultaneous interaction of a molecule of i and every combination of two molecules of each of the macrosolutes; and O ( j , k , , T ) denotes the cumulative energetic contribution of the interaction between a molecule of i and successively greater numbers and combinations of macrosolute molecules. We shall refer to B i j or C i j and B i j k or C i j k as two-body and three-body macromolecular interaction coefficients (or interaction coefficients for short), respectively.
The interaction coefficients so defined should not be confused with the osmotic or virial coefficients commonly used to characterize the concentration dependence of osmotic pressure, although there is a straightforward relationship between them, illustrated by the simple case of a solution containing a single solute species. The concentration dependence of the osmotic pressure is given by
Π c = R T c + A 2 c 2 + A 3 c 3 +
where c denotes solute concentration, A2 the second osmotic virial coefficient, A3 the third osmotic virial coefficient and so on. For a single impermeable solute, d Π / d c = R T 1 + d ln γ / d ln c [6]. It follows that B 2 B 11 = 2 A 2 , B 3 B 111 = 3 / 2 A 3 , and B n = n / n 1 A n .
The Equations (6) and (7) make explicit the formal separation between macromolecule–macromolecule and macromolecule–small molecule interactions, the latter of which are taken into account implicitly as determinants of the values of the macromolecular interaction coefficients. While this equation is generally valid, the values of the interaction coefficients and thus ln γ i will depend upon whether a given solute species of intermediate size is classified as a small molecule or macromolecular solute.
According to the multicomponent solution theory of McMillan and Mayer [11], each of the interaction coefficients indicated in Equations (6) and (7) may be calculated as functions of the potential of mean force (or PMF for short) acting between two, three, and higher numbers of macrosolute molecules. The PMF for a specified macromolecular configuration, or set of relative positions and orientations of two interacting macromolecules, denoted by U M F r * , Ω * , is defined as the difference between the equilibrium free energy of the solution containing the two specified macromolecules constrained at their specified relative distances and orientations, and the equilibrium free energy of the solution when the two specified macromolecules are “infinitely” separated, i.e., separated by distances sufficiently great that they interact only with solvent and other solute molecules.
U M F r * , Ω * = F ^ r * , Ω * F ^ ,
where F ^ denotes the equilibrium free energy of the solution with the positional and orientational constraints specified above. When the macrosolute molecules are “infinitely” separated, the free energy of the system is independent of the relative orientations of the specified macrosolute molecules, and the configuration of solvent and other solute molecules may differ significantly from that calculated for r = r * and Ω = Ω * . The PMF therefore represents the effective potential of interaction between macromolecules in a bath of defined small-molecule composition and temperature that is formally treated as an implicitly homogeneous fluid.
It should be evident from the above development that in order to understand quantitatively (and hopefully to predict) how reactions in media as complex and heterogeneous as biological fluids are influenced by the composition of the medium, one must be able to evaluate the thermodynamic activity coefficients of each of the reactant and product species within the medium.

3. Experimental Measurement of the Free Energy of Transfer in Solutions of One and Two Macrosolutes

Several experimentally measurable properties of macromolecular solutions are directly determined by the thermodynamic activities of the macrosolutes, which may diverge substantially from the corresponding concentration of each macrosolute as the collective concentration of macrosolutes and the magnitude of consequent nonspecific interactions between them increase. These properties, referred to as colligative properties, include osmotic pressure, static light scattering, and sedimentation equilibrium. The concentration dependence of each of these properties has been used extensively for the better part of a century to characterize and quantify the molar mass and two-body interactions of individual species of macrosolutes [6]. More recently, advances in theoretical analysis and experimental techniques have facilitated accurate measurement of each of the colligative properties at high concentrations and subsequent evaluation of two-body and higher-order self- and hetero-interaction coefficients. In the following sections, we briefly summarize three methods for quantifying the composition dependence of the logarithm of the thermodynamic activity coefficient of each macrosolute species (proportional to the free energy of transfer of that solute species) in solutions containing one or two macrosolutes via measurement of the composition dependence of each colligative property. Relations presented below apply explicitly to the evaluation of two-body and three-body interaction coefficients. Treatments applicable to the determination of higher-order interaction coefficients are referenced in Table 1. [Other published methods for characterizing nonspecific intermolecular self-interactions include measurement and analysis of radial distribution functions via small-angle X-ray or neutron scattering [12,13,14] and measurement and analysis of liquid–liquid phase transitions [15]. In the present work, we focus on measurement and analysis of three colligative properties, because the composition dependence of these properties may be expressed simply and directly in terms of the activity coefficients of interacting solutes.]
The dependence of each of the three colligative properties upon the concentrations of each macrosolute in solution mixtures contain expressions for the derivative of the thermodynamic activity of each macrosolute species with respect to the concentrations of all macrosolute species, which in turn may be expressed as functions of the interaction coefficients defined in Equations (6) and (7). These expressions are presented for reference in Appendix A.

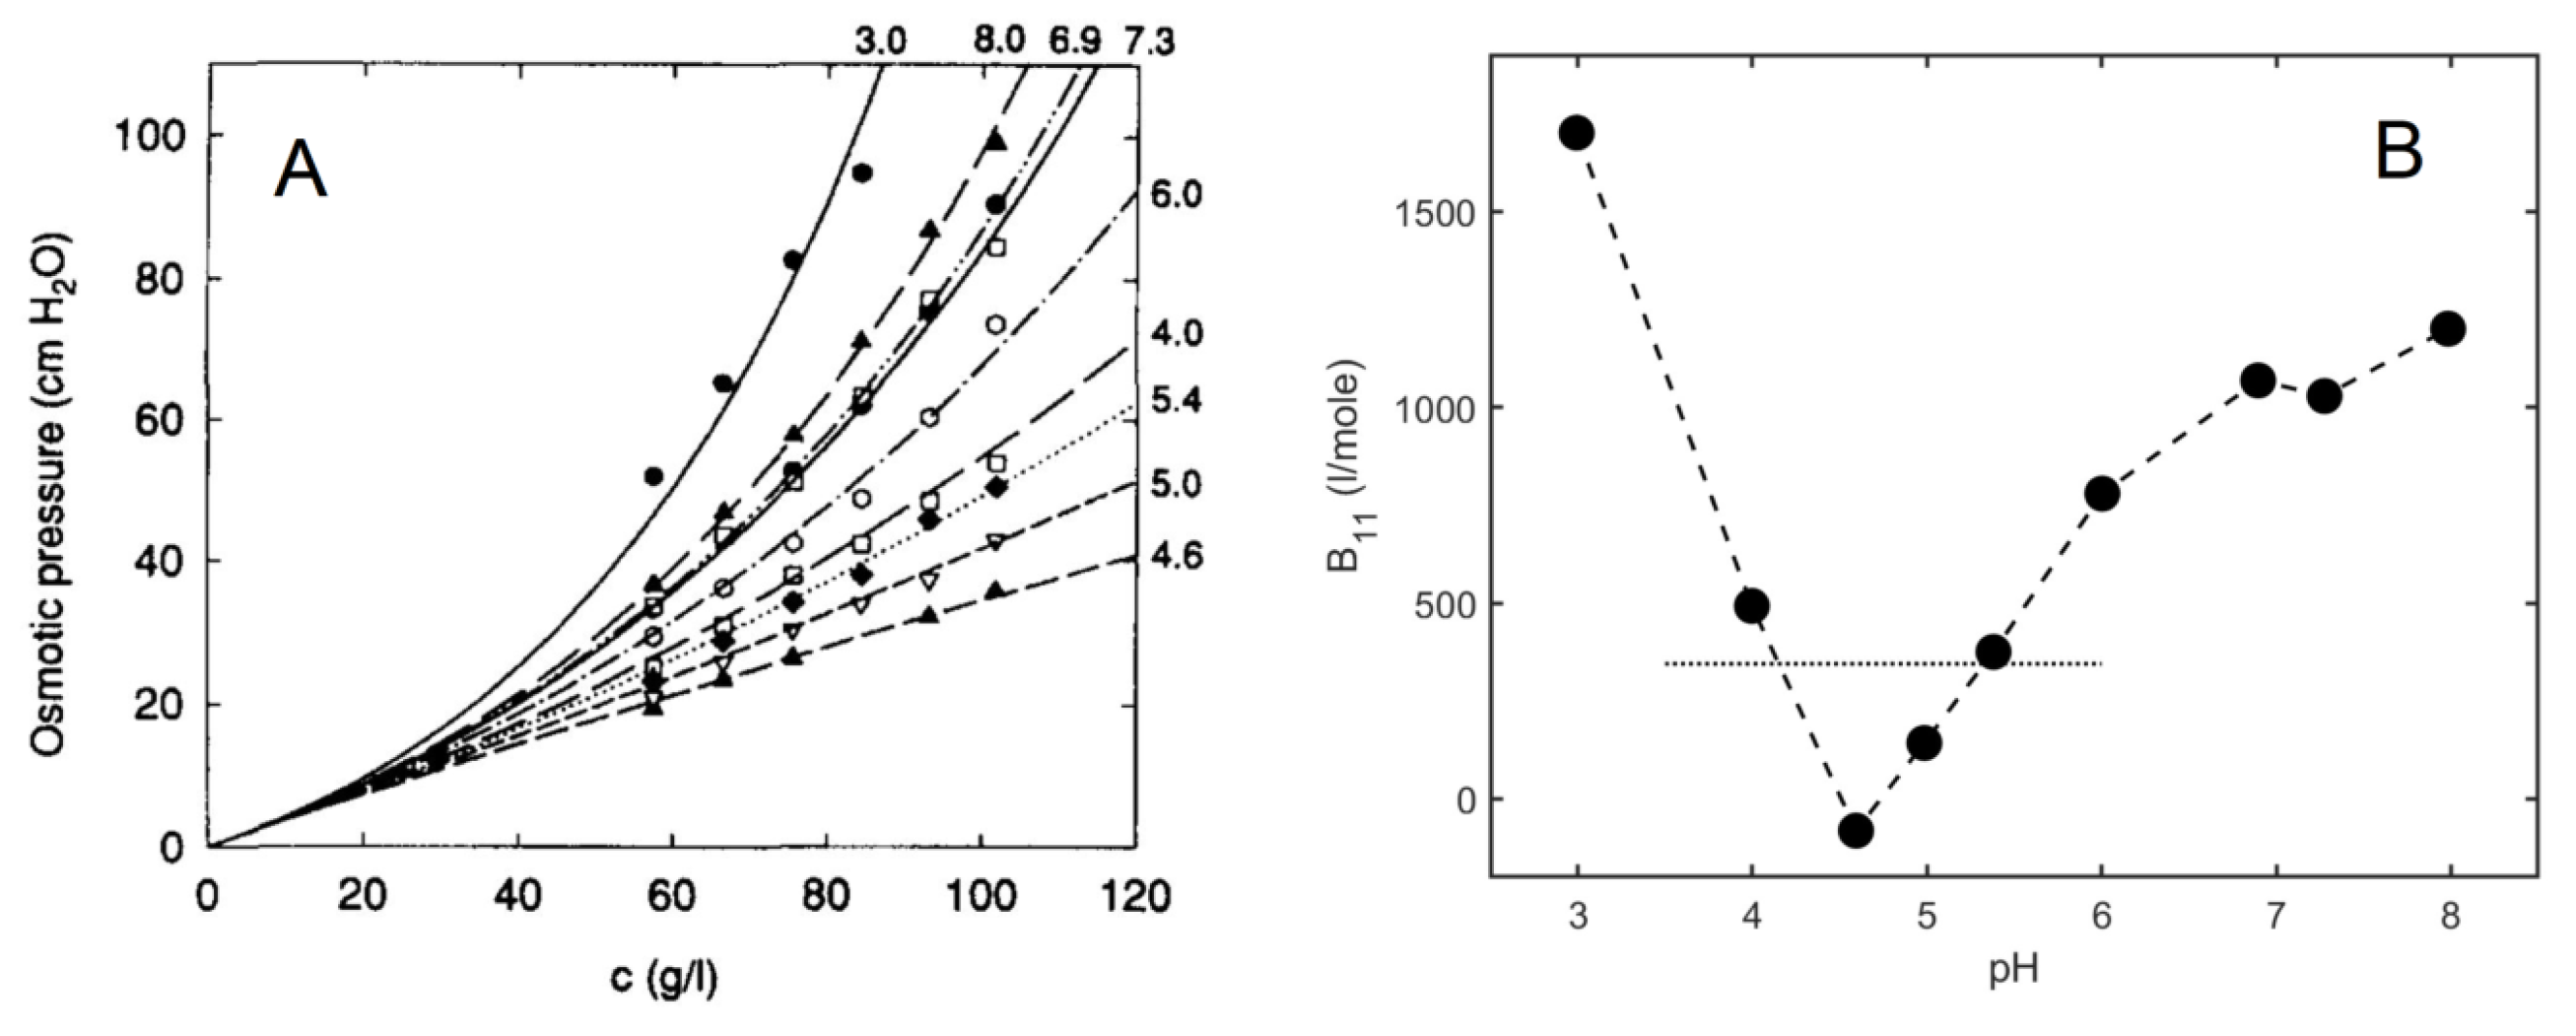
3.1. Osmotic Pressure

The osmotic pressure of macromolecular solutions may be measured directly over a wide range of concentrations and macrosolute compositions using a membrane osmometer [42] or by dialysis equilibrium against solutions containing varying concentrations of previously calibrated impermeable macrosolutes, such as polyethylene glycol [43].
The dependence of osmotic pressure upon composition in solutions containing multiple macrosolutes at arbitrary concentration has been derived [44]. For a solution containing one or two macrosolutes, the general relation (Equation (15) in [44]) simplifies to
Π c 1 * , c 2 * , T = R T v ¯ 0 × c 1 * + c 2 * + 0 c 1 * c 1 𝜕 ln γ 1 𝜕 c 1 c 2 = 0 d c 1 + 0 c 2 * c 2 𝜕 ln γ 2 𝜕 c 2 c 1 = c 1 * d c 2 + c 1 * 0 c 2 * 𝜕 ln γ 1 𝜕 c 2 c 1 = c 1 * d c 2
where v ¯ 0 denotes the partial specific volume of solvent + small molecules. Substitution of the derivatives in Equation (9) by expressions provided in Appendix A leads to
Π w 1 , w 2 , T = R T v ¯ 0 × Π ( 1 ) + Π ( 2 ) + Π ( 3 ) +
where v ¯ 0 denotes the partial specific volume of solvent + small molecule solutes, and
Π ( 1 ) = w 1 M 1 + w 2 M 2
Π ( 2 ) = 1 2 B 11 w 1 2 M 1 2 + B 12 w 1 w 2 M 1 M 2 + 1 2 B 22 w 2 2 M 2 2
Π ( 3 ) = 2 3 B 111 w 1 3 M 1 3 + 2 B 112 w 1 2 w 2 M 1 2 M 2 + 2 B 122 w 1 w 2 2 M 1 M 2 2 + 2 3 B 222 w 2 3 M 2 3
Π ( 1 ) , Π ( 2 ) , and Π ( 3 ) respectively denote the contributions to the total osmotic pressure of individual molecules, interacting pairs, and interacting triplets of macrosolute molecules. When only one macrosolute (species 1) is present, Equation (10) reduces to
Π w 1 , T = R T v 0 ¯ × w 1 M 1 + 1 2 B 11 w 1 2 M 1 2 + 2 3 B 111 w 1 3 M 1 3 +
The following is an example of quantitative information about nonspecific interactions derived from analysis of osmotic pressure data. Kanal et al. [45] measured the osmotic pressure of BSA solutions in 0.1 M NaCl as a function of protein concentration at various pH values. Their data are plotted in panel A of Figure 3, together with curves calculated using text Equation (11) with a global best-fit value of M1 = 68,360. The pH-dependent best-fit values of B11 are plotted in panel B. The horizontal dotted line in panel B indicates the estimated contribution of steric repulsion to the total value of B11 and indicates that between pH values of ~4 and ~5.5, longer-ranged interactions between BSA molecules in a solution of ionic strength 0.1 are primarily attractive, and outside of those values are primarily repulsive [46].

3.2. Static Light Scattering

The measurement of the intensity of time-averaged light scattering of macromolecules in solution as a function of both macrosolute concentration and the angle of scattering has been widely used for the determination of molar masses of proteins and polymers since the middle of the 20th century [47,48]. More recently, the theory of angle-independent scattering in multicomponent solutions has been generalized to allow for the effect of solute–solute interactions in concentrated solutions [49,50]. The dependence of excess scattering intensity upon the concentrations of each of two macrosolute species with the same specific refractive increment may be written as
S w 1 , w 2 R K o p t / n n 0 2 = M 1 w 1 1 + ξ 22 + M 2 w 2 1 + ξ 11 2 M 1 M 2 ξ 12 ξ 21 1 + ξ 11 1 + ξ 22 ξ 12 ξ 21
where R denotes the Rayleigh ratio extrapolated to zero scattering angle, which is proportional to scattering intensity [51], Kopt is an instrumental constant determined by calibration, n and n0 are the independently measurable refractive indices of solution and solute, respectively, ξ i j w j 𝜕 ln γ i 𝜕 w j , and n = d n d w w 1 + w 2 , where it has been assumed that both macrosolute species have the same specific refractive increment d n / d w [49]. From the relations presented in Appendix A, we obtain
ζ 11 = C 11 w 1 + 2 C 111 w 1 2 +
ζ 22 = C 22 w 2 + 2 C 222 w 2 2 +
ζ 12 = C 12 w 2 + 2 C 122 w 2 2 + 2 C 112 w 1 w 2 +
ζ 21 = C 12 w 1 + 2 C 112 w 1 2 + 2 C 122 w 1 w 2 +
When the solution contains only one macrosolute species, Equation (12) simplifies to
S w i = M i w i 1 + C i i w i + 2 C i i i w i 2 +
The following is an example of the application of these relations to the analysis of experimental light-scattering data in a solution containing two macrosolute species. Best fit values of M1, M2, C11, C111, C22, C222, C12, C112, and C122 were obtained via global nonlinear least-squares fitting of Equations (12) and (13) to the combined experimental data plotted in Panel A of Figure 4. The composition-dependent values of ln γ 1 and ln γ 2 were then calculated using the values of the two-body and three-body interaction coefficients evaluated together with Equation (7) [29].

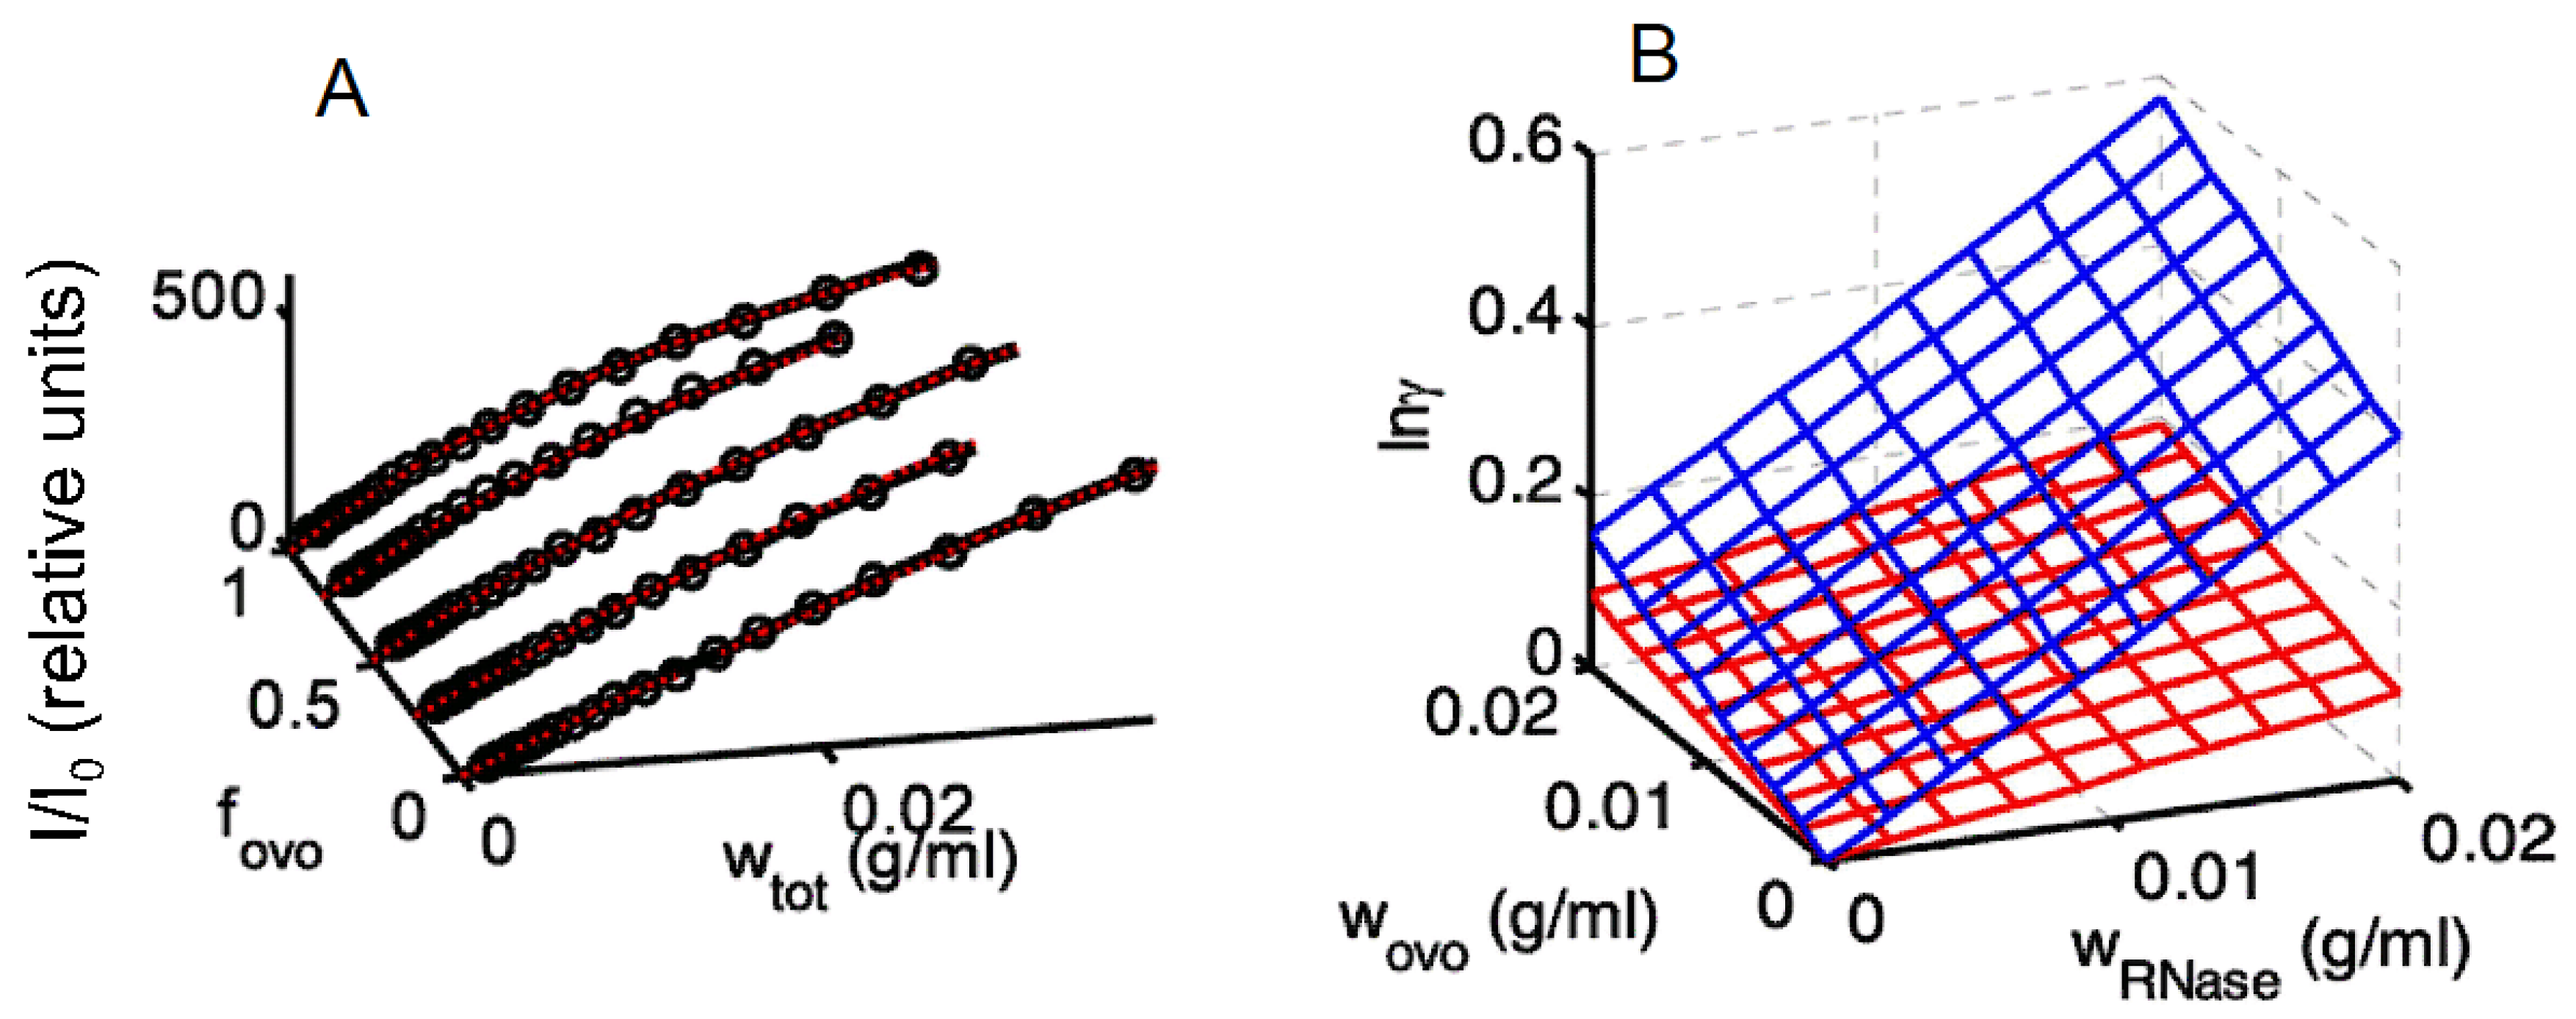
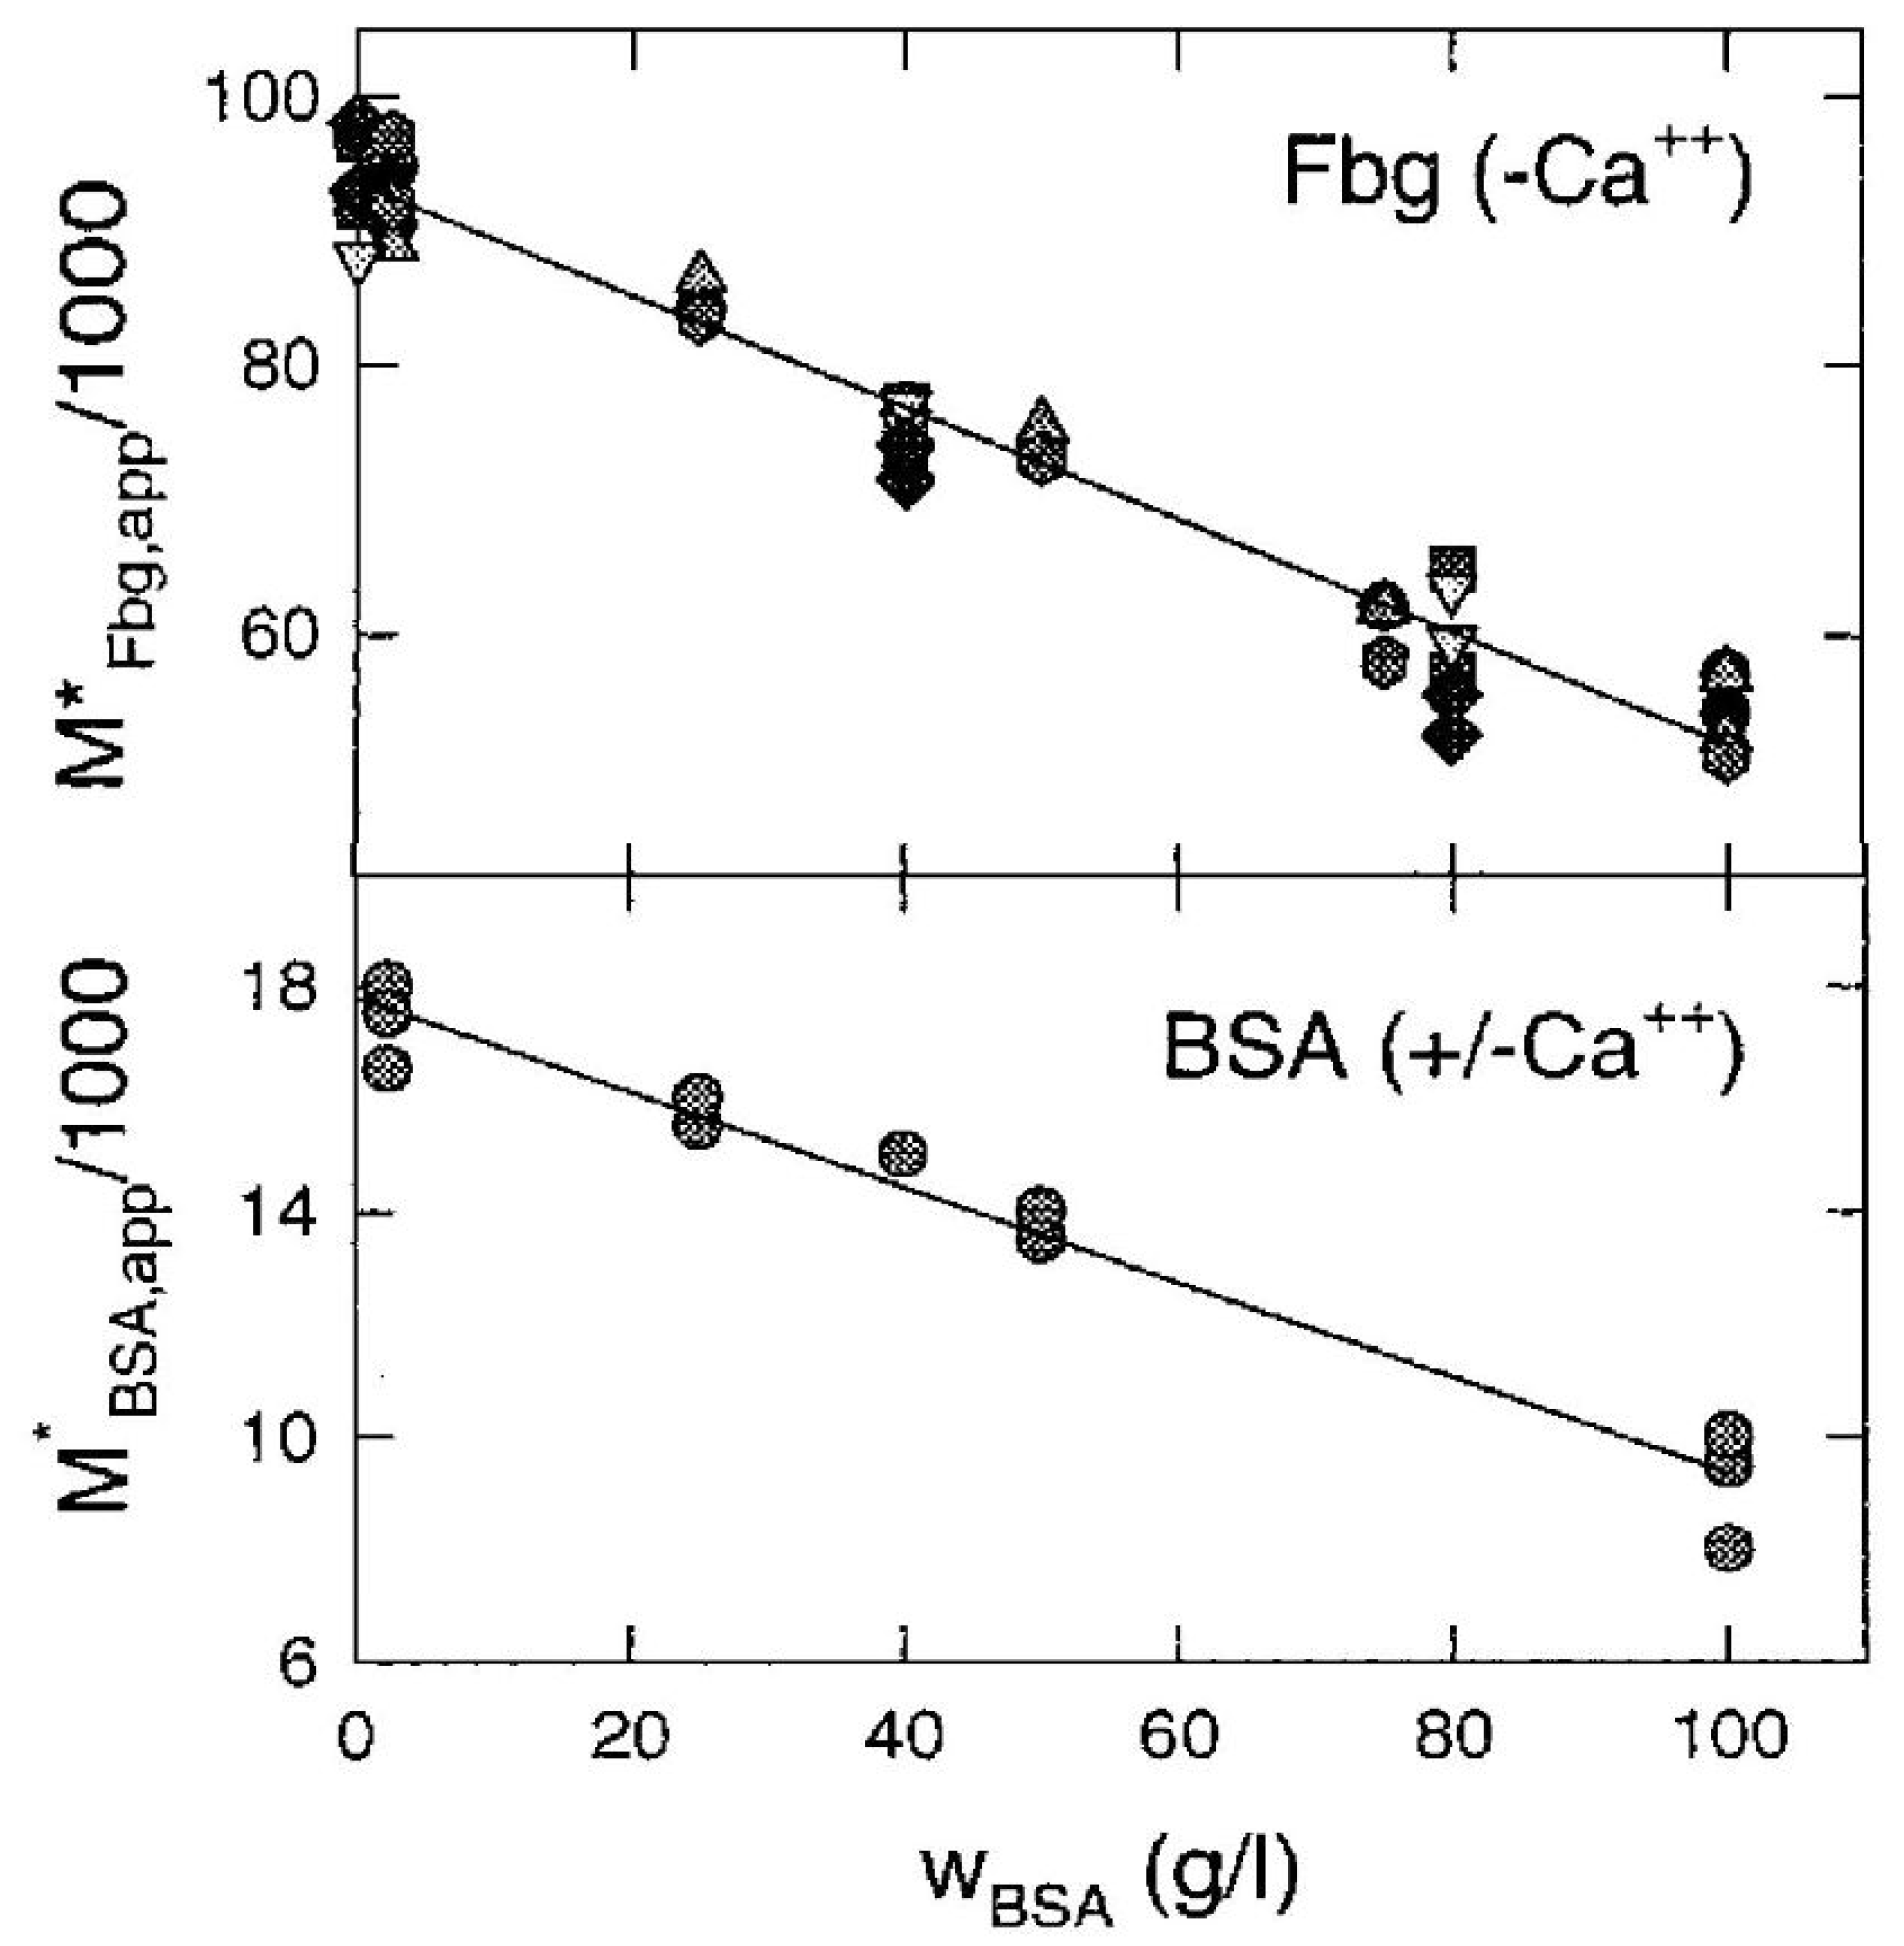
3.3. Nonideal Tracer Sedimentation Equilibrium

We consider a solution of one or more macrosolute species within a sample cell in a spinning centrifuge rotor. At sufficiently low rotor speeds, the tendency of each species of macromolecule in the solution (having a density greater than that of the solvent) to sediment outward due to centrifugal force is counteracted by the tendency of that species of macromolecule to diffuse inward against the concentration gradient. At sedimentation equilibrium these tendencies are equal at all radial distances (distance from the center of rotation), resulting in an experimentally measurable concentration gradient of each macromolecular solute species w i r , where r is the radial distance, that is independent of time [52]. The theory of sedimentation equilibrium in highly nonideal solutions of multiple macrosolute species [53] has been combined with the technique of tracer sedimentation equilibrium [54] and generalized to the technique of Nonideal Tracer Sedimentation Equilibrium, or NITSE for short [55,56].
We consider a solution containing two species of macrosolute and let species 1 be present at a concentration so low that it does not self-interact. Under such conditions, species 1 interacts only with species 2, while species 2 interacts essentially entirely with itself. The equilibrium gradient of dilute species 1 may be measured independently of the gradient of species 2 by measuring the gradient of a property proportional to w/v concentration not shared by species 2, either intrinsic to species 1 or provided by a label [55,56]. [If utilizing an extrinsic label to measure the concentration of dilute macrosolute 1, it is incumbent upon the investigator to demonstrate that the label does not significantly affect the interaction of macrosolute species 1 and 2, and that the measurable signal provided by the label is proportional to the weight/volume concentration of species 1, independent of the concentration of species 2 [54]]. The gradient of macrosolute species 2, present at a significantly greater concentration (>1 mg/mL) may be measured by conventional (typically optical) means.
One may then evaluate an experimentally measurable quantity called the apparent buoyant molar mass of each species according to
M i , a p p * = 2 R T ω 2 × d ln w i r d r 2
where ω is the rotor speed in radians/s. When the ratio of the concentrations of each of the macrosolutes at sedimentation equilibrium does not vary more than a factor of ~3 over the length of the solution column, to a very good approximation the dependence of ln w i upon r2 is linear across the sample column [54]. Thus, in the absence of high-affinity association of species 1 either with itself or with species 2, the apparent buoyant molar mass of each macrosolute species in the sample cell is independent of the concentration of species 1 and depends only on the concentration of species 2 determined prior to centrifugation.
When macrosolute species 1 is much more dilute than species 2 (i.e., so dilute that it does not self-interact), it follows from nonideal sedimentation equilibrium theory that
L i m w 1 0 ζ 12 = M 1 * M 1 , a p p * / M 2 , a p p * = C 12 w 2 + 2 C 122 w 2 2 + 3 C 1222 w 2 3 +
ζ 22 = M 2 * M 2 , a p p * / M 2 , a p p * = C 22 w 2 + 2 C 222 w 2 2 + 3 C 2222 w 2 3 +
Here M i * denotes the actual buoyant mass of species i, equal to M i 1 v ¯ i ρ 0 , where v ¯ i is the independently measured partial specific volume of species i and ρ 0 the density of solvent [53]. Measurements of M 1 , a p p * and M 2 , a p p * are made in solutions containing a constant (very low) concentration of species 1 and a range of concentrations of species 2. The values of M 1 * and M 2 * are obtained by extrapolating the values of M 1 , a p p * and M 2 , a p p * , respectively, to zero concentration of species 2. Then the values of the relevant two- and three-body interaction coefficients are obtained via modeling the concentration dependence of ζ 12 and ζ 22 by Equations (16a) and (16b).
The evaluation of interaction coefficients by analysis of NITSE data is much simpler than via analysis of osmotic pressure or light scattering data, as it does not require complex nonlinear modeling of data, and may readily be extended to the analysis of data obtained at concentrations at which higher than three-body macrosolute interactions become significant. We illustrate this with results obtained by Rivas et al. [23], who measured the apparent molar mass of fibrinogen (Fbg) and BSA in mixtures containing a fixed dilute concentration of FITC-labeled Fbg (<1 g/L) and a range of concentrations of unlabeled BSA extending to 100 g/L. Their results are summarized in Figure 5.
The results plotted in Figure 5 may be described to within experimental uncertainty by the following linear equations:
M 2 , a p p * / 1000 = 17.8 0.0845 w 2
M 1 , a p p * / 1000 = 93.5 0.416 w 2
These results may be modeled by fitting them with the polynomial expressions given in Equations (16a) and (16b) via linear least squares to obtain best-fit values of the interaction coefficients. The best-fit values of the C coefficients may then be used together with text Equation (5) to calculate the dependence of the free energy of transfer of a molecule of either BSA or Fbg from a dilute solution to a solution containing a variable quantity of BSA, in units of thermal energy RT. [This procedure is valid only if the data may be fit to within experimental precision by a quadratic or cubic polynomial over the entire range of concentrations. Failure to achieve a satisfactory fit indicates that at the highest concentrations, intermolecular interactions between more than three macrosolute molecules may contribute significantly to the total measured property. One may empirically include one or more higher-order terms in the polynomial model until a satisfactory fit is achieved, but physical significance should not be attributed to the best-fit values of the highest order coefficients.] The results of modeling as described here are shown in Figure 6.
In a mixture containing macrosolutes that interact via both attractive as well as repulsive mechanisms (see Figure 1), the dependence of M 1 , a p p * and/or M 2 , a p p * upon w2 can deviate substantially from the linear relations shown in the example given above, and in some cases may depend non-monotically upon w2. In general, the experimentally determined dependences of M 1 , a p p * and M 2 , a p p * may be modeled by the polynomial expressions in Equation (16), extended to higher order if necessary, to evaluate the smallest number of interaction coefficients required to account for the data within experimental uncertainty, and then to calculate the dependence of both ln γ 1 and ln γ 2 over the entire experimentally measured range of w2. More general treatments of nonideal sedimentation equilibrium and NITSE may be found in [53,55].
Evaluation of self- and hetero-interaction coefficients and the dependence of ln γ upon solution composition by means of the three methods described above and other techniques has been reported for a variety of macromolecular solutions containing one and two macrosolute species. A non-exhaustive list of publications describing the methods and results of these measurements is presented in Table 1.

4. Quantitative Characterization of Nonspecific Interactions via Theory and Computer Simulation

4.1. Two-Body Interaction Coefficient

According to the multicomponent solution theory of McMillan and Mayer [11], the two-body interaction coefficient defined in Equation (4) may be described by
B i j c S , T = 1 exp U M F r i j , θ i j , ϕ i j , c S , T / k T ) d ϕ i j sin θ i j d θ i j r i j 2 d r i j
where the PMF is written to indicate explicitly its dependence upon the distance between the centers of mass of molecules i and j and the relative orientations of the two molecules (specified in polar coordinates), as well as its dependence upon the composition of solvent + small molecule solutes, and kT denotes the thermal energy in molecular units. If the PMF is angle-independent (i.e., spherically symmetrical) then Equation (18) reduces to
B i j c S , T = 4 π 0 1 exp U M F r i j , c S , T / k T r i j 2 d r i j
This calculation may be performed rapidly for an arbitrary angle-independent PMF via analytical or numeric integration of the rhs of Equation (19) with respect to rij, as illustrated below.
We note that the value of Bij calculated according to Equation (18) is in units of volume per interacting molecule of either species. In order to compare this value with experimentally measured values of Bij, reported in units of l/mole as presented in Section 3, a constant of proportionality must be introduced:
B i j e x p t c j 1 = B i j c a l c ρ j 1 × N A 1000
where cj and ρ j respectively denote the molar concentration and number density (# molecules/cm3) of species j, and NA denotes Avogadro’s number.
The square well interaction is the simplest PMF exhibiting both “hard” interactions due to steric exclusion and “soft”, longer range interactions that are characteristic of actual interactions between macromolecules in solution, defined by
r i j r i + r J U M F r i j , c S , T = ε i j r i + r j < r i j L i j r i + r j 0 r i j > L i j r i + r j
where r i j denotes the distance between the centers of the two spherical interacting particles and ε ij the free energy of interaction between the two particles when the centers are separated by distances between r i + r j (the contact distance) and L i j r i + r j , where Lij > 1. It should be kept in mind that because UMF is an effective PMF, the values of ε and L are, in principle, functions of c S and T . Substituting Equation (21) into Equation (19) yields
B i j = B j i = 4 π 3 r i + r j 3 + 1 exp ε i j / R T × L i j 3 1 r i + r j 3
The first and second terms on the rhs of Equation (22), respectively, represent contributions from steric repulsion and longer range “soft” interaction, which may be either attractive ε i j < 0 or repulsive ε i j > 0 . In the absence of significant soft interaction ε i j 0 , the two-body interaction coefficient is positive and equal to the volume of a sphere with a radius equal to r i + r j , which is the volume excluded by a spherical molecule of species i to the center of a spherical molecule of species j. Thus, the contribution due to steric repulsion is often referred to as excluded volume. Inspection of Equation (22) reveals that repulsive soft interactions increase the value of Bij and attractive soft interactions decrease the value of Bij, which may become negative for sufficiently strong attraction.
The accurate calculation of Bij for angle-dependent potentials of mean force via Equation (18) requires multi-dimensional numeric quadrature of high resolution. Techniques have been devised to reduce the computational effort required to evaluate the two-body interaction coefficient for self-interaction of several proteins (see for example [57,58]).

4.2. Higher-Order Interactions

The two-body interaction coefficient describes the dependence of the free energy of transfer only in the limit of initial deviations from ideal behavior, i.e., at low macrosolute concentrations. The difference between the experimentally measured dependence of ln γ upon concentration and that calculated on the basis of a two-body interaction coefficient alone is illustrated in Figure 7.
It may be seen that at the highest concentrations, the estimate of ln γ based upon knowledge of the value of the two-body interaction coefficient alone is only about half of the experimentally-based value. It follows that quantitative information about the magnitude of nonspecific intermolecular interactions in highly concentrated solutions containing multiple species of macrosolute is essential if one seeks to predict the effects of the environment upon macromolecular behavior in fluid media comparable in complexity to many biological fluids.
A computational strategy for estimating the free energy of transferring a particular macrosolute molecule into a crowded fluid of arbitrary composition was introduced by Zhou, Qin, and coworkers [58,59]. The procedure may be summarized as follows. First, macrosolutes of known atomic structure (globular proteins in the published examples) are placed into a box until a predetermined fractional volume occupancy is attained. As the desired final fractional volume occupancy increases, special care must be taken to ensure that steric overlap between adjacent proteins is avoided. Using pre-defined potentials of mean force for interactions between proteins in the box together with Monte Carlo and/or Brownian dynamics simulations, the system is allowed to reach a free energy minimum, i.e., equilibrium. At this point, a number of configurations of the system at its free energy minimum are stored. Then, a single molecule of a particular species of protein or polypeptide, that we refer to as tracer, is placed randomly into one of the stored crowded system equilibrium configurations. Using pre-defined potentials of mean force for each pair of interacting macromolecules, the free energy of interaction between the tracer, summed over all the surrounding protein molecules, is calculated and stored. This procedure is repeated until the quantity e x p U R , Ω / k T R , Ω , averaged over all trials, becomes independent of the number of trials. Then, according to the Widom insertion theorem [60,61], the free energy of insertion (=ln γ t r a c e r ) of the tracer molecule into the crowded medium is given by
e x p ln γ t r a c e r / k T = e x p U R , Ω / k T R , Ω
It is evident that for a detailed definition of U M F R , Ω based on consideration of interactions between individual atoms on molecule i and individual atoms on molecule j, the above procedure is extremely computation-extensive for insertion of a tracer molecule into a crowded fluid of fixed volume fraction, even if efficient computational shortcuts are devised. Using this approach together with an atomistically-detailed semi-empirical PMF, Zhou and coworkers have calculated the free energy of transfer of a molecule of several tracer proteins as functions of the concentration of the same or other proteins [58,59]. Adjustment of empirical parameters in the pre-defined potentials of mean force were used to achieve reasonable agreement with experimental measurements of two-body interaction coefficients obtained from osmotic pressure measurements and an experimentally measured binodal for liquid–liquid phase separation [58].
In contrast, applying the Widom insertion theorem to calculate insertion free energies in mesoscopic models with angle-independent potentials of mean force between spherical representations of globular proteins is conceptually simple and far less computationally intensive [62]. This has been performed for fluids of up to three different spherical species of varying sizes interacting via six different square-well interactions, i.e., U 11 , U 12 , U 13 , U 22 , U 23 , and U 33 . It was found that the results of these simulations, which yielded the dependence of ln γ 1 , ln γ 2 , and ln γ 3 upon composition in mixtures of all three species for each set of the potential parameters r 2 / r 1 , r 3 / r 1 , ε i j , and L i j , could be accounted for semiquantitively over a range of total fractional volume occupancy up to more than 0.2 by a relatively simple set of analytical expressions that depend only upon the above parameter values [62]. Use of these expressions permitted qualitative exploration of the effect of parameter variation upon observable properties of solutions of one or two globular protein species [63,64,65]. Some examples of calculated concentration-dependent properties in a solution of one macrosolute are compared with experimental observations in Figure 8.
Panels A and B: Curves calculated using an extended square-well potential with L = 1.5 and ε / k T = 0 (black), −0.55 (blue), −0.7 (red) and −0.85 (cyan). Panel C: Calculated binodal for L = 1.5 and varying values of ε / k T . Panel D: concentration-dependent light scattering of α crystallin [66]. Panel E: Symbols are measured concentration-dependent osmotic pressure of IgG [67]. Solid curve is calculated dependence for a hard sphere of equal volume without attractive self-interaction, plotted for comparison to data. Panel F: Scaled binodals measured for several globular proteins, reproduced from [68] with permission. Panels A–C modified from [63].
The highly simplified square-well PMF cannot be expected to provide quantitative estimates of intermolecular interactions in highly crowded solutions of real proteins. However, the ability to formulate approximate analytical expressions for the thermodynamic activity of each globular macrosolute species, dilute as well as concentrated, in a fluid of multiple globular macrosolutes enables the investigator to rapidly explore the qualitative consequences of variation in the excluded volume and soft-interaction components of macromolecular interaction upon the colligative properties and the equilibria of chemical reactions between macrosolutes in such solutions, as exemplified in refs [63,64].

5. Conclusions: Recommendations for Advancement in the Quantitative Characterization of Nonspecific Interactions

Experimental. Measurements of the composition dependence of colligative properties of solutions containing two macrosolute species should be extended to higher total macrosolute concentrations and mixtures containing several different mass or mole fractions of each species. More studies should be carried out aimed at quantitative characterization of self- and hetero-interactions of globular and flexible macrosolutes, including IDPs, nucleic acids, and carbohydrates, as all of these are likely to contribute significantly to the composition of many biological fluids.
Theory/simulation. No matter how rapidly computation of interaction between macromolecules can be carried out, whether by improvements in algorithms or hardware, the quantitative and even the qualitative reliability of the result will depend, in the end, on the realism (or lack of realism) of the potential functions used to calculate intermolecular interaction energies. A quantum jump from simplistic PMFs such as the isotropic SW to a fully atomistic description of interactions between a variety of macrosolutes does not seem to be conducive to further progress. Even when adjusted to agree with very limited data applying only to self-interactions––such as second osmotic virial coefficients––most of the parameters found in these semi-empirical PMFs are extremely unlikely to apply globally to the different types of macrosolutes listed above, and especially to mixtures of these different types.
A bottom-up approach to improvement in the quantitative specification of PMFs acting between various macrosolutes in mixtures via computer simulation is strongly recommended. Optimally, one would begin by addition of coarse-grained models for each element of complexity. For example, for structured macrosolutes, steric repulsion might be modeled by the scaled particle theory of mixtures of convex particles [69]. Intermolecular electrostatic interaction might be modeled using multipole moments derived from an actual [70] or equivalent [71] distribution of charges within each of the interacting macrosolute molecules. Study of these more complex but still low-resolution models and comparison with experimental data will provide guidance for improvement of PMF functions and the addition of structural detail where necessary, such as the representation of highly anisometric macromolecules by structured assemblies of beads [72,73]. Less coarsely grained models such as these explicitly take into account the essential dependence of intermolecular interaction upon macrosolute shape, pH, and ionic strength without excessive computational burden or proliferation of adjustable semi-empirical parameters. The bottom-up approach thus provides a gradual and systematic pathway toward a fully atomistic description of non-specific interactions between macrosolutes.
The next step toward achieving a realistic simulation of physiological fluids requires taking account of hetero-interactions between multiple types of macrosolutes. In order to examine the global applicability of model parameters, simulations should be extended to solutions containing two macrosolute species, and attempts should be made to optimize agreement with the results of experimental measurements such as those referenced in Table 1. It should be noted that the results provided by these references depend strongly upon experimental conditions such as pH, temperature, salinity, and the composition of small solutes.
Finally, it must be recognized that when one or both of the interacting molecules are flexible (e.g., carbohydrates or nucleic acids) or partly disordered (e.g., IDPs), intermolecular interactions are even more computationally intensive to analyze. It has been theoretically and experimentally found that both intermolecular and intramolecular interactions are composition-dependent [74,75], and thus simulations directed toward minimization of total system free energy must incorporate PMFs for intramolecular as well as intermolecular interactions. An early heuristic attempt to incorporate both contributions to the composition dependence of the total free energy of interaction between polymers [30] is of qualitative interest, but necessarily rudimentary and of extremely low resolution.

Funding

Intramural Research Program of the National Institute of Diabetes and Digestive and Kidney Diseases, NIH.

Data Availability Statement

No original data in this publication

Acknowledgments

The author thanks Peter McPhie (NIDDK-NIH) and Germán Rivas (CIB-CSIC) for helpful comments on an early draft of this report.

Conflicts of Interest

The author declare no conflict of interest.

Appendix A

Derivatives of Δ F i t r a n s f e r c M , c S , T = R T ln γ i c M , c S , T with respect to the concentration of each macrosolute in a mixture of two macrosolutes.
The following relations may be obtained by calculating the concentration derivatives of text Equation (1), noting that the values of each of the interaction coefficients are independent of the order of the subscripts: B i j = B j i and B i j k = B i k j = B j i k = B j k i = B k i j = B k j i .
𝜕 ln γ i 𝜕 c 1 = B i 1 + 2 B i 11 c 1 + 2 B i 12 c 2
ζ i 1 c 1 𝜕 ln γ i 𝜕 c 1 = B i 1 c 1 + 2 B i 11 c 1 2 + 2 B i 12 c 1 c 2
𝜕 ln γ i 𝜕 c 2 = B i 2 + 2 B i 22 c 2 + 2 B i 12 c 1
ζ i 2 c 2 𝜕 ln γ i 𝜕 c 2 = B i 2 c 2 + 2 B i 22 c 2 2 + 2 B i 12 c 1 c 2
The reader may readily confirm that
𝜕 ln γ i 𝜕 c j = 𝜕 ln γ j 𝜕 c i
And
ζ i j w j 𝜕 ln γ i 𝜕 w j = c i 𝜕 ln γ i 𝜕 c j

References

  1. Rivas, G.; Minton, A.P. Influence of Nonspecific Interactions on Protein Associations: Implications for Biochemistry In Vivo. Annu. Rev. Biochem. 2022, 91, 321–351. [Google Scholar] [CrossRef] [PubMed]
  2. Phizicky, E.M.; Fields, S. Protein-protein interactions: Methods for detection and analysis. Microbiol. Rev. 1995, 59, 94–123. [Google Scholar] [CrossRef] [PubMed]
  3. Schwikowski, B.; Uetz, P.; Fields, S. A network of protein-protein interactions in yeast. Nat. Biotechnol. 2000, 18, 1257–1261. [Google Scholar] [CrossRef]
  4. Rivas, G.; Minton, A.P. Toward an understanding of biochemical equilibria within living cells. Biophys. Rev. 2017, 10, 241–253. [Google Scholar] [CrossRef]
  5. Cantor, C.R.; Schimmel, P.R. Biophysical Chemistry Part III: The Behavior of Biological Macromolecules; W. H. Freeman: San Francisco, CA, USA, 1980; p. 1371. [Google Scholar]
  6. Tanford, C. Physical Chemistry of Macromolecules; Wiley & Sons: New York, NY, USA, 1963; p. 710. [Google Scholar]
  7. Minton, A.P. Molecular crowding: Analysis of effects of high conceentrations of inert cosolutes on biochemical equilibria and rates in terms of volume exclusion. Methods Enzymol. 1998, 295, 127–149. [Google Scholar] [PubMed]
  8. Pasquier, C.; Midtgaard, S.R.; Polimeni, M.; Jorgensen, C.I.; Arleth, L.; Callisen, T.H.; Lund, M. Anisotropic protein-protein interactions in dilute and concentrated solutions. J. Colloid Interface Sci. 2023, 629, 794–804. [Google Scholar] [CrossRef]
  9. Laurent, T.C. Enzyme reactions in polymer media. Eur. J. Biochem. 1971, 21, 498–506. [Google Scholar] [CrossRef]
  10. Minton, A.P. Excluded volume as a determinant of protein structure and stability. Biophys. J. 1980, 32, 77–79. [Google Scholar] [CrossRef]
  11. McMillan, W.G., Jr.; Mayer, J.E. The statistical thermodynamics of multicomponent systems. J. Chem. Phys. 1945, 13, 276–305. [Google Scholar] [CrossRef]
  12. Velev, O.D.; Kaler, E.W.; Lenhoff, A.M. Protein interactions in solution characterized by light and neutron scattering: Comparison of lysozyme and chymotrypsinogen. Biophys. J. 1998, 75, 2682–2697. [Google Scholar] [CrossRef]
  13. Stradner, A.; Cardinaux, F.; Schurtenberger, P. A small-angle scattering study on equilibrium clusters in lysozyme solutions. J. Phys. Chem. B 2006, 110, 21222–21231. [Google Scholar] [CrossRef] [PubMed]
  14. Blanco, M.A.; Perevozchikova, T.; Martorana, V.; Manno, M.; Roberts, C.J. Protein-Protein Interactions in Dilute to Concentrated Solutions: α-Chymotrypsinogen in Acidic Conditions. J. Phys. Chem. B 2014, 118, 5817–5831. [Google Scholar] [CrossRef]
  15. Petsev, D.N.; Wu, X.; Galkin, O.; Vekilov, P.G. Thermodynamic functions of concentrated protein solutions from phase equilibri. J. Phys. Chem. B 2003, 107, 3921–3926. [Google Scholar] [CrossRef]
  16. Adair, G.S. A theory of partial osmotic pressures and membrane equilibria, with special reference to the application of Dalton’s law to haeoglobin solutions in the presence of salts. Proc. R. Soc. Lond. Ser. A 1928, 120, 573–603. [Google Scholar]
  17. Briehl, R.W.; Ewert, S. Effects of pH, 2,3-diphosphoglycerate and salts on gelation of sickle cell hemoglobin. J. Mol. Biol. 1973, 80, 445–458. [Google Scholar] [CrossRef]
  18. Ross, P.D.; Briehl, R.W.; Minton, A.P. Temperature dependence of nonideality in concentrated solutions of hemoglobin. Biopolymers 1978, 17, 2285–2288. [Google Scholar] [CrossRef] [PubMed]
  19. Ross, P.D.; Minton, A.P. Analysis of non-ideal behavior in concentrated hemoglobin solutions. J. Mol. Biol. 1977, 112, 437–452. [Google Scholar] [CrossRef]
  20. Williams, R.C., Jr. Concerted formation of the gel of hemoglobin S. Proc. Natl. Acad. Sci. USA 1973, 70, 1506–1508. [Google Scholar] [CrossRef]
  21. Fodeke, A.A.; Minton, A.P. Quantitative characterization of temperature-independent and temperature-dependent protein-protein interactions in highly nonideal solutions. J. Phys. Chem. B 2011, 115, 11261–11268. [Google Scholar] [CrossRef]
  22. Minton, A.P.; Lewis, M.S. Self-association in highly concentrated solutions of myoglobin: A novel analysis of sedimentation equilibrium of highly nonideal solutions. Biophys. Chem. 1981, 14, 317–324. [Google Scholar] [CrossRef]
  23. Rivas, G.; Fernandez, J.A.; Minton, A.P. Direct observation of the self-association of dilute proteins in teh presence of inert macromolecules at high concentration via tracer sedimentation equilibrium: Theory, experiment, and biological significance. Biochemistry 1999, 38, 9379–9388. [Google Scholar] [CrossRef] [PubMed]
  24. Minton, A.P. The effect of volume occupancy upon the thermodynamic activity of proteins: Some biochemical consequences. Mol. Cell. Biochem. 1983, 55, 119–140. [Google Scholar] [CrossRef] [PubMed]
  25. Fodeke, A.A.; Minton, A.P. Quantitative characterization of polymer-polymer, protein-protein, and polymer-protein interaction via tracer sedimentation equilibrium. J. Phys. Chem. B 2010, 114, 10876–10880. [Google Scholar] [CrossRef]
  26. Wu, J.Z.; Prausnitz, J.M. Osmotic pressures of aqueous bovine serum albumin solutions at high ionic strength. Fluid Phase Equilibria 1999, 155, 139–154. [Google Scholar] [CrossRef]
  27. Atha, D.H.; Ingham, K.C. Mechanism of precipitation of proteins by poyethylene glycols. J. Biol. Chem. 1981, 256, 12108–12117. [Google Scholar] [CrossRef]
  28. Fodeke, A.A. Quantitative characterization of non-specific interactin of two globular proteins with Dextran T70 in a binary mixture. Eur. Biophys. J. 2024, 53, 465–472. [Google Scholar] [CrossRef]
  29. Wu, D.; Minton, A.P. Quantitative characteriation of nonspeific self- and hetero-interactions of proteins in nonideal solutions via static light scattering. J. Phys. Chem. B 2015, 119, 1891–1898. [Google Scholar] [CrossRef] [PubMed]
  30. Fernández, C.; Fodeke, A.A.; Minton, A.P. Quantitative characterization of the concentration-dependent interaction between molecules of Dextran 70 in aqueous solution: Measurement and analysis in the context of thermodynamic and compressible sphere models. Biopolymers 2019, 110, e23284. [Google Scholar] [CrossRef]
  31. Fernández, C.; Minton, A.P. Static light scattering from concentrated protein solutions II: Experimental test of theory for protein mixtures and weakly self-associating proteins. Biophys. J. 2009, 96, 1992–1998. [Google Scholar] [CrossRef]
  32. Fodeke, A.A. Quantitative characterization of temperature-independent polymer-polymer interaction and temperature-dependent protein-protein and protein-polymer interactions in concentrated polymer solutions. Eur. Biophys. J. 2019, 48, 189–202. [Google Scholar] [CrossRef]
  33. Scherer, T.M.; Liu, J.; Shire, S.J.; Minton, A.P. Intermolecular interactions of IgG1 monoclonal antibodies at high concentrations characterized by light scattering. J. Phys. Chem. B 2010, 114, 12948–12957. [Google Scholar] [CrossRef] [PubMed]
  34. Kimball, W.D.; Lanzaro, A.; Hurd, C.; Jhaveri, N.; Huang, J.; Lewandowski, J.; Qian, K.K.; Woldeyes, M.A.; Majumdar, R.; Witek, M.A.; et al. Growth of Clusters toward Liquid-Liquid Phase Separation of Monoclonal Antibodies as Characterized by Small-Angle X-ray Scattering and Molecular Dynamics Simulation. J. Phys. Chem. B 2025, 129, 2856–2871. [Google Scholar] [CrossRef] [PubMed]
  35. Lilyestrom, W.G.; Yadav, S.; Shire, S.J.; Scherer, T.M. Monoclonal antibody self-association, cluster formation, and rheology at high concentrations. J. Phys. Chem. B 2013, 117, 6373–6384. [Google Scholar] [CrossRef]
  36. Gulotta, A.; Polimeni, M.; Lenton, S.; Starr, C.G.; Stradner, A.; Zaccarelli, E.; Schurtenberger, P. Combining Scattering Experiments and Colloid Theory to Characterize Charge Effects in Concentrated Antibody Solutions. Mol. Pharm. 2024, 21, 2250–2271. [Google Scholar] [CrossRef] [PubMed]
  37. Woldeyes, M.A.; Calero-Rubio, C.; Furst, E.M.; Roberts, C.J. Light Scattering to Quantify Protein-Protein Interactions at High Protein Concentrations. Methods Mol. Biol. 2019, 2039, 23–37. [Google Scholar]
  38. Stradner, A.; Cardinaux, F.; Egelhaaf, S.U.; Schurtenberger, P. Do equilibrium clusters exist in concentrated lysozyme solutions? Proc. Natl. Acad. Sci. USA 2008, 105, E75–E76. [Google Scholar] [CrossRef]
  39. Winzor, D.J.; Wills, P.R. Molecular crowding effects of linear polymers in protein solutions. Biophys. Chem. 2006, 119, 186–195. [Google Scholar] [CrossRef]
  40. Woldeyes, M.A.; Calero-Rubio, C.; Furst, E.M.; Roberts, C.J. Predicting Protein Interactions of Concentrated Globular Protein Solutions Using Colloidal Models. J. Phys. Chem. B 2017, 121, 4756–4767. [Google Scholar] [CrossRef]
  41. Laurent, T.C.; Ogston, A.G. The interaction between polysaccharides and other macromolecules 4. The osmotic pressure of mixtures of serum albumin and hyaluronic acid. Biochem. J. 1963, 89, 249–253. [Google Scholar] [CrossRef]
  42. Madden, M.J.; Ellis, S.N.; Riabtseva, A.; Wilson, A.D.; Cunningham, M.F.; Jessop, P.G. Comparison of vapour pressure osmometry, freezing point osmometry and direct membrane osmometry for determining the osmotic pressure of concentrated solutions. Desalination 2022, 539, 276–305. [Google Scholar] [CrossRef]
  43. Parsegian, V.A.; Rand, R.P.; Fuller, N.L.; Rau, D.C. Osmotic stress for the direct measurement of intermolecular forces. Methods Enzymol. 1986, 127, 400–416. [Google Scholar] [PubMed]
  44. Jiménez, M.; Rivas, G.; Minton, A.P. Quantitative characterization of weak self-association in concentrated solutions of immunoglobulin G via the measurement of sedimentation equilibrium and osmotic pressure. Biochemistry 2007, 46, 8373–8378. [Google Scholar] [CrossRef] [PubMed]
  45. Kanal, K.M.; Fullerton, G.D.; Cameron, I.L. A study of the molecular sources of nonideal osmotic pressure of bovine serum albumin solutions as a function of pH. Biophys. J. 1994, 66, 153–160. [Google Scholar] [CrossRef] [PubMed]
  46. Minton, A.P. A molecular model for the dependence of the osmotic pressure of bovine serum albumin upon concentration and pH. Biophys. Chem. 1995, 57, 65–70. [Google Scholar] [CrossRef]
  47. Minton, A.P. Recent applications of light scattering measurement in the biological and biopharmaceutical sciences. Anal. Biochem. 2016, 501, 4–22. [Google Scholar] [CrossRef]
  48. Wyatt, P.J. Light scattering and the absolute characterization of macromolecules. Anal. Chim. Acta 1993, 272, 1–40. [Google Scholar] [CrossRef]
  49. Minton, A.P. Static light scattering from concentrated protein solutions, I: General theory for protein mixtures and application to self-associating proteins. Biophys. J. 2007, 93, 1321–1328. [Google Scholar] [CrossRef]
  50. Stockmayer, W.H. Light scattering in multi-component systems. J. Chem. Phys. 1950, 18, 58–61. [Google Scholar] [CrossRef]
  51. Stacey, K.A. Light-Scattering in Physical Chemistry; Academic Press: New York, NY, USA, 1956; p. 230. [Google Scholar]
  52. Teller, D.C. Characterization of proteins by sedimentation equilibrium in the analytical ultracentrifuge. Methods Enzymol. 1973, 27, 346–441. [Google Scholar]
  53. Zorrilla, S.; Jiménez, M.; Lillo, P.; Rivas, G.; Minton, A.P. Sedimentation equilibrium in a solution containing an arbitrary number of solute species at arbitrary concentrations: Theory and application to concentrated solutions of ribonuclease. Biophys. Chem. 2004, 108, 89–100. [Google Scholar] [CrossRef]
  54. Rivas, G.; Minton, A.P. Tracer sedimentation equilibrium: A powerful tool for the quantitative characterization of macromolecular self- and hetero-associations in solution. Biochem. Soc. Trans. 2003, 31, 1015–1019. [Google Scholar] [CrossRef] [PubMed]
  55. Rivas, G.; Minton, A.P. Non-ideal tracer sedimentation equilibrium: A powerful tool for the characterization of macromolecular interactions in crowded solutions. J. Mol. Recognit. 2004, 17, 362–367. [Google Scholar] [CrossRef]
  56. Rivas, G.; Minton, A.P. Beyond the second virial coefficient: Sedimentation equilibrium in highly non-ideal solutions. Methods 2011, 54, 167–174. [Google Scholar] [CrossRef] [PubMed]
  57. Nguemaha, V.; Qin, S.; Zhou, H.-X. Transfer free energies of test proteins into crowded protein solutions have simple dependence on crowder concentration. Front. Mol. Biosci. 2019, 6, 39. [Google Scholar] [CrossRef]
  58. Qin, S.; Zhou, H.X. Fast method for computing chemical potentials and liquid-liquid phase equilibria for macromolecular solutions. J. Phys. Chem. B 2016, 120, 8164–8174. [Google Scholar] [CrossRef] [PubMed]
  59. Qin, S.; Zhou, H.X. Further Development of the FFT-based Method for Atomistic Modeling of Protein Folding and Binding under Crowding: Optimization of Accuracy and Speed. J. Chem. Theory Comput. 2014, 10, 2824–2835. [Google Scholar] [CrossRef]
  60. Widom, B. Some topics in the theory of fluids. J. Chem. Phys. 1963, 39, 2808–2812. [Google Scholar] [CrossRef]
  61. Binder, K. Applications of Monte Carlo methods to statistical physics. Rep. Prog. Phys. 1997, 60, 487–559. [Google Scholar] [CrossRef]
  62. Hoppe, T.; Minton, A.P. Incorporation of hard and soft protein-protein interactions into models for crowding effects in binary and ternary protein mixtures. Comparison of approximate analytical solutions with numerical simulation. J. Phys. Chem. B 2016, 120, 11866–11872. [Google Scholar] [CrossRef]
  63. Hoppe, T.; Minton, A.P. Non-specific Interactions Between Macromolecular Solutes in Concentrated Solution: Physico-Chemical Manifestations and Biochemical Consequences. Front. Mol. Biosci. 2019, 6, 10. [Google Scholar] [CrossRef]
  64. Minton, A.P. Explicit Incorporation of Hard and Soft Protein-Protein Interactions into Models for Crowding Effects in Protein Mixtures. 2. Effects of Varying Hard and Soft Interactions upon Prototypical Chemical Equilibria. J. Phys. Chem. B 2017, 121, 5515–5522. [Google Scholar] [CrossRef] [PubMed]
  65. Minton, A.P. Simple Calculation of Phase Diagrams for Liquid-Liquid Phase Separation in Solutions of Two Macromolecular Solute Species. J. Phys. Chem. B 2020, 124, 2363–2370. [Google Scholar] [CrossRef]
  66. Xia, J.-Z.; Wang, Q.; Tatarkova, S.; Aerts, T.; Clauwaert, J. Structural basis of eye lens transpareny: Light scattering by concentrated solutions of bovine α-crystallin proteins. Biophys. J. 1996, 71, 2815–2822. [Google Scholar] [CrossRef] [PubMed]
  67. Yousef, M.A.; Datta, R.; Ridgers, V.G. Free-solvent model of osmotic pressure revisited: Application to concentrated IgG solution under physiological conditions. J. Coll. Interf. Sci. 1998, 197, 108–118. [Google Scholar] [CrossRef]
  68. Reiche, K.; Hartl, J.; Blume, A.; Garidel, P. Liquid-liquid phase separation of a monoclonal antibody at low ionic strength: Influence of anion charge and concentration. Biophys. Chem. 2017, 220, 7–19. [Google Scholar] [CrossRef] [PubMed]
  69. Boublík, T. Statistical thermodynamics of convex molecule fluids. Mol. Phys. 1974, 27, 1415–1427. [Google Scholar] [CrossRef]
  70. Lund, M. Anisotropic protein-protein interactions due to ion binding. Colloids Surf. B-Biointerfaces 2016, 137, 17–21. [Google Scholar] [CrossRef]
  71. Hoppe, T. A simplified representation of anisotroic charge distributions within proteins. J. Chem. Phys. 2013, 138, 174110. [Google Scholar] [CrossRef]
  72. Grünberger, A.; Lai, P.-K.; Blanco, M.A.; Roberts, C.J. Coarse-grained modeling of protein second osmotic virial coefficients: Sterics and short-ranged attractions. J. Phys. Chem. B 2012, 117, 763–770. [Google Scholar] [CrossRef]
  73. Calero-Rubio, C.; Saluja, A.; Roberts, C.J. Coarse-Grained Antibody Models for “Weak” Protein-Protein Interactions from Low to High Concentrations. J. Phys. Chem. B 2016, 120, 6592–6605. [Google Scholar] [CrossRef]
  74. Le Coeur, C.; Teixeira, J.; Busch, P.; Longeville, S. Compression of random coils due to macromolecular crowding: Scaling effects. Phys. Rev. E Stat. Nonlin Soft Matter Phys. 2010, 81, 061914. [Google Scholar] [CrossRef] [PubMed]
  75. Minton, A.P. Models for excluded volume interaction between an unfolded protein and rigid macromolecular cosolutes: Macromolecular crowding and protein stability revisited. Biophys. J. 2005, 88, 971–985. [Google Scholar] [CrossRef] [PubMed]
Figure 1. Noncovalent interactions between biological molecules, ranked in order of free energy of interaction. Figure reproduced from [4] with permission.
Biophysica 05 00025 g001
Figure 2. Equilibrium association of two monomeric macromolecules to form a heterodimer in ideal solution (top row) and in a crowded solution (bottom row). Figure modified from [4].
Biophysica 05 00025 g002
Figure 3. (A,B) Results of the analysis of osmotic pressure data described in the text. Panel (A) is reproduced from [46] with permission.
Biophysica 05 00025 g003
Figure 4. (A) Relative scattering of mixtures of hen egg ovomucoid (ovo) and ribonuclease (RNase) plotted as total w/v concentration and mass fraction of ovomucoid. Points: experimental data. Curves: functions calculated using the best-fit parameters obtained via global non-linear least squares modeling [29]. (B) Calculated logarithm of the activity coefficients of ovo (blue) and RNase (red) plotted as functions of the w/v concentrations of each macrosolute. Figures reproduced from [29] with permission.
Biophysica 05 00025 g004
Figure 5. Dependence of the apparent buoyant molar mass of dilute labeled Fbg (species 1) in mixtures with unlabeled BSA (species 2) upon BSA concentration in Hepes-EDTA buffer, pH 7.4, at 20 °C. Different symbols plotted for Fbg represent results obtained for different concentrations of Fbg, all ≤1 g/L. Lines indicate the best linear least-squares fits to the data. Figure modified from [23].
Biophysica 05 00025 g005
Figure 6. (A) Points: calculated dependence of ζ 12 and ζ 22 upon the concentration of BSA calculated as described in text. Curves: best fit of cubic polynomials. (B) Dependence of the thermodynamic activity coefficients of dilute fibrinogen (species 1) and BSA upon BSA concentration calculated according to text Equation (5) with the best-fit values of the two-body and three-body interaction coefficients obtained via the modeling shown in panel (A). [The difference between results plotted in Panel (A) of Figure 6 calculated from the best-fit values of the interaction coefficients obtained by modeling the concentration dependence of ζ i j with cubic and quartic polynomials is essentially indistinguishable on the scale of this plot, even though the best-fit values of the four-body and higher-order interaction coefficients differ. This finding indicates that the end result is insensitive to number of terms in the polynomial fit to ζ i j so long as the fit agrees with the “data” to within the uncertainty of the “data”].
Biophysica 05 00025 g006
Figure 7. Solid curve: concentration dependence of ln γ for hemoglobin, calculated via analysis of osmotic pressure and sedimentation equilibrium data as described above in Section 3. Dotted line: calculated via linear extrapolation of the two-body interaction coefficient.
Biophysica 05 00025 g007
Figure 8. Calculated and experimentally observed concentration-dependent light scattering (panels (A,D)), osmotic pressure (panels (B,E)), and liquid–liquid phase separation (panels (C,F)).
Biophysica 05 00025 g008
Table 1. A partial list of references to publications describing experimental quantification of nonspecific self- and hetero-interactions between macromolecules.
Self-Interaction PairsReferencesHetero-Interaction PairsReferences
Hb—Hb[16,17,18,19,20]BSA—ovo[21]
Mb—Mb[22]BSA—Fbg[23]
BSA—BSA[21,23,24,25,26]BSA—SOD[21]
BSA—PEG[27]
BSA—Dex 70[28]
Oval—oval[29]Ovo—oval[29]
Ovo—ovo[21,29]Ovo—RNase[29]
RNase—RNase[29]Oval—RNase[29]
Dex 70—Dex 70[30]BSA—Fic 70[25]
SOD—ovo[21]
Fic 70—Fic 70[25]SOD—Dex 70[31,32]
mAb—mAb[33,34,35,36,37]SOD—Fic 70[32]
Lys—Lys[12,13,15,38]CA—Dex (various MW)[39]
α-chym—α-chym[12,14,40]CytC—Dex (various MW)[39]
BSA—HA[41]
Abbreviations: Hb: hemoglobin (66K); Mb: myoglobin (33K); BSA: bovine serum albumin (68K); -val: ovalbumin (45K); Ovo: ovomucoid (26K); RNase: ribonuclease (17K); Dex 70: Dextran 70 (~70K), Fic 70: Ficoll 70 (~70K); Fbg: fibrinogen (330K); SOD: superoxide dismutatase (28K); mAb: monoclonal antibodies (~150K); Lys: lysozyme (14K); α-chym: α-chymotrypsinogen (26K); CA: carbonic anhydrase (29K); CytC—cytochrome-C (12.3K); PEG: polyethylene glycol (assorted size fractions); BPTI: bovine pancreatic trypsin inhibitor (6.5K); HA: hyaluronic acid (~1500K); mAb: monoclonal antibody (assorted) (~150K).
Disclaimer/Publisher’s Note: The statements, opinions and data contained in all publications are solely those of the individual author(s) and contributor(s) and not of MDPI and/or the editor(s). MDPI and/or the editor(s) disclaim responsibility for any injury to people or property resulting from any ideas, methods, instructions or products referred to in the content.

