
In Silico Design of Novel Piperazine-Based mTORC1 Inhibitors Through DFT, QSAR and ADME Investigations

 , , , and
Abstract
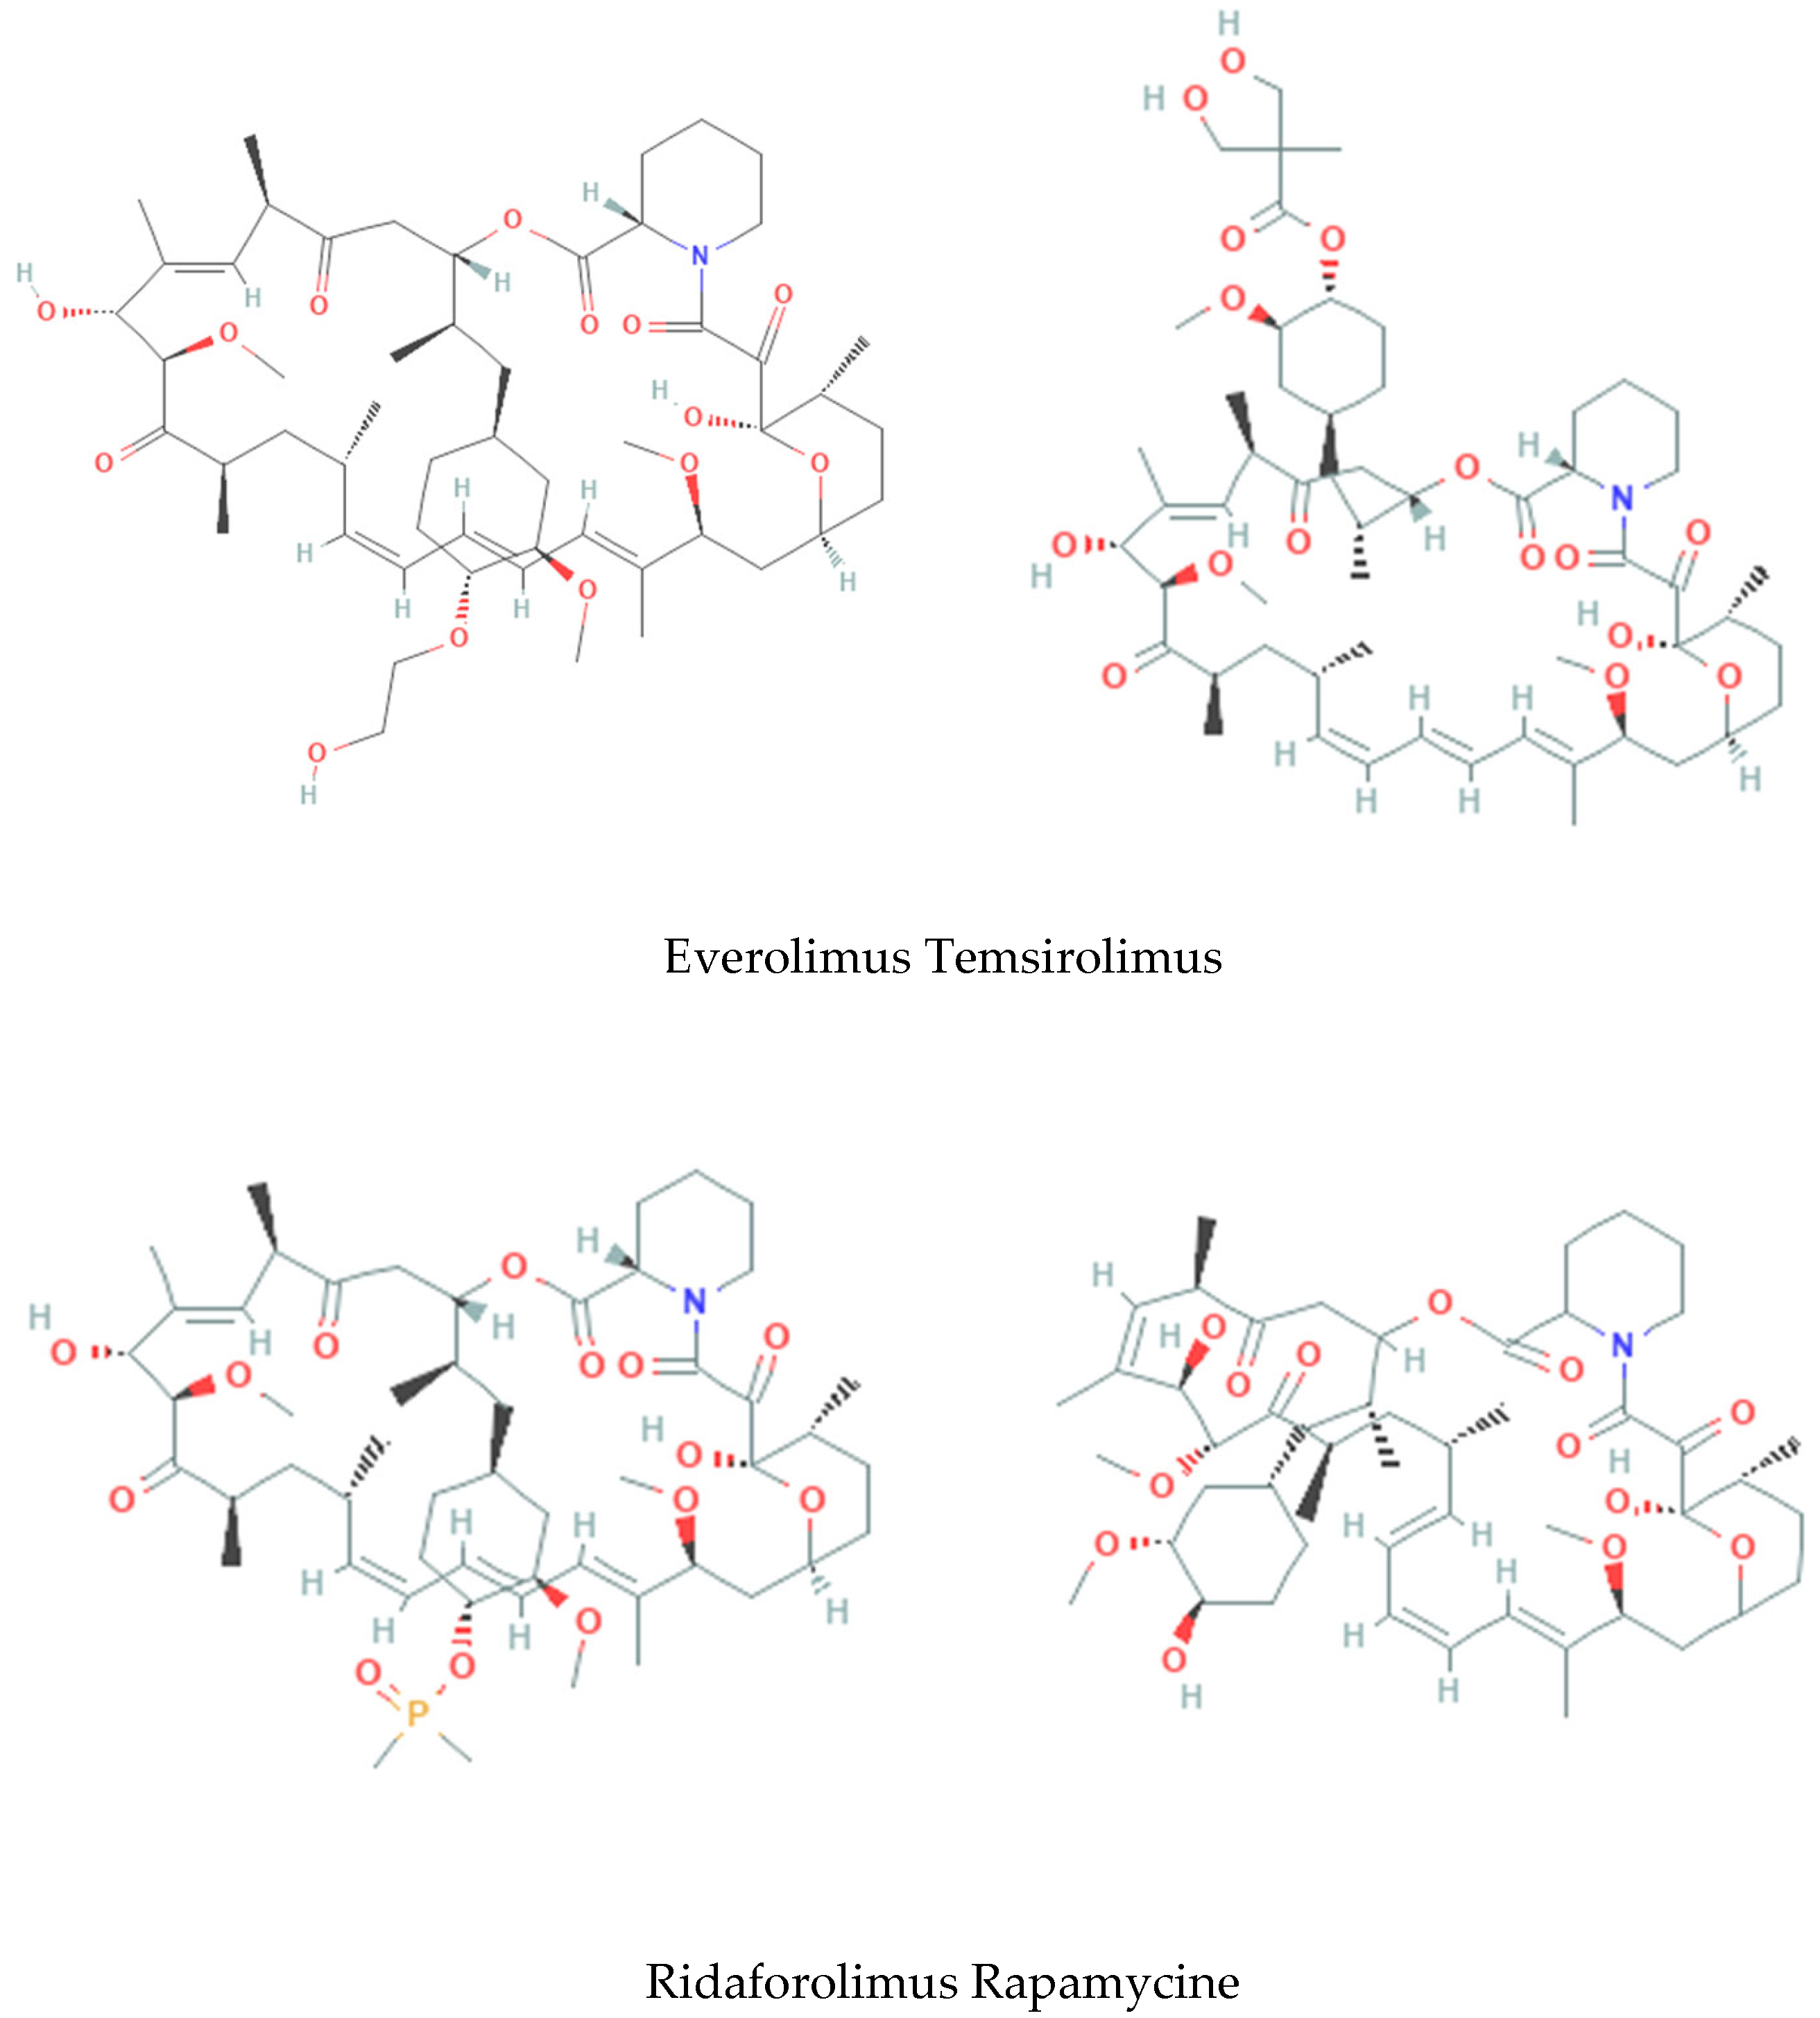
1. Introduction
2. Material and Methods
2.1. Calculation of Molecular Descriptors
2.2. Multiple Linear Regression (MLR)
2.3. Multiple Non-Linear Regression (MNLR)
2.4. Drug-Likeness Properties
3. Results and Discussion
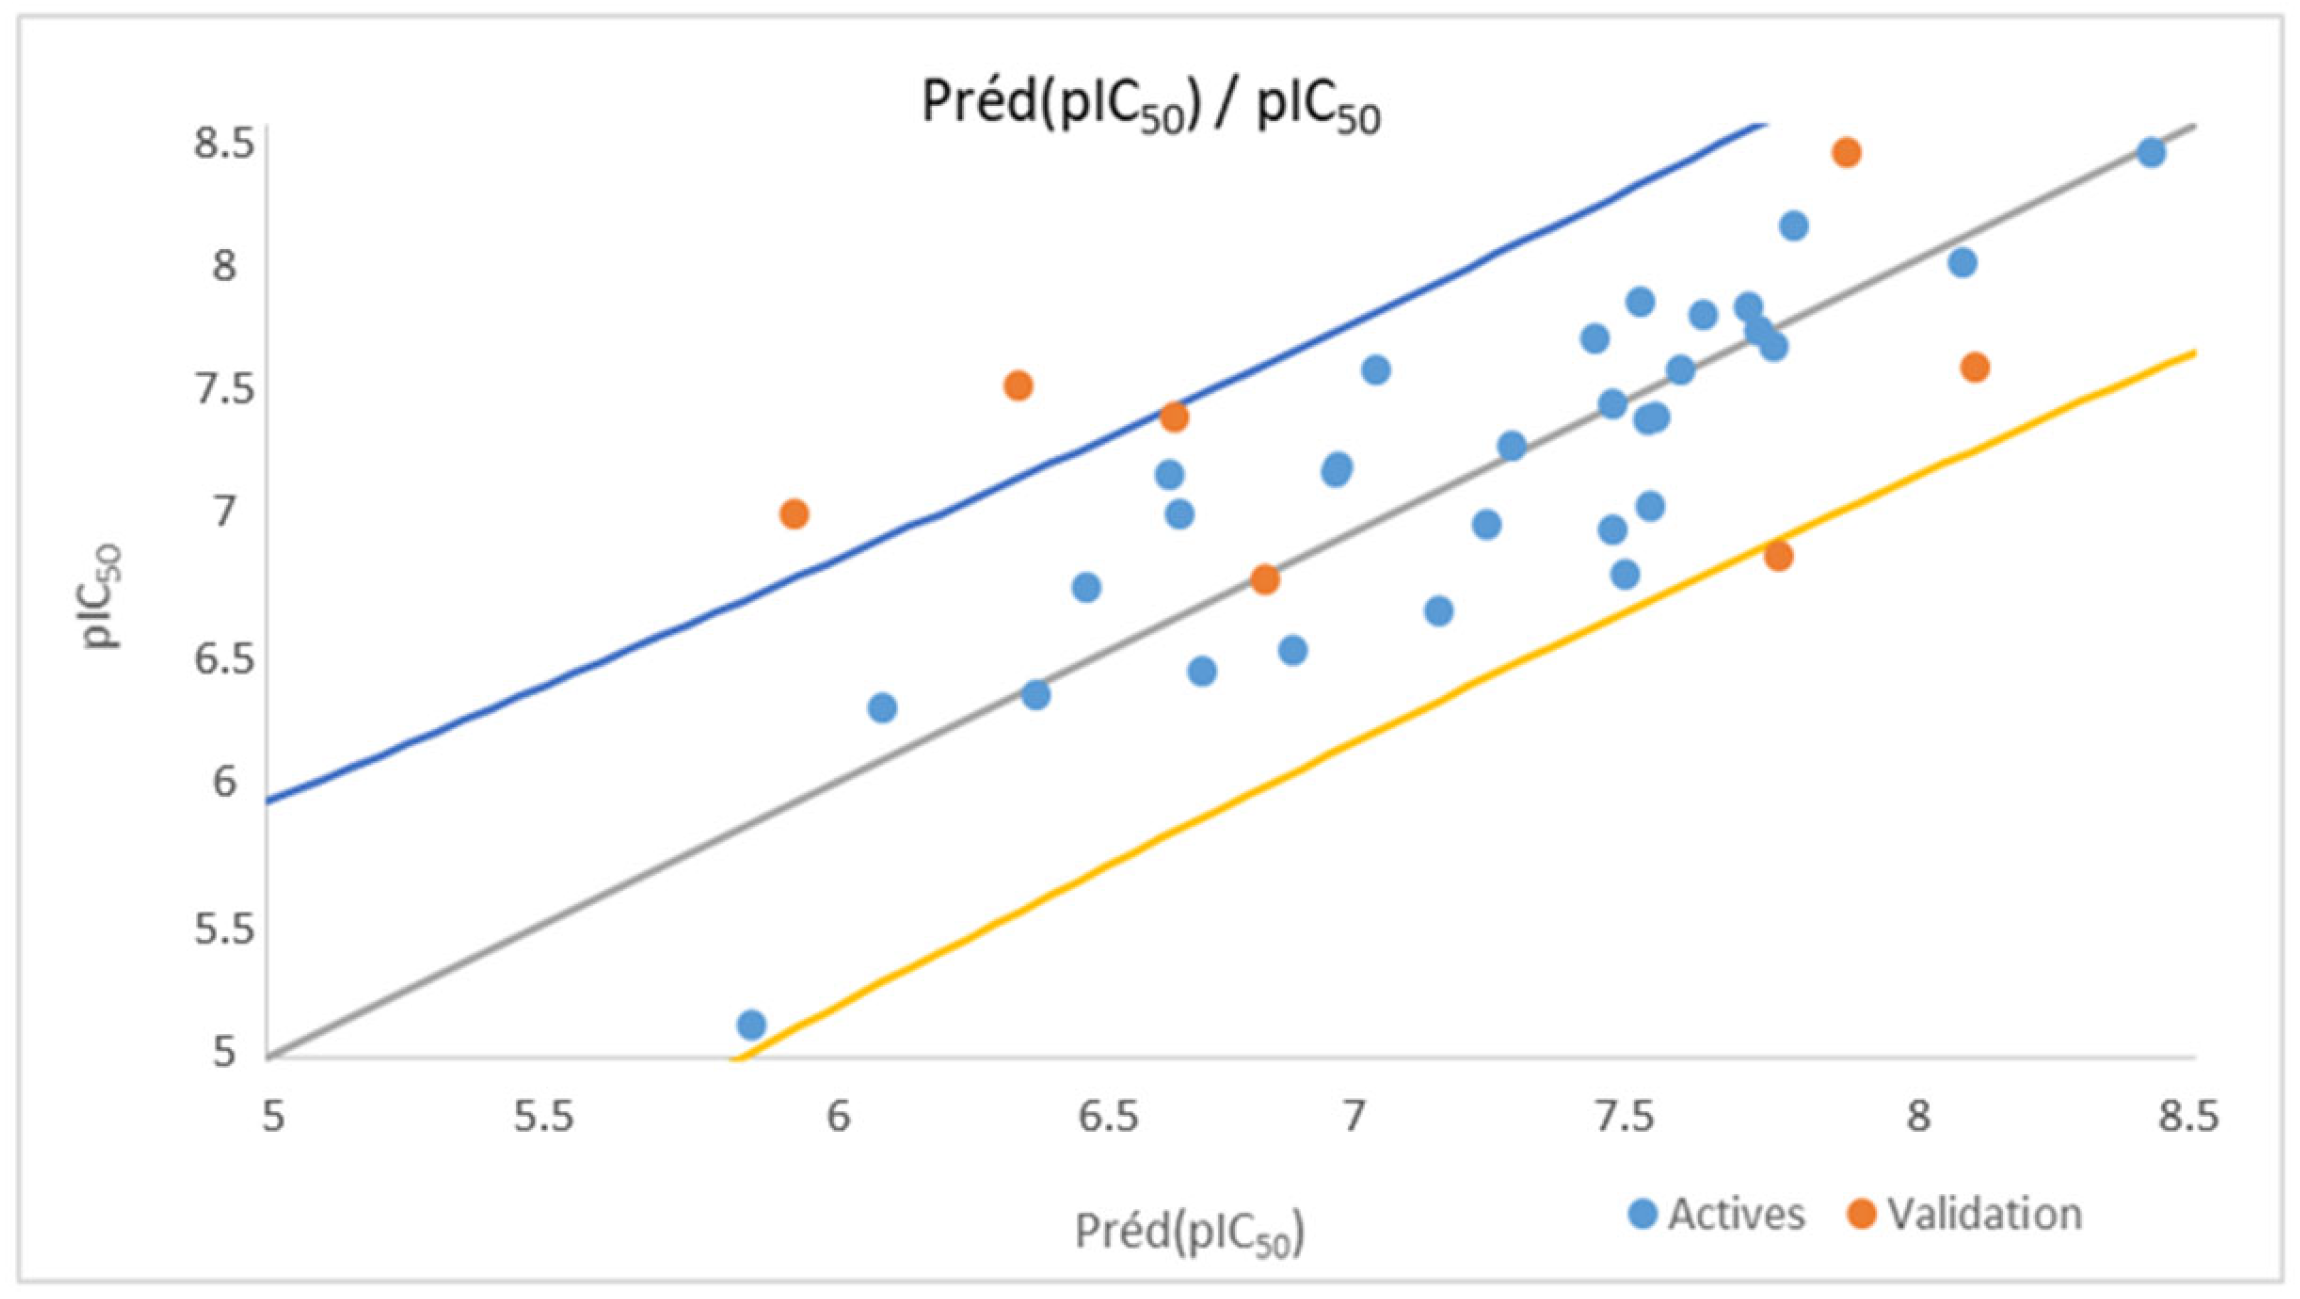
3.1. Multiple Linear Regression
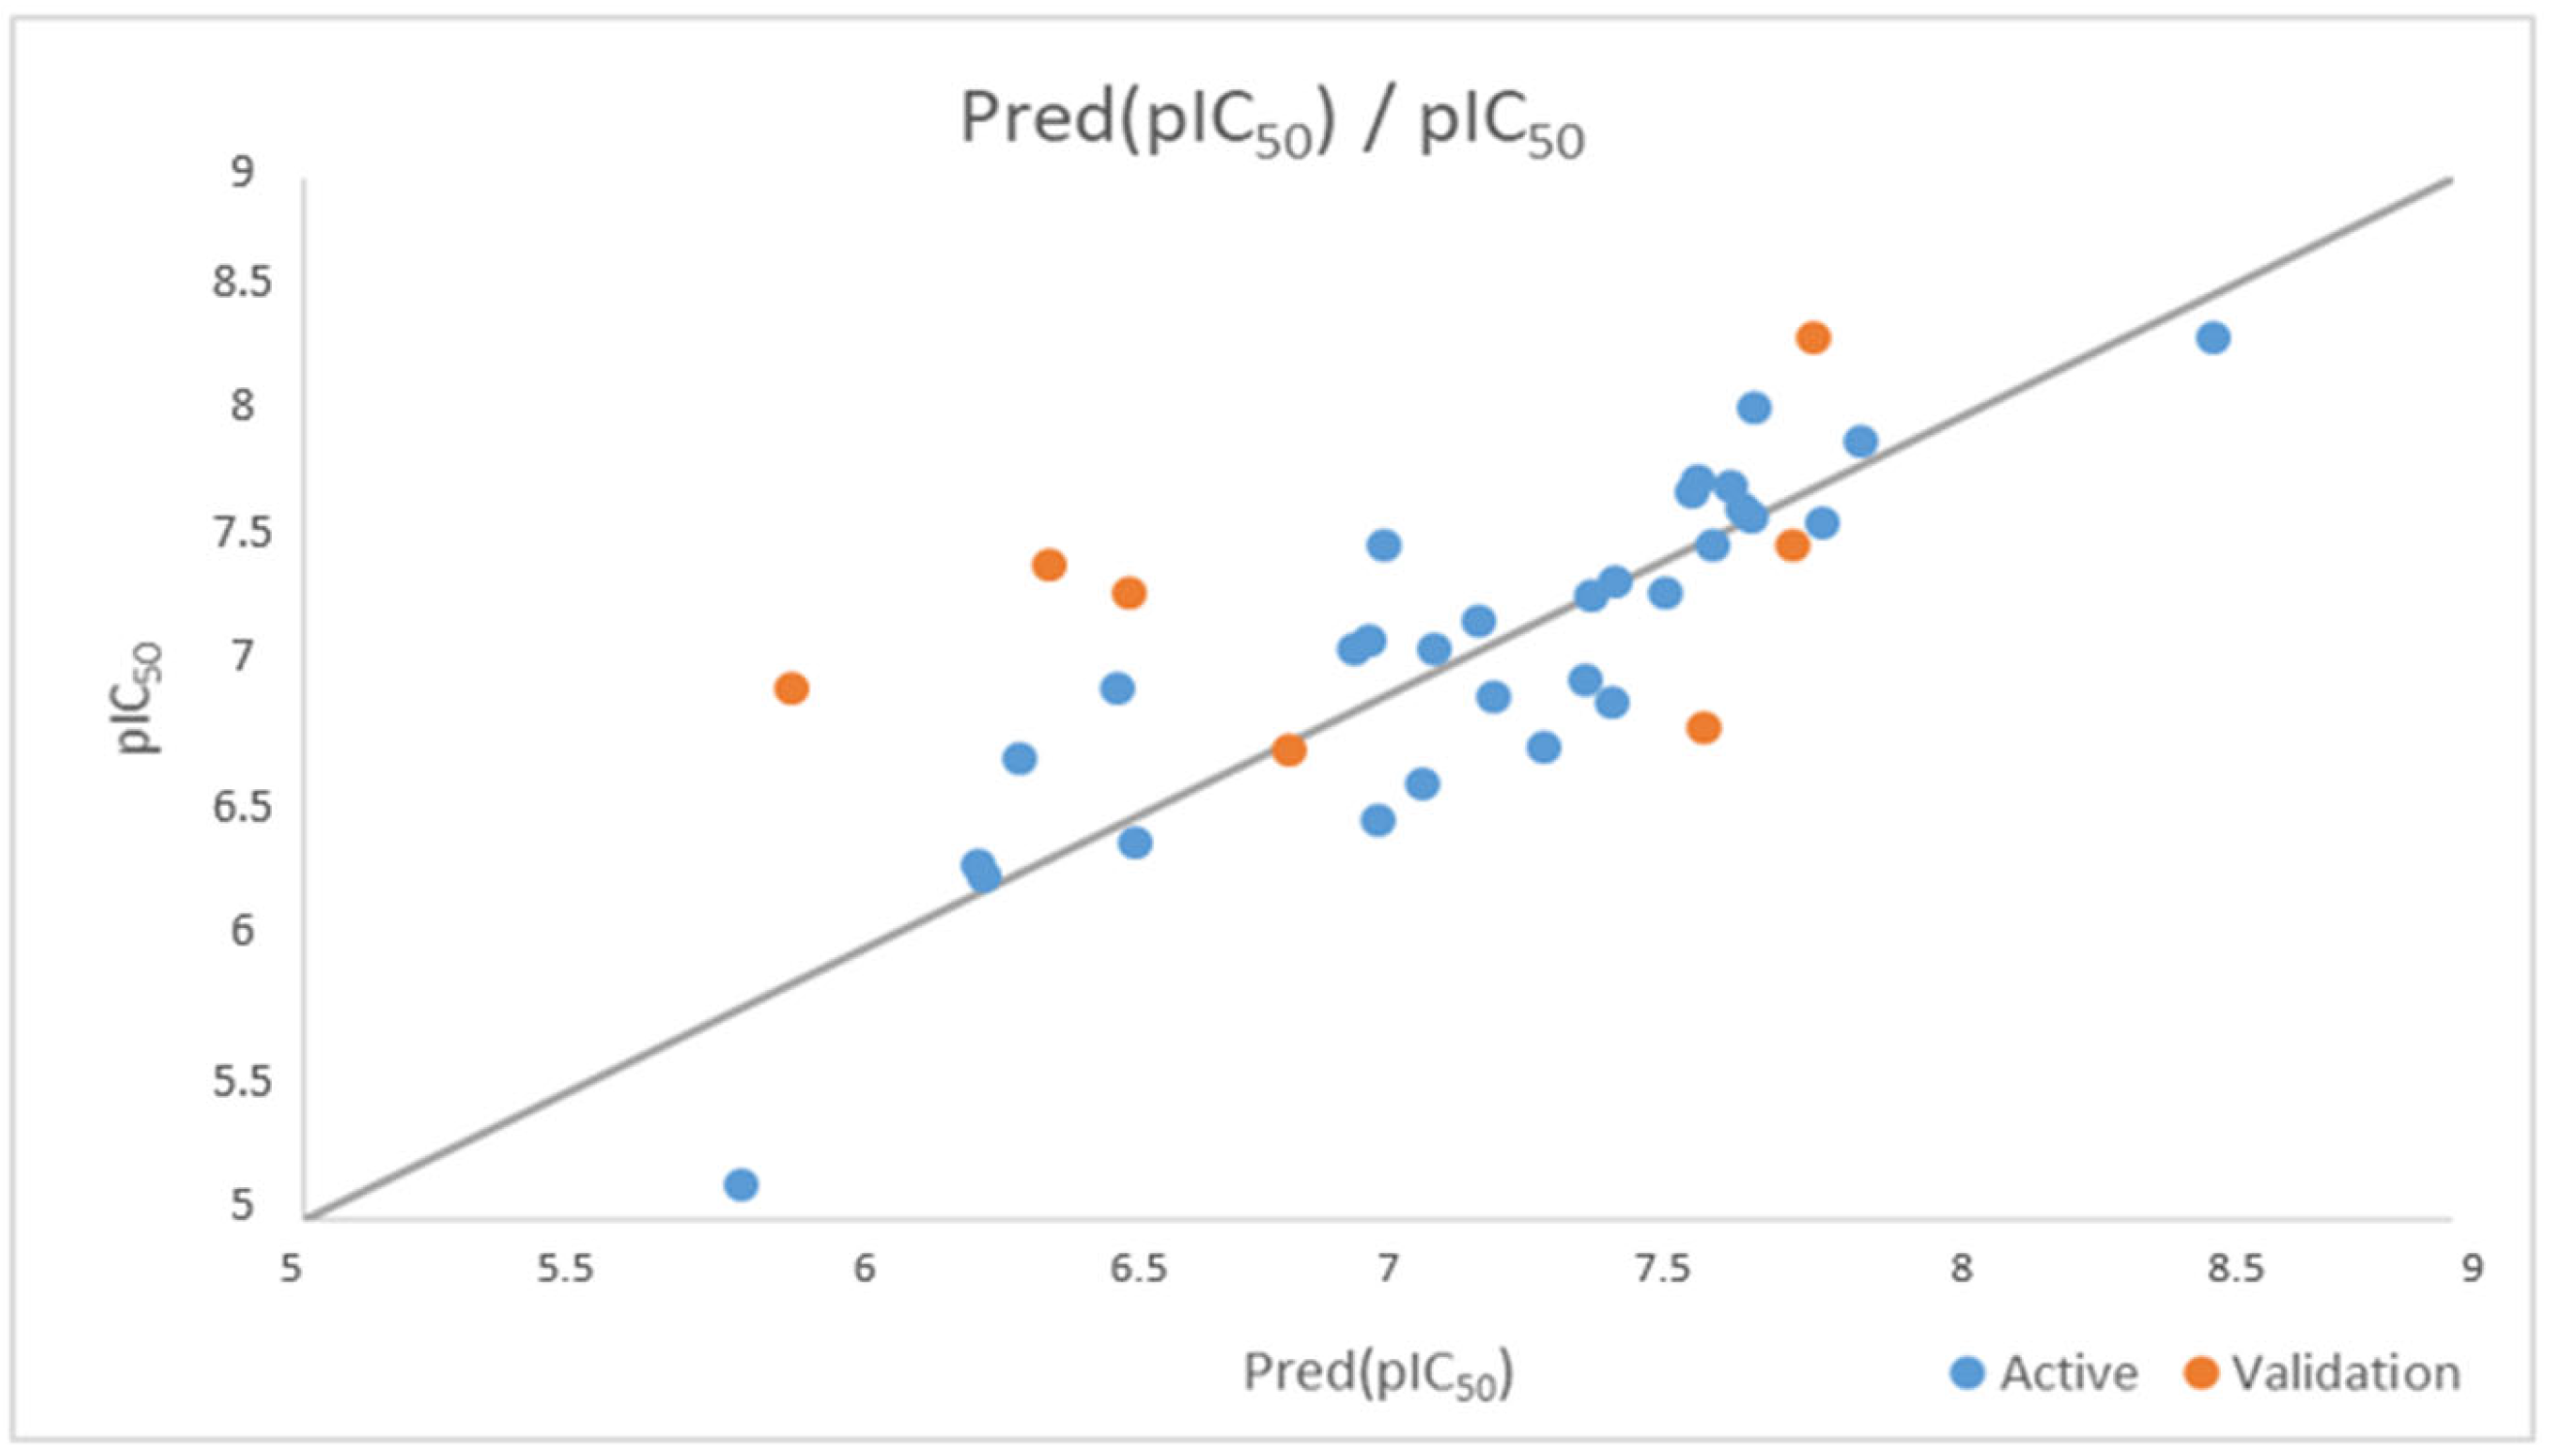
3.2. Multiple Nonlinear Regression
3.3. Y-Randomization Test
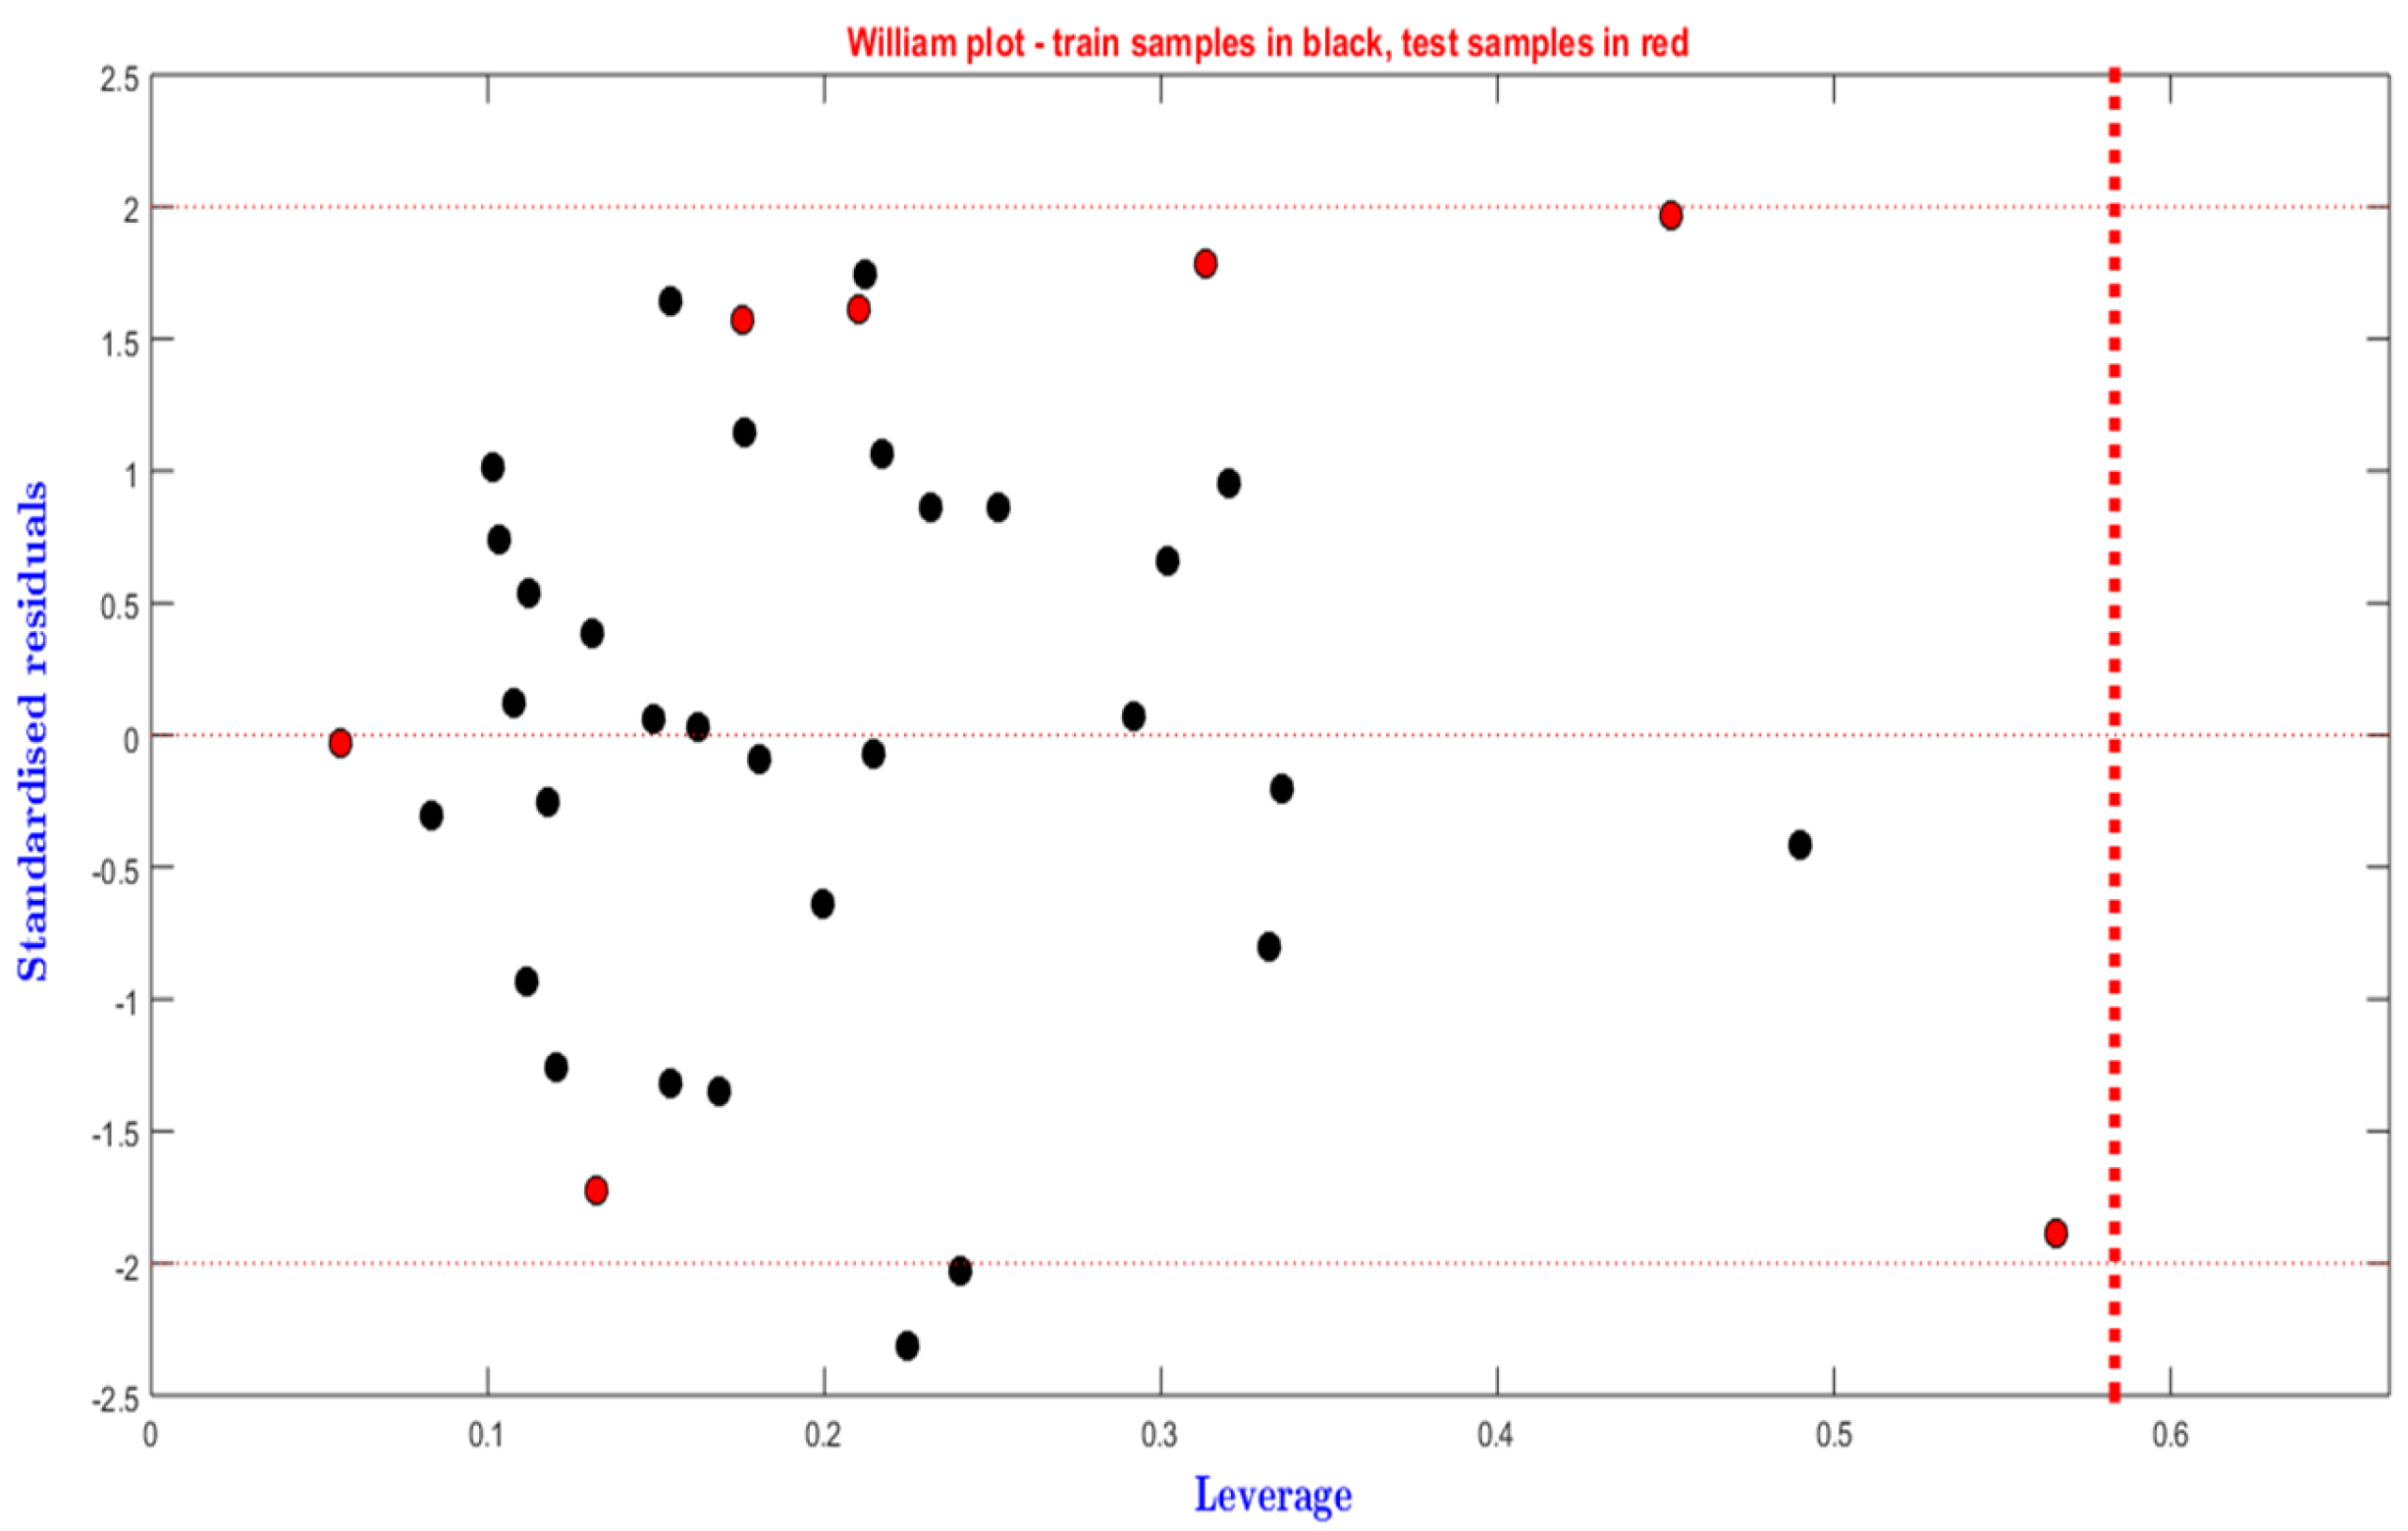
3.4. Applicability Domain
3.5. Identification of Candidate Inhibitors
3.6. Evaluation of Drug-Likeness Properties
4. Conclusions
Author Contributions
Funding
Data Availability Statement
Conflicts of Interest
References
- Stueven, N.A.; Schlaeger, N.M.; Monte, A.P.; Hwang, S.-P.L.; Huang, C.-c. A novel stilbene-like compound that inhibits melanoma growth by regulating melanocyte differentiation and proliferation. Toxicol. Appl. Pharmacol. 2017, 337, 30–38. [Google Scholar] [CrossRef] [PubMed]
- Marra, A.; Ferrone, C.R.; Fusciello, C.; Scognamiglio, G.; Ferrone, S.; Pepe, S.; Perri, F.; Sabbatino, F. Translational research in cutaneous melanoma: New therapeutic perspectives. Anti. Canc. Agents Med. Chem. 2018, 18, 166–181. [Google Scholar] [CrossRef] [PubMed]
- Mioc, M.; Pavel, I.Z.; Ghiulai, R.; Coricovac, D.E.; Farcaş, C.; Mihali, C.-V.; Oprean, C.; Serafim, V.; Popovici, R.A.; Dehelean, C.A. The cytotoxic effects of betulin-conjugated gold nanoparticles as stable formulations in normal and melanoma cells. Front. Pharmacol. 2018, 9, 429. [Google Scholar] [CrossRef] [PubMed]
- Theodosakis, N.; Micevic, G.; Langdon, C.G.; Ventura, A.; Means, R.; Stern, D.F.; Bosenberg, M.W. p90RSK blockade inhibits dual BRAF and MEK inhibitor-resistant melanoma by targeting protein synthesis. J. Invest. Dermatol. 2017, 137, 2187–2196. [Google Scholar] [CrossRef] [PubMed]
- Faes, S.; Demartines, N.; Dormond, O. Resistance to mTORC1 inhibitors in cancer therapy: From kinase mutations to intratumoral heterogeneity of kinase activity. Oxidative Med. Cell. Longev. 2017, 2017, 1726078. [Google Scholar] [CrossRef]
- Brito, A.F.; Moreira, L.K.; Menegatti, R.; Costa, E.A. Piperazine derivatives with central pharmacological activity used as therapeutic tools. Fundam. Clin. Pharmacol. 2019, 33, 13–24. [Google Scholar] [CrossRef]
- Ganesan, A. The impact of natural products upon modern drug discovery. Curr. Opin. Chem. Biol. 2008, 12, 306–317. [Google Scholar] [CrossRef]
- Chaube, U.J.; Rawal, R.; Jha, A.B.; Variya, B.; Bhatt, H.G. Design and development of Tetrahydro-Quinoline derivatives as dual mTOR-C1/C2 inhibitors for the treatment of lung cancer. Bioorganic Chem. 2021, 106, 104501. [Google Scholar] [CrossRef]
- Kaavin, K.; Naresh, D.; Yogeshkumar, M.R.; Prakash, M.K.; Janarthanan, S.; Krishnan, M.M.; Malathi, M. In-silico DFT studies and molecular docking evaluation of benzimidazo methoxy quinoline-2-one ligand and its Co, Ni, Cu and Zn complexes as potential inhibitors of Bcl-2, Caspase-3, EGFR, mTOR, and PI3K, cancer-causing proteins. Chem. Phys. Impact 2024, 8, 100418. [Google Scholar] [CrossRef]
- Kang, S.A.; O’Neill, D.J.; Machl, A.W.; Lumpkin, C.J.; Galda, S.N.; Sengupta, S.; Saiah, E. Discovery of small-molecule selective mTORC1 inhibitors via direct inhibition of glucose transporters. Cell Chem. Biol. 2019, 26, 1203–1213. [Google Scholar] [CrossRef]
- Hong, H.; Xie, Q.; Ge, W.; Qian, F.; Fang, H.; Shi, L.; Tong, W. Mold2, molecular descriptors from 2D structures for chemoinformatics and toxicoinformatics. J. Chem. Inf. Model. 2008, 48, 1337–1344. [Google Scholar] [CrossRef] [PubMed]
- Consonni, V.; Todeschini, R. Molecular descriptors. In Recent Advances in QSAR Studies; Springer: Dordrecht, The Netherlands, 2010; pp. 29–102. [Google Scholar] [CrossRef]
- Gozalbes, R.; Doucet, J.P.; Derouin, F. Application of topological descriptors in QSAR and drug design: History and new trends. Curr. Drug Targets-Infect. Disord. 2002, 2, 93–102. [Google Scholar] [CrossRef] [PubMed]
- Chtita, S.; Hmamouchi, R.; Larif, M.; Ghamali, M.; Bouachrine, M.; Lakhlifi, T. QSPR studies of 9-aniliioacridine derivatives for their DNA drug binding properties based on density functional theory using statistical methods: Model, validation and influencing factors. J. Taibah Univ. Sci. 2016, 10, 868–876. [Google Scholar] [CrossRef]
- Usta, O.; McCarty, W.; Bale, S.; Hegde, M.; Jindal, R.; Bhushan, A.; Golberg, I.; Yarmush, M. Microengineered cell and tissue systems for drug screening and toxicology applications: Evolution of in-vitro liver technologies. Technology 2015, 3, 1–26. [Google Scholar] [CrossRef] [PubMed]
- Saqib, U.; Kumar, B.; Siddiqi, M.I. Structural investigations of anthranilimide derivatives by CoMFA and CoMSIA 3D-QSAR studies reveal novel insight into their structures toward glycogen phosphorylase inhibition. SAR QSAR Environ. Res. 2011, 22, 411–449. [Google Scholar] [CrossRef]
- Dahmani, R.; Manachou, M.; Belaidi, S.; Chtita, S.; Boughdiri, S. Structural characterization and QSAR modeling of 1,2,4-triazole derivatives as α-glucosidase inhibitors. New J. Chem. 2021, 45, 1253–1261. [Google Scholar] [CrossRef]
- Karelson, M.; Lobanov, V.S.; Katritzky, A.R. Quantum-chemical descriptors in QSAR/QSPR studies. Chem. Rev. 1996, 96, 1027–1044. [Google Scholar] [CrossRef]
- Fouedjou, R.T.; Chtita, S.; Bakhouch, M.; Belaidi, S.; Ouassaf, M.; Djoumbissie, L.A.; Abul Qais, F. Cameroonian medicinal plants as potential candidates of SARS-CoV-2 inhibitors. J. Biomol. Struct. Dyn. 2021, 40, 8615–8629. [Google Scholar] [CrossRef]
- Katritzky, A.R.; Gordeeva, E.V. Traditional topological indexes vs. electronic, geometrical, and combined molecular descriptors in QSAR/QSPR research. J. Chem. Inf. Comput. Sci. 1993, 33, 835–857. [Google Scholar] [CrossRef]
- Emmert-Streib, F. Statistical Modelling of Molecular Descriptors in QSAR/QSPR; John Wiley & Sons: Hoboken, NJ, USA, 2012. [Google Scholar] [CrossRef]
- Chtita, S.; Belhassan, A.; Bakhouch, M.; Taourati, A.I.; Aouidate, A.; Belaidi, S.; Lakhlifi, T. QSAR study of unsymmetrical aromatic disulfides as potent avian SARS-CoV main protease inhibitors using quantum chemical descriptors and statistical methods. Chemom. Intell. Lab. Syst. 2021, 210, 104266. [Google Scholar] [CrossRef]
- Aouidate, A.; Ghaleb, A.; Ghamali, M.; Chtita, S.; Sbai, A.; Bouachrine, M.; Lakhlifi, T. Combined 3D-QSAR and molecular docking study on 7, 8-dialkyl-1, 3-diaminopyrrolo-[3, 2-f] Quinazoline series compounds to understand the binding mechanism of DHFR inhibitors. J. Mol. Struct. 2017, 1139, 319–327. [Google Scholar] [CrossRef]
- Hansch, C.; Kurup, A.; Garg, R.; Gao, H. Chem-bioinformatics and QSAR: A review of QSAR lacking positive hydrophobic terms. Chem. Rev. 2001, 101, 619–672. [Google Scholar] [CrossRef] [PubMed]
- Ghamali, M.; Chtita, S.; Hmamouchi, R.; Adad, A.; Bouachrine, M.; Lakhlifi, T. The inhibitory activity of aldose reductase of flavonoid compounds: Combining DFT and QSAR calculations. J. Taibah Univ. Sci. 2016, 10, 534–542. [Google Scholar] [CrossRef]
- Garg, R.; Gupta, S.P.; Gao, H.; Babu, M.S.; Debnath, A.K.; Hansch, C. Comparative quantitative structure—Activity relationship studies on anti-HIV drugs. Chem. Rev. 1999, 99, 3525–3602. [Google Scholar] [CrossRef]
- Aouidate, A.; Ghaleb, A.; Ghamali, M.; Chtita, S.; Ousaa, A.; Sbai, A.; Lakhlifi, T. Furanone derivatives as new inhibitors of CDC7 kinase: Development of structure activity relationship model using 3D QSAR, molecular docking, and in silico ADMET. Struct. Chem. 2018, 29, 1031–1043. [Google Scholar] [CrossRef]
- Kumari, C.; Abulaish, M.; Subbarao, N. Exploring molecular descriptors and fingerprints to predict mTOR kinase inhibitors using machine learning techniques. IEEE/ACM Trans. Comput. Biol. Bioinform. 2020, 18, 1902–1913. [Google Scholar] [CrossRef]
- Daoui, O.; Elkhattabi, S.; Chtita, S.; Elkhalabi, R.; Zgou, H.; Benjelloun, A.T. QSAR, molecular docking and ADMET properties in silico studies of novel 4, 5, 6, 7-tetrahydrobenzo [D]-thiazol-2-Yl derivatives derived from dimedone as potent anti-tumor agents through inhibition of C-Met receptor tyrosine kinase. Heliyon 2021, 7, e07463. [Google Scholar] [CrossRef]
- Chen, B.; Wild, D.J. PubChem BioAssays as a data source for predictive models. J. Mol. Graph. Model. 2010, 28, 420–426. [Google Scholar] [CrossRef]
- Chtita, S.; Aouidate, A.; Belhassan, A.; Ousaa, A.; Taourati, A.I.; Elidrissi, B.; Lakhlifi, T. QSAR study of N-substituted oseltamivir derivatives as potent avian influenza virus H5N1 inhibitors using quantum chemical descriptors and statistical methods. New J. Chem. 2020, 44, 1747–1760. [Google Scholar] [CrossRef]


| Coefficients | R2 | R2test | MSE | RMSE |
|---|---|---|---|---|
| MLR | 0.74 | 0.54 | 0.142 | 0.377 |
| MNLR | 0.78 | 0.57 | 0.163 | 0.404 |
| Model | R | R2 | Q2 | Model | R | R2 | Q2 |
|---|---|---|---|---|---|---|---|
| Original | 0.862 | 0.744 | 0.561 | ||||
| Random 1 | 0.249 | 0.062 | −0.497 | Random 51 | 0.449 | 0.202 | −0.371 |
| Random 2 | 0.536 | 0.287 | −0.076 | Random 52 | 0.560 | 0.314 | −0.207 |
| Random 3 | 0.636 | 0.404 | −0.065 | Random 53 | 0.546 | 0.298 | −0.305 |
| Random 4 | 0.339 | 0.115 | −0.406 | Random 54 | 0.488 | 0.238 | −0.313 |
| Random 5 | 0.373 | 0.139 | −0.568 | Random 55 | 0.434 | 0.189 | −0.411 |
| Random 6 | 0.429 | 0.184 | −0.458 | Random 56 | 0.158 | 0.025 | −0.574 |
| Random 7 | 0.286 | 0.082 | −1.218 | Random 57 | 0.251 | 0.063 | −0.688 |
| Random 8 | 0.415 | 0.172 | −0.514 | Random 58 | 0.426 | 0.182 | −0.388 |
| Random 9 | 0.590 | 0.348 | −0.096 | Random 59 | 0.233 | 0.054 | −0.538 |
| Random 10 | 0.463 | 0.215 | −0.534 | Random 60 | 0.588 | 0.346 | −0.171 |
| Random 11 | 0.605 | 0.366 | −0.054 | Random 61 | 0.464 | 0.215 | −0.450 |
| Random 12 | 0.355 | 0.126 | −0.465 | Random 62 | 0.420 | 0.177 | −0.381 |
| Random 13 | 0.391 | 0.153 | −0.420 | Random 63 | 0.627 | 0.393 | 0.012 |
| Random 14 | 0.272 | 0.074 | −0.596 | Random 64 | 0.541 | 0.293 | −0.327 |
| Random 15 | 0.370 | 0.137 | −0.603 | Random 65 | 0.528 | 0.279 | −0.136 |
| Random 16 | 0.428 | 0.183 | −0.480 | Random 66 | 0.459 | 0.210 | −0.360 |
| Random 17 | 0.484 | 0.234 | −0.235 | Random 67 | 0.480 | 0.231 | −0.424 |
| Random 18 | 0.407 | 0.166 | −0.411 | Random 68 | 0.409 | 0.168 | −0.383 |
| Random 19 | 0.707 | 0.500 | 0.067 | Random 69 | 0.407 | 0.166 | −0.435 |
| Random 20 | 0.289 | 0.084 | −0.594 | Random 70 | 0.388 | 0.150 | −0.521 |
| Random 21 | 0.641 | 0.411 | 0.050 | Random 71 | 0.427 | 0.182 | −0.481 |
| Random 22 | 0.663 | 0.440 | 0.044 | Random 72 | 0.392 | 0.154 | −0.402 |
| Random 23 | 0.630 | 0.397 | −0.064 | Random 73 | 0.559 | 0.312 | −0.024 |
| Random 24 | 0.435 | 0.190 | −0.235 | Random 74 | 0.543 | 0.295 | −0.225 |
| Random 25 | 0.487 | 0.238 | −0.295 | Random 75 | 0.357 | 0.127 | −0.429 |
| Random 26 | 0.497 | 0.247 | −0.312 | Random 76 | 0.604 | 0.364 | −0.293 |
| Random 27 | 0.352 | 0.124 | −0.442 | Random 77 | 0.497 | 0.247 | −0.437 |
| Random 28 | 0.693 | 0.480 | 0.201 | Random 78 | 0.408 | 0.167 | −0.463 |
| Random 29 | 0.577 | 0.333 | −0.248 | Random 79 | 0.294 | 0.086 | −0.676 |
| Random 30 | 0.451 | 0.203 | −0.221 | Random 80 | 0.551 | 0.303 | −0.224 |
| Random 31 | 0.304 | 0.092 | −0.588 | Random 81 | 0.422 | 0.178 | −0.439 |
| Random 32 | 0.446 | 0.199 | −0.579 | Random 82 | 0.447 | 0.200 | −0.287 |
| Random 33 | 0.301 | 0.091 | −0.521 | Random 83 | 0.427 | 0.182 | −0.470 |
| Random 34 | 0.586 | 0.344 | −0.217 | Random 84 | 0.334 | 0.111 | −0.410 |
| Random 35 | 0.428 | 0.184 | −0.495 | Random 85 | 0.554 | 0.306 | −0.169 |
| Random 36 | 0.420 | 0.176 | −0.358 | Random 86 | 0.528 | 0.279 | −0.263 |
| Random 37 | 0.525 | 0.276 | −0.446 | Random 87 | 0.583 | 0.340 | −0.103 |
| Random 38 | 0.553 | 0.306 | −0.191 | Random 88 | 0.487 | 0.237 | −0.344 |
| Random 39 | 0.326 | 0.106 | −0.431 | Random 89 | 0.525 | 0.276 | −0.280 |
| Random 40 | 0.499 | 0.249 | −0.206 | Random 90 | 0.550 | 0.302 | −0.190 |
| Random 41 | 0.588 | 0.346 | −0.159 | Random 91 | 0.318 | 0.101 | −0.645 |
| Random 42 | 0.337 | 0.113 | −0.747 | Random 92 | 0.364 | 0.133 | −0.420 |
| Random 43 | 0.518 | 0.268 | −0.178 | Random 93 | 0.462 | 0.213 | −0.407 |
| Random 44 | 0.322 | 0.104 | −0.478 | Random 94 | 0.478 | 0.228 | −0.177 |
| Random 45 | 0.430 | 0.185 | −0.527 | Random 95 | 0.474 | 0.224 | −0.347 |
| Random 46 | 0.466 | 0.217 | −0.286 | Random 96 | 0.497 | 0.247 | −0.257 |
| Random 47 | 0.643 | 0.414 | −0.041 | Random 97 | 0.206 | 0.042 | −0.622 |
| Random 48 | 0.494 | 0.244 | −0.184 | Random 98 | 0.385 | 0.148 | −0.522 |
| Random 49 | 0.353 | 0.125 | −0.567 | Random 99 | 0.306 | 0.093 | −0.508 |
| Random 50 | 0.470 | 0.221 | −0.291 | Random 100 | 0.332 | 0.110 | −0.393 |
| Compound No. | Pred (pIC50) mTORC1 | |
|---|---|---|
| MLR | MNLR | |
| 2 | 8.421 | 8.5574 |
| 29 | 8.101 | 7.7738 |
| 13 | 8.078 | 7.8999 |
| 4 | 7.869 | 7.813 |
| 10 | 7.77 | 7.7024 |
| 71 | 7.743 | 7.6084 |
| 25 | 7.736 | 7.8294 |
| pIC50 exp. | ||
| Everolimus | 8.26 | |
| Temsirolimus | 5.8 | |
| Ridaforolimus | 9.7 |
| Property | Absp | MW | LogP | NHD | NHA | NROT | TPSA (Å2) | SA | ||||||
|---|---|---|---|---|---|---|---|---|---|---|---|---|---|---|
| Rule | - | <500 | <5 | <5 | <10 | <10 | <140 | 0 < SA < 10 | ||||||
| 2 | High | 627.77 | 2.27 | 2 | 8 | 9 | 109.71 | 5.85 | ||||||
| 29 | Weak | 627.77 | 2.59 | 2 | 7 | 9 | 106.70 | 4.45 | ||||||
| 13 | High | 573.68 | 3.74 | 2 | 5 | 7 | 82.84 | 4.43 | ||||||
| 4 | High | 602.77 | 2.80 | 2 | 6 | 6 | 100.09 | 5.56 | ||||||
| 10 | Weak | 585.76 | 2.21 | 2 | 5 | 7 | 124.80 | 4.97 | ||||||
| 25 | High | 524.66 | 2.27 | 2 | 4 | 7 | 95.73 | 4.34 | ||||||
| 71 | High | 608.70 | 2.21 | 1 | 8 | 7 | 122.36 | 4.21 | ||||||
| Everolimus | Weak | 958.22 | 6.58 | 3 | 14 | 9 | 204.66 | 10 | ||||||
| Temsirolimus | Weak | 1030.2 | 6.82 | 4 | 16 | 11 | 241.96 | 10 | ||||||
| Ridaforolimus | Weak | 990.21 | 7.10 | 2 | 14 | 8 | 211.31 | 10 | ||||||
| Property | Lipinski’s Violation | Muegge’s Violation | Veber’s Violation | Egan’s Violation | ||||||||||
| Rule | ≤2 | ≤1 | ≤1 | ≤1 | ||||||||||
| 2 | 1 | 0 | 0 | 0 | ||||||||||
| 29 | 1 | 0 | 0 | 0 | ||||||||||
| 13 | 1 | 0 | 0 | 0 | ||||||||||
| 4 | 1 | 0 | 0 | 0 | ||||||||||
| 10 | 1 | 0 | 0 | 0 | ||||||||||
| 25 | 1 | 0 | 0 | 0 | ||||||||||
| 71 | 1 | 0 | 0 | 0 | ||||||||||
| Everolimus | 2 | 4 | 1 | |||||||||||
| Temsirolimus | 2 | 4 | 2 | |||||||||||
| Ridaforolimus | 2 | 4 | 1 | |||||||||||
Disclaimer/Publisher’s Note: The statements, opinions and data contained in all publications are solely those of the individual author(s) and contributor(s) and not of MDPI and/or the editor(s). MDPI and/or the editor(s) disclaim responsibility for any injury to people or property resulting from any ideas, methods, instructions or products referred to in the content. |
© 2024 by the authors. Licensee MDPI, Basel, Switzerland. This article is an open access article distributed under the terms and conditions of the Creative Commons Attribution (CC BY) license (https://creativecommons.org/licenses/by/4.0/).
Share and Cite
Karim, E.M.; Abchir, O.; Nour, H.; Daoui, O.; El Khattabi, S.; Siddique, F.; El Kouali, M.; Talbi, M.; Errougui, A.; Chtita, S. In Silico Design of Novel Piperazine-Based mTORC1 Inhibitors Through DFT, QSAR and ADME Investigations. Biophysica 2024, 4, 517-529. https://doi.org/10.3390/biophysica4040034
Karim EM, Abchir O, Nour H, Daoui O, El Khattabi S, Siddique F, El Kouali M, Talbi M, Errougui A, Chtita S. In Silico Design of Novel Piperazine-Based mTORC1 Inhibitors Through DFT, QSAR and ADME Investigations. Biophysica. 2024; 4(4):517-529. https://doi.org/10.3390/biophysica4040034
Chicago/Turabian StyleKarim, El Mehdi, Oussama Abchir, Hassan Nour, Ossama Daoui, Souad El Khattabi, Farhan Siddique, M’Hammed El Kouali, Mohammed Talbi, Abdelkbir Errougui, and Samir Chtita. 2024. "In Silico Design of Novel Piperazine-Based mTORC1 Inhibitors Through DFT, QSAR and ADME Investigations" Biophysica 4, no. 4: 517-529. https://doi.org/10.3390/biophysica4040034
APA StyleKarim, E. M., Abchir, O., Nour, H., Daoui, O., El Khattabi, S., Siddique, F., El Kouali, M., Talbi, M., Errougui, A., & Chtita, S. (2024). In Silico Design of Novel Piperazine-Based mTORC1 Inhibitors Through DFT, QSAR and ADME Investigations. Biophysica, 4(4), 517-529. https://doi.org/10.3390/biophysica4040034