1. Introduction
Osteosarcomas are aggressive malignant tumors originating in bone tissue, characterized by the formation of immature bone or osteoid, which is a defining feature of this cancer type [
1]. The causes of osteosarcoma are not fully understood, but genetic factors and prior radiation exposure are well-known risk contributors [
2]. Though osteosarcomas represent the most common bone cancer in children and adolescents, the global incidence remains low, with only a few cases per million annually [
3]. Standard treatment protocols often combine surgery with chemotherapy, and in some cases, radiation therapy is employed depending on the tumor’s progression and the patient’s overall health [
4].
Epigallocatechin-3-gallate (EGCG), a potent catechin found predominantly in green tea, has garnered attention for its therapeutic potential. Research has shown that EGCG possesses antioxidant, anti-inflammatory, and anticancer properties. For instance, clinical studies have highlighted EGCG’s safety and chemopreventive effects, such as its year-long use in a randomized trial for prostatic neoplasia without significant side effects [
5]. Studies have also shown that EGCG can inhibit tumor growth and progression through various molecular pathways, with notable implications for cancer therapy [
6,
7,
8].
The biological efficacy of EGCG in cancer treatment has been linked to its molecular mechanisms, including the inhibition of cancer cell proliferation and the promotion of apoptosis. EGCG has been shown to inhibit breast cancer stem cell tumor formation by reducing the expression of key proliferation markers [
9,
10]. Furthermore, EGCG has been observed to protect human endothelial cells (HUVECs) from oxidative stress, specifically hydrogen peroxide-induced apoptosis, through the modulation of autophagy and mTOR signaling pathways [
11,
12,
13]. Moreover, studies have identified the upregulation of miR-1/c-MET as one of EGCG’s anticancer mechanisms, which induces apoptosis and suppresses cell proliferation [
10,
12,
13,
14,
15].
In addition to EGCG, camptothecin (CAMPT), a plant-derived alkaloid, has proven to be a pivotal chemotherapeutic agent due to its ability to inhibit the topoisomerase I enzyme, which is critical for DNA replication [
16,
17]. By inhibiting this enzyme, CAMPT induces DNA damage in rapidly dividing cells, leading to cell cycle arrest and apoptosis, making it effective against various solid tumors and leukemias [
18]. This study investigates the protective potential of EGCG in mitigating oxidative stress in rat osteosarcoma cells (UMR 106-1 BSP), focusing on the therapeutic interaction between EGCG and CAMPT.
To assess the biophysical effects of these compounds on UMR cells, we employed Electric Cell-Substrate Impedance Sensing (ECIS) technology. ECIS offers a real-time, non-invasive means of tracking cell behaviors, such as attachment, spreading, and proliferation, by measuring impedance [
19,
20,
21]. This method is highly sensitive to both cell-substrate adhesion and cell–cell interactions, making it ideal for assessing how EGCG modulates the effects of CAMPT on cellular behavior. Though ECIS has been widely used to study cell behaviors in various contexts, its application in examining the protective effects of EGCG against oxidative stress-induced damage in osteosarcoma cells has been limited. By utilizing ECIS, this study aims to contribute to a deeper understanding of how EGCG and CAMPT interact to influence osteosarcoma cell behavior and viability under oxidative stress conditions [
22,
23,
24]. Additionally, studies suggest that EGCG can protect cells from oxidative stress, a known driver of cancer progression and treatment resistance, by modulating pathways like apoptosis and autophagy [
22,
23,
24].
In summary, this research examines the capacity of EGCG to protect rat osteosarcoma cells from oxidative stress induced by CAMPT, with the aid of ECIS technology, to provide insights into real-time cellular behavior and treatment efficacy.
Effects of Epigallocatechin Gallate and Camptothecin on Normal Cells
Recent studies have illuminated the complex effects of bioactive compounds, notably camptothecin (CAMPT) and epigallocatechin gallate (EGCG), on both cancerous and normal cells, underscoring the nuanced balance between therapeutic efficacy and toxicity. Research highlights CAMPT’s dual role, demonstrating its potency in inhibiting Hep-2 cancer cell proliferation while also inducing cytotoxicity in normal MRC-5 cells through mechanisms primarily associated with necrosis rather than apoptosis [
25]. CAMPT significantly inhibits the proliferation of MRC-5 normal cells; at a concentration of 0.6 µg/mL, it decreases cell growth by approximately 45%. This finding emphasizes the need for precise targeting in cancer treatment to minimize collateral damage to normal cells. This observation points to the broader challenge in chemotherapy: achieving targeted cancer cell destruction while sparing normal cells, thereby necessitating further exploration to refine CAMPT’s therapeutic index.
Parallel investigations into EGCG, a prominent green tea polyphenol, reveal its discriminatory cytotoxic effects, favoring the suppression of cancer cells over normal fibroblasts in the human oral cavity. This selectivity is attributed to cancer cells’ heightened vulnerability to the oxidative stress induced by tea polyphenols, a mechanism mitigated by antioxidants like catalase and deferoxamine [
26,
27]. Such findings not only validate EGCG’s potential as a prooxidant agent selectively toxic to malignant cells but also emphasize the need for comprehensive studies to harness its therapeutic benefits fully.
Expanding on the therapeutic scope of EGCG underscores its cardioprotective capabilities, particularly against myocardial dysfunction and endothelial-to-mesenchymal transition, signaling potential in preventing cardiovascular diseases [
28]. Furthermore, studies on reproductive cancers and autophagy regulation suggest EGCG’s versatility in modulating cellular pathways critical for cancer treatment [
29]. The efficacy of EGCG in ameliorating endothelial dysfunction, particularly in models of preeclampsia through enhanced nitric oxide production and increased antioxidant capacity, underscores its potential for treating disorders related to endothelial health [
30].
Collectively, these studies articulate the therapeutic complexities and potential of CAMPT and EGCG, framing a research trajectory that balances efficacy with safety, particularly in the quest for selective toxicity toward cancer cells. The advancement of such compounds’ therapeutic index hinges on a deeper understanding of their mechanistic impacts across both malignant and healthy cells’ cellular landscapes.
Many medical treatments have been proposed and utilized to mitigate the effects of oxidants on mammalian cells [
31,
32,
33,
34,
35]. Some studies have demonstrated the antioxidative effects of EGCG (an active ingredient in green tea) against cellular oxidants such as CAMPT [
10]. However, there is limited research exploring how EGCG mitigates the effects of CAMPT, specifically on UMR cells. This study aims to investigate whether EGCG can mitigate the effects of CAMPT on UMR 106 cells by examining both cell proliferation and biophysical parameters such as cell membrane resistance (which is the electrical resistance across the cell monolayer) resistance and attachment.
2. Materials and Methods
2.1. Experimental Workflow
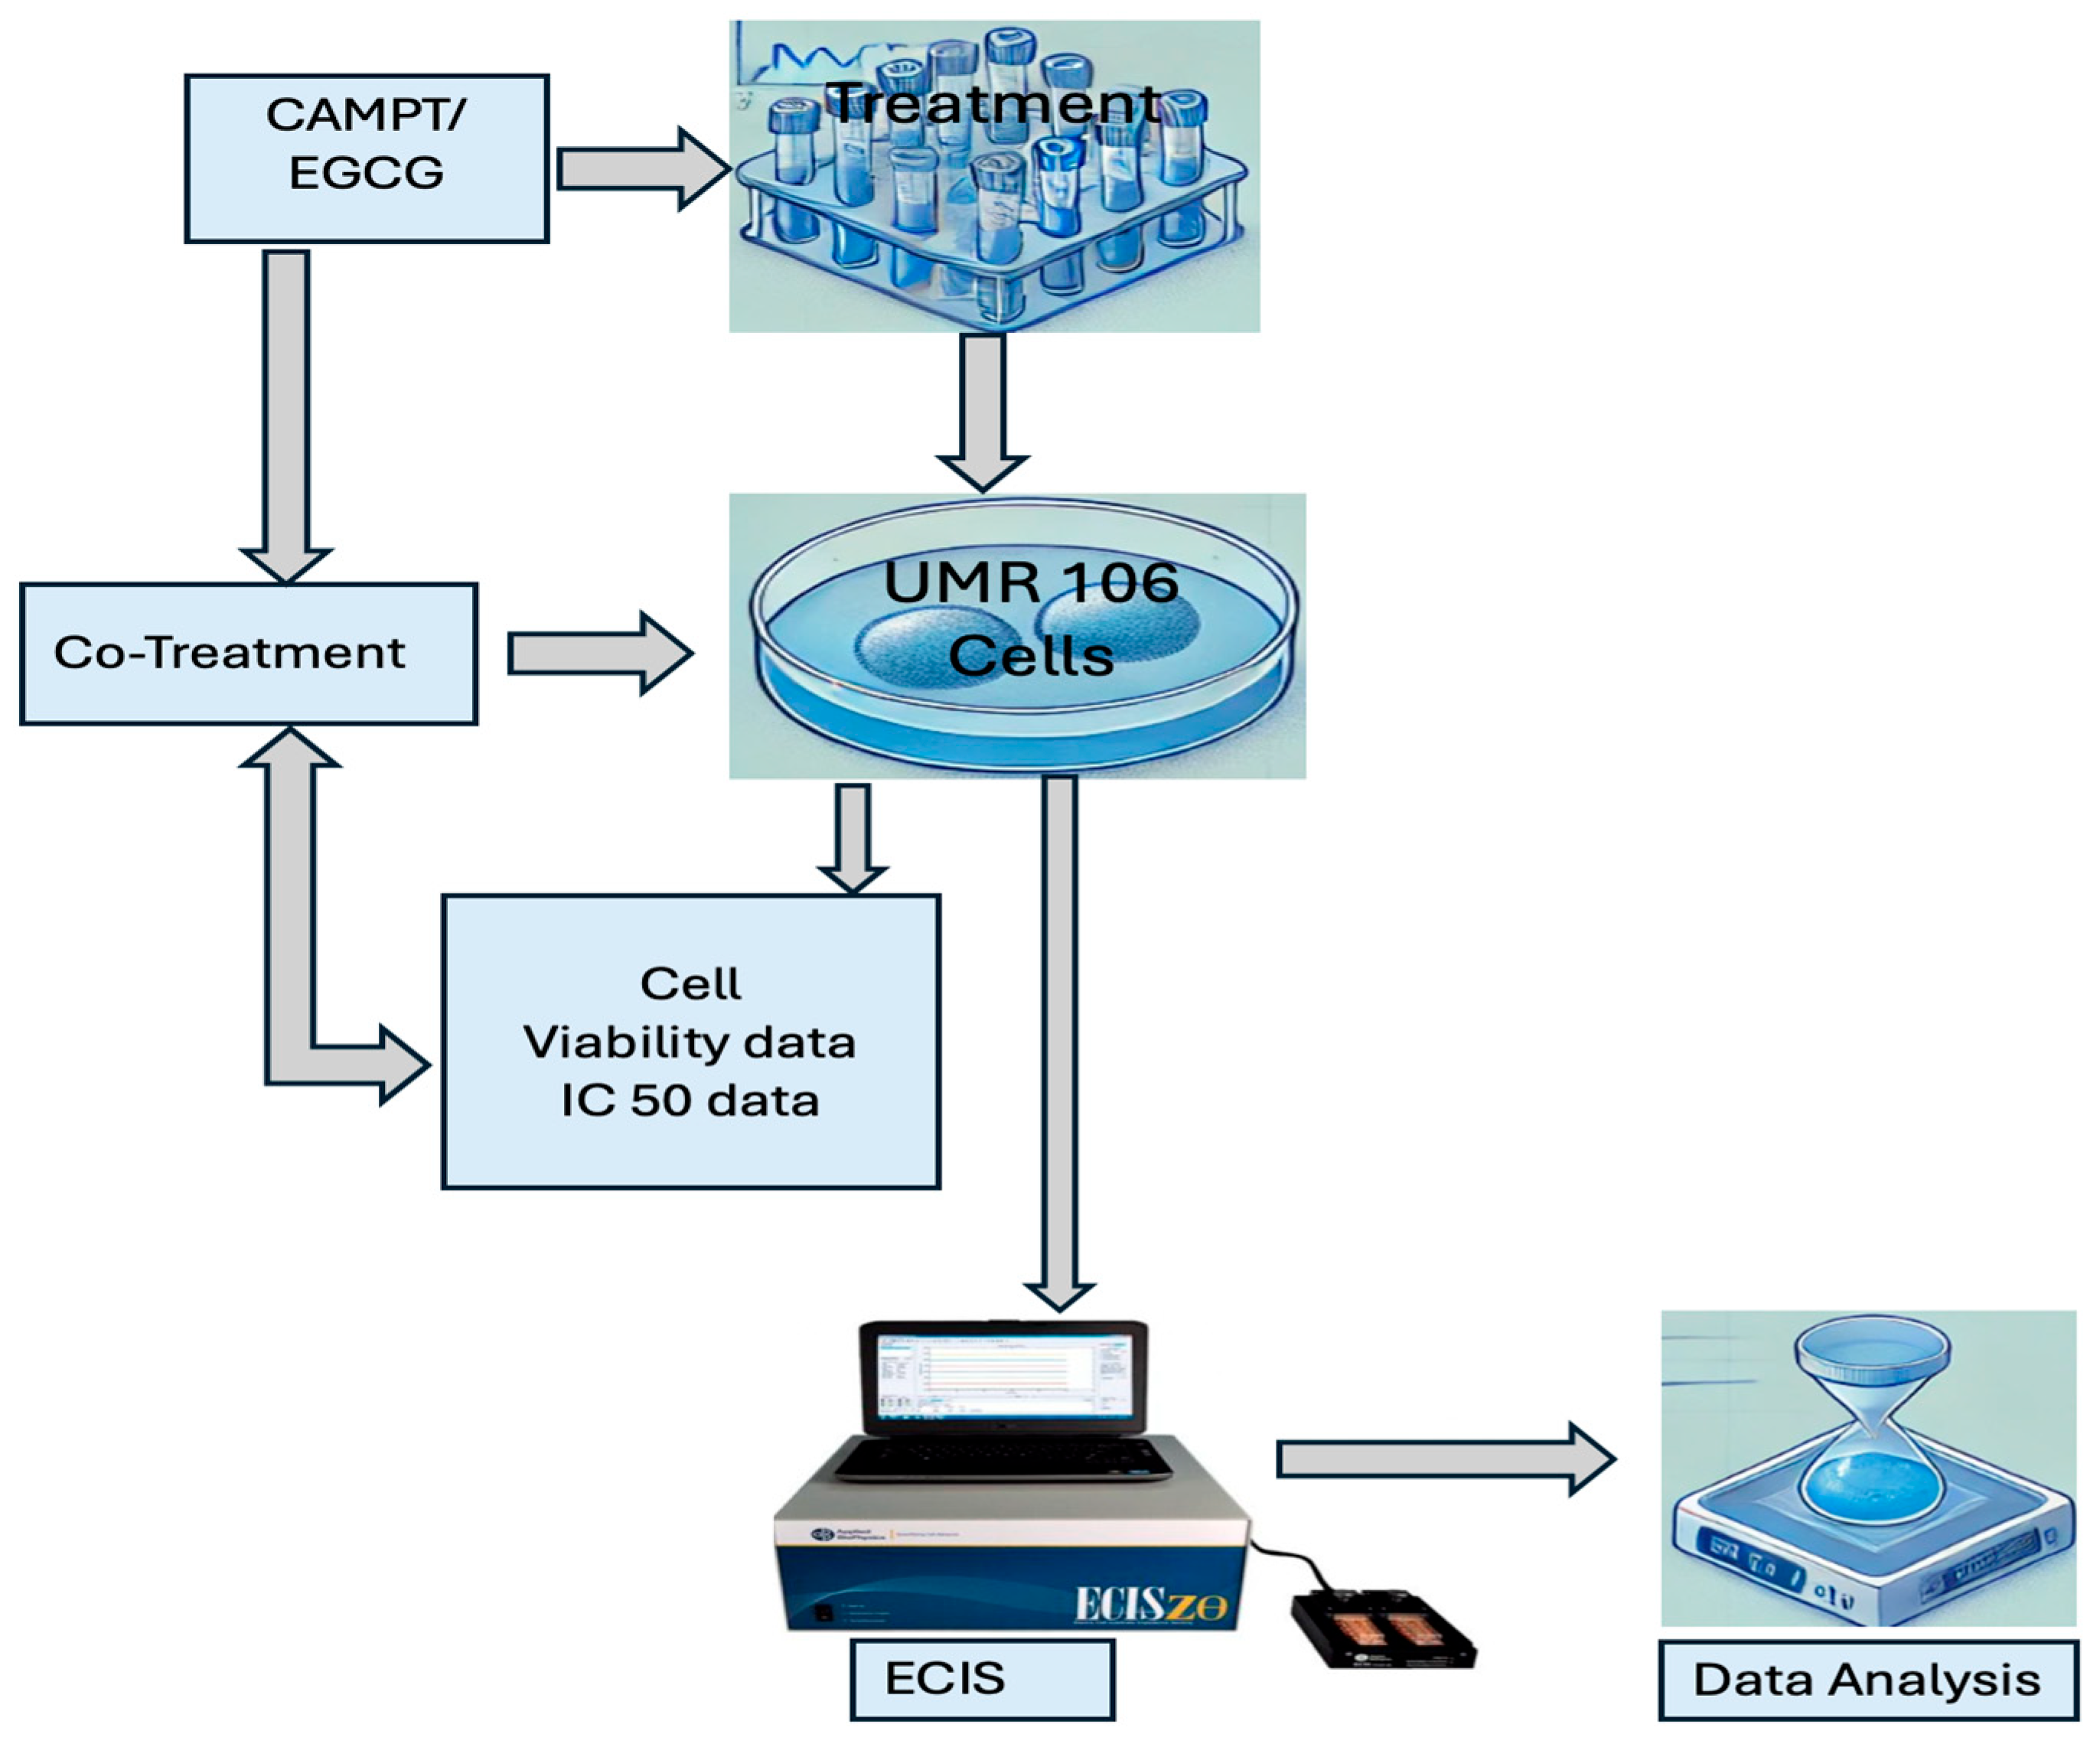
The experimental workflow for this study is summarized in
Figure 1, which outlines the treatment and analysis of UMR 106 cells. The process begins with the treatment or co-treatment of UMR 106 cells with varying concentrations of CAMPT and/or EGCG. Following treatment, cell viability is evaluated, and IC50 values are determined. ECIS technology is then used to assess real-time cellular responses, including cell attachment and proliferation. The results are analyzed to provide insights into the effects of these treatments on UMR cells under various conditions.
2.2. Cell Culture and Treatments
UMR 106-01 BSP cells (rat osteosarcoma bone-like cells: obtain from the Laboratory of D. Ron Midura at the Letter Research Institute: The Cleveland Clinic Foundation) were cultured in minimum essential medium (MEM) supplemented with fetal bovine serum (FBS), L-glutamine, HEPES buffer, and Hank’s balanced salt solution (HBSS). Approximately 3 million cells were cultured in a cell culture incubator at 37 °C with 5% CO
2 until reaching confluence (~72 h) (see
Figure 2). Afterward, the cells were routinely passaged, counted, and plated at 4.8 × 10
5 cells/mL in six-well plates for subsequent treatments.
Designated wells were treated with varying concentrations of CAMPT (0.5, 1.2, 2.4, 4.8, 7.2 µM), while others were co-treated with CAMPT and EGCG at concentrations ranging from 20 to 100 µM. Post-treatment incubation ranged from 72 to 90 h. The LUNA Automated Cell Counter (Logos Biosystems, Annandale, VA, USA) was used to evaluate cell viability and proliferation.
Figure 3 presents the qualitative effects of CAMPT, including reduced confluence and altered cellular structures.
2.3. Effect of Camptothecin on Cell Proliferation
To evaluate the impact of CAMPT on cell proliferation, UMR cells were plated into six-well plates at varying CAMPT concentrations (0.5, 1.2, 2.4, 4.8, and 7.2 µM). After incubation for 80–90 h, cells were counted using the LUNA Automated Cell Counter (Logos Biosystems, Annandale, VA, USA), and viabilities were determined.
Figure 3 demonstrates the effects of CAMPT, with treated cells showing reduced confluence and altered cell structure compared to the control.
2.4. The Effect of EGCG on the Proliferation of UMR Cells
Confluent cells were plated into two six-well plates with their corresponding EGCG concentrations (20, 40, 60, 80, and 100 µM). After treating the cells, the plates were incubated for ~80–90 h. Cells were then counted with the LUNA Automated Cell Counter, and cell viabilities were assessed.
Figure 4 shows that EGCG promoted cell growth and adherence at lower (20 to 60 µM), while higher concentrations (80 to 100 µM) resulted in reduced cell density.
2.5. Effect of EGCG on Camptothecin-Treated Cells
Confluent cells were plated into two six-well plates and co-treated with their corresponding EGCG/CAMPT concentrations. The effective dose of EGCG (20 µM) was used to treat the different concentrations of CAMPT from the previous methods for evaluating the effect of CAMPT. After treating the cells, the plates were incubated for ~80–90 h. The effects of EGCG on CAMPT-treated cells were assessed by counting cells post-incubation using the LUNA Automated Cell Counter.
2.6. Electric Cell-Substrate Impedance Sensing (ECIS) Technology
To explore the effects of CAMPT and EGCG on UMR cells’ biophysical properties, ECIS technology was employed. In the 8-rod ECIS electrode system, each rod ranges from 100 to 300 µm in length and 10 to 50 µm in width, with spacing between rods from 100 µm, providing enhanced sensitivity to changes in cell behavior across a focused area. UMR cells treated with CAMPT were plated at a concentration of 2.5 × 10⁵ cells/mL in each well of the 8-well ECIS plate (ECIS® ZTheta, Applied BioPhysics, Inc., Troy, NY, USA), with a final volume of 400 µL per well, ensuring consistent cell density and coverage across all wells for accurate impedance measurements. The ECIS array was then incubated at 37 °C with 5% CO2. Once cells were attached to the gold electrodes in the wells, the ECIS instrument continuously measured cell impedance (resistance) over a 48 h period.
The ECIS system utilized a frequency of 4000 Hz, which is optimal for capturing changes in cell attachment and spreading. At this frequency, the current predominantly flows between and under adjacent cells, making it sensitive to changes in cell–cell junctions and cell-substrate adhesion. This sensitivity allowed us to monitor real-time changes in cellular behavior in response to CAMPT and EGCG treatments. Additionally, this frequency also minimizes noise and artifacts, ensuring reliable data for studies involving drug responses like CAMPT and EGCG. Its widespread use in the literature further supports its standardization in cell viability and health monitoring applications [
21,
36,
37].
2.7. Statistical Analysis
The experiments were conducted in four trials. Data were expressed as means ± SD, and an F-test ANOVA was performed to compare variances between trials. The significance level was set at p < 0.05 for determining treatment effects on cell proliferation and biophysical parameters.
3. Results
Cells co-treated with CAMPT + EGCG revealed that EGCG was able to reverse the oxidative effects of CAMPT on the UMR cells in a concentration-dependent manner. The ECIS technology documented decreases in biophysical parameters in the UMR cells when CAMPT alone was used. F-test ANOVA yielded statistically significant values with p-values < 0.05.
Figure 5a shows the results of cells that were then counted with the LUNA Automated Cell Counter, and cell viabilities were assessed. The green circles indicate live cells; the red circles represent dead circles. The “cell count results” reveal information about the cell concentrations and viability. The “cell size histogram expressed by cell concentration” provides graphs and data regarding the cell concentration with respect to cell size (µM) shown in
Figure 5b.
Figure 5c shows the fitted dose–response curve for viability of cells in relation to various concentrations of EGCG. The EC50 value, calculated as approximately 40.22, represents the concentration at which the cell viability is reduced to about 50% of its maximum. This is a key indicator of EGCG’s cytotoxicity level at which its effect is half-maximal. From the plot, we observe that the viability decreases with increasing concentrations of EGCG and then exhibits some variability, which suggests complex dynamics, possibly due to the biological variability or experimental conditions. This analysis provides insights into EGCG’s cytotoxic effects and helps in understanding its potential therapeutic window and safety margins in practical applications.
Cells were routinely passaged and treated with different concentrations of CAMPT (0.5, 1.2, 2.4, 4.8, 7.2 µM). In
Figure 6a, the green and red circles indicate live cells and dead cells, respectively. The “cell count results” reveal information about the cell concentrations and viability. The “cell size histogram expressed by cell concentration” provides graphs and data regarding the cell concentration with respect to cell size (µM), as shown in
Figure 6b. The results show that as the CAMPT concentration increased, the viability of the UMR cells decreased (
Figure 6b). As the CAMPT concentration increased, the viability of the UMR cells decreased. (** =
p ≤ 0.01, **** =
p ≤ 0.0001).
The analysis and fitting of a dose–response curve for CAMPT (
Figure 6c) has yielded an EC50 value of approximately 14.61. This value indicates the concentration at which the cytotoxic effect of CAMPT reduces cell viability to half of its maximal observed effect in the tested range. The plot exhibits a non-typical dose–response curve, where viability percentages increase as concentrations decrease. This trend is the opposite of what is commonly expected, where higher concentrations usually lead to decreased viability. The viability percentages are very low across all concentrations, ranging from about 0.5 to 7.2%. This suggests that even at lower concentrations, CAMPT is highly cytotoxic. This analysis illustrates that CAMPT is a highly effective cytotoxic agent with significant effects at relatively low concentrations. The calculated EC50 further aids in understanding the dosage levels that might be considered for further pharmacological studies or clinical applications.
The normalized impedance in
Figure 7 reflects the impedance magnitude, which encompasses both the resistive and reactive components of the cell–electrode system. This measurement was collected at a single frequency of 4000 Hz, and the impedance magnitude was tracked as a function of time and CAMPT concentration. The resistive component is influenced by the cytoplasm of the cells, while the reactive component is primarily determined by the capacitive behavior of the cell membrane. The results of
Figure 7 show that the impedance decreases with increasing CAMPT concentration. When cells are healthy and firmly attached to the substrate, they form a barrier that impedes the flow of electric current, resulting in higher impedance. However, if cells undergo stress or damage (e.g., from CAMPT exposure), they may detach or change shape, reducing the barrier to current flow and, consequently, decreasing the impedance.
Figure 8 shows that viability improves with co-treatment. Cells were routinely passaged and treated with 20 µM of EGCG and different concentrations of CAMPT (0.5, 1.2, 2.4, 4.8, 7.2 µM). Compared to the CAMPT treatment alone, the co-treatment showed increased viability at higher doses of CAMPT (2.4, 4.8, 7.2 µM) (* =
p ≤ 0.05, ** =
p ≤ 0.01).
Cells were treated with 20 µM of EGCG, 7.2 µM CAMPT, and co-treatment of 20 µM EGCG + 7.2 µM CAMPT. Cells were monitored with the ECIS instrument at 4000 Hz. Compared to the control, EGCG-treated cells showed an increase in resistance in a time-dependent manner, whereas CAMPT-treated cells saw decreased resistance in a time-dependent manner (
Figure 9). The results of the proliferation study showed a decrease in CAMPT-treated UMR cell proliferation in a concentration-dependent manner. CAMPT is a potent inhibitor of DNA topoisomerase I, leading to the prevention of DNA unwinding and replication, which results in cell death or a decrease in cell proliferation.
4. Discussion
This study suggests that epigallocatechin gallate (EGCG) can effectively shield UMR cells from oxidative stress, which is supported by an array of scientific literature that demonstrates EGCG’s robust antioxidant properties [
38]. The biological effects of EGCG and CAMPT on UMR cells have also been demonstrated using ECIS [
36]. As such, these findings underscore EGCG’s potential in counteracting oxidative stress-induced damage in mammalian cells.
4.1. 20µM EGCG Serves as the Effective Dose
Figure 5b of the study portrays a noticeable increase in cell viability at a concentration of 20 µM EGCG compared to the control, with a less significant increase observed at 40 µM. The cytotoxic effect of EGCG appears to initiate at concentrations around 40 µM. and extends beyond 60 µM. The viability dips below 50% within this range (
Figure 5c). In comparison to the untreated control group, there was an observed increase in cell viability at a concentration of 20 µM. However, at higher concentrations ranging from 40 to 100 µM, cell viability was reduced below control levels.
Viability rises again at 80 µM before declining at 100 µM, suggesting either a potential secondary therapeutic effect at 80 µM or that the response may not be linear and could be influenced by other factors, such as the formation of precipitates or the saturation of cellular response mechanisms at higher concentrations. Further, the cytotoxicity of EGCG in this experimental setup suggests that while it can reduce cell viability at higher doses, the precise response curve may need further investigation to understand dose-dependent behaviors fully, particularly at concentrations exceeding the EC50 value. Nonetheless, since this increase remains below the control level, it suggests that the effect at this concentration is more likely to be toxic rather than therapeutic.
These findings resonate with research underscoring EGCG’s effectiveness at lower concentrations in fostering cell viability, with its beneficial impacts diminishing at higher doses [
36]. The effective dose of EGCG in this study was determined to be 20 µM, as it enhanced cell viability more than other concentrations and the control. Concentrations within the range of 60–100 µM might be deemed suitable as therapeutic doses in the context of cancer research.
4.2. CAMPT Decreases Cell Viability in a Concentration-Dependent Manner
Compared to the control, CAMPT-treated cells immediately display decreased confluency in their cultures and altered cell morphologies, indicating oxidative stress (
Figure 5). As the CAMPT concentration increases, there is a steady decline in cell viability, indicating that oxidative stressors like CAMPT can decrease UMR cell viability (
Figure 6). The concentration of the oxidative stressor CAMPT increases in
Figure 6b, which reinforces MAMPT’s ability to inhibit the proliferation and survival of UMR cells. CAMPT is demonstrated to be highly potent, as evidenced by its significant cytotoxic effects even at lower concentrations, which is highlighted by the low viability percentages observed across the tested concentration range. The steep nature of the response curve in
Figure 6c, marked by rapid changes in viability percentages over a relatively small concentration range, underscores CAMPT’s strong effect even with minor dosage adjustments. Consequently, in therapeutic applications, precise dosing of CAMPT becomes crucial to manage its cytotoxic effects effectively, emphasizing the need for meticulous control over dosage to maximize therapeutic benefits while minimizing potential harm.
Figure 6 elucidates how the control’s cell monolayer resistance increases over time. As CAMPT concentrations increase between 1.2 and 2.4 µM, impedances gradually increase until they plateau around 30 to 36 h after application. In contrast, higher CAMPT concentrations, such as 4.8 and 7.2 µM, are associated with a steady decrease in resistance. In essence, an increase in CAMPT concentration results in a decrease in impedance. Such concentration-dependent variations in cell membrane impedance are effectively captured by the ECIS instrument, further validating its utility [
37]. Topoisomerase I (Topo I) is a crucial enzyme for transcription and replication in DNA, and CAMPT is a cytotoxic quinoline alkaloid that inhibits it. The effect of CAMPT is to create permanent single-strand breaks in the DNA molecule, preventing the normal functioning of the Topo I enzyme and ultimately leading to cell death.
Impedance measurements are a non-invasive, real-time, and quantitative method for monitoring cellular activity and health. Cells on a microelectrode substrate are measured in terms of changes in impedance, which are related to their attachment, spreading, morphology, and overall behavior.
4.3. EGCG Protects the Oxidative Stress-Induced Cells at Higher CAMPT Concentrations
Figure 8 juxtaposes the results of CAMPT treatment alone with a co-treatment of varying CAMPT concentrations and the effective EGCG dose. As indicated in
Figure 4, a rise in CAMPT concentration leads to a decrease in cell viability. For the co-treatment, the viabilities compared to that of CAMPT yield around the same results at lower doses (0.5–1.2 µM). However, a relative increase in cell viability at higher CAMPT concentrations (2.4–7.2 µM) is observed compared to CAMPT treatment alone, suggesting EGCG’s protective capabilities against oxidative stress [
24]. This shows that EGCG can protect oxidative stress-induced cells.
When cells are treated with CAMPT alone, the drug induces oxidative stress, leading to DNA damage and a decrease in cell viability. However, when cells are co-treated with EGCG and CAMPT, EGCG may exert its antioxidant effect and neutralize the reactive oxygen species (ROS) induced by CAMPT (EGCG, the major active component in green tea, is known for its antioxidant properties). These antioxidant effects are primarily due to its ability to scavenge ROS, protecting cells from oxidative stress and DNA damage. This could protect the cells from oxidative damage, thereby preserving cell viability even in the presence of the otherwise cytotoxic CAMPT.
It is also possible that EGCG modulates signaling pathways involved in cell survival and apoptosis, providing an additional protective mechanism. EGCG has been reported to modulate various cell signaling pathways, including those involving nuclear factor kappa-light-chain-enhancer of activated B cells (NF-κB), Akt, and mitogen-activated protein kinases (MAPKs), which may contribute to its cytoprotective effects in the context of camptothecin treatment.
4.4. The ECIS Monitors the Biophysical Properties of UMR Cells in Real Time
The ECIS illustrates how the control increases cell monolayer resistance with respect to time (
Figure 9). Compared to the control, 20 µM EGCG increases cell resistance, whereas 7.2 µM CAMPT decreases resistance in a time-dependent manner. This demonstrates that the ECIS can monitor the biophysical properties of UMR cells in real time.
In our study, we observed a correlation between cell spreading and impedance across the different treatment groups. In the control group, cells displayed typical spreading behavior, leading to a gradual increase in impedance over time, as shown by the red curve in
Figure 6. This indicates normal cell attachment and spreading.
In contrast, cells treated with higher concentrations of camptothecin (e.g., 4.8 and 7.2 µM) showed a marked decrease in spreading, which is reflected in the reduced impedance values. The inhibition of cell spreading in these groups suggests that camptothecin impairs the cells’ ability to fully attach and spread on the electrode surface, likely due to cytotoxic effects that disrupt the cytoskeleton and attachment mechanisms.
At lower concentrations of CAMPT (e.g., 1.2 and 2.4 µM), the cells exhibited moderate spreading, with impedance levels intermediate between the control and the higher-dose treatments. These results indicate that c CAMPT’s effect on cell spreading is dose-dependent, with higher doses significantly impeding the process.
In summary, the impedance data clearly illustrate that cell spreading is affected by CAMPT concentration, with reduced spreading correlating with lower impedance values over time, especially at higher drug concentrations. This provides insight into how CAMPT interferes with the cytoskeletal dynamics that are crucial for cell spreading.
4.5. EGCG Potentiation Disrupts CAMPT’s Mechanistic Pathway
The study expected increased apoptotic activity in CAMPT-treated cells and decreased apoptotic levels for oxidative stress-induced cells treated with EGCG. In comparison to the control, CAMPT-treated cells show a significant decrease in optical density (OD) (
Figure 9), signifying minimal apoptotic activity and that CAMPT may be independent of the caspase-3 pathway. When those oxidative stress-induced cells were plated with EGCG, OD decreased. Although the expected results were not seen, this suggests that EGCG inhibits CAMPT-induced apoptosis and can protect cells against the effect of CAMPT by disrupting another caspase pathway or alternative mechanism. CAMPT may better induce apoptosis in the cells with a different initiator, caspase other than caspase-3.
However, in a previous study, researchers mentioned that while lower doses of CAMPT invoke higher caspase activity, higher doses of CAMPT decrease activity in caspase-3 and caspase-9 [
10]. They found enhanced caspase-9 activity when 3-methyladenine (3-MA) inhibited CAMPT-apoptosis. Unlike caspase-3, an executioner caspase, caspase-9 is an initiator caspase that initiates the apoptotic signal. In the future, a lower concentration of CAMPT (<4.8 µM) could be used for this study to exemplify higher OD in CAMPT.
4.6. Limitations and Future Considerations
The impedance of biological systems is complex due to the combined influences of cellular architecture, including membrane properties, ion channels, and intracellular components. Impedance measurements are essential for discerning the dielectric properties, such as conductivity and permittivity, of biological materials, which are indicative of cellular health and function [
39]. Specifically, the cell membrane contributes to the capacitive component of the impedance, while the cytoplasm is responsible for the resistive component. The capacitive behavior arises from the cell membrane acting as a dielectric barrier linked to the material’s permittivity.
By employing impedance spectroscopy across a range of frequencies, it is possible to separate the contributions of conductivity at higher frequencies from permittivity at lower frequencies [
40]. The Cole–Cole model aids in extracting specific electrical parameters by fitting impedance data to its characteristic semicircle [
41]. Furthermore, analyzing the phase angle helps differentiate capacitive from resistive properties, enhancing the understanding of the material’s electrical behavior [
42]. Thus, impedance measurements not only provide direct biological response assessments but also infer critical electrical behaviors for applications in medical diagnostics and tissue engineering [
43].
In our study, we measured impedance at a single frequency, which provides only a snapshot of the combined effects of conductivity and permittivity. However, this approach does not allow us to decouple these components. To fully characterize the electrical properties of the cells, multi-frequency impedance measurements are required, as biological systems exhibit different electrical properties at different frequencies. Techniques like impedance spectroscopy are essential for this purpose, enabling the independent extraction of both frequency-independent conductivity and permittivity.
While this study focused on using overall impedance changes as a proxy for cellular behavior—particularly in response to oxidative stress induced by camptothecin and its mitigation by EGCG—future work could benefit from employing multi-frequency impedance analysis. This would allow for a more detailed characterization of the dielectric properties of the cells, including the ability to extract permittivity and conductivity more specifically.
Another limitation of this study is that we did not explicitly account for the effects of electrode polarization during the impedance measurements. Electrode polarization can introduce additional impedance, especially at lower frequencies, by affecting the electrode–medium interface. Accurate assessments, however, require careful calibration and consideration of electrode polarization effects [
39]. This additional impedance can influence data accuracy by adding a non-cell-specific component.
In future studies, incorporating multi-frequency impedance measurements would better distinguish between the effects of electrode polarization and cellular impedance. Additionally, techniques such as electrode modeling or electrode-specific calibration can be employed to minimize the impact of electrode polarization. These improvements would provide more accurate representations of cell-specific behaviors, such as attachment and spreading, leading to a more precise analysis of cellular responses.
We acknowledge these limitations in our current approach and suggest that future research apply these methods to enhance the quality of data obtained in ECIS-based studies.
5. Conclusions
This study demonstrates the multi-faceted effects of epigallocatechin gallate (EGCG) and camptothecin (CAMPT) on UMR cells, a type of mammalian cell. Notably, EGCG, at lower concentrations, enhances cell viability, while camptothecin serves as an oxidative stressor, diminishing cell viability as its concentration escalates. Remarkably, EGCG also offers protection to cells against oxidative stress, indicating its potential therapeutic value in oxidative stress-related conditions.
Moreover, a salient feature observed in this study is the decrease in cell impedance in a concentration-dependent manner, which is captured effectively by the Electric Cell-Substrate Impedance Sensing (ECIS) technology. This observation might provide crucial insights into the physiological states of the cells and the alterations induced by the two compounds.
In conclusion, EGCG shows promise as a therapeutic agent, with its ability to mitigate the effects of the oxidative stressor, CAMPT, on UMR cells. However, the exact mechanism underlying these effects warrants further investigation. Additionally, future studies exploring the effects of these compounds across a range of cell types and conditions would be beneficial, potentially opening new avenues for their application in the biomedical field.

