1. Introduction
The development of cycling components is driven by the continuous performance improvement of professional athletes. Due to the alignment of performance at very high levels, even small differences in specific details, sometimes seemingly of limited importance, can have significant consequences on race outcomes. On the other hand, amateur cyclists can benefit from such advancements with effects, if not on performance, then on other aspects such as riding comfort.
In this paper, we focus in particular on the effects of bike tires on vibrations. Until a few years ago a common recommendation was to use thin tires, for example, with a cross section of 23 mm, inflated at very high pressure, such as 8 bar or more. The main reason was related to rolling resistance, as a small contact area with the road was considered a major advantage. However, such high pressures combined with small cross sections made the tire very stiff, with reduced damping effect on vibrations transmitted from the road, through the contact area, to the bike frame, handlebar, seat-post, and ultimately to the cyclist.
In recent years the trend in professional cycling has shifted toward wider tires inflated at lower pressures, a sort of counter trend compared with the previous situation. The main motivation is related to the improved ability to transmit power from the wheel to the road. In fact, a tire with a larger cross section and a lower inflation pressure has a wider and larger footprint, enabling it to maintain ground contact even when small asphalt irregularities would otherwise cause a brief loss of contact, as happens with narrow, high pressure, tires. This advantage appears to outweigh the potentially higher rolling resistance which is being continuously reduced through the development of new materials and tread designs. Beyond performance optimization [
1,
2] there are also secondary benefits, such as better absorption of asphalt irregularities and the consequent reduction in vibration transmission from the ground to the bike frame and the cyclist.
Vibration is actually a significant issue not only for comfort but also for performance and safety [
3]. Professional riders spend long periods on the bike and thus, vibrations can impact performance. At the physiological level exposure to vibrations can increase oxygen consumption [
4], a key parameter directly related to maximal performance. Moreover, prolonged exposure over a professional rider’s career may increase the risk of musculoskeletal disorders [
5]. This issue is generally relevant when considering the health of workers exposed to vibrations. To evaluate the risk of vibrations-related injuries, it is important to distinguish between vibrations transmitted to the hands and those affecting the whole body [
3,
6]. In our specific case, the concern relates to the handlebar, the different hand positions available on it, and the saddle. Current standards regulate the measurement and processing procedures used to determine exposure levels [
7,
8].
These considerations have driven the development of technical apparel such as shorts and gloves with vibration-absorbing pads. Nevertheless when asphalt is in poor condition, as on mountain roads or in specific races like Paris–Rubaix, on cobblestones [
9], Strade Bianche, or on white gravel roads [
10], vibration exposure remains a significant issue.
The focus of this paper is a measurement system and processing procedure useful to evaluate the vibrations transmitted to the cyclist during a real ride on the road. In particular, the application regards the tires’ effects on the solicitations transmitted through the saddle and the handlebar. The paper begins with a review of the state of the art, then introduces the measurement system, its design, and laboratory tests. The experimental setup and procedure are described, followed by the presentation of results in both time and frequency domains. A statistical analysis using analysis of variance is then conducted. Finally, a proposal for a predictive model will be presented. The paper concludes with a discussion and summary of the findings.
2. State of the Art
The literature regarding vibration transmitted to the cyclist can be organized into four main categories:
Vibration reproduction in the laboratory through the development of experimental setups capable of simulating road-induced vibrations. Under such conditions, it is possible to analyze vibrations in detail and isolate the specific effects of vibrations transmitted from the bike to the rider.
In-field analysis focusing on an instrumented bicycle operating on real roads. The emphasis here is often on the effects of different types of asphalt, speed wheel properties, and sometimes tire pressure and other characteristics.
Physiological effects and biomechanical issues, such as perceived comfort and possible neuromuscular effects.
Comfort and vibration absorption through the development of new, specialized garments.
In the following paragraphs we consider some references that provide insights or are in some way related to the present work.
Lepine et al. [
11] proposed different solutions to generate vibrations in the laboratory: a double shaker setup acting directly on the bicycle wheels, or a treadmill with wooden slats producing mechanical solicitations to the wheels. In both cases accelerometers where placed on the headtube and under the saddle to focus on the contact points with the cyclist. Results demonstrated that hand positions and wrist angles are important factors affecting the transmitted vibrations together with the wheel type. It is worth noting an important limitation of these studies: the cyclists were not pedaling and so the biomechanical validity of the evaluation is limited.
Marelli et al. [
12] proposed the use of an electrodynamic shaker connected to the front fork while the cyclist pedals on rollers. Drouet et al. [
13] used a mechanical device that solicitated only the handlebar in a treadmill-based configuration similar to the previous one. In this case too, the cyclist remained stationary on the bike and was not pedaling; moreover, the bicycle was kept balanced by external elastic cables. The focus of this study was on the handlebar ribbon tape and gloves. Results showed a remarkable reduction in transmitted energy when both were used.
Sanseverino et al. [
14] developed a sophisticated setup based on bike rollers that enabled the cyclist to pedal normally while an actuator reproduced on the handlebar a real vibration profile previously recorded on the road. The study focused on different glove types, but the analysis of variance, based on the acceleration measured on the handlebar, did not demonstrate any statistically significant effect of the considered factors.
Finally, Champoux et al. [
15] studied the dynamic behavior of the bike frame without a cyclist to identify its frequency response. They demonstrated that most of the vibration energy induced by realistic road conditions is below 200 Hz.
As regards to vibration measurement under real road conditions, the most similar conditions to the presented one, Olieman et al. [
16], used wireless sensors at four points on the bicycle: wheels axels, headtube, and seat-post. In such a way they were able to trace the transmission of vibrations from the wheels to the contact points, obtaining the transfer functions associated with the bicycle components. Interestingly their analysis focused on the 0–100 Hz frequency band, confirming the order of magnitude previously identified in laboratory settings. Tests were conducted on both mountain and road bikes. In the former, tire pressure was investigated, and in the latter, bike speed. Results showed that both factors significantly affect vibration exposure, while the type of wheelset was not found to be a major contributor. Road conditions are of course important for both road and off-road cycling. Ismail et al. [
17] investigated the effects of different terrains on vibrations in mountain biking. Again, spectral analysis results showed energy concentrated below 100 Hz, with only minor contributions from the 100–200 Hz band. Moreover, tire dimensions were found to be important both for vibration exposure and for perceived comfort.
Giubilato e Petrone [
18] investigated the effect of wheel characteristics by varying materials and spoke distribution, while keeping the same tire. They also considered different road roughness at constant speed. Their results confirmed that the majority of vibrational energy is localized in the 0–80 Hz band, in line with other studies.
Sanseverino et al. [
19] investigated the influence of inflation pressure and cycling speed across different types of pavements. Through analysis of variance they demonstrated that speed had a major effect, while pressure was also significant but to a lesser extent.
Bicycle riding comfort is a delicate topic, including bike setup issues as in Scoz [
20], road conditions as in Miah [
21] and Ahmed [
22], and subjects’ feedback as in Shoman [
23]. Comfort is even more important in the present day as urban mobility is changing due to the consideration of the environmental impact of public transport, as in [
24].
An interesting study for urban cycling is that by Taylor et al. [
25], who compared vibration levels before and after asphalt resurfacing in Edinburgh. Their focus was on health protection, using ISO standard 5349-1 [
8] as a reference. Results showed that when asphalt conditions were poor, the action threshold defined by the standard was easily exceeded, while after resurfacing, vibration levels were well below the limit. This finding is particularly relevant for public authorities in cities where bicycle transport is widespread.
Vanwalleghem et al. [
26] focused on cyclist comfort. They integrated sensors into structural elements of the bicycle, such as strain gauges, accelerometers, and load cells. Their results not only confirmed the fundamental role of road conditions, but also showed that the cyclist’s position on the saddle significantly influenced vibration comfort.
A similar measurement approach can be used to estimate from the bicycle vibration the road conditions, providing useful information to public managers. This is possible by using specific bicycle setups, as presented by Li [
27], or by using modified intelligent equipment, as in Ahmed [
28]. From the vibration information it is possible to establish road indexes useful for managing urban mobility, as proposed by Lee [
29].
In this scenario the present work proposes a new measurement system focused on vibration transmitted to the cyclist during normal road riding or eventually off-road riding. It is able to log and eventually pre-process the measurement data for online feedback to the cyclist; is controllable remotely or onboard; is battery operated for several hours of continuous measurement; easily movable on different bikes; and has the possibility to install the sensors in the preferred positions. As far as the authors know, such a versatility is new in the current development of cycling related instrumentation. Moreover, the selected test case is particular, since it aims to investigate tire-related parameters while keeping under strict control other possible influence factors. Such controlled and tire-focused approaches are not present, as far as we know, in the literature when considering measurements on standard roads.
3. Measurement System
Our focus is on the effects of tire characteristics primarily on handlebar and seat-post vibrations during normal road riding. For this purpose, a portable, self-powered measurement system is required, capable of gathering sensor data at an appropriate sampling frequency, storing them in permanent memory, and allowing data to be downloaded via a wireless connection or by directly accessing the memory card at the end of the trial. In addition to these functional requirements, ease of use and low overall cost are important, so that in principle it would be possible to distribute such systems among cyclists to monitor their vibration exposure. Beyond these functional needs, some typical measurement specifications can be defined based on the analysis of the state of the art, in particular regarding the frequency band to be investigated [
15,
16,
17,
18].
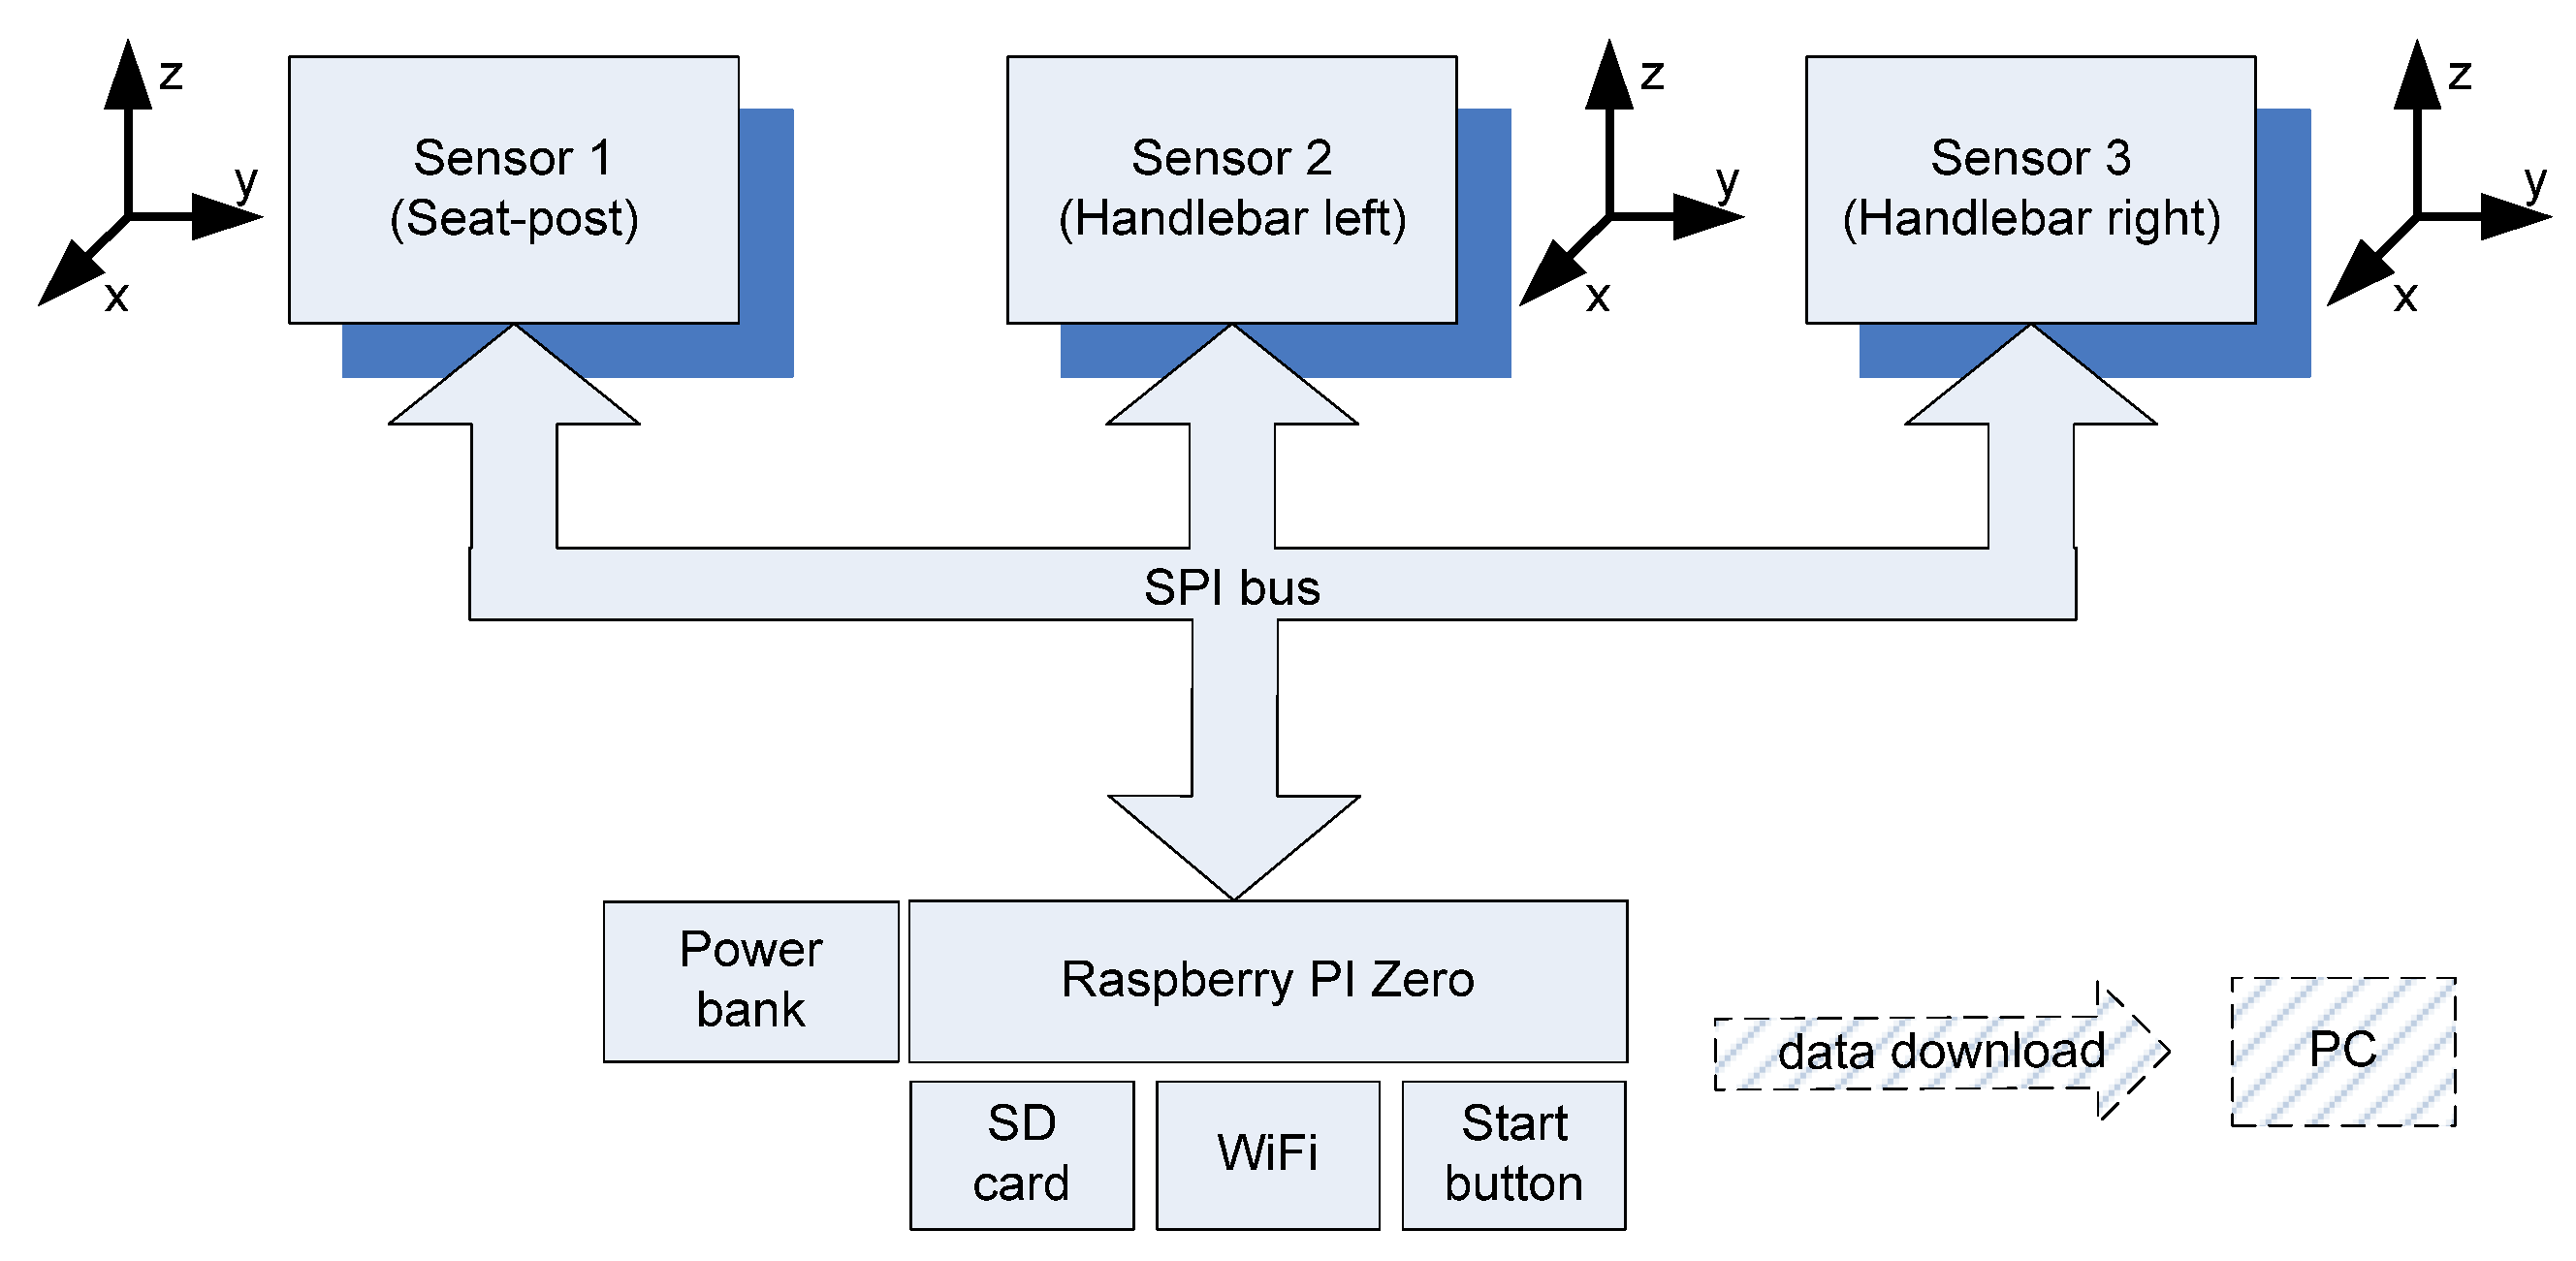
In this context, the designed measurement system is shown in
Figure 1.
Triaxial micro electro mechanical system (MEMS) accelerometers with digital output were selected to avoid the need for an analog-to-digital converter (ADC) board. This choice presents both advantages and drawbacks. Firstly, MEMS sensors are generally not recognized for their metrological performance, but they are well known for their miniaturization and low cost. In this stage the use of standard piezoelectric accelerometers would have increased costs and slightly complicated signal management. Secondly, the digital output limits the possibilities of analog processing, such as signal filtering or amplification. However this limitation is acceptable if digital sensors are available with appropriate measurement ranges, built-in filtering options, and adequate sampling frequencies. In detail, an industrial piezoelectric accelerometer suitable for this application [
30] can achieve a few kHz bandwidth, with tolerances of ±10% in module and ±5 deg in phase. The standard sensitivity is about 100 mV/g, with a measurement range of about 10 g. Considering proper amplification and a 12-bit ADC with 10 V range, the resolution would be about 2 mV, corresponding to 2 × 10
−3 g. Expected noise floor would be far below resolution (about 0.35 × 10
−3 g). The proposed system (
Table 1) has a rather limited bandwidth, with larger tolerances affecting the dynamic measuring uncertainty (see
Section 4). The resolution and measurement ranges are similar, and the noise floor is still below resolution, so it is not observable by the proposed measurement system.
Measurement uncertainty in dynamic conditions is influenced by sensor sensitivity and frequency response [
31]. Both detailed [
32] and simplified approaches are available for estimating measurement uncertainty; in addition, compensation strategies can be applied to reduce dynamic measurement uncertainty when sensors are used at the limits of their performance [
33]. In this application, even if the proposed measurement system has a larger dynamic uncertainty compared to a traditional piezoelectric measurement chain, the variability of the measurement results due to experimental conditions, such as pavement and driving behavior, is by far more significant than the limitations of the sensors themselves. Moreover, since the focus here is on the cyclist and not on the mechanical behavior of the overall bicycle, the bandwidth seems to be sufficient for the purpose.
The digital output can be transmitted using different communication buses: I2C and SPI are the most diffused among such devices. I2C was excluded due to its lower transmission rate. In fact, assuming a sampling frequency of 2 kHz, a minimum of 3 triaxial sensors, and a 2-byte output per axis, the resulting net data transmission load is about 300 kbit/s. This is relatively high for I2C (whose fast mode has a raw rate of 400 kbit/s), but well within the capabilities of the SPI interface (which supports speeds > 10 Mbit/s).
Among the relatively few MEMS sensors that meet both technical and functional specifications, the selected device is the ST Microelectronics LIS 3DH [
34], the main characteristics of which are summarized in
Table 1.
Interesting features of the sensor include the relatively high sampling frequency, the ability to adapt the measurement range to obtain reasonable resolution, and the presence of an internal anti-aliasing filter.
In this first application, the acquisition system is required to handle only SPI communication and data logging. The proposed solution is based on a Raspberry Pi Zero 2W (Raspberry Pi, Cambridge, UK) which offers onboard Wi-Fi connectivity without the need for external modules, and includes an SD card slot useful for data storage. Moreover, the ARM processor onboard is, in principle, capable of performing real-time processing to directly evaluate vibration exposure. The system is powered by a 5000 mAh power bank with a maximum output current of 2 A. The Raspberry Pi, power bank, on/off switch, and a start/stop button are enclosed in a tool bottle container that fits into a standard bike bottle holder. CAT 6 ethernet cables were used to connect the Raspberry Pi to each sensor in a star configuration, as presented in
Figure 1. In this setup, the maximum cable length is approximately 0.8 m, more than sufficient for installing the sensors on the bicycle.
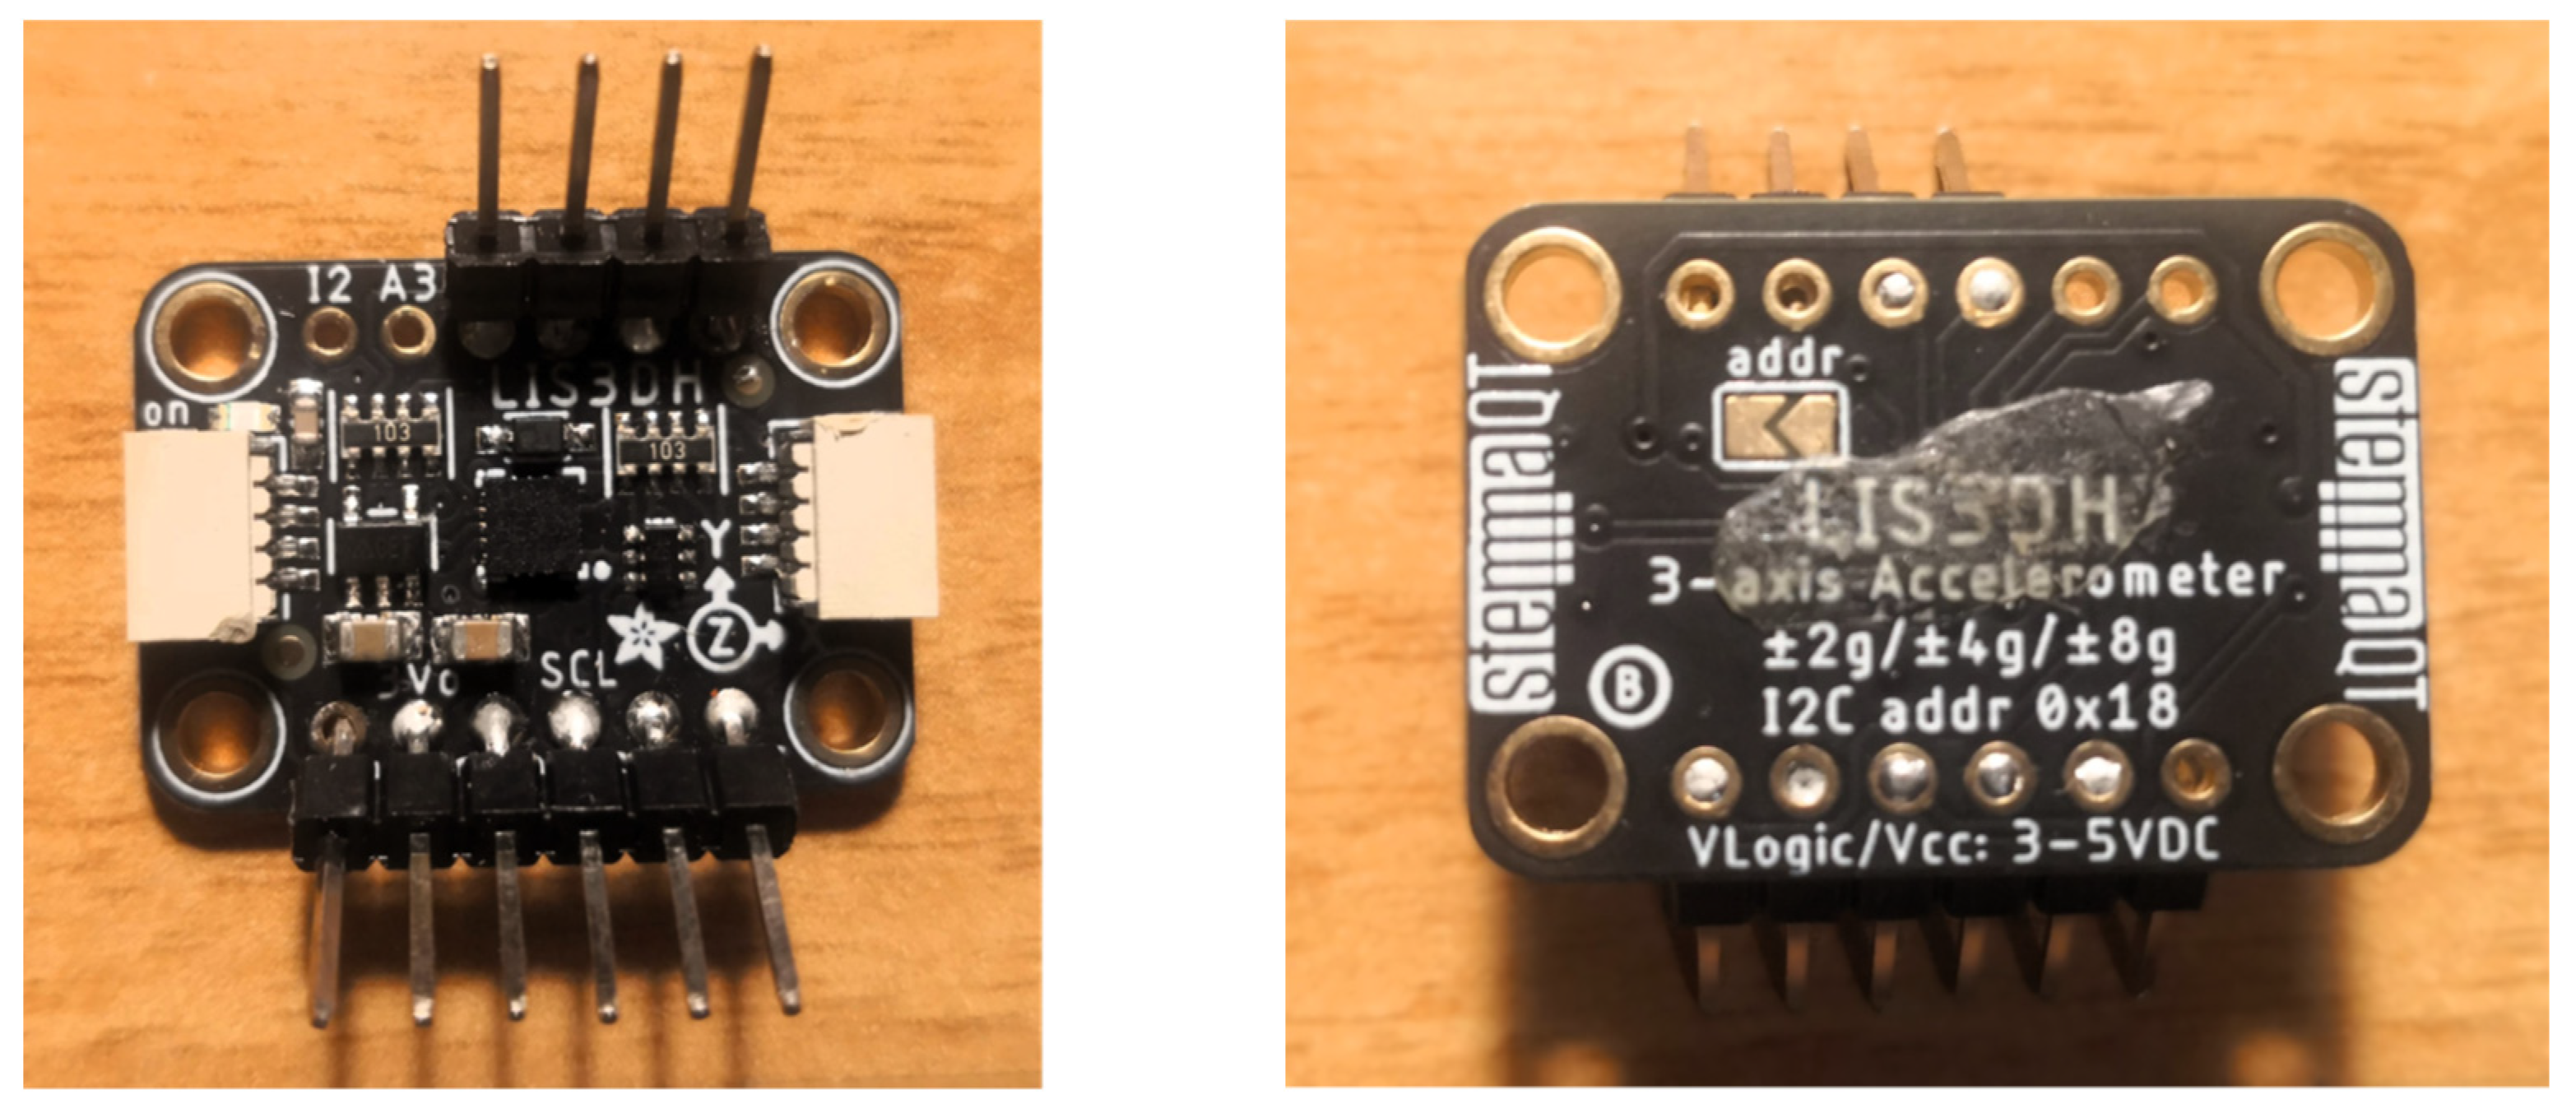
Pins were soldered on the sensors in such a way as to maintain a completely flat surface on the backside (
Figure 2), allowing flat installation on the surface while ensuring correct axis orientation.
The Raspberry Pi operating system is Pi OS Lite 32 bit, without graphical interface, in order to minimize system load. The OS is preloaded on a 16 GB class 10 SDHC memory card, which is also used to store data acquisitions as individual files for each trial. The system is configured to automatically connect to Wi-Fi and to enable Secure Shell (SSH) access, allowing the device to be controlled via a personal computer, thus eliminating the need for input devices or a monitor.
The system management code is written in Python 3, and it is executed at startup. After boot, it waits for the acquisition to begin, which is triggered either by pressing the start button or by sending a command via Wi-Fi, provided that the control PC is within connection range with the instrumented bicycle.
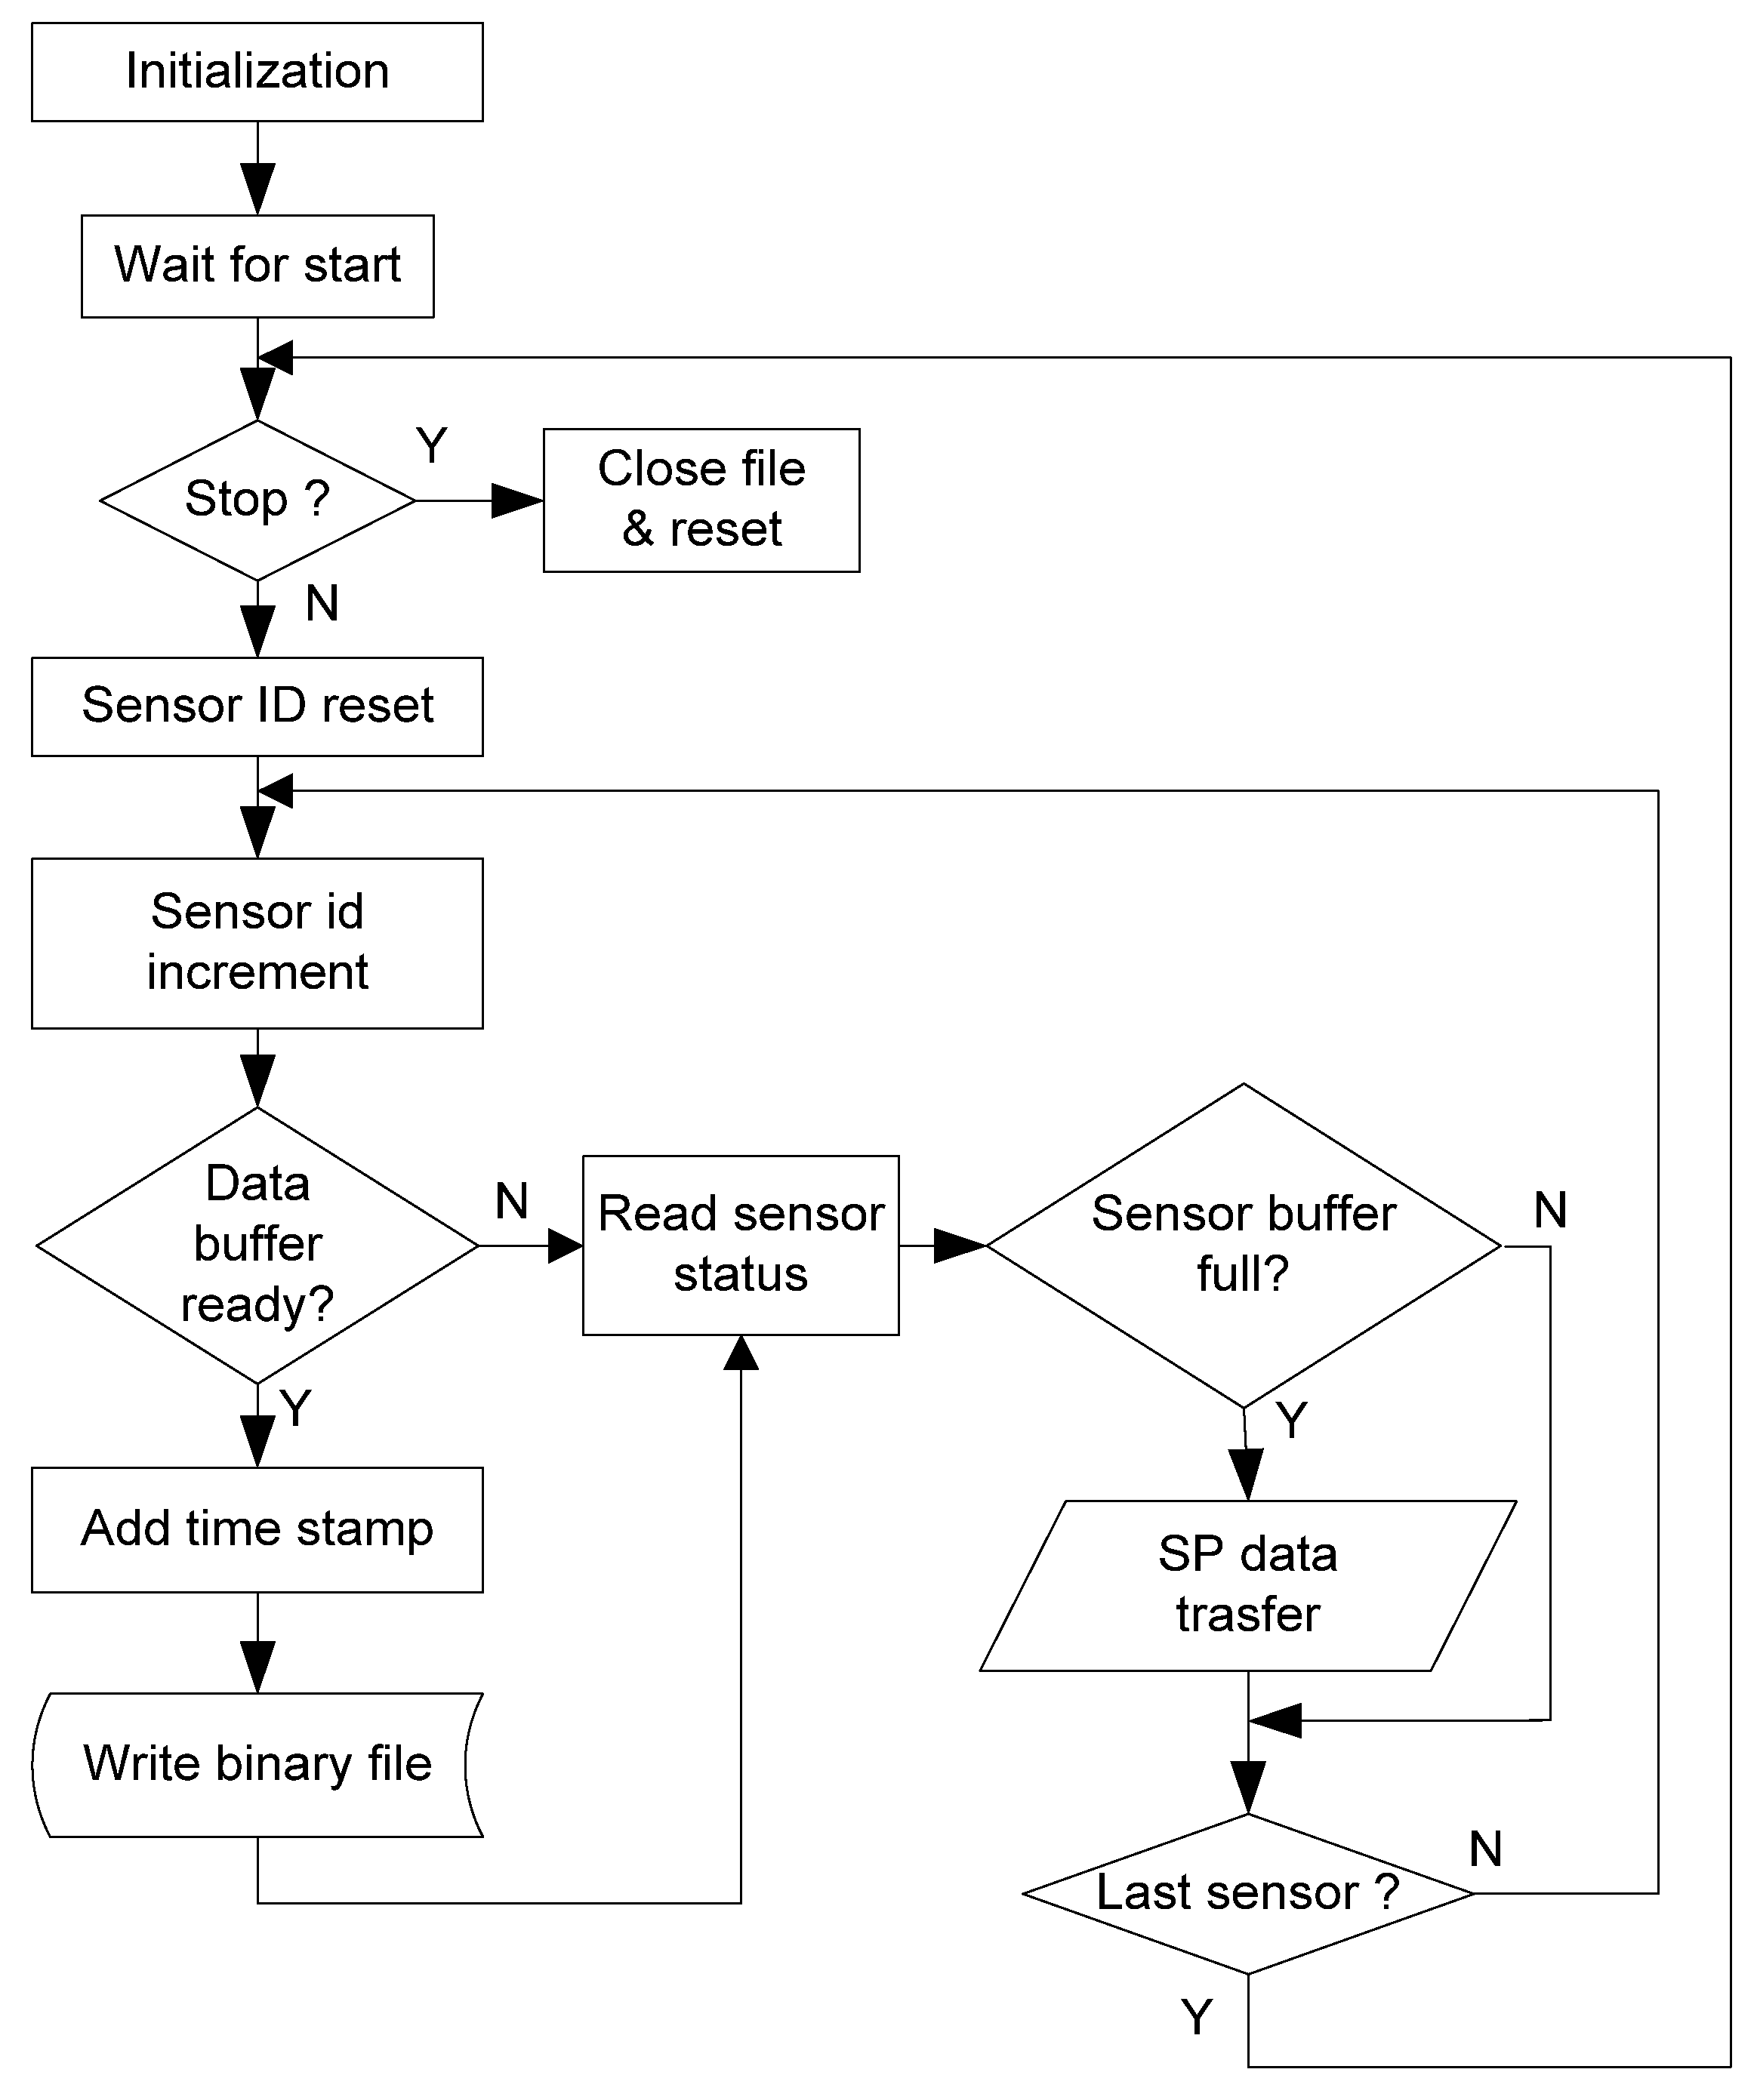
The code follows the flowchart depicted in
Figure 3.
The first part mainly concerns the setup of the SPI interface and the configuration of the sensors for the specific application. The configuration used is shown in
Table 2, along with the corresponding registers and their values.
After the start command, either via button or Wi-Fi, the sensors are activated and then queried to check for the availability of data packets. Data transfer and storage have been optimized through preliminary trials to maximize both system reliability and sampling frequency. Data are transferred when the sensor buffer reaches a specific number of samples (14 samples, as shown in the last row of
Table 2). Data are saved when a 32 kB data buffer on the Raspberry Pi is full, in order to minimize access to the SD card. A timestamp is added at the end of each data block and the entire block is written in binary format to the SD card. The timestamp is useful for verifying timing and managing potential delays in communication. Since the sensors are started simultaneously, synchronization is ensured by their internal sampling clocks. The same start button or a Wi-Fi command can be used to stop the acquisition.
4. Laboratory Validation
The measurement system in its final configuration was preliminary tested in the laboratory. First, a static trial was conducted to verify the internal sampling frequency of each sensor, their static sensitivity, and the robustness of the system. The latter was assessed through acquisitions longer than expected for the road trials, up to 15 min. Results showed a sensitivity difference between the three sensors of less than 5%. In addition, the effective sampling frequency of the sensors connected to the Raspberry Pi was verified using the internal timer, revealing deviations of less than 1.2% between the three sensors and a maximum deviation of 2.7% from the selected 1344 Hz, corresponding to about 35 Hz. These deviations, likely due to quality of the sensors’ internal oscillators, are acceptable for the application given the sampling frequency.
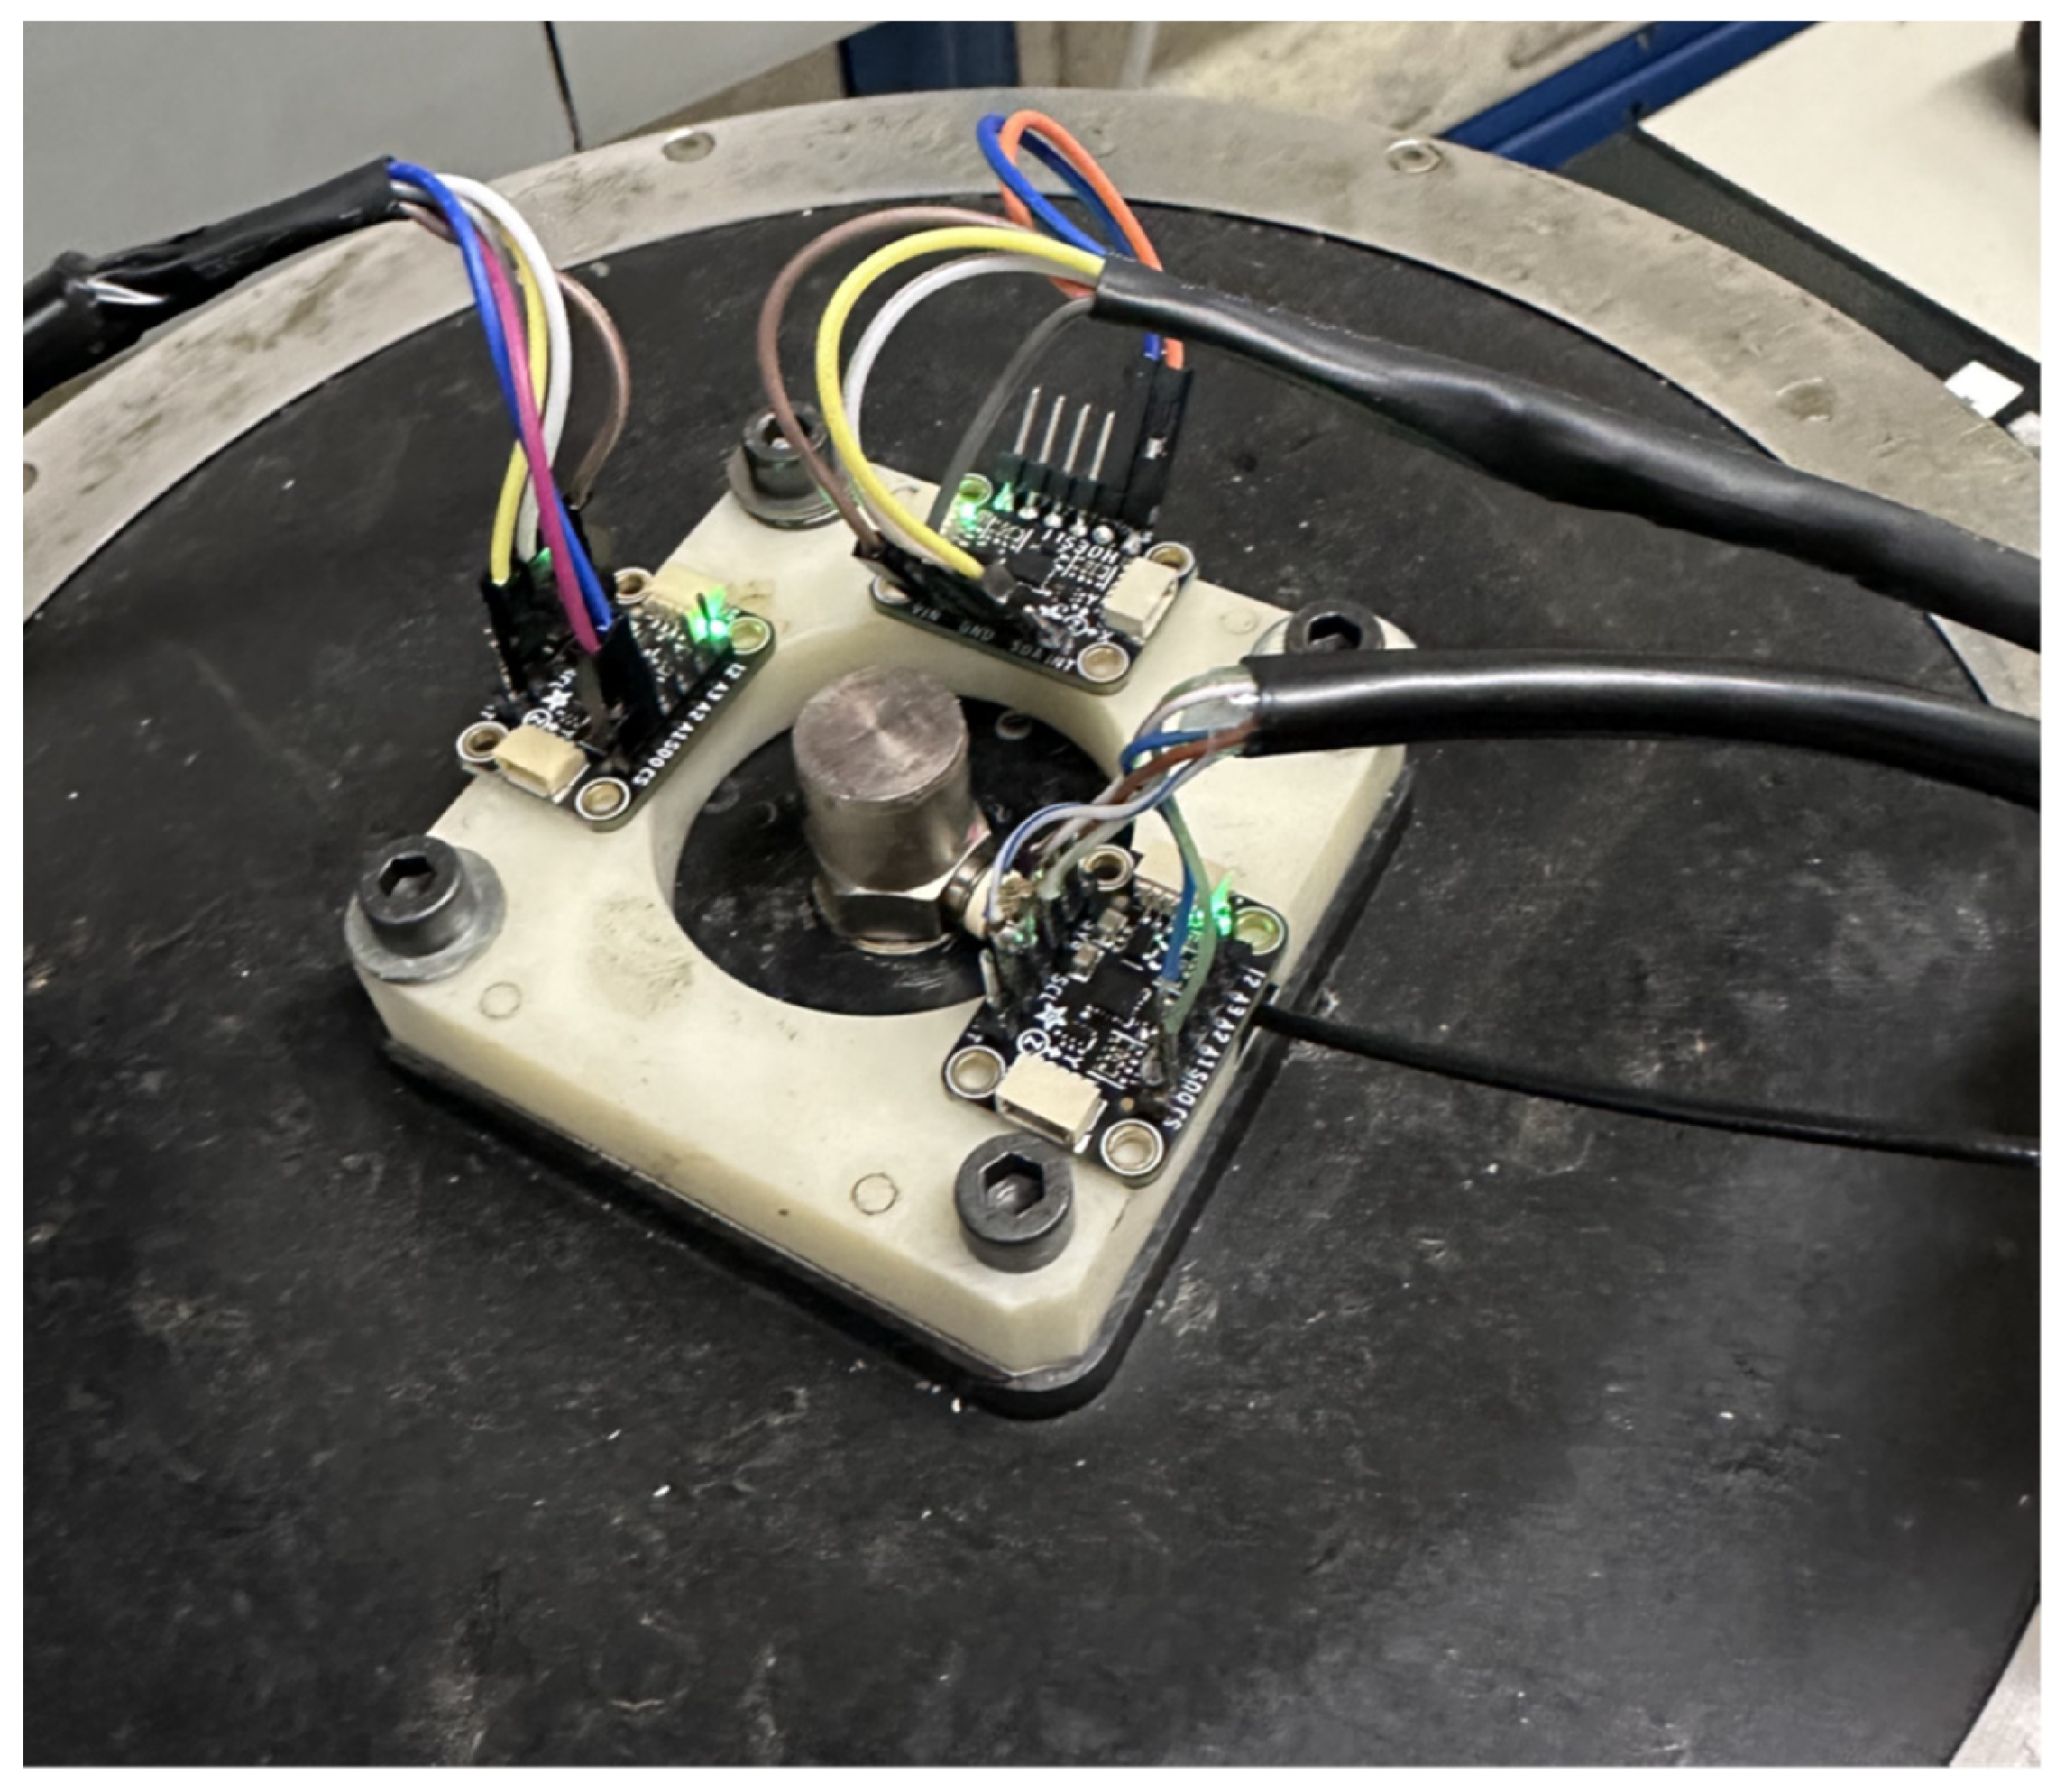
Once sensors were verified statically, they were mounted on an electromagnetic shaker controlled in a closed loop by a reference accelerometer for dynamic tests, see
Figure 4. The three sensors were tested along three axes using a sinusoidal excitation at a controlled frequency and amplitude. Tests were performed in the range of 10 Hz to 600 Hz, with acceleration levels of 10 and 20 m/s
2. Additional frequencies and amplitudes were used to: verify the proper functioning of the internal antialiasing filter; check the linearity of the output when increasing the acceleration level within the defined measuring range.
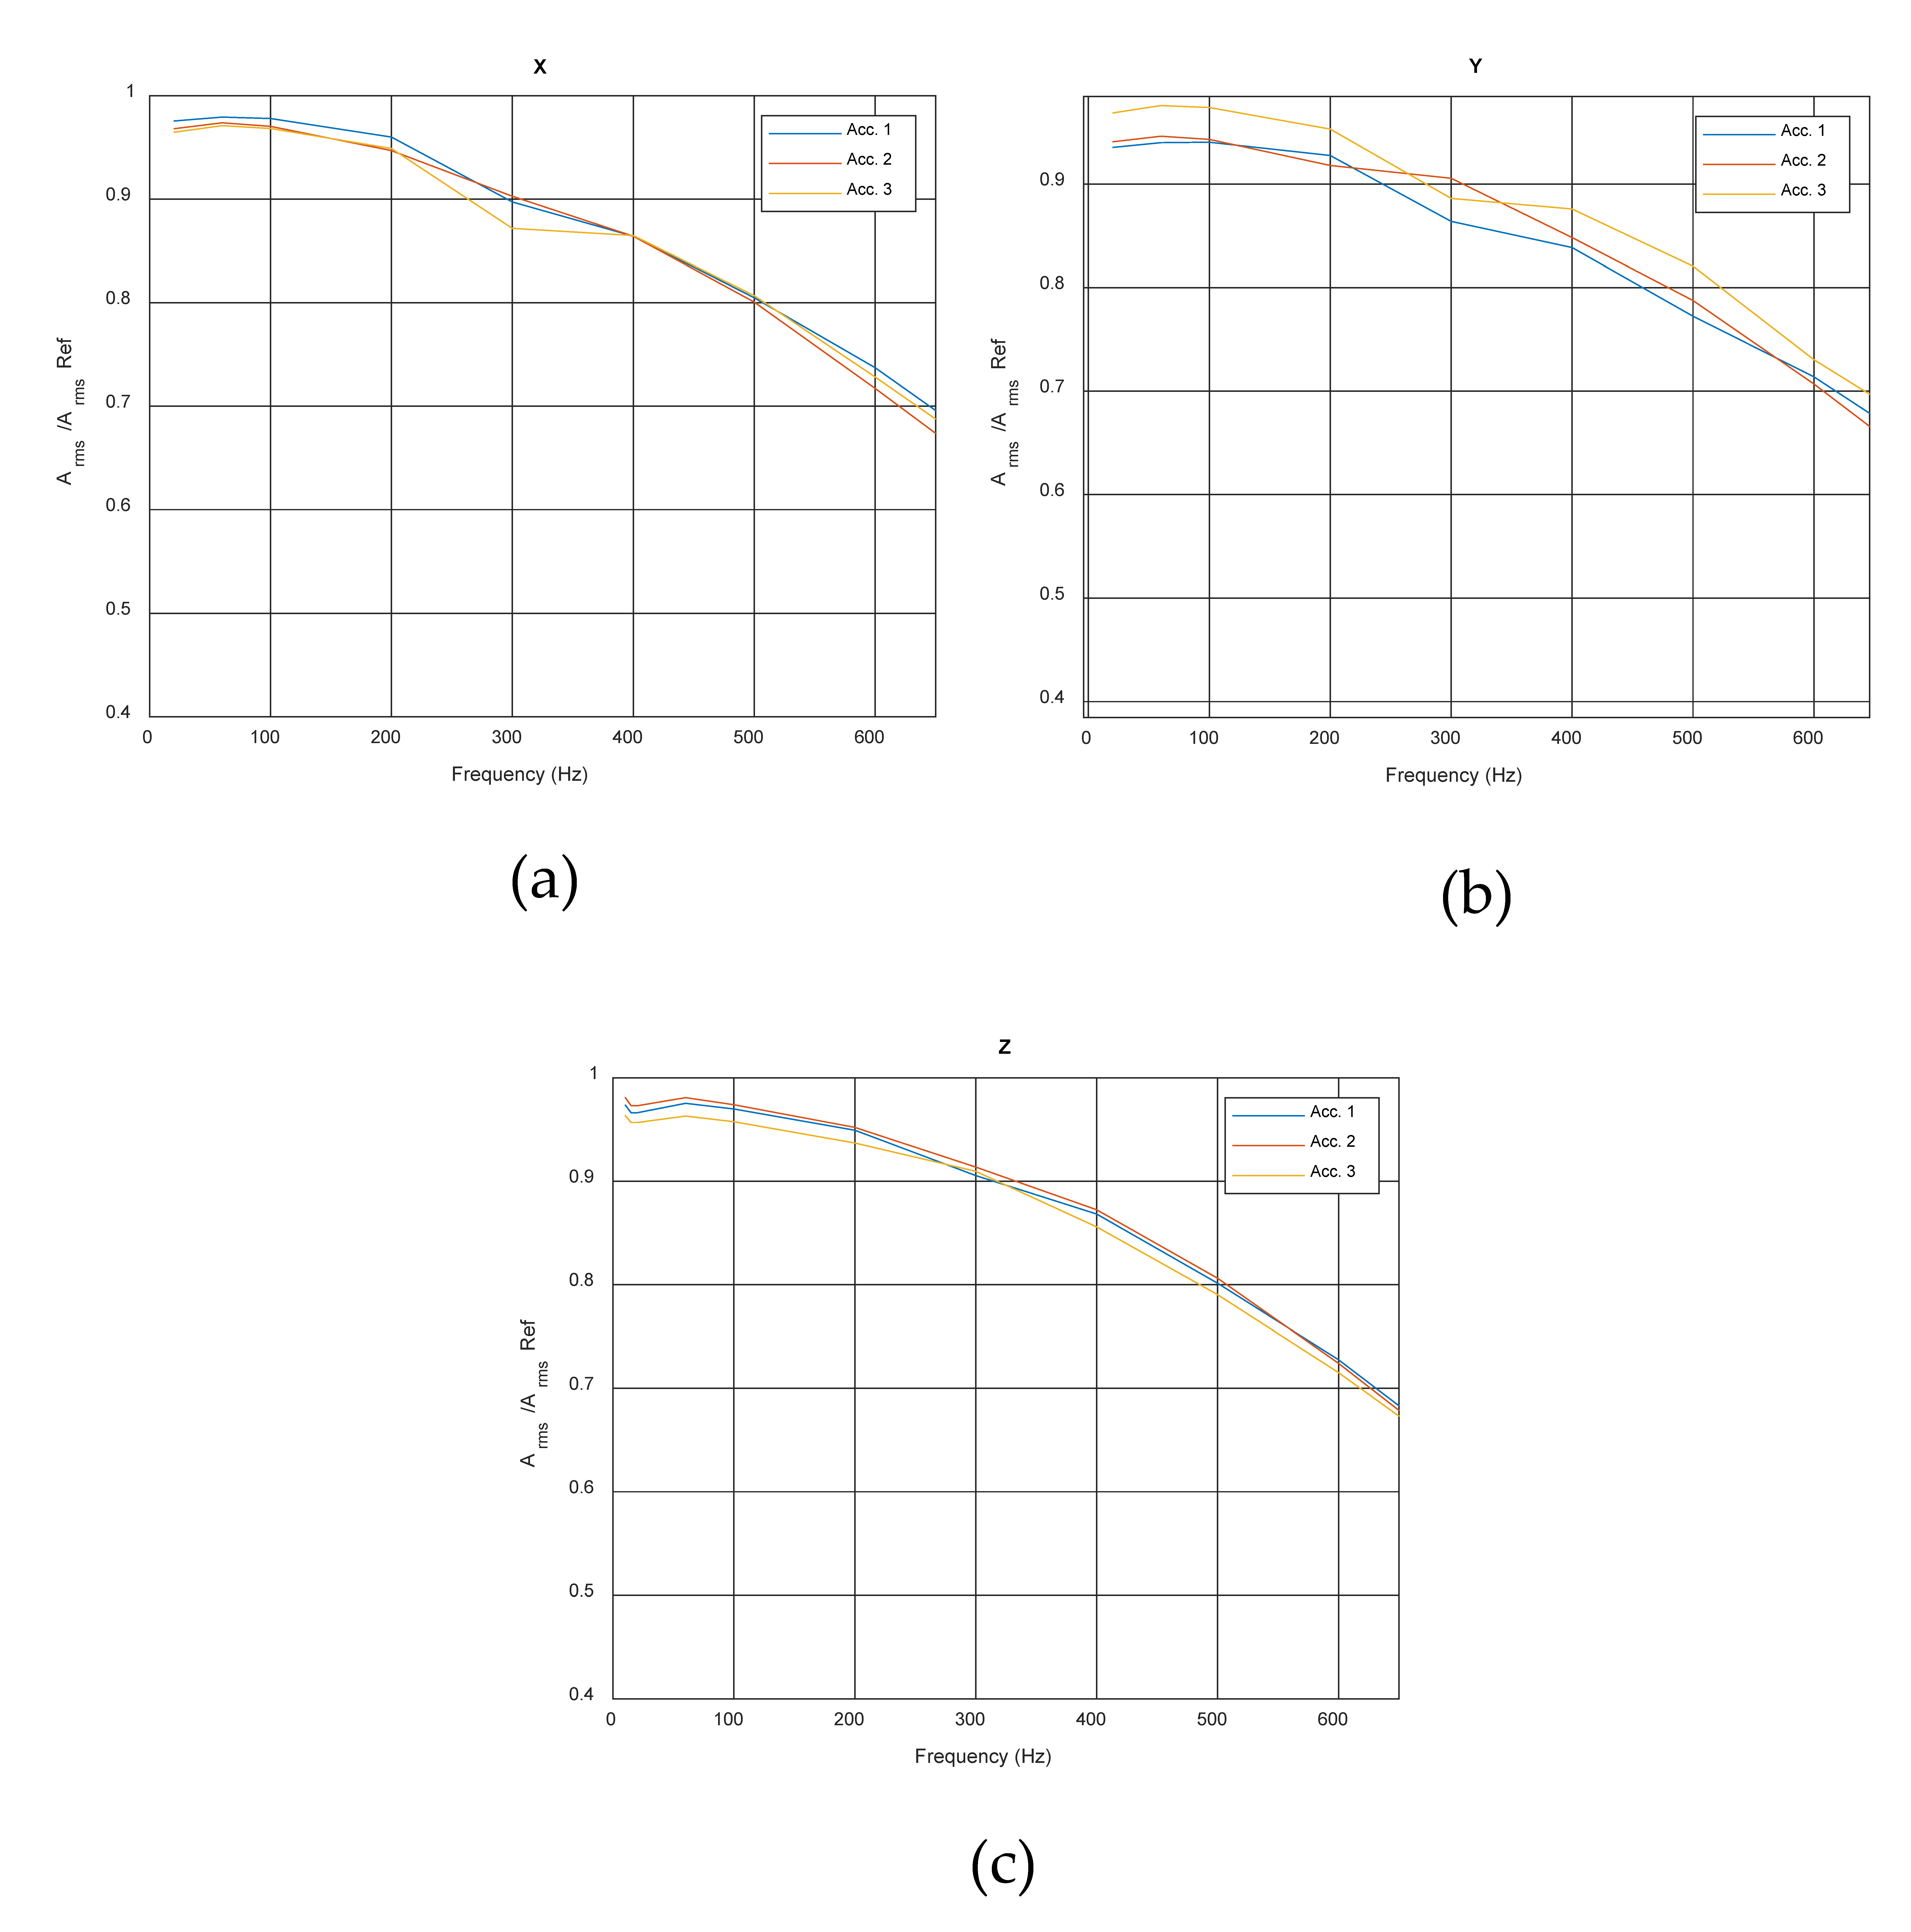
The overall frequency response of the three sensors along each axis is shown in
Figure 5.
The internal antialiasing filter appears to affect the signal at frequencies somewhat below the Nyquist limit. Nevertheless, a useful frequency band of approximately 400 Hz can be identified, with an amplitude tolerance of about 15%. On the one hand, this limited bandwidth prevents the evaluation of high-frequency components due to the dynamic behavior of some bicycle components, on the other hand, it is sufficient for the evaluation of the vibration transmitted to the cyclist as reported in the literature (see
Section 2 and [
15,
16,
17]).
5. Design of the Experiment and Test Procedure
The focus of the experiment is on the effects of tire configurations on vibrations. Therefore, we considered a single tire model—Vittoria Corsa PRO™, Vittoria, Brembate, Italy—configured either as tubeless or with an innertube, at different pressures, and with different section widths.
Table 3 summarizes the factors considered and their levels.
In addition to tire-related factors, bicycle speed was also considered, as the literature clearly demonstrates its significant effect [
18]. Considering a full factorial design, the experiment required 24 trials to investigate all conditions. All other factors that could potentially affect the results were kept as constant as possible. The same cyclist (male, 70 kg, height 1.76 m) and bike setup (carbon fiber frameset and cockpit, overall weight including wheels: 7.2 kg) were used in every trial. Even the wheelset (carbon fiber rim profile 50 mm with 24 steel spokes) remained unchanged, so tires were mounted and dismounted as needed. The trial sequence was planned to minimize both setup time and cyclist fatigue. Before the test session, the cyclist was fully informed about the experiment and their rights in accordance with the Helsinki Declaration, and they signed the informed consent form. Considering a double repetition for each experimental condition, the total time required to complete the experiment was approximately 4 h, allowing environmental conditions to remain nearly constant.
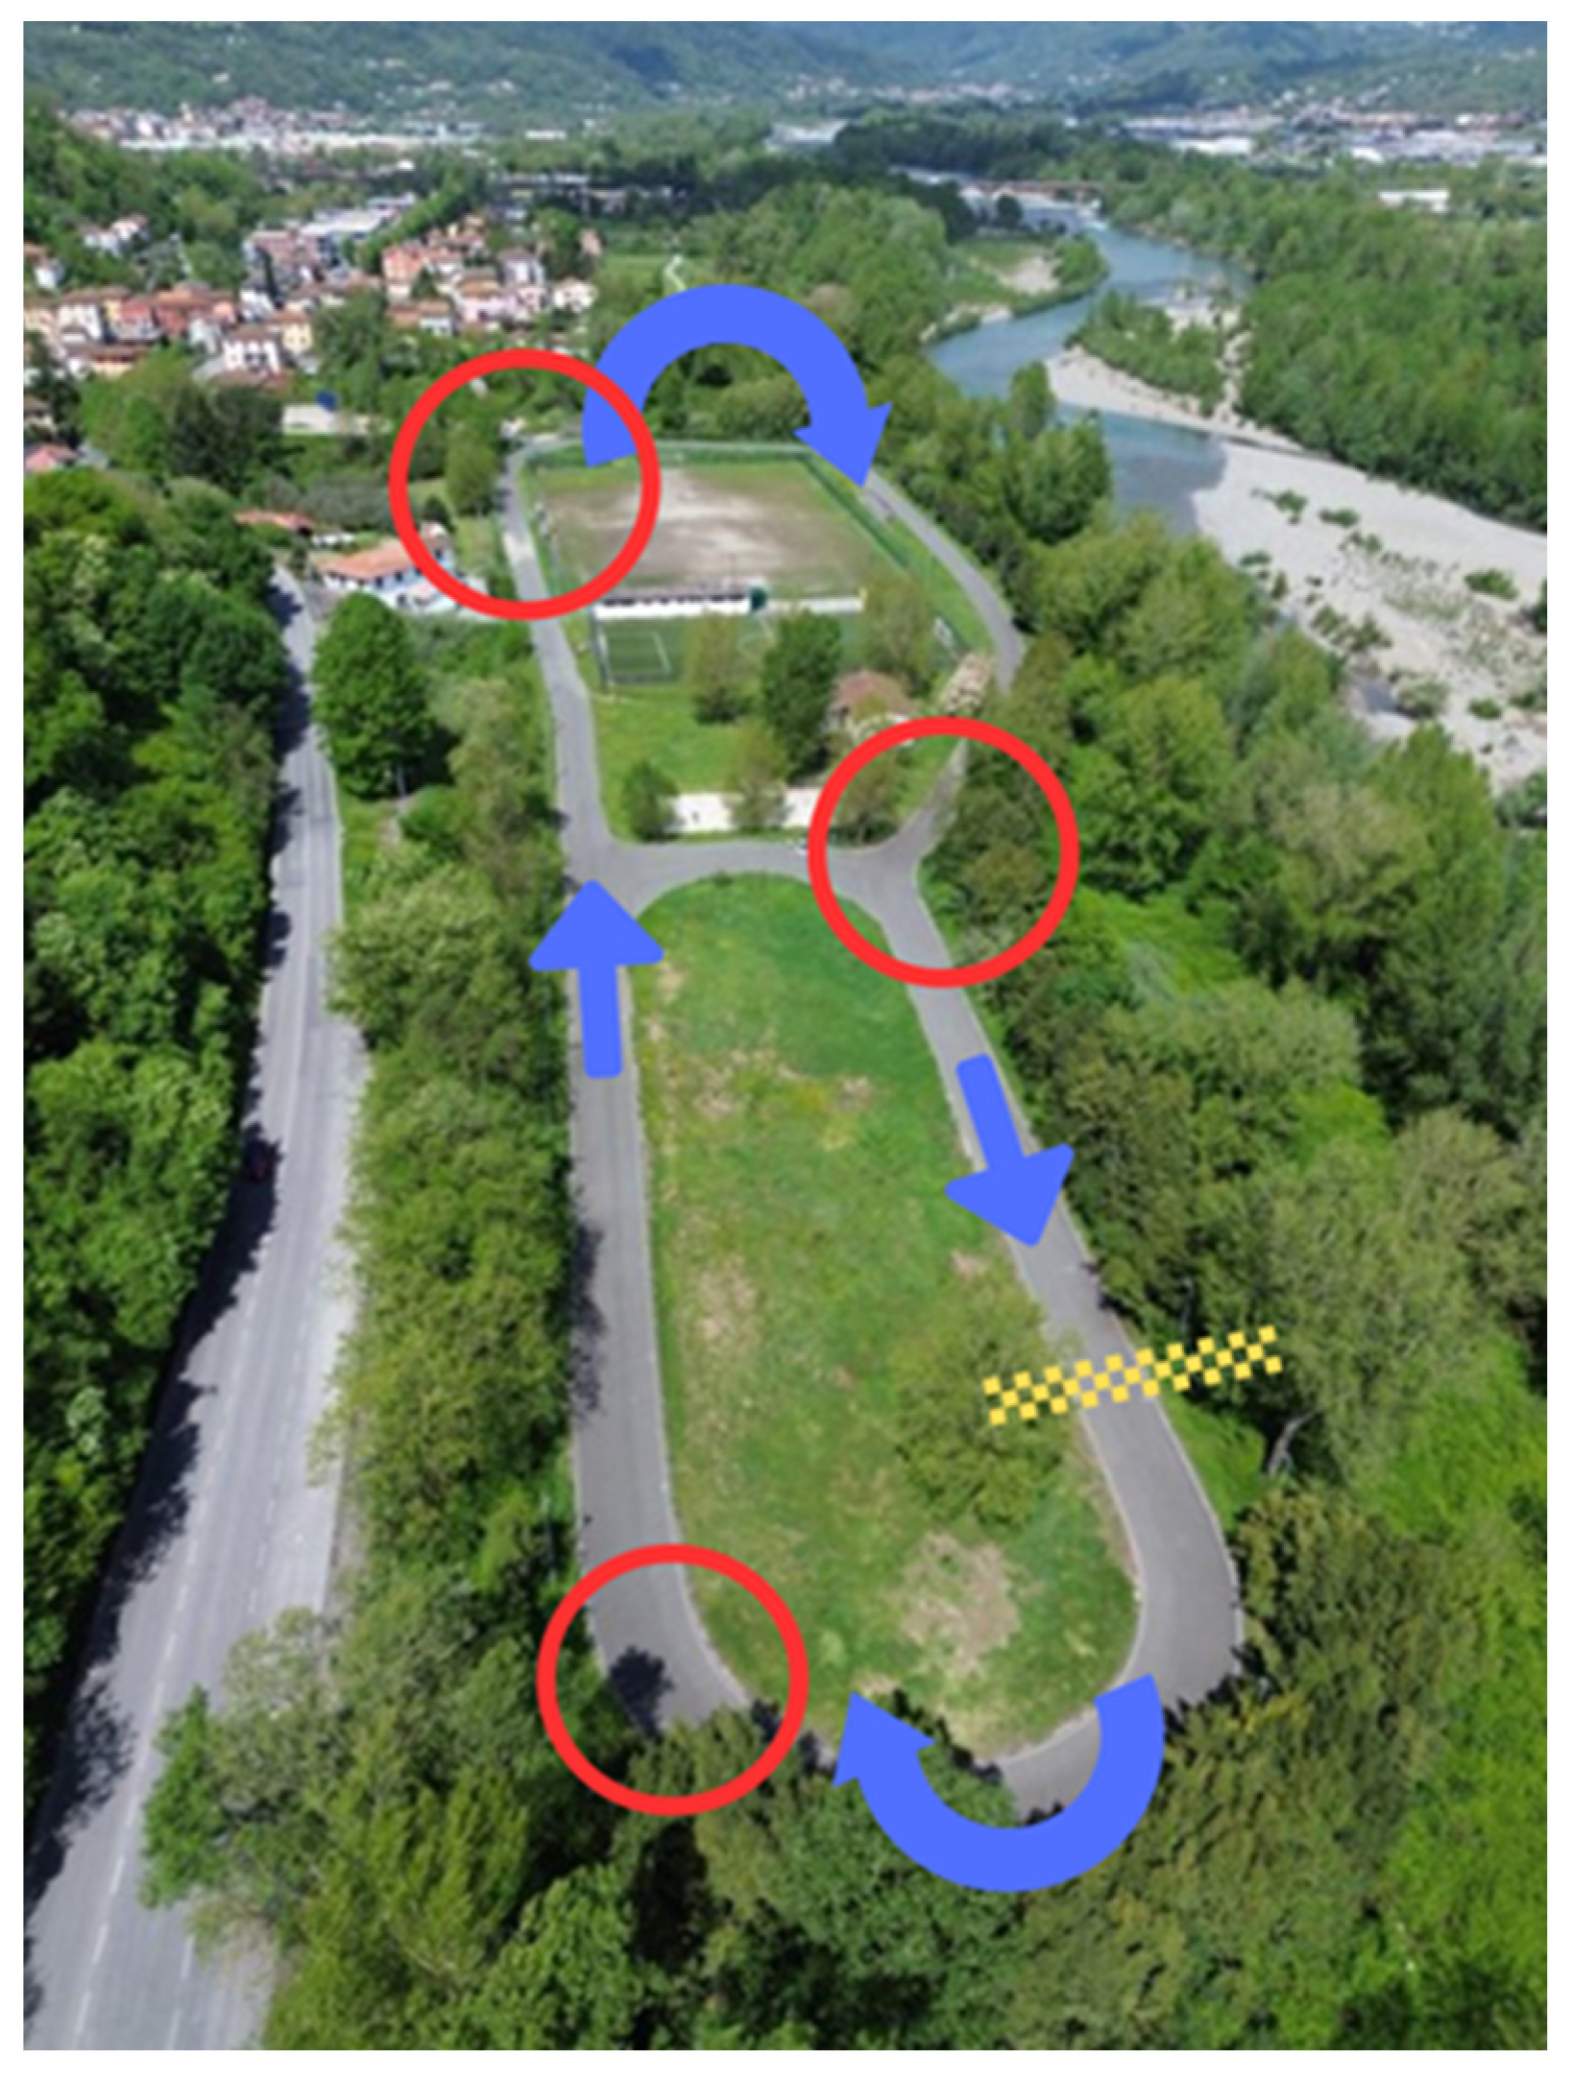
As observed in the literature, road conditions can significantly affect cyclists’ exposure to vibrations. To better investigate the effects of tires, it was necessary to keep road conditions as constant as possible throughout all trials. The cycling circuit ‘Dino Baldassini’ in Bottagna, Vezzano Ligure (La Spezia, Italy), shown in
Figure 6, was a suitable choice for the tests. The circuit surface is standard asphalt. Although its conditions are more favorable compared to typical public roads which may lead to optimistic results by minimizing vibrations, it offers the important advantage of reducing variability due to surface defects, supporting a clear identification of the effects of the tested factors. Based on literature, the International Roughness Index-IRI [
35] of this circuit asphalt could be qualitatively estimated at about 2 m/km [
36]. The track is approximately 800 m long and includes two straight sections, two 180° turns with different radii, and a chicane-like segment. The riding direction was kept constant throughout the experiment. A small wooden strip is placed at the location indicated in
Figure 6; each time the cyclist rides over it, it generates a sharp acceleration pulse, usually exceeding the sensor’s measuring range, that serves as a clear marker for lap start and stop. The experimental procedure includes a setup lap to reach cruising speed before passing over the wooden strip for the first time.
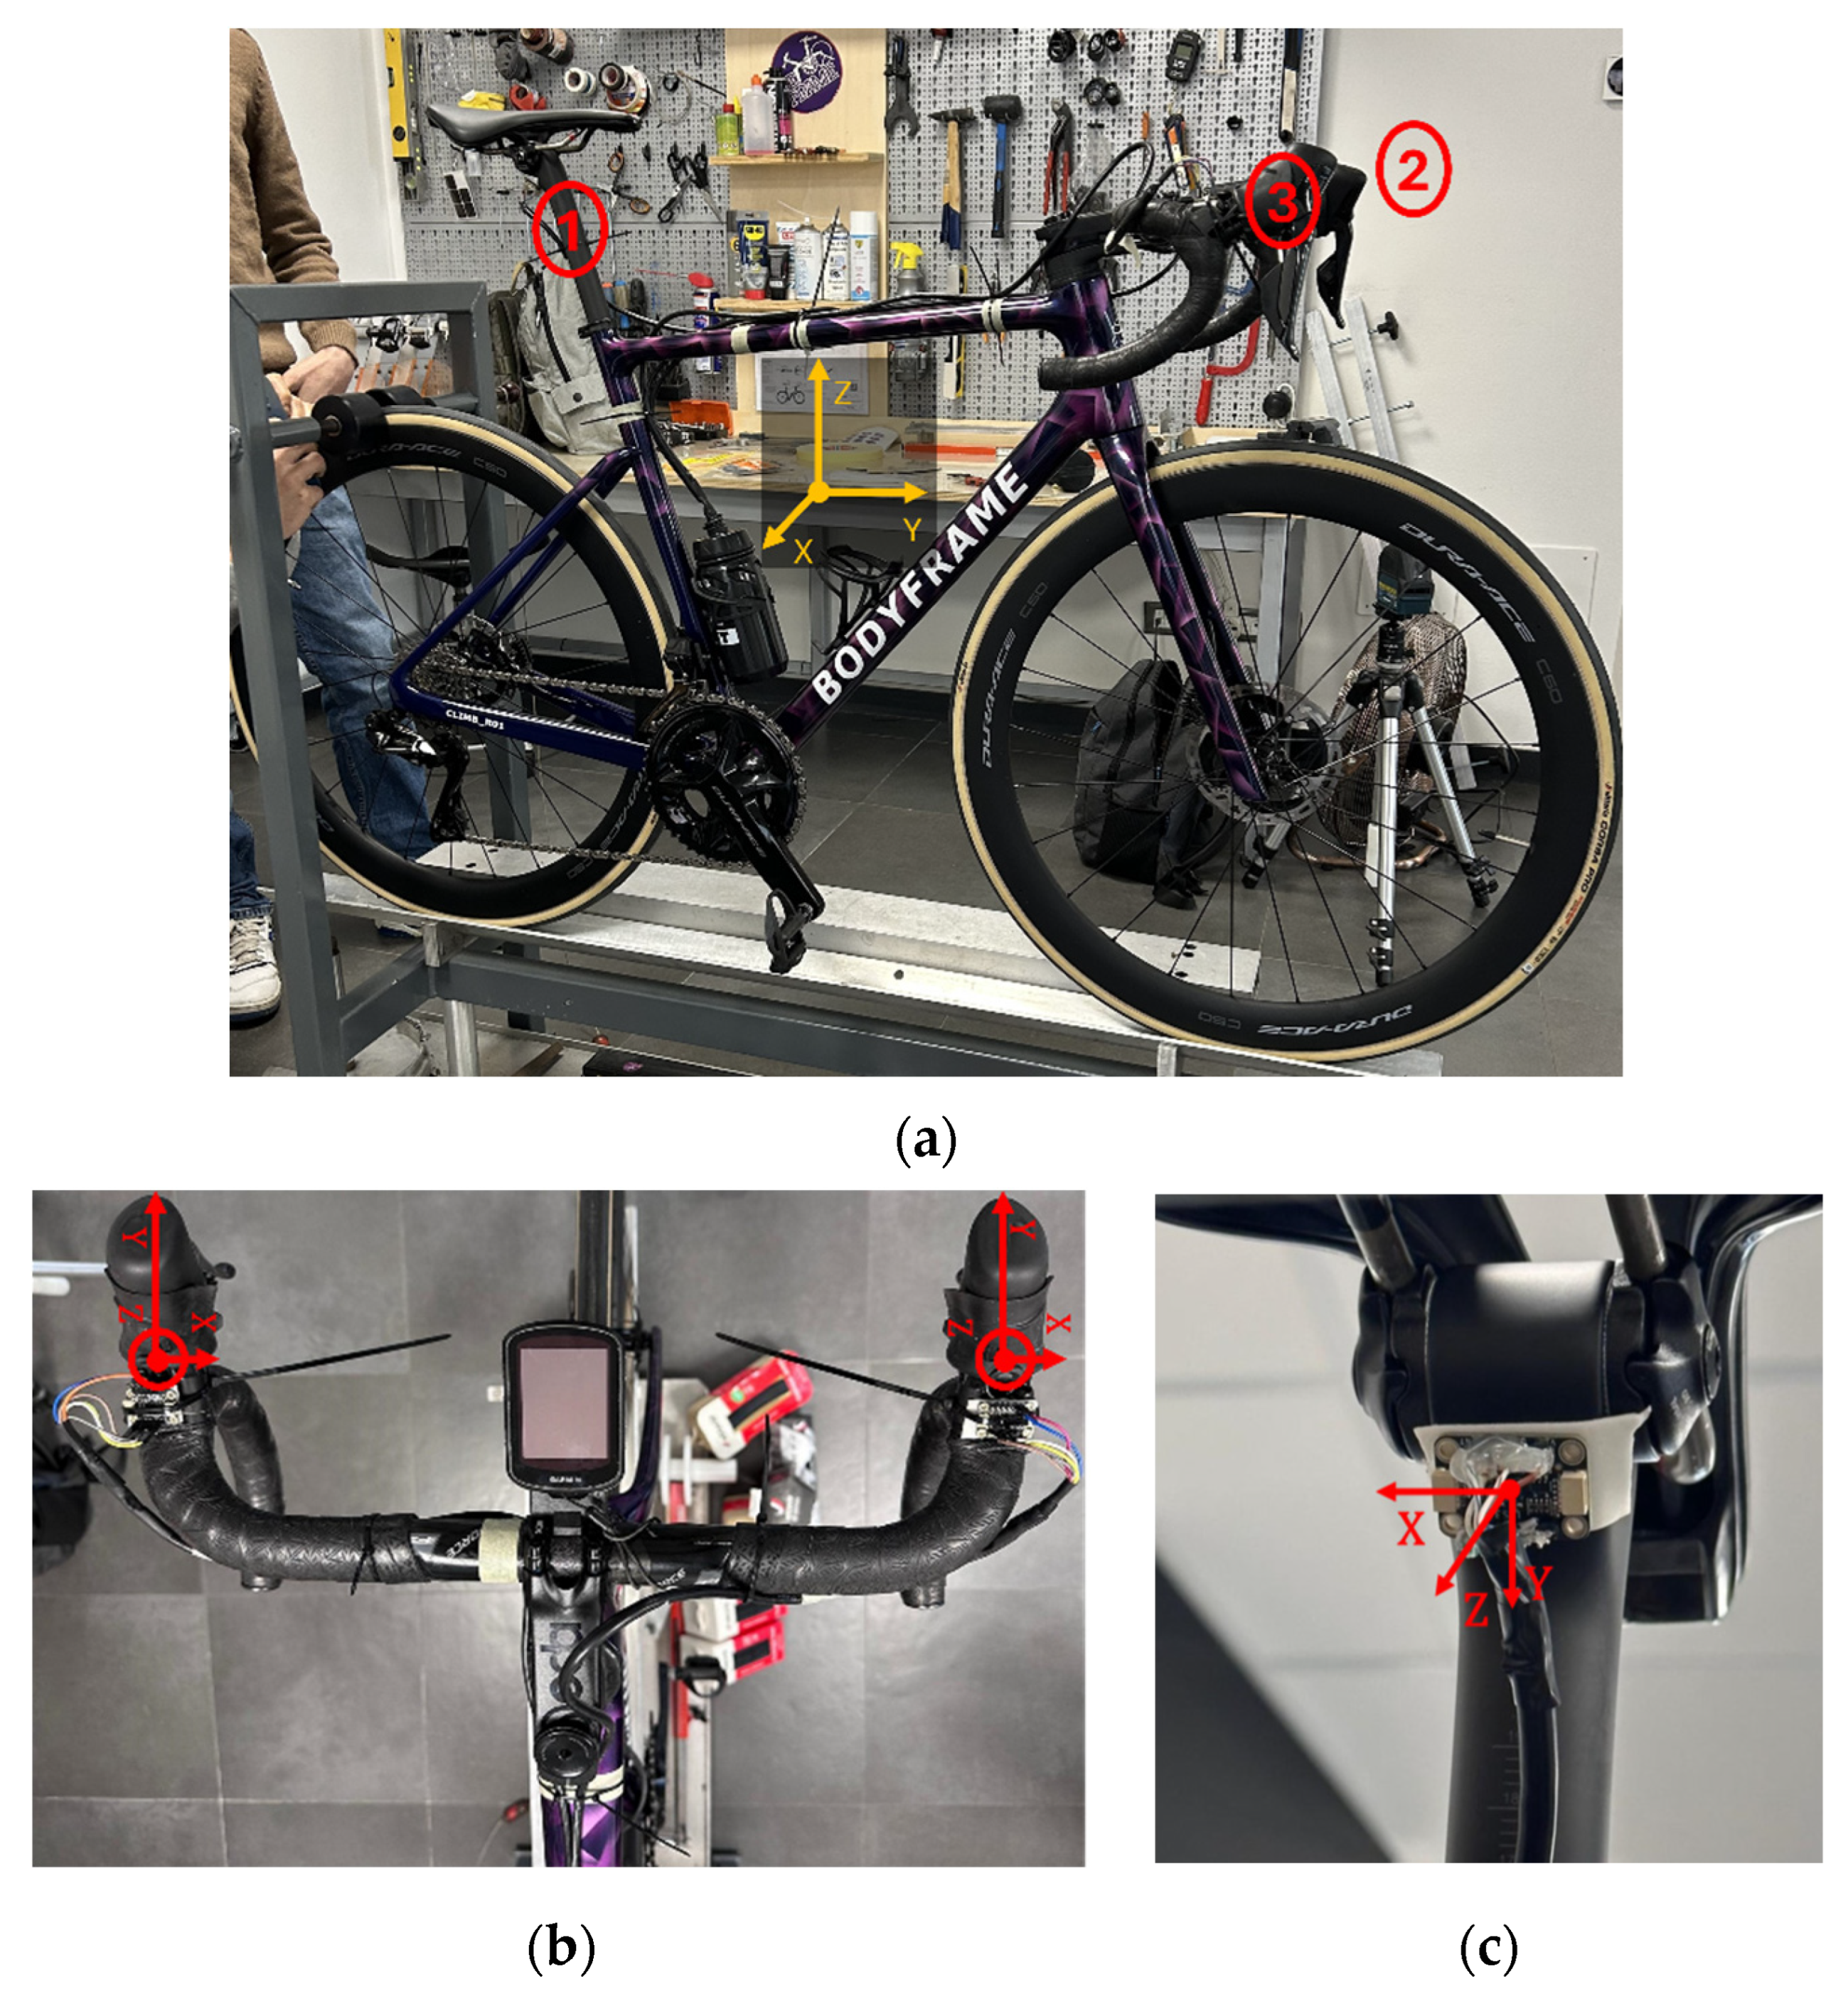
Accelerometers are mounted on the handlebar, as shown in
Figure 7a,b (sensors no. 2–3). They are attached using thin, double-sided adhesive tape on the rigid support of the brake cockpit, after having reversed the ribbon protection.
Figure 7c shows the position of the third sensor (no. 1), mounted directly on the seat-post tube. Measurement points were selected considering the typical, most used, cyclist position, sitting on the saddle and hands on the brakes supports, since the most aerodynamic position with hands on the lower part of the handlebar is not so comfortable and usually kept only in particular situations (downhill for example). Of course, the sensors’ position can be changed according to the focus of the investigation.
Sensors are further secured with clips for added safety. A preliminary test showed that the difference between the readings in these conditions and those without adhesive tape were less than 2%, confirming that the damping effect of the tape is negligible.
6. Results
After the two consecutive laps, data files are downloaded to a laptop for further offline processing in Matlab
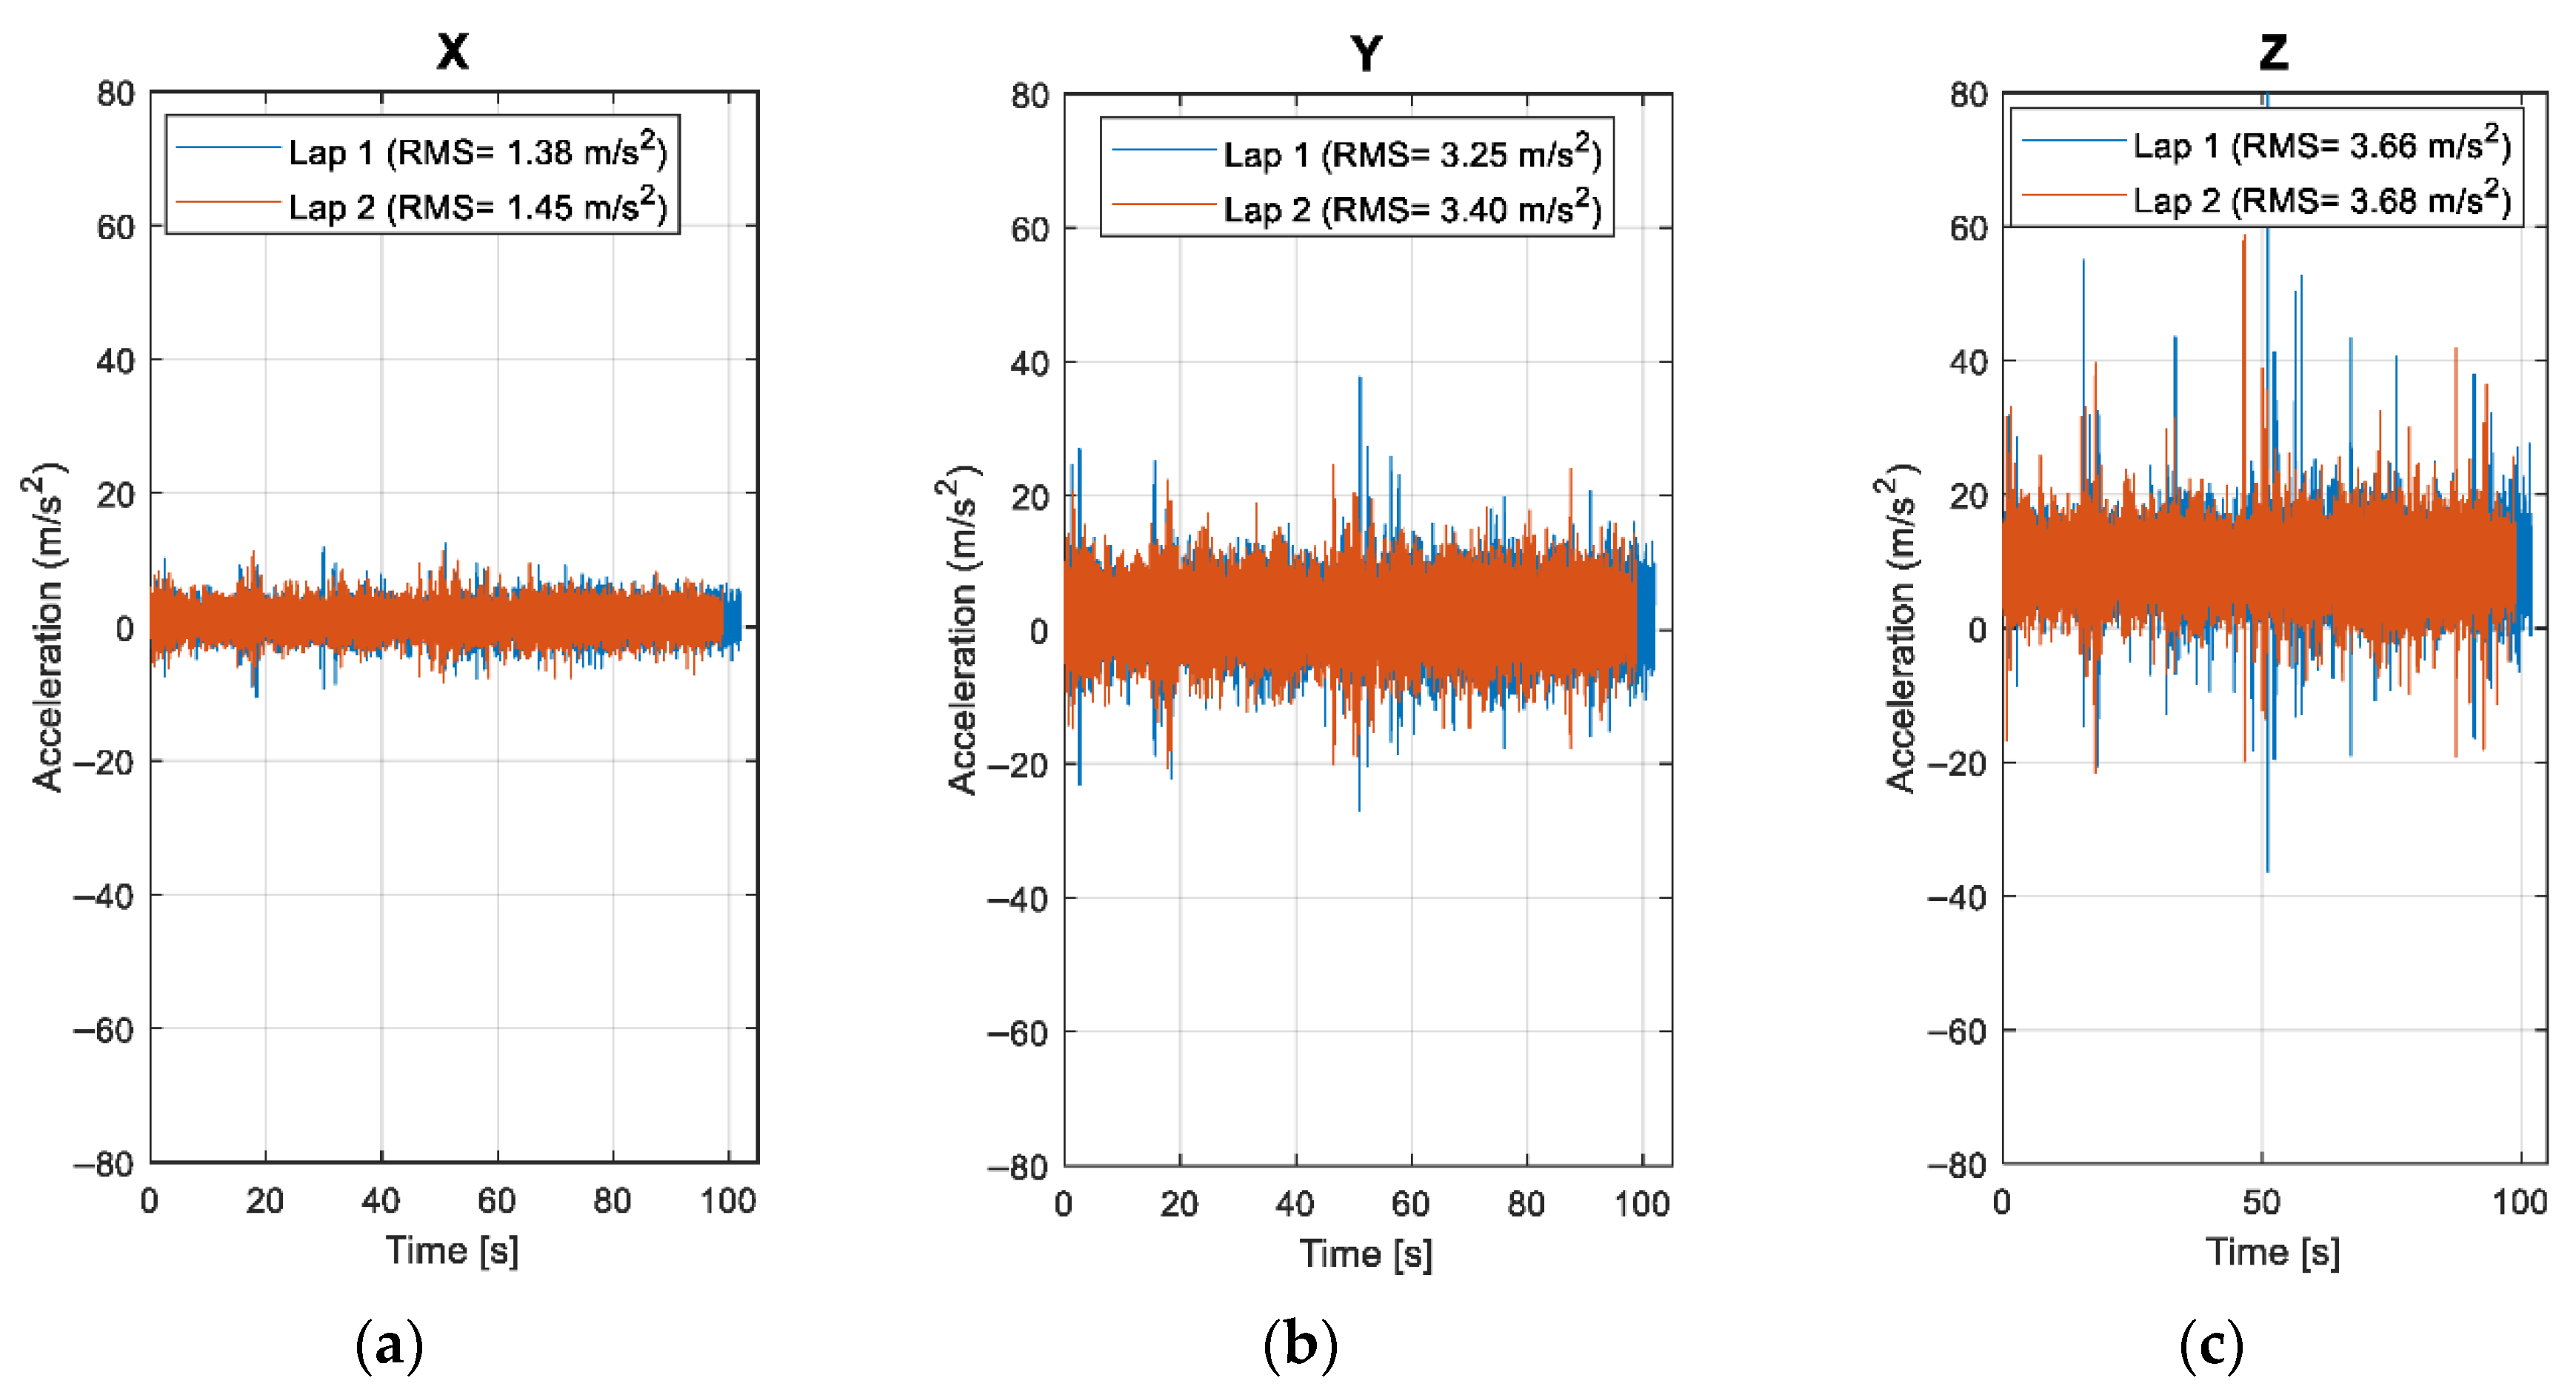
® (2024b). First, the high vibration peaks caused by the wooden strip are identified and the vibration signals 1 s before and after each peak are removed to prevent the impulse from affecting the analysis. The two laps are then separated, and an example of lap time histories is shown in
Figure 8. A video is available as
Supplementary Materials.
The velocity during each trial is regulated by the cyclist via the onboard cyclo-computer. Minor fluctuations in speed are observable through the time differentials between consecutive laps, illustrated in red and blue in
Figure 8. Owing to the preliminary setup lap conducted prior to data acquisition, the velocity profile within each lap remains highly consistent, exhibiting a variability below 5%.
It is important to note that the circuit layout includes multiple curves, which require active handling by the cyclist—particularly during high-speed laps. Despite these constraints, the standard deviation of the average lap speed at identical target velocities remains within approximately 2%, thereby validating the cyclist’s ability to reliably replicate the intended velocity conditions.
A directional analysis is possible by rotating the local moving measurement frame of the accelerometer to the fixed global reference frame. This can be achieved by using the orientation of the gravitational acceleration measured by each triaxial sensor. As expected, the highest vibration levels were observed along the vertical and anteroposterior axes. However, in the following presentation and discussion, the magnitude of the acceleration vector is considered to provide a general characterization of the vibration exposure, which is also suitable for safety purposes as described in [
8].
The stochastic nature of the signal is evident and prevents the extraction of clear information. The overall root mean square (RMS) value, calculated from the raw signal, is more robust, but it becomes even more reliable if derived from the power spectral density (PSD) of the signal.
Due to this stochastic variability, assuming the signal is stationary, the PSD can be effectively estimated using the Welch method, which applies spectral averaging to reduce noise contribution. The Welch method requires the definition of an observation window over which the PSD is calculated. This window is overlapped with the proceeding and following windows by a certain fraction, in order to prevent loss of information at the boundaries, which is particularly important when applying a special window function to reduce spectral leakage. In the following analysis, a Hanning window has been used for this purpose.
The definition of the observation window must consider several aspects: its length influences the number of averaging windows, since the total acquisition time is fixed; spectral resolution is approximately inversely proportional to the window length, so a longer window yields a more detailed spectrum; and finally, the duration of each observation window must be significant relative to the phenomenon being characterized.
Starting from this last point, the number of wheel rotations included in each window must be sufficient to capture the vibrational behavior. At the lowest speed considered (see
Table 3) corresponding to 6.9 m/s, a 5 s window includes approximately 15 wheel rotations, assuming a nominal wheel diameter of 700 mm. In addition to capturing a significative number of wheel turns, the 5 s window provides a spectral resolution of approximately 0.2 Hz, which is more than adequate for our purposes, and results in a substantial number of averaging windows in each lap: about 14 in the shortest case at high speed.
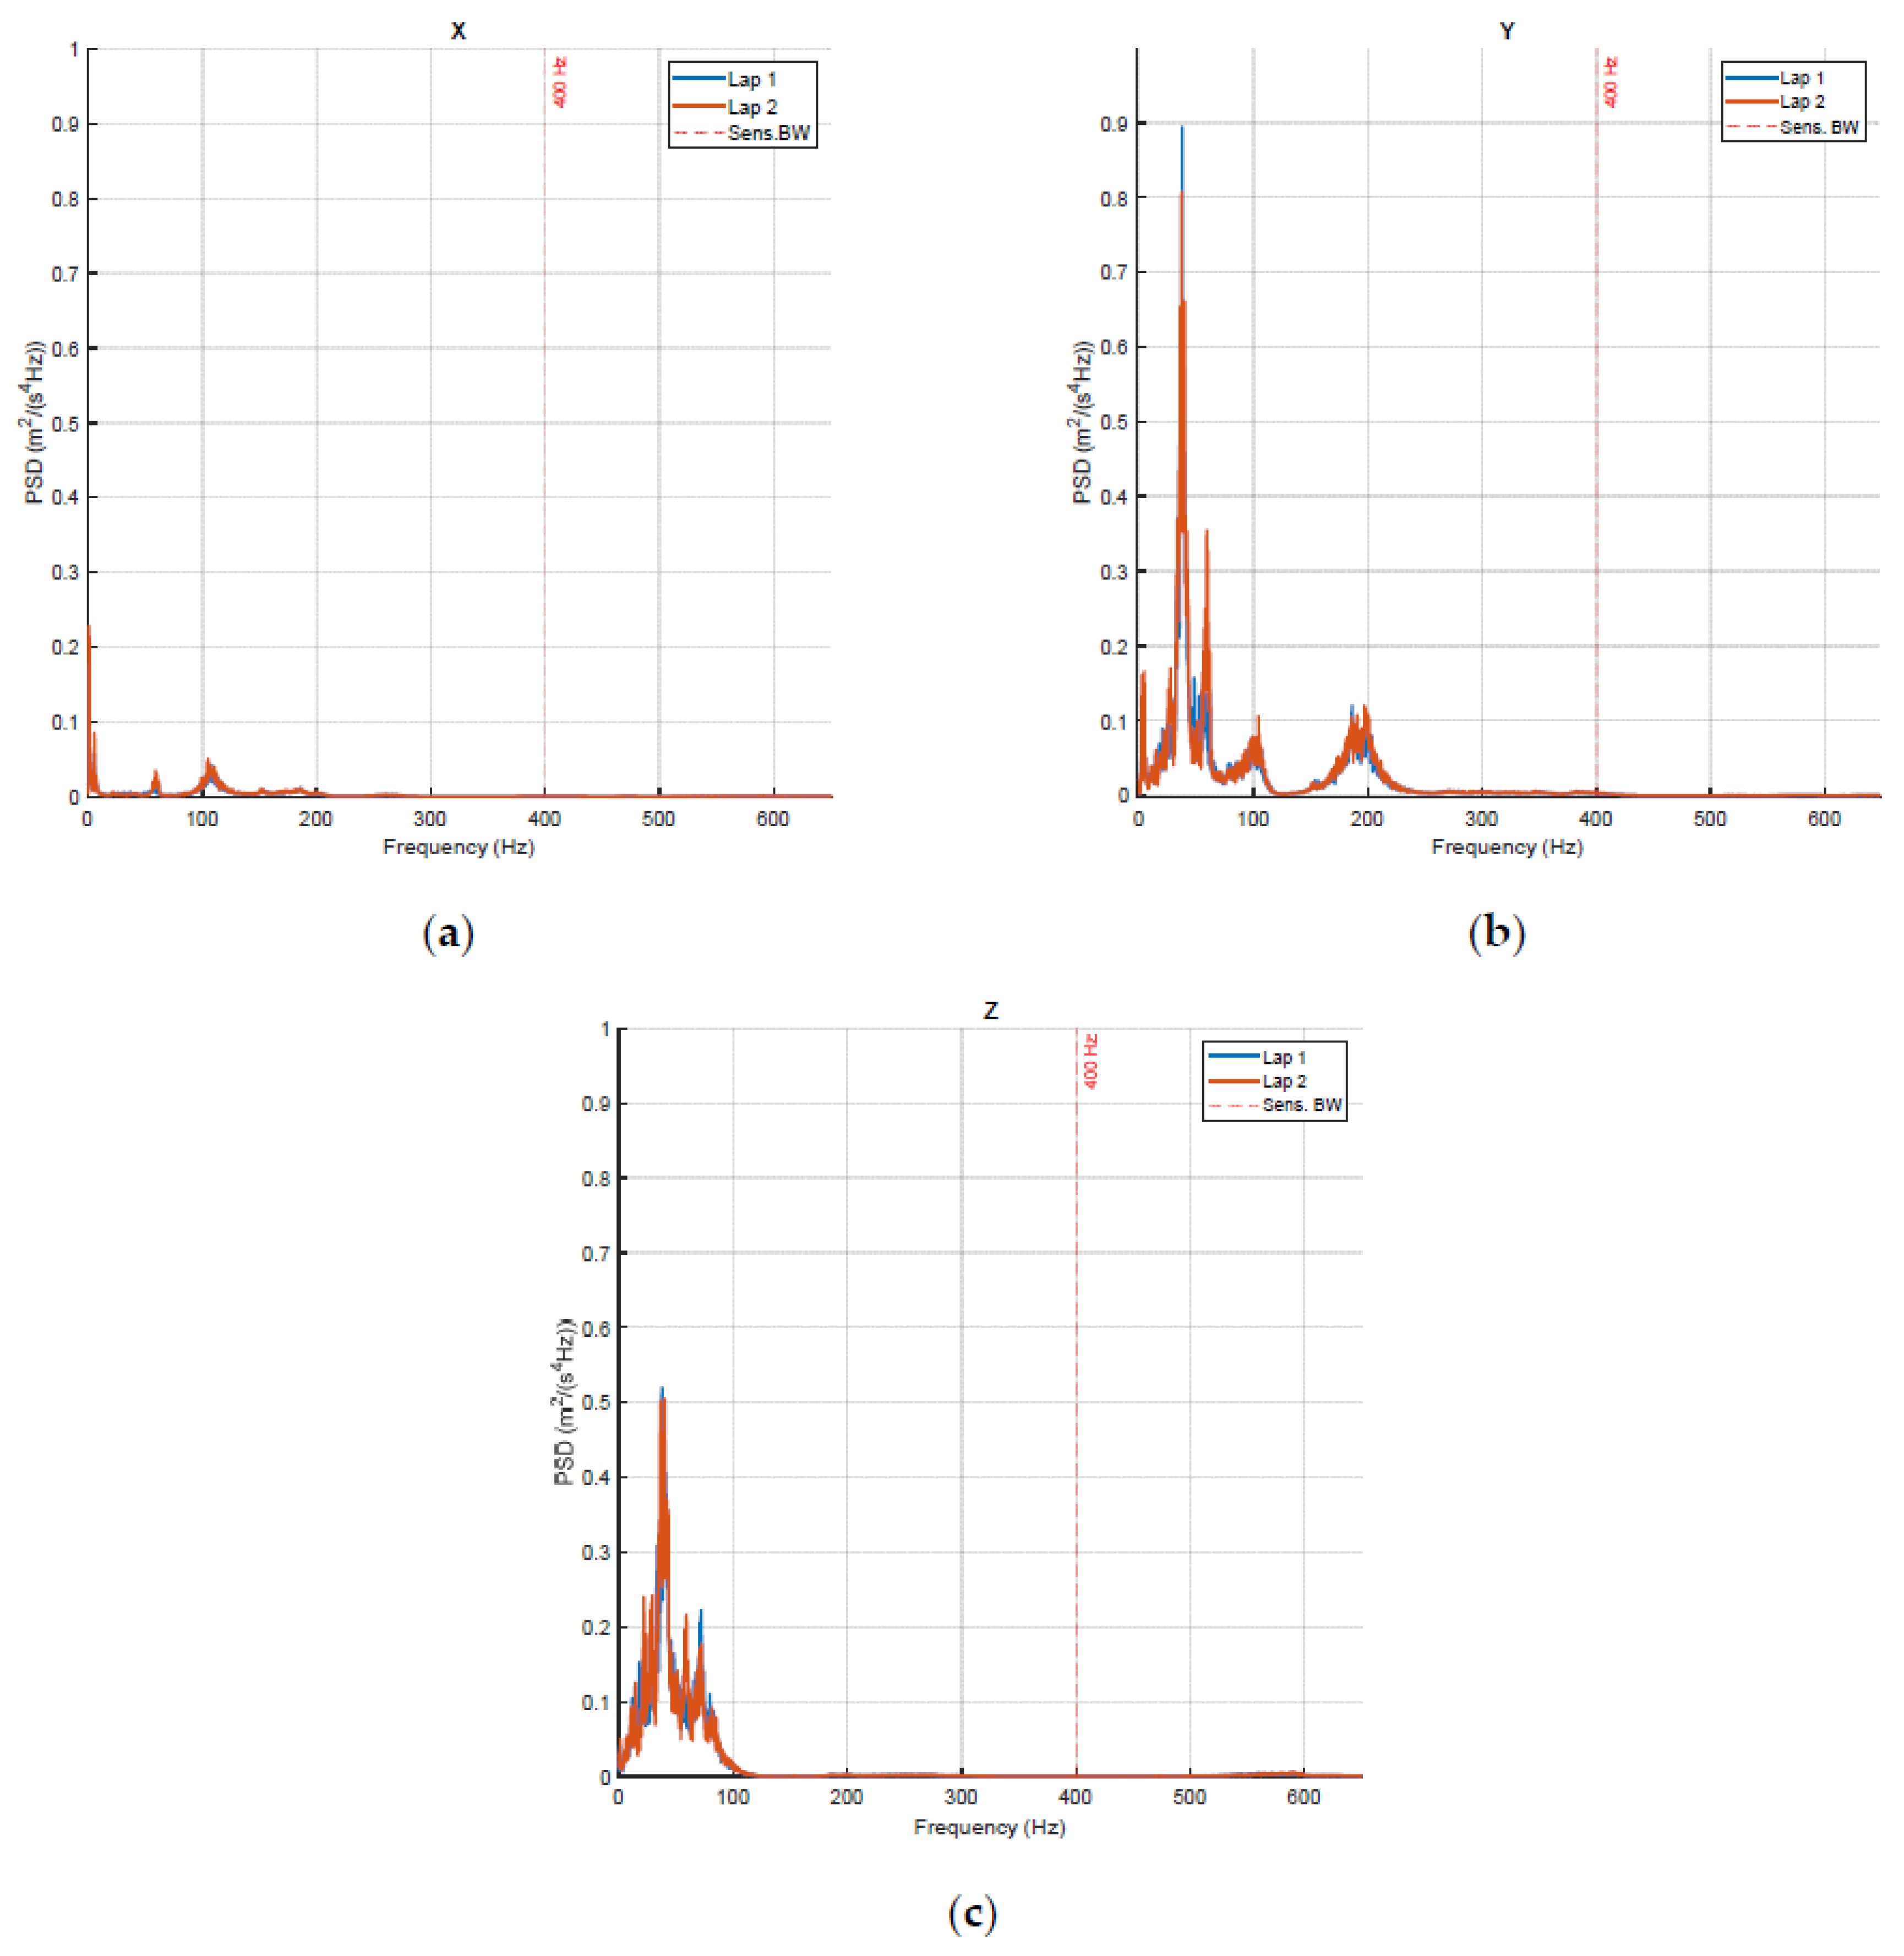
Figure 9 shows an example of PSD for two successive laps in the same experimental conditions.
Once the PSD is available it is possible to calculate the vibration power by integrating the spectrum over an appropriate bandwidth. According to the literature, the frequency range containing the most significant vibration content extends up to 200 Hz, with the main contribution below 100 Hz. Based on laboratory tests, the useful bandwidth of the measurement system was identified as 400 Hz. Therefore, the power was computed by integrating the PSD up to this frequency, which certainly includes all relevant information for the application. The square root of the power corresponds to the RMS value, which does not differ significantly (maximum deviation of a few percent). However, when comparing different laps, values for the PSD are more stable.
The same procedure can be applied to the spectrum calculated in each 5 s window. Although this approach sacrifices the averaging advantage of the Welch method, it provides a higher number of data points (about 14 values per lap in the worst-case condition) and allows for the visualization of vibration behavior along the lap. This makes it possible to detect abnormal effects caused, for example, by local asphalt irregularities. These anomalies, highlighted in red circles on the track in
Figure 6, were excluded from the following analysis. In total, 587 RMS values were obtained across 48 laps, corresponding to 24 test conditions.
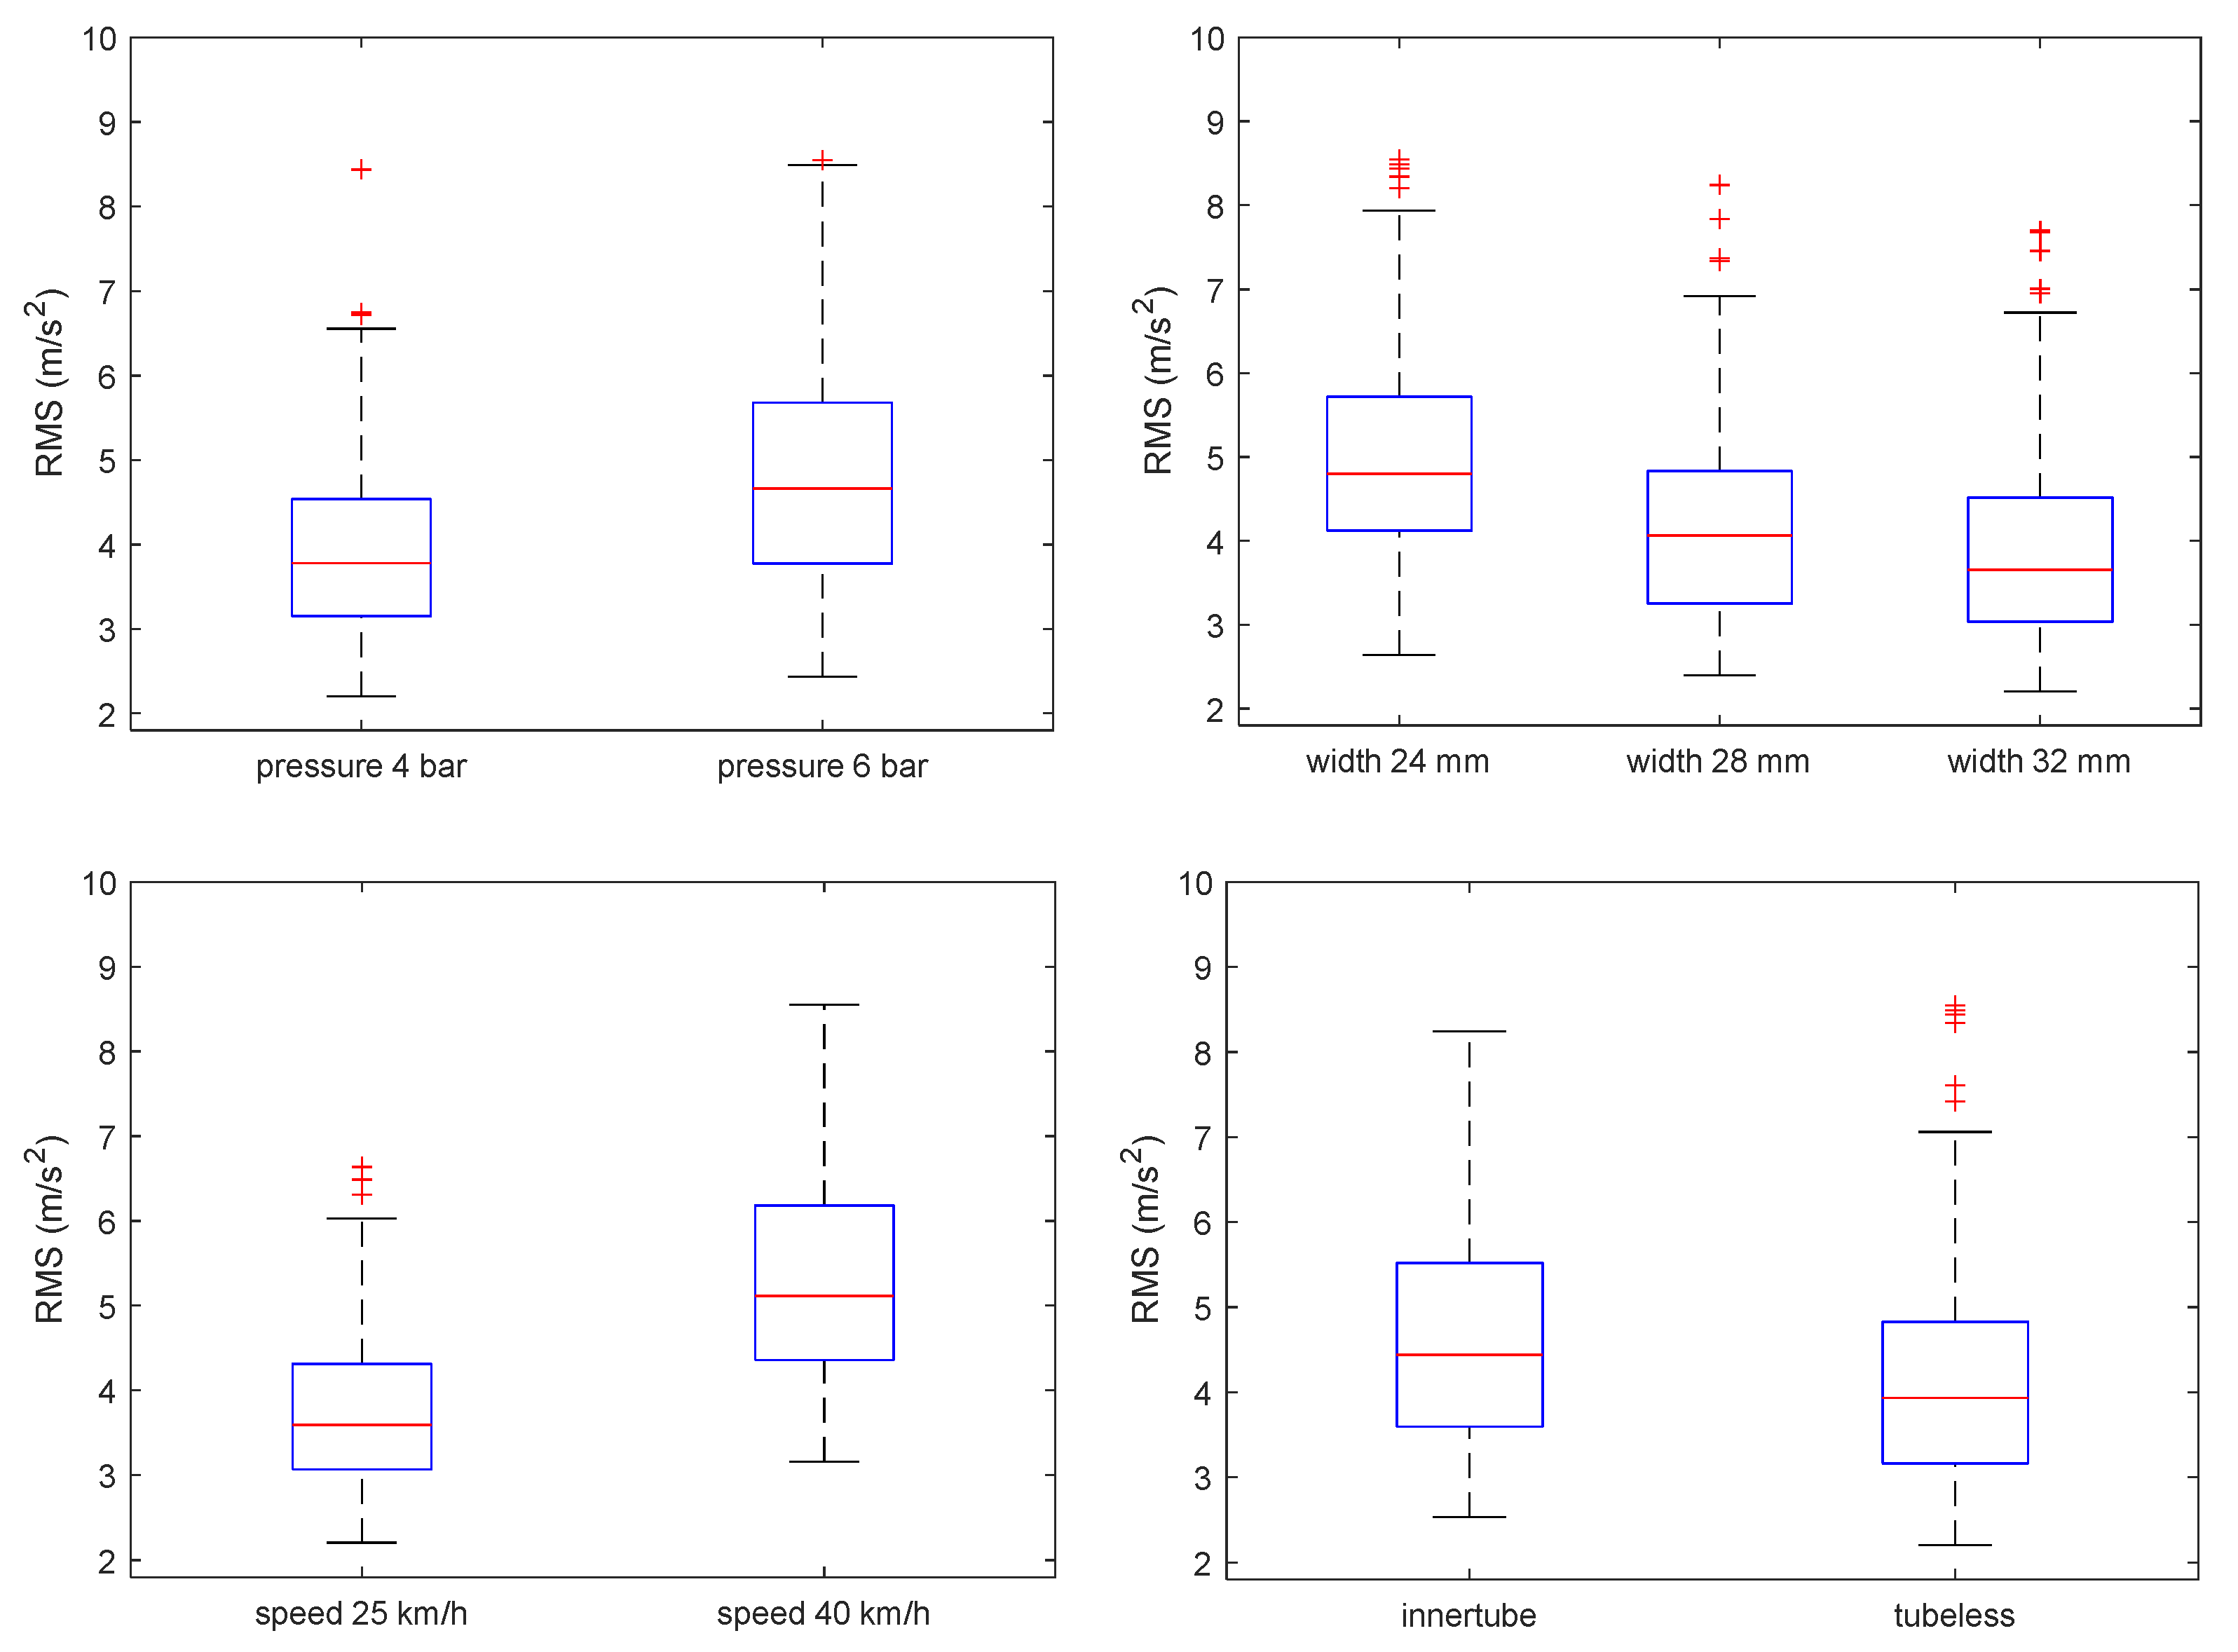
The four box plots shown in
Figure 10 present the RMS values as a function of each factor level. Blue boxes represent the 25th to 75th percentiles, while the red line indicates the median value. It is evident that bike speed is by far the factor that most strongly affects vibrations. Consider, for example, the pressure, where the boxes for 4 and 6 bar are quite large and partially overlapping. In fact, each box includes trials conducted at the same pressure but under different conditions, particularly at different speeds, which as noted is the most influential factor.
Under such circumstances it becomes difficult to visually isolate the effects of tire-related variables. A more detailed statistical analysis, such as a multiple ways analysis of variance—ANOVA—can be useful to identify the statistically significant factors.
Table 4 summarizes the second-order ANOVA results. A logarithmic transformation was applied to compensate for deviations from normality in the residuals, resulting in a positive Shapiro–Wilk test for normality [
37,
38]. Homogeneity of variances within each group was confirmed by a Levene test [
39].
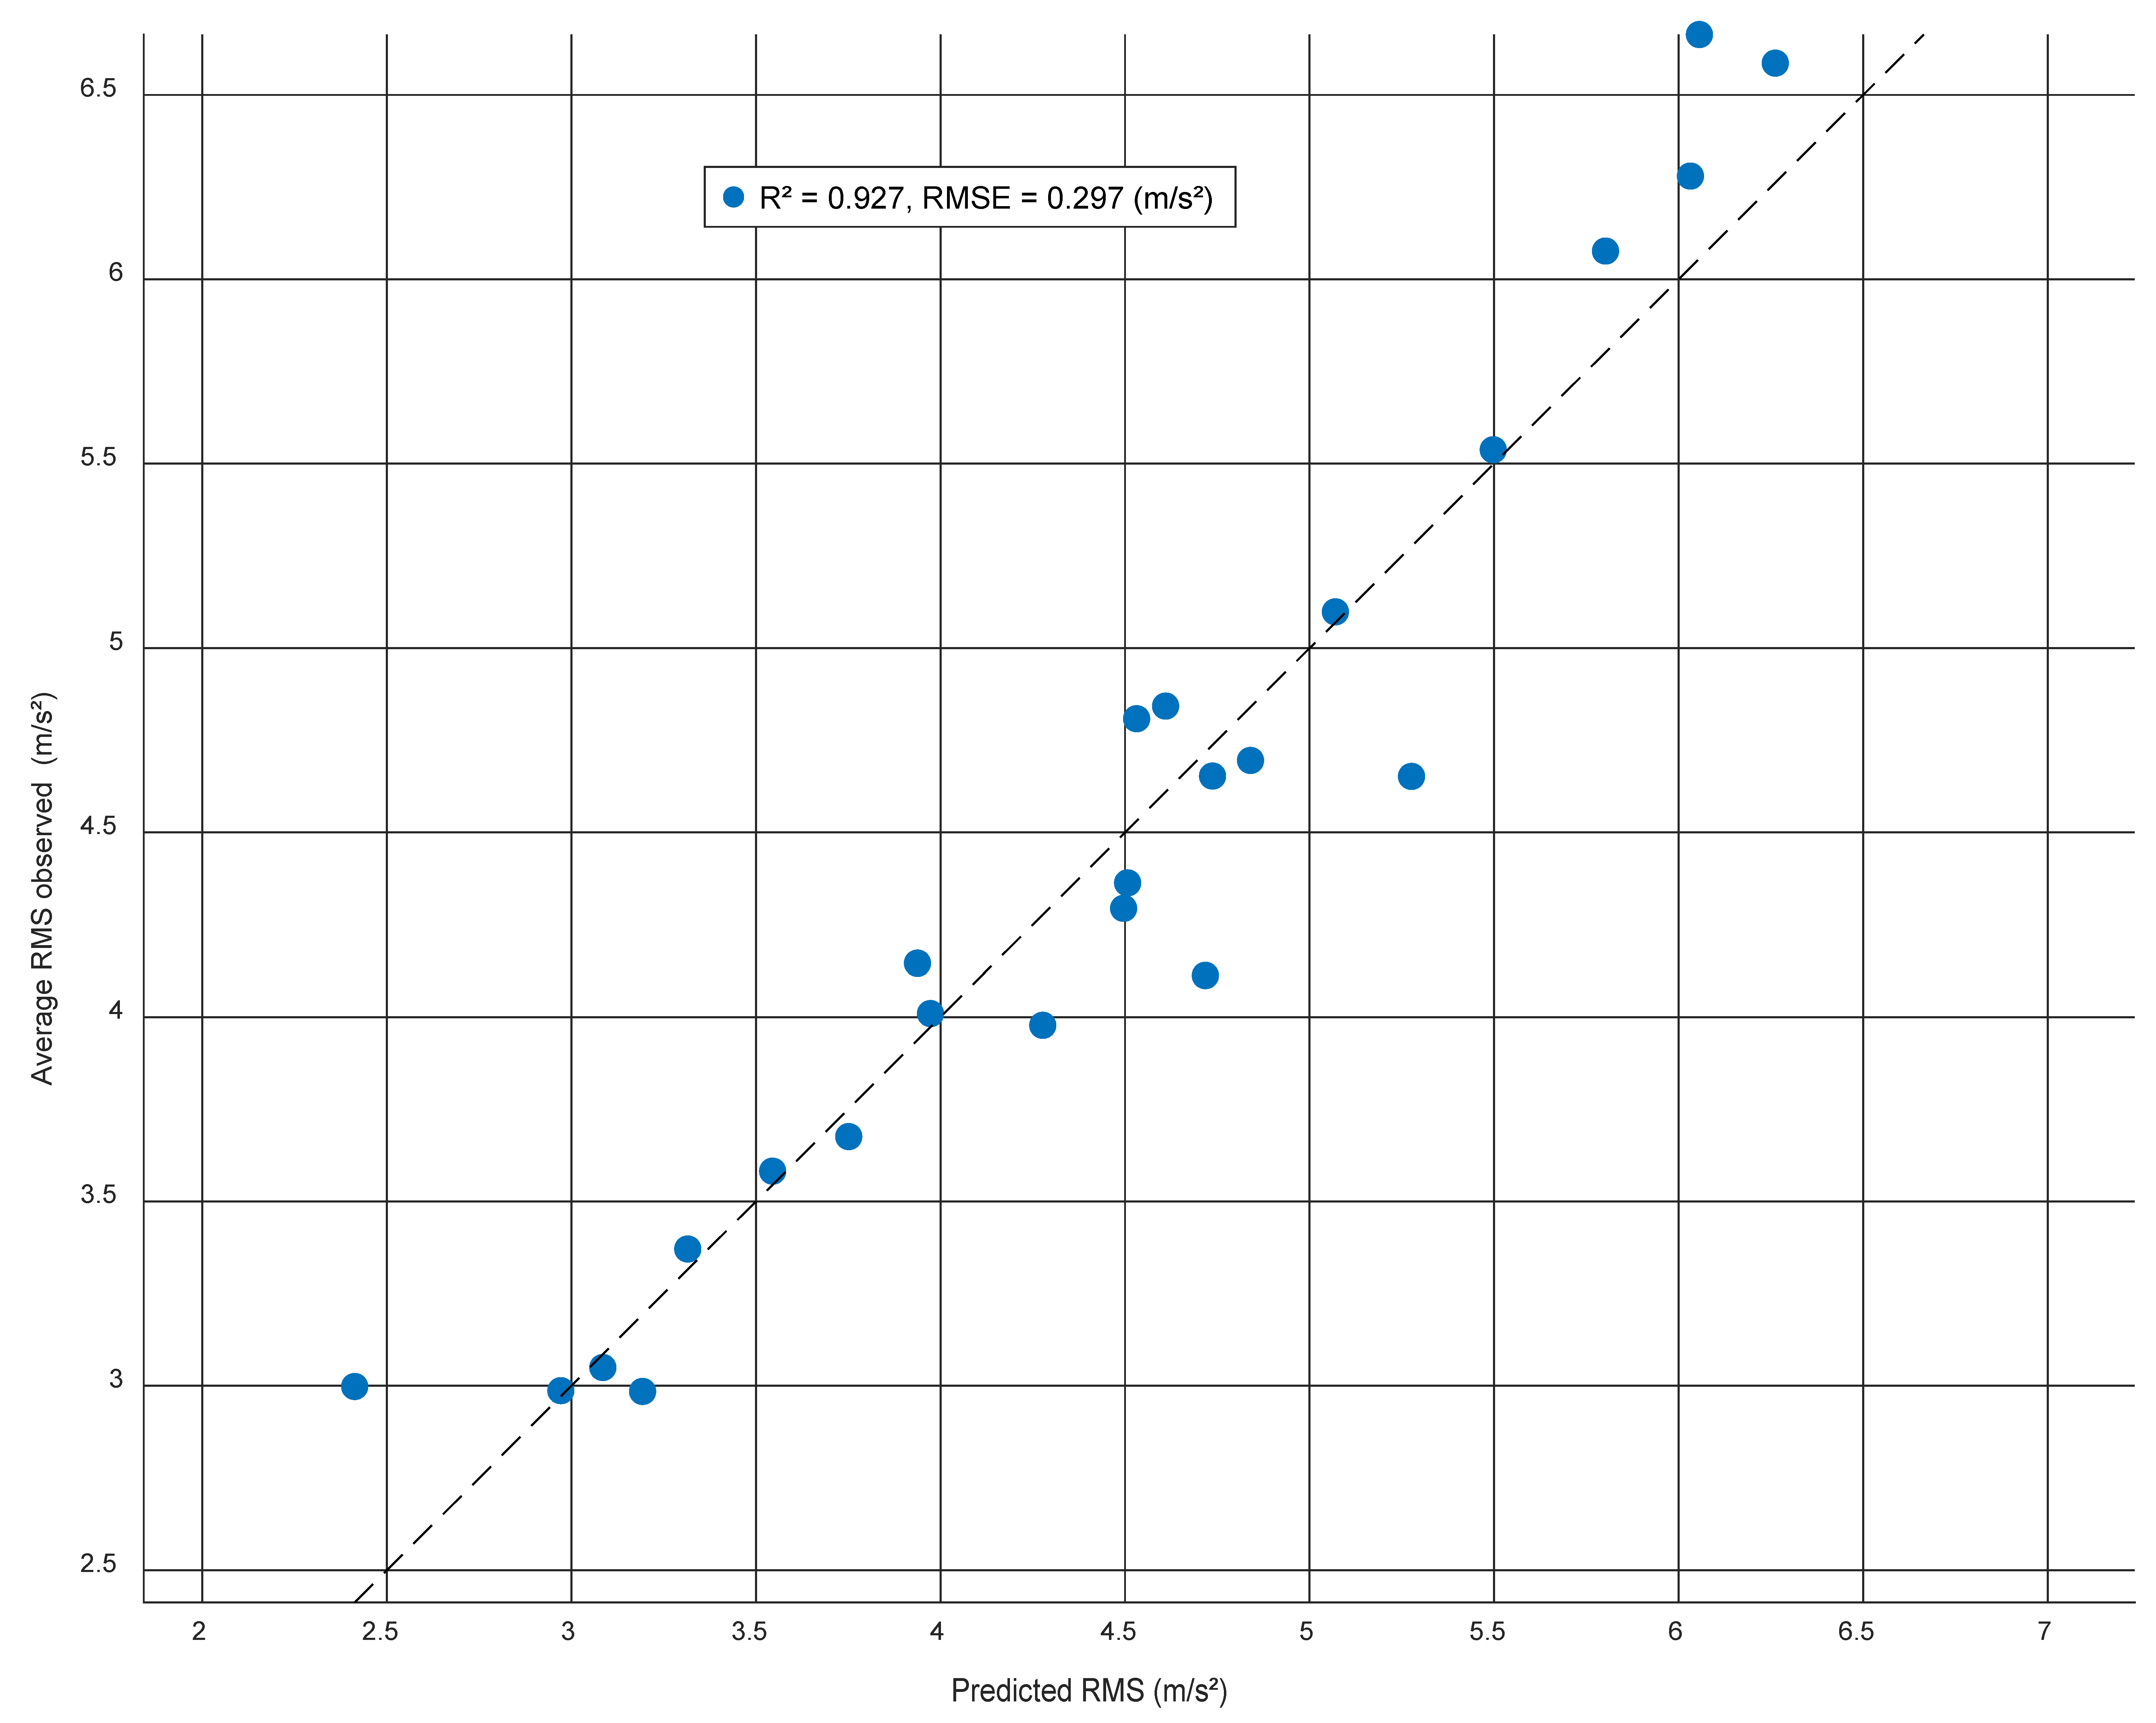
A regression model describing vibration RMS acceleration as a function of the significant and most influential factors was developed. The presence or absence of the innertube was encoded using a numerical value of 0 or 1, respectively. The complexity of the model was progressively increased by adding different contributions until an
value of 0.94 was achieved, with a root mean square error, RMSE, of 0.26 m/s
2.
Table 5 illustrates the model progression and corresponding performance metrics.
The complete model is described by Equation (1) as follows:
where
is the model prediction of the RMS acceleration at the handlebar in m/s
2,
to
are the model coefficients presented in
Table 6,
is the cycling speed in km/h,
is the tire inflation pressure in bar,
is the tire width in mm, and
is a binary variable describing the type of tire, with 1 for tubeless and 0 for innertube. The model coefficients were obtained by fitting the equation to a dataset of 587 RMS values.
Model accuracy is shown in
Figure 11, based on the mean RMS values over two laps under the same experimental conditions.
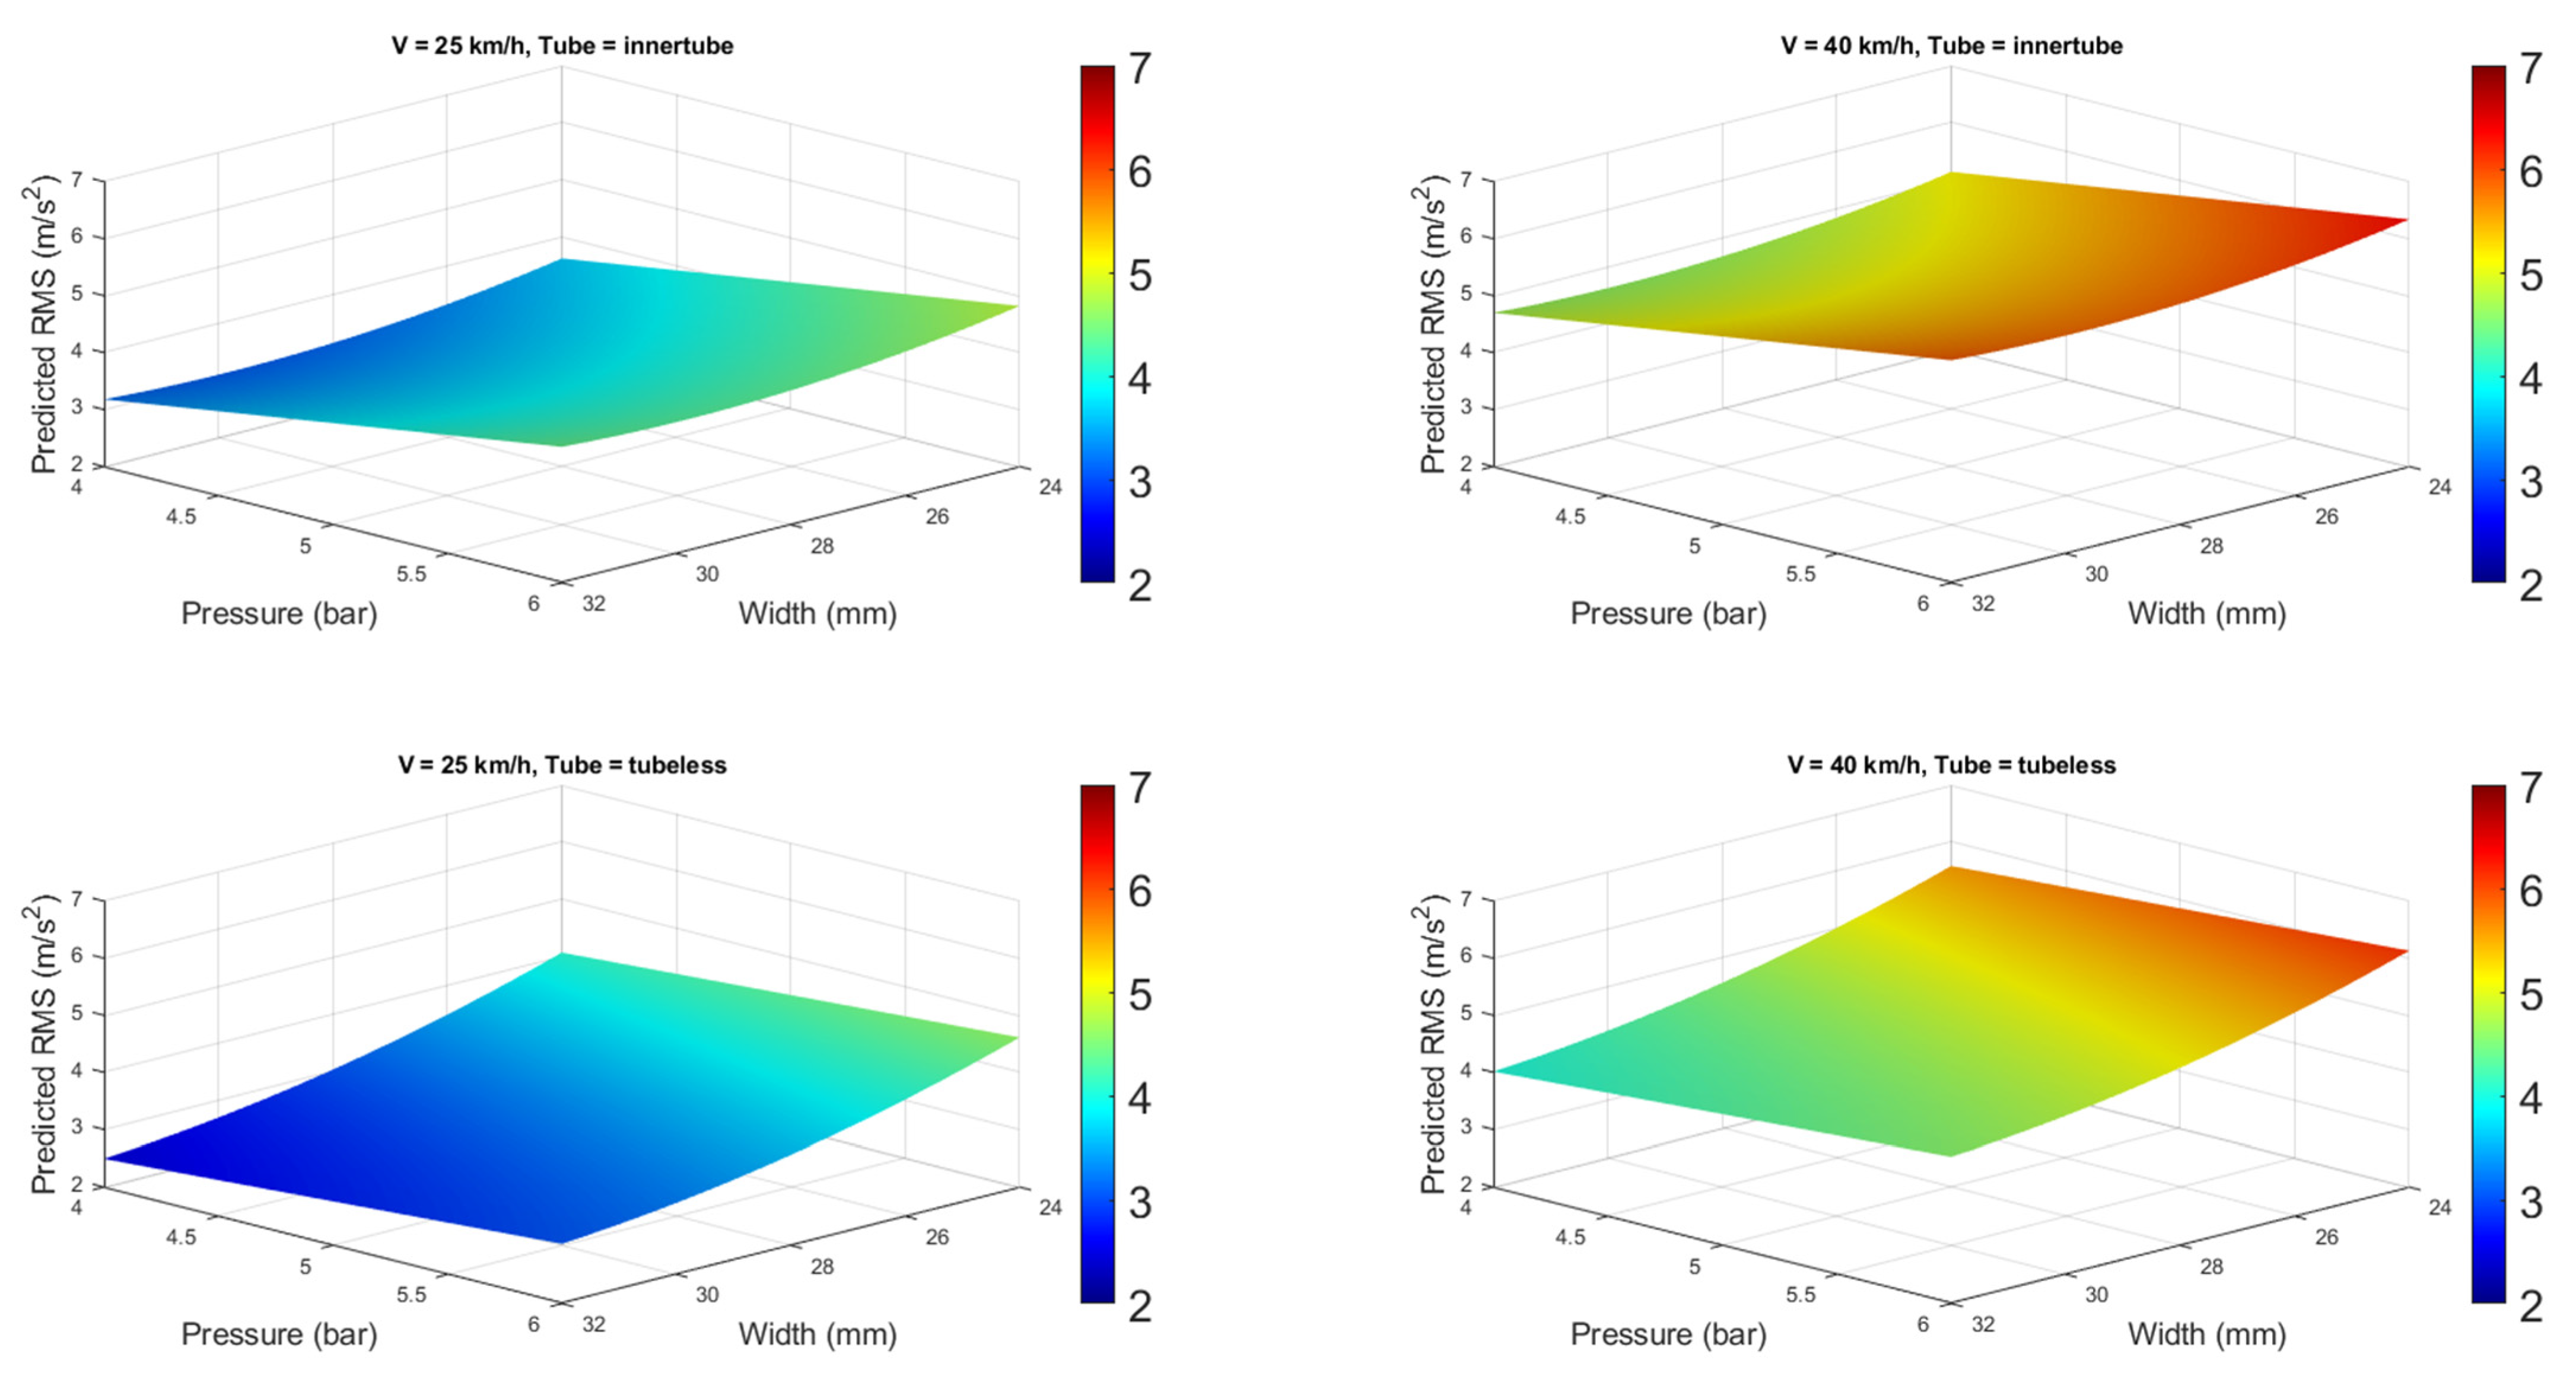
Figure 12 presents the model response surfaces.
7. Discussion
As described in
Section 5, the experimental conditions were controlled as much as possible. Good repeatability is demonstrated by
Figure 8 for the time signal over two successive laps, and by
Figure 9 for their corresponding PSDs. The cyclists’ speed control proved to be consistent, as shown by the minimal time difference between laps in
Figure 8. The spectral approach was effective in reducing noise contributions and limiting the analysis to the useful bandwidth of the measurement system, as previously determined in the laboratory.
Several RMS acceleration values were calculated using the spectrum computed over 5 s windows, corresponding to approximately 15 wheel rotations. This large dataset allowed for the analysis of vibration levels along each lap, which would otherwise be impossible. Thanks to this approach, significant variations in the RMS values were identified in the same sections of the circuit, likely due to local anomalies in the asphalt surface. These data points were excluded from further analysis in order to reduce variability and focus solely on the effects of the investigated factors.
To assess the influence of the experimental conditions on the vibration measured at the handlebar, an analysis of variance was performed at different levels starting from a linear, single factor model without interactions.
Table 4 presents the results of a second-order ANOVA, which enabled the identification of significant interactions among factors.
At this stage, two types of information are available, the
p values, which indicate the statistical significance of each effect or interaction, and the mean sum of squares (MSS), which quantifies the amount of variability associated with each factor or interaction. Therefore, in addition to identifying statistically significant effects, it is possible to rank them according to their impact on the measured vibration, offering a practical approach for selecting the most effective model.
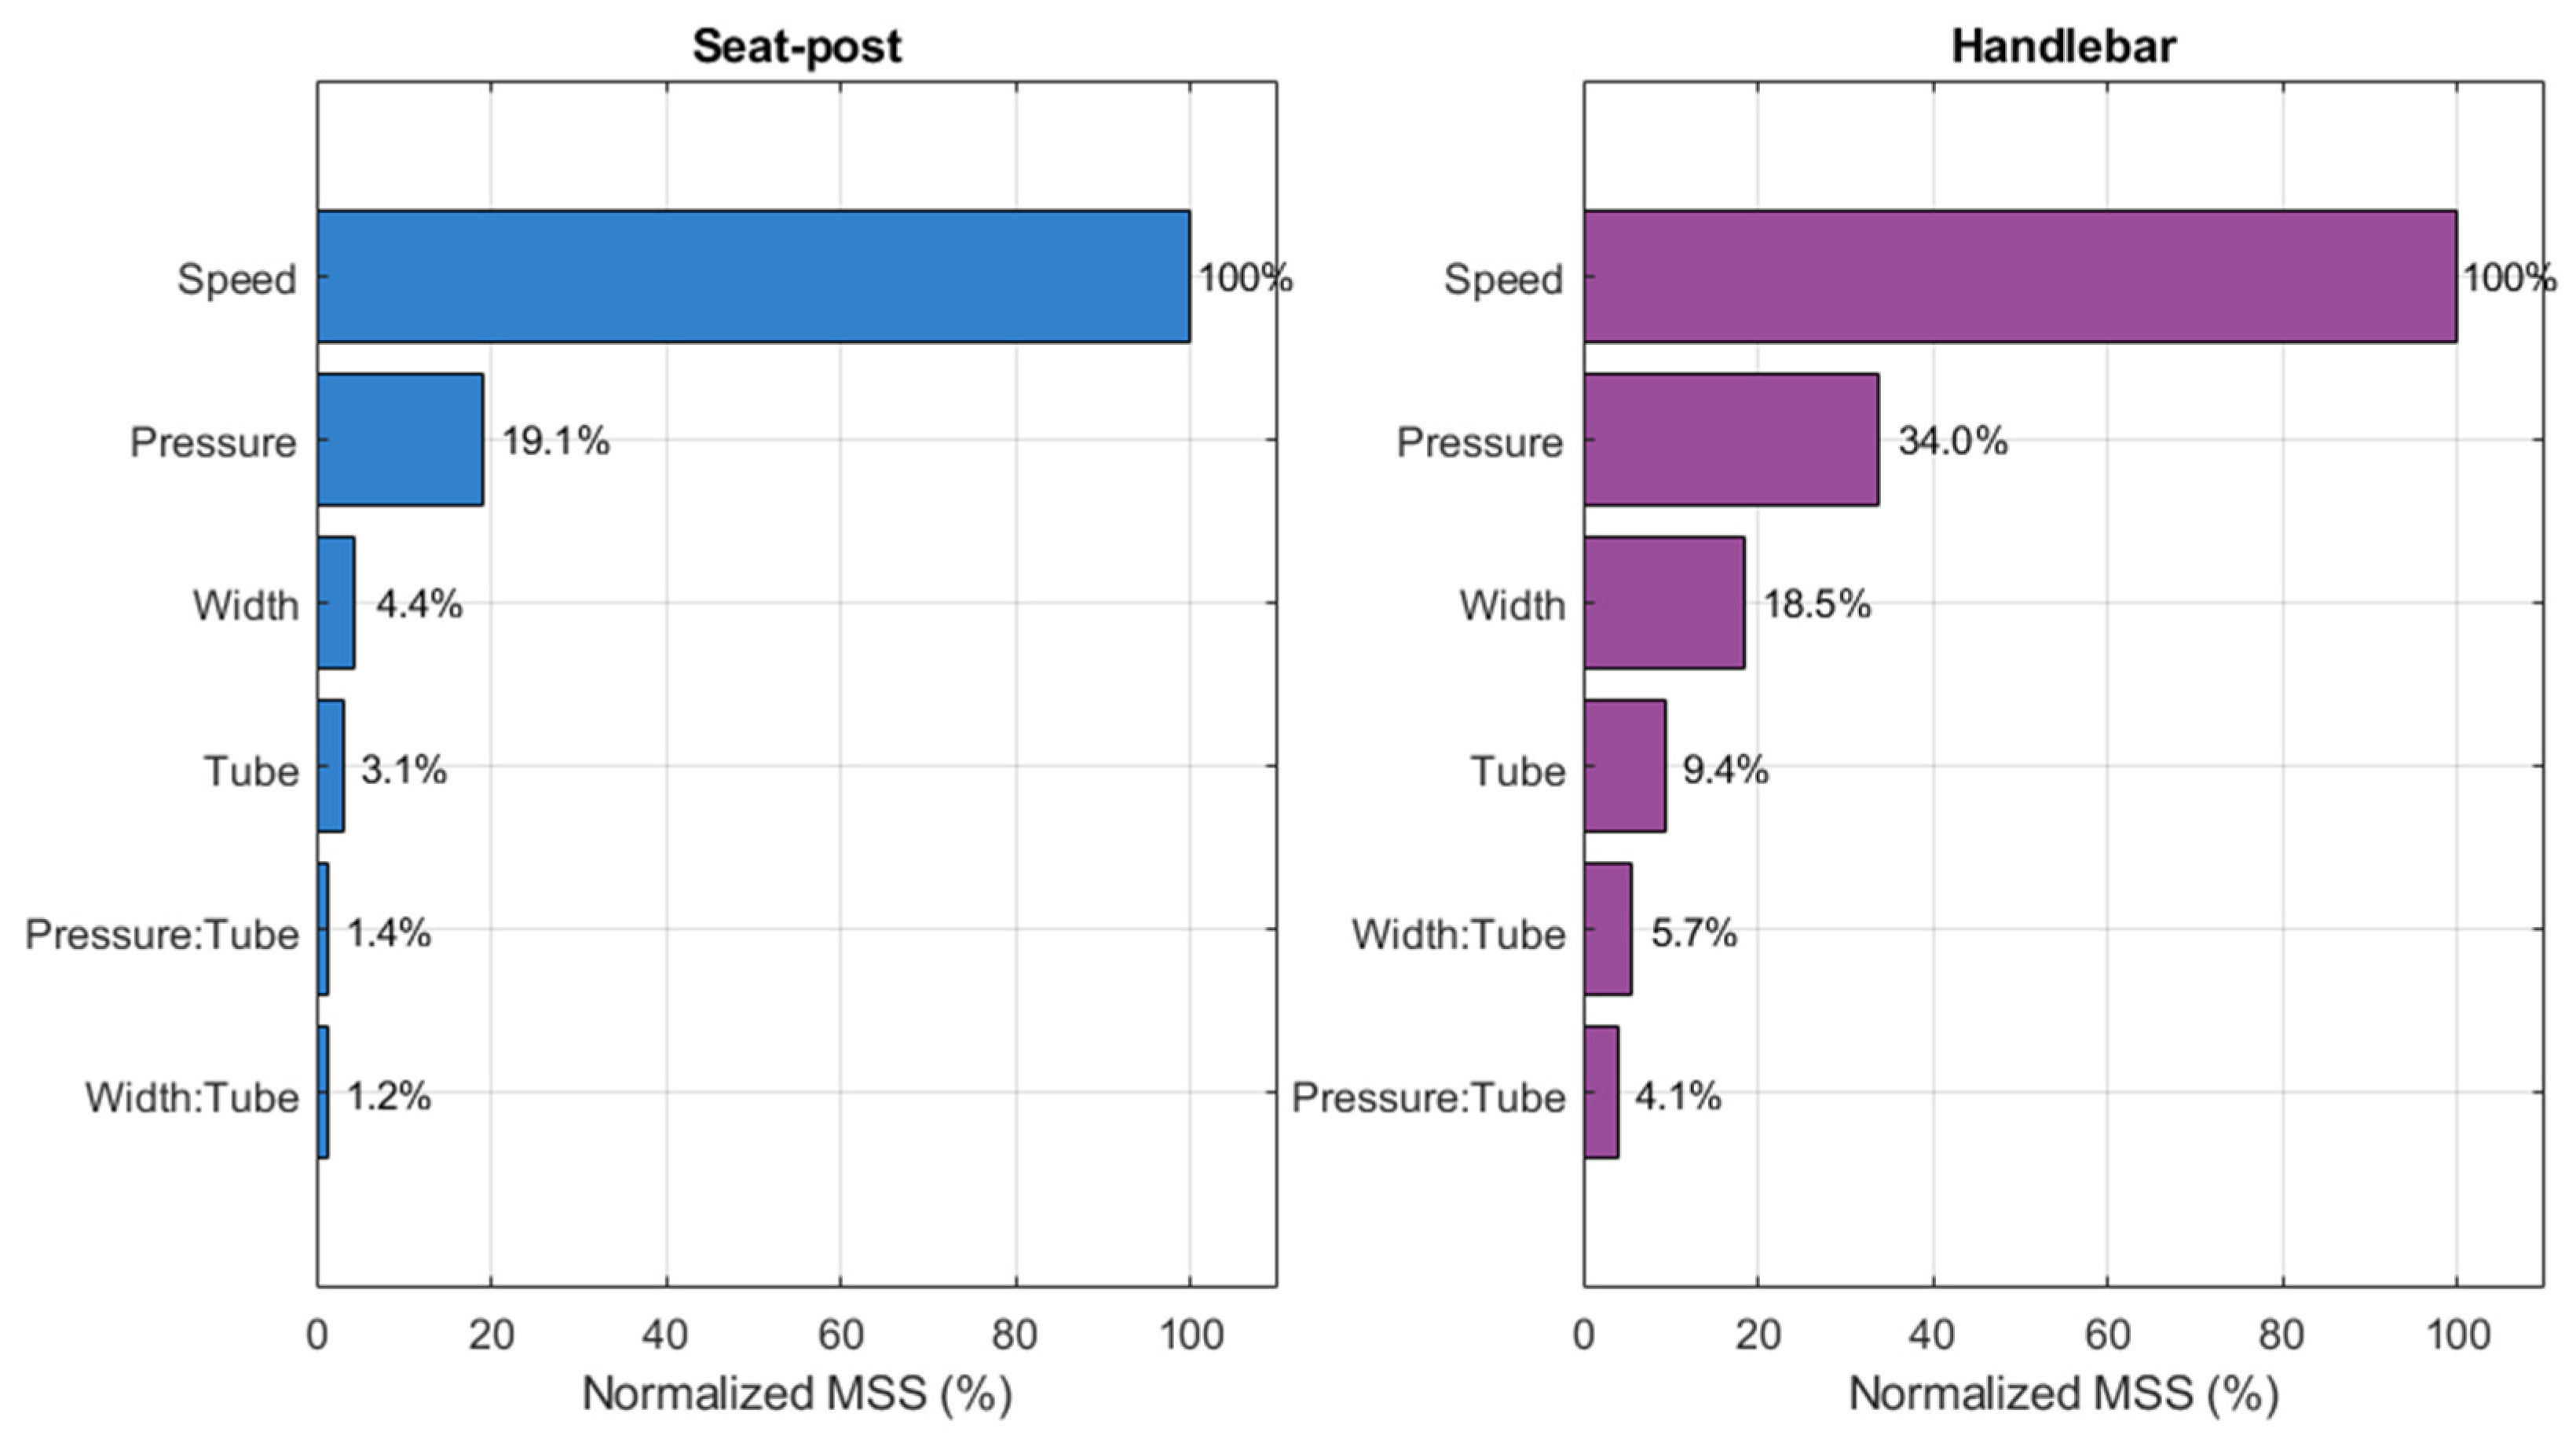
Figure 13 compares the most significant factors, with the effect of speed normalized to 100. Speed clearly emerges as the dominant factor influencing vibration. Among tire-related characteristics, inflation pressure, section width, and the presence of an innertube are statistically significant, in that order, but all are considerably less influential than speed. For example, pressure accounts for at most 34% of the effect of speed on handlebar vibrations.
The model fitting the data is described by Equation (1) and illustrated in
Figure 12. To better focus on the tire-related effects, it is useful to separate low- and high-speed conditions (left and right panels in
Figure 12). Once this separation is made, the influence of tire characteristics becomes more visually evident by further distinguishing between innertube or tubeless conditions (
Figure 12 top and bottom panels). For example, inflation pressure has a greater effect on innertube tires, whereas tire section width, which is often central in discussions in both the literature and among specialists, has a more pronounced impact on handlebar vibrations in the case of tubeless tires. These observations hold true under both high- and low-speed conditions, albeit to a different extent, and allow for the estimation of RMS acceleration at the handlebar for different inflation pressures or tire section widths.
A further consideration concerns cyclist health protection and exposure to vibration, as addressed by safety standards. These standards distinguish between hand-transmitted vibrations [
7] and whole body vibrations [
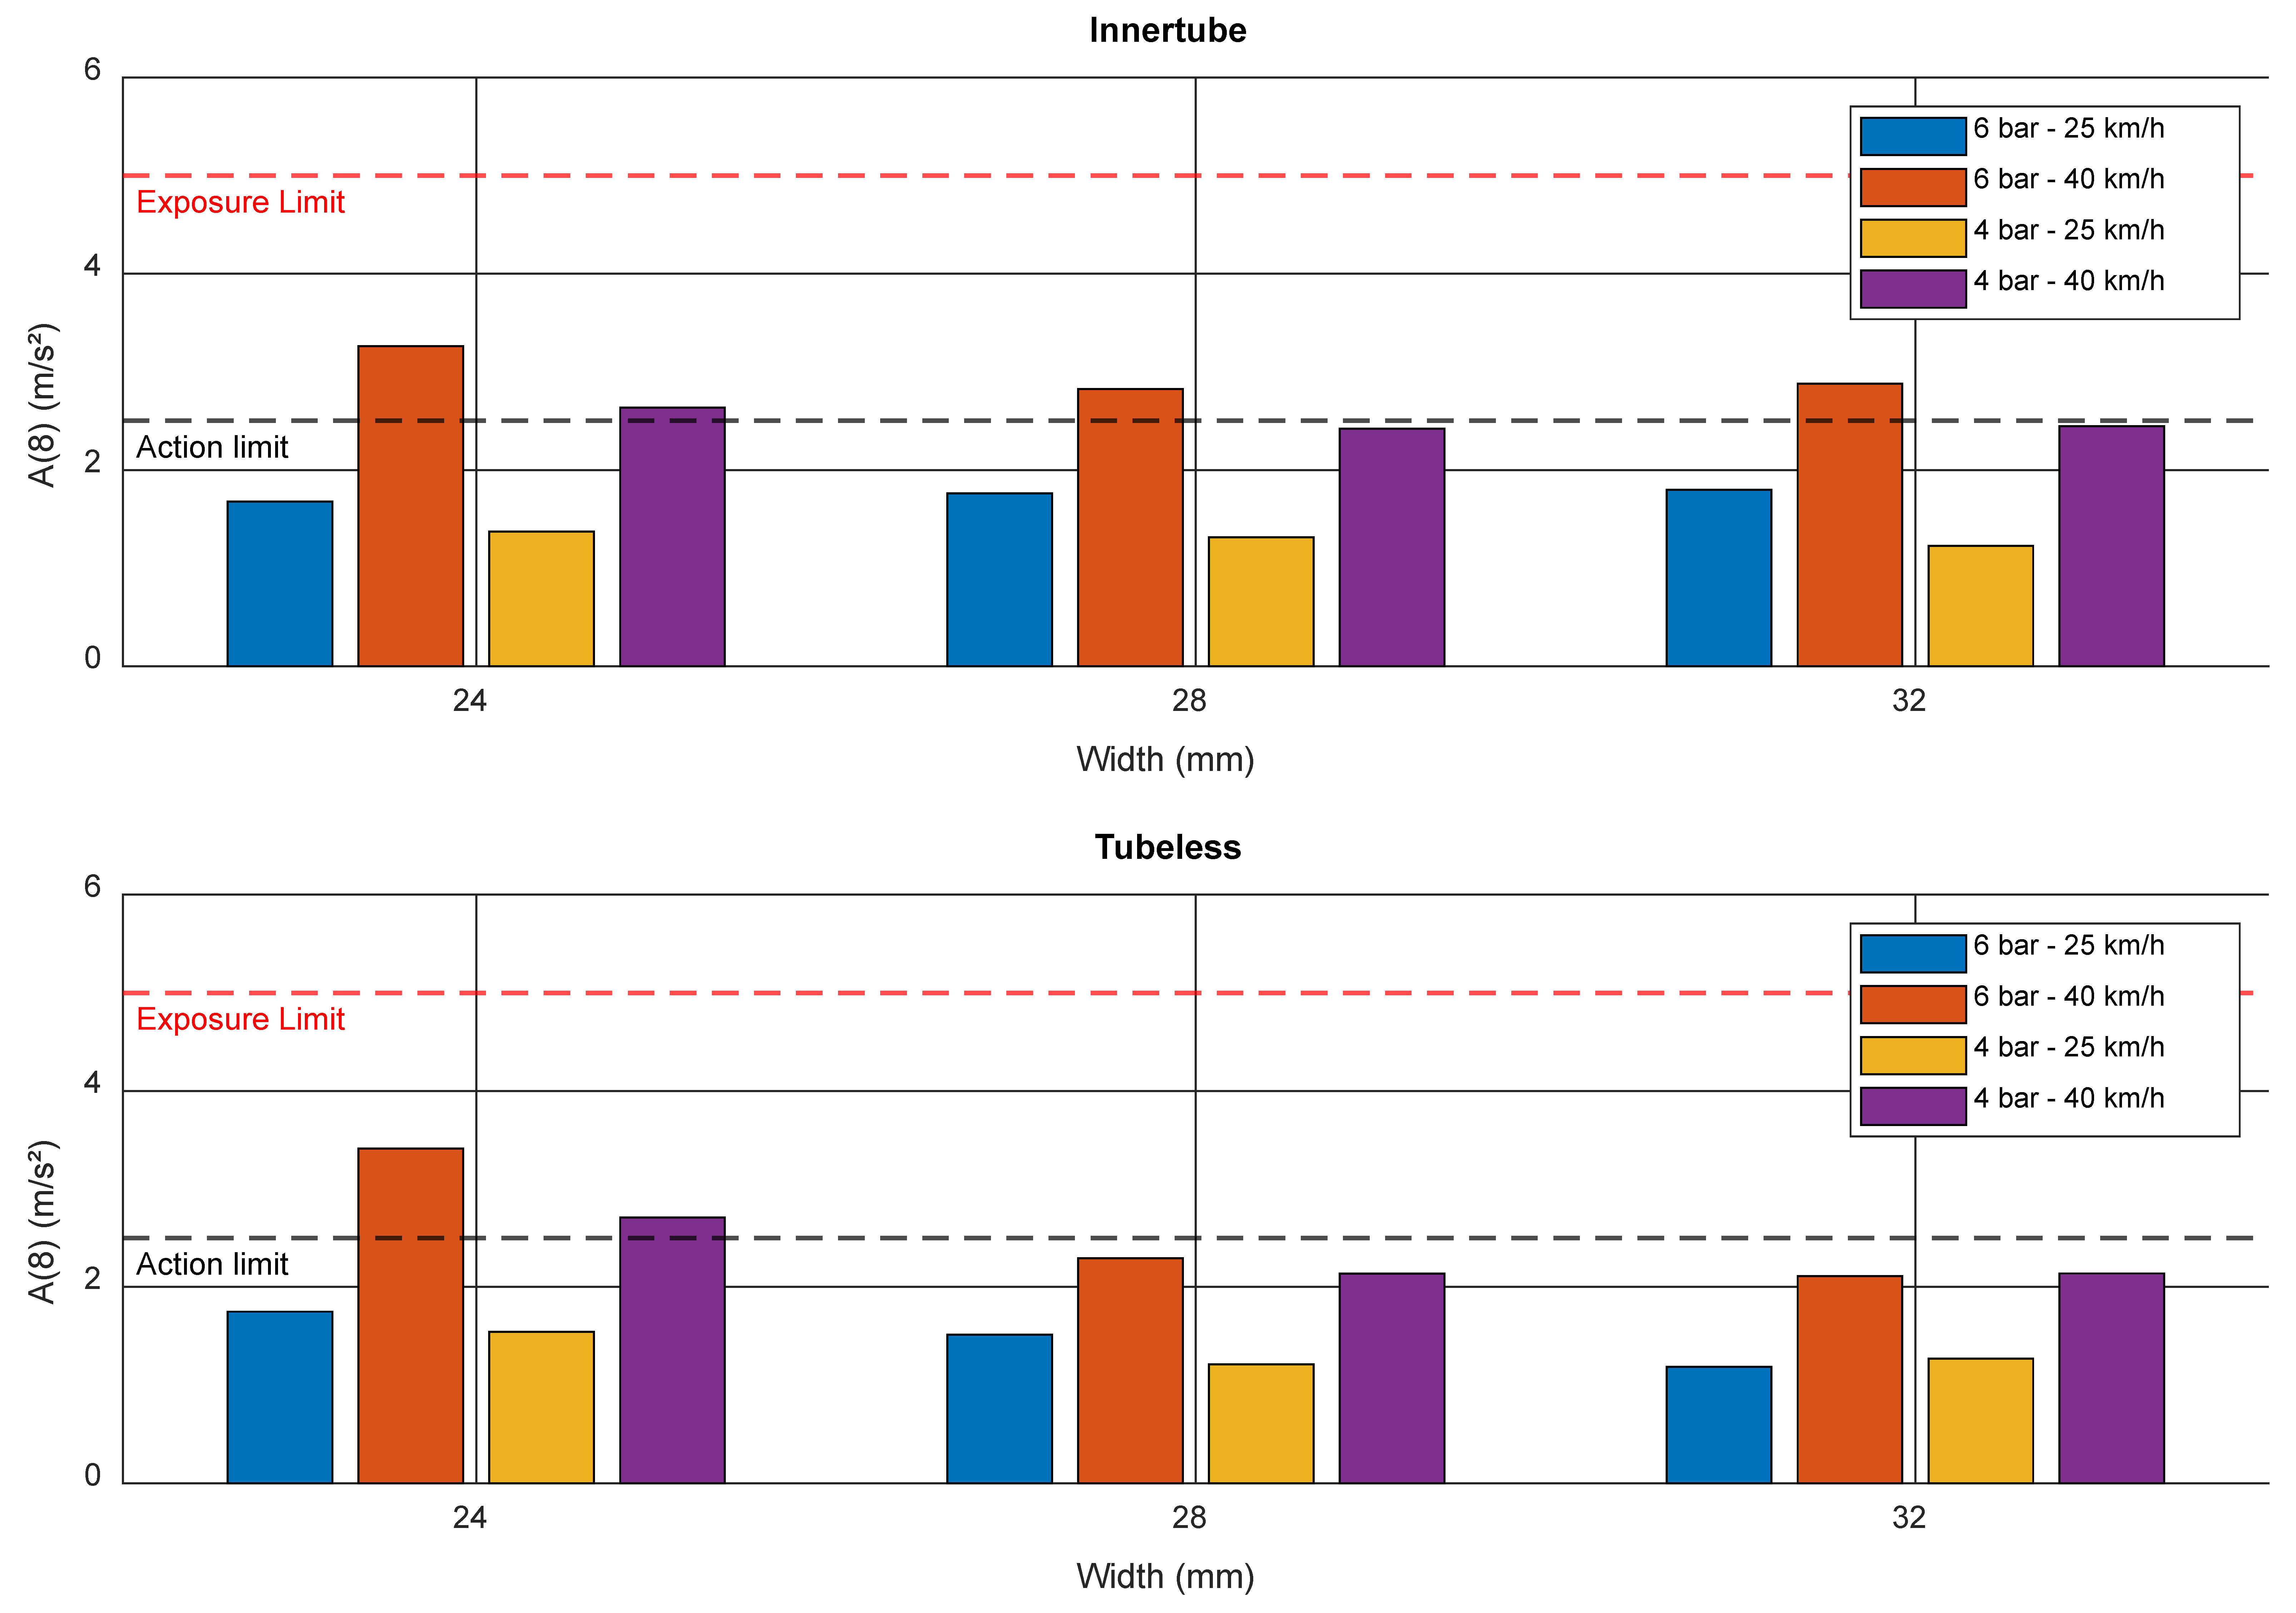
6]. The former applies to handlebar measurements, while the latter refers to vibrations at the seat-post. In both cases, the vibration spectrum must be weighted using frequency-dependent coefficients, which account for the transmissibility of vibration to the human body. Once the weighted RMS acceleration is obtained, the transmitted energy must be calculated based on the expected exposure time and compared to the standard 8 h reference period. While the procedure is the same for hand- and whole body-transmitted vibrations, the regulatory thresholds are different. The standards define two thresholds. Below the lowest one, called action limit, corresponding to A(8) = 2.5
for vibrations transmitted through the hand, there is a negligible risk for the health. Above this first limit and below the second one, called exposure limit, A(8) = 5
for the hand, protective measures should be adopted, in our case the ribbon tape on the handlebar, or padded gloves or shock-absorbing shorts. It is worth noting that in all trials the sensors were mounted on rigid components either on the seat-post tube, under the saddle, or directly on the handlebar, without any damping material. Above the exposure limit, work, or in our case cycling, should be interrupted to prevent excessive vibration exposure and potential health risks. The standards also provide indication for the measurement procedure, such as to reproduce real working conditions, to mount the sensor at the interface with the body, and to adapt usual protection devices such as gloves. Although the present measurements were not specifically designed for regulatory assessment, the results can still provide useful insights into the effects of tires on vibration exposure.
Figure 14 presents the A(8) exposure under the most critical test conditions described above, assuming a 4 h ride. At low speed (25 km/h), a 32 mm-width tire inflated to 4 bar provides the lowest exposure to the cyclist regardless of the presence of an innertube. Conversely, at high speed (40 km/h) the narrowest tire inflated to the highest pressure results in the maximum vibration exposure. Furthermore, when speed is high, the difference between high and low pressure becomes evident only for the widest tire (32 mm). It should be noted that this study is solely focused on tires characteristics, and an effective measurement of the exposure should be carried out in full compliance with the relevant standards.
8. Conclusions and Limitations
The purpose of this study was the development of a measurement system to investigate vibrations transmitted to the cyclist during a ride. The proposed measurement system proved to be effective for the intended application; however, laboratory tests revealed some limitations. The frequency response was limited to 400 Hz considering an amplitude tolerance of 15%, and the sampling frequency showed slight differences between sensors (1.2%) and a deviation from the nominal 1344 Hz up to 2.7%. These values were deemed acceptable for this application, where many other factors influence the accuracy and repeatability of measurement results. In future work, alternative sensors will be considered, while maintaining the fundamental approach based on a MEMS accelerometer.
The system was tested by investigating the effects of bicycle tires on vibrations. Tires were found to affect vibration levels, although the cycling speed was by far the most influential factor. Among tire-related conditions, the most comfortable configuration, with the lowest vibration level, was achieved with a wider tire inflated at low pressure. The worst condition corresponds to a narrower tire at high pressure. Although these results align with the expectations, the study provides a quantitative evaluation of the effects and proposes a model to describe the tire effects at low or high cycling speed.
The measurement system and the data processing procedure proved effective and can be applied in future tests or during real world cycling sessions. However, the results obtained are subject to several limitations, which must be taken into account to avoid drawing general conclusions. We have considered only a single subject with specific anthropometry and bike fitting, whereas a properly designed sample of cyclists would be required to obtain more generalizable results. The statistical analysis and the regression model are related only to the test circuit, with its smooth asphalt conditions, in contrast to typical roads. Finally, a specific bike frame and wheelset were used, fitted with only one type of tire. This prevents us verifying possible effects due to the rigidity of different components, or material or tread pattern of the tires.
Due to these limitations it is difficult to provide a cyclist with practical advice regarding tire choice. The main recommendation would be to use proper equipment with absorbing pads to limit as much as possible the transmission of vibrations to the body through the contact points.
