5.1. Model Validation
Solar irradiance is nearly uniform across the city, allowing for the use of radiation data from the Mashhad synoptic station. Weather data was collected over a 12-h period (6:00 a.m. to 6:00 p.m.) from a weather website.
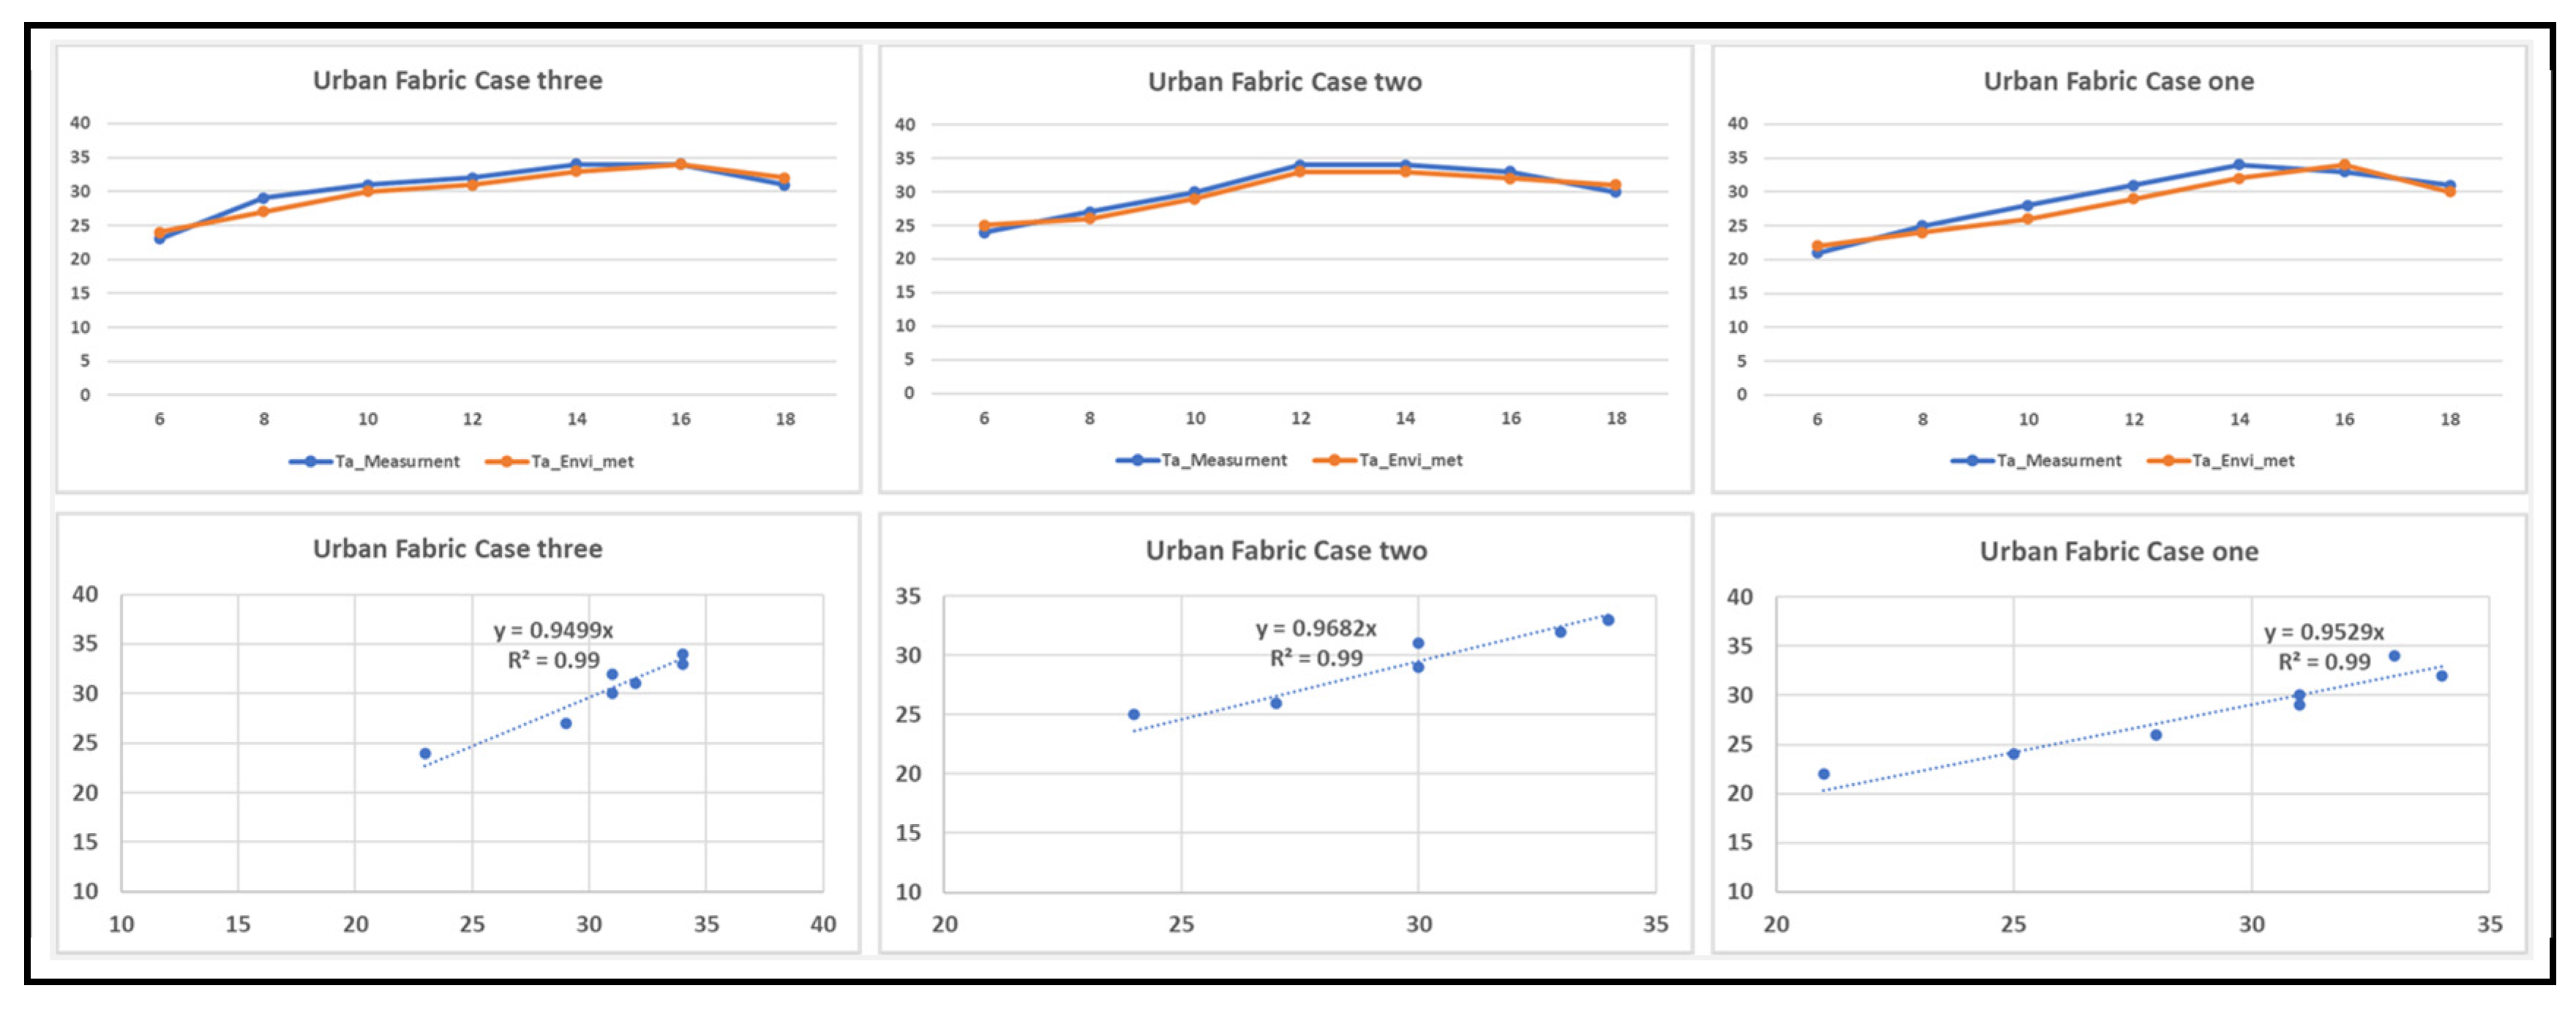
Figure 5 shows the temporal changes in both measured and simulated air temperatures (Ta) for Urban Fabric Case zones one, two, and three. The comparison reveals that, in the morning to mid-afternoon, measured temperatures are slightly higher than simulated ones, while later in the day simulated temperatures are generally higher.
To assess the accuracy of the ENVI-met simulations in analyzing the impact of building density on the microclimate in Mashhad District 9, the percentage error between observed and simulated air temperature data was calculated. In this analysis, the measured value refers to field-recorded air temperature, while the simulated value corresponds to results generated by the ENVI-met model. Equation (1) was used to calculate the error percentage.
This calculation provides a quantitative evaluation of the model’s reliability in replicating real-world microclimatic conditions [
46,
47,
48]
The mean absolute percentage error (MAPE) was determined to be 2.39% for Urban Fabric Case One, 1.65% for Urban Fabric Case Three, and 1.60% for Urban Fabric Case Two. Additionally, regression analysis of the measured versus simulated values yielded R
2 values of 0.99 for all zones (see
Table 6), highlighting the high accuracy of the ENVI-met model in replicating actual temperature patterns.
The analysis of Root Mean Square Error (RMSE) values offers critical insight into the predictive performance of the simulation model. As RMSE quantifies the average deviation between predicted and observed values, lower RMSE values denote higher model accuracy. Among the datasets evaluated, the first dataset yielded the most accurate results, with an RMSE of 1.60, indicating a strong correlation with empirical temperature measurements. In contrast, the third dataset, which recorded an RMSE of 2.39, exhibited the weakest performance, suggesting greater deviation from actual temperature values.
This trend is further supported by the mean absolute error (MAE) results presented in
Table 3 and illustrated in
Figure 5, which show an average deviation of 2.1% between simulated and observed air temperatures. However, the model’s accuracy was not spatially uniform. It achieved its highest precision in shaded urban areas, likely due to the thermal buffering effect of reduced solar radiation and increased surface reflectivity in those zones. Conversely, predictive errors were notably higher over exposed asphalt surfaces.
Simulations were conducted for all three urban fabrics, and the resulting microclimate indices were presented for each. The following section discusses each fabric in terms of both its morphological and microclimate aspects.
The simulation results were validated based on the methodologies, described in
Table 7, of earlier studies. This validation was conducted to assess the accuracy and consistency of the microclimate model used in this research. By following well-established validation procedures, the study aimed to confirm the model’s ability to represent Mashhad’s specific climatic conditions. Ensuring the reliability of the model was a necessary step before analyzing the selected urban development patterns. This process helped establish a solid foundation for the case studies and ensured that the findings could be meaningfully compared with previous research.
5.2. Urban Fabric Case One
As shown in
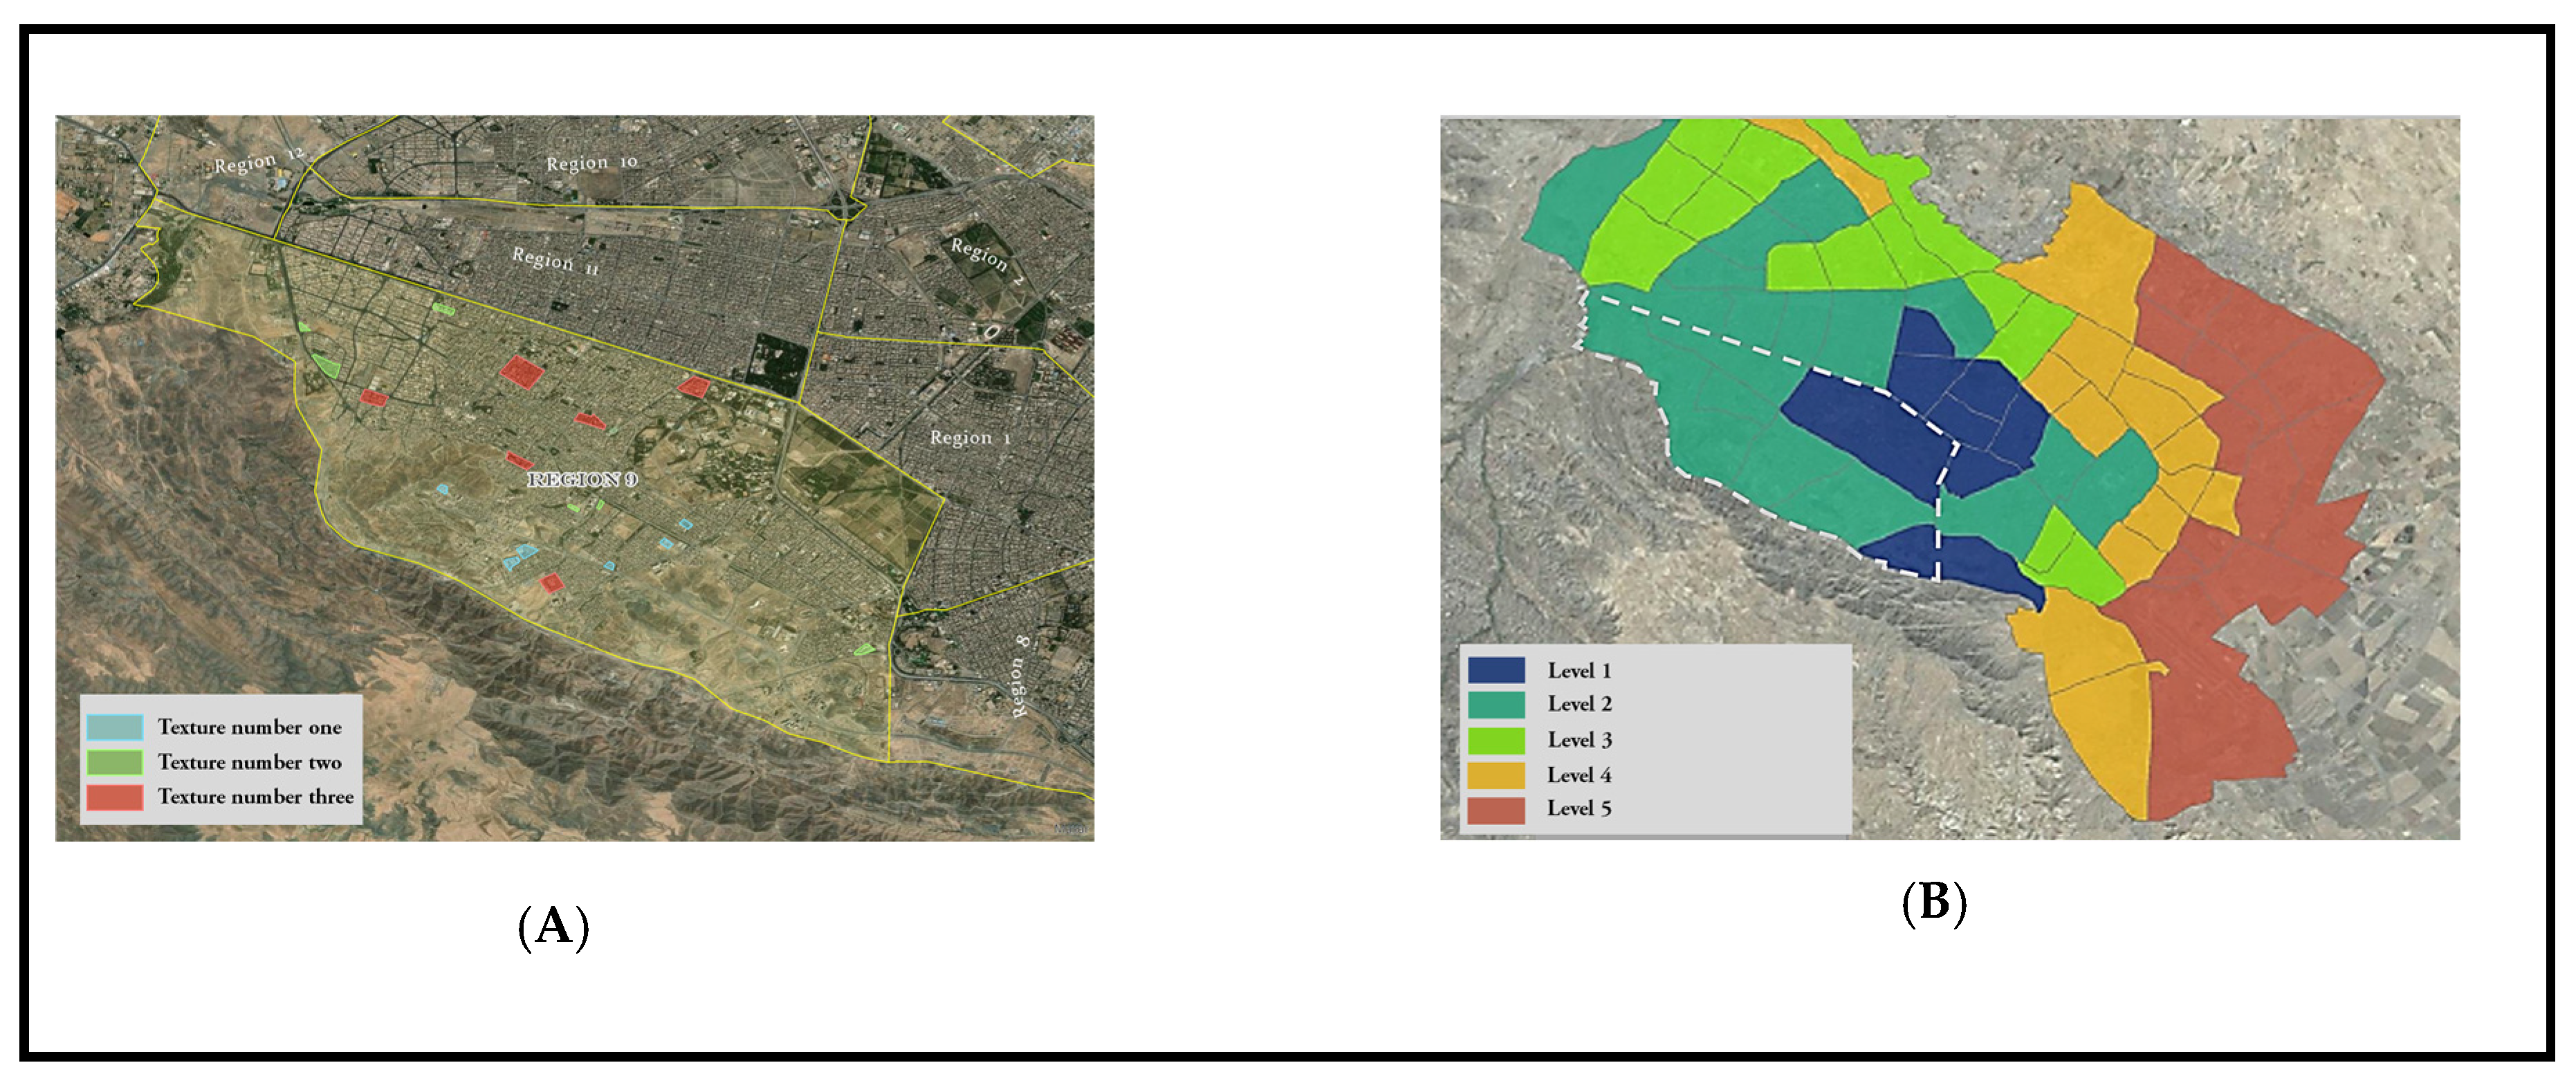
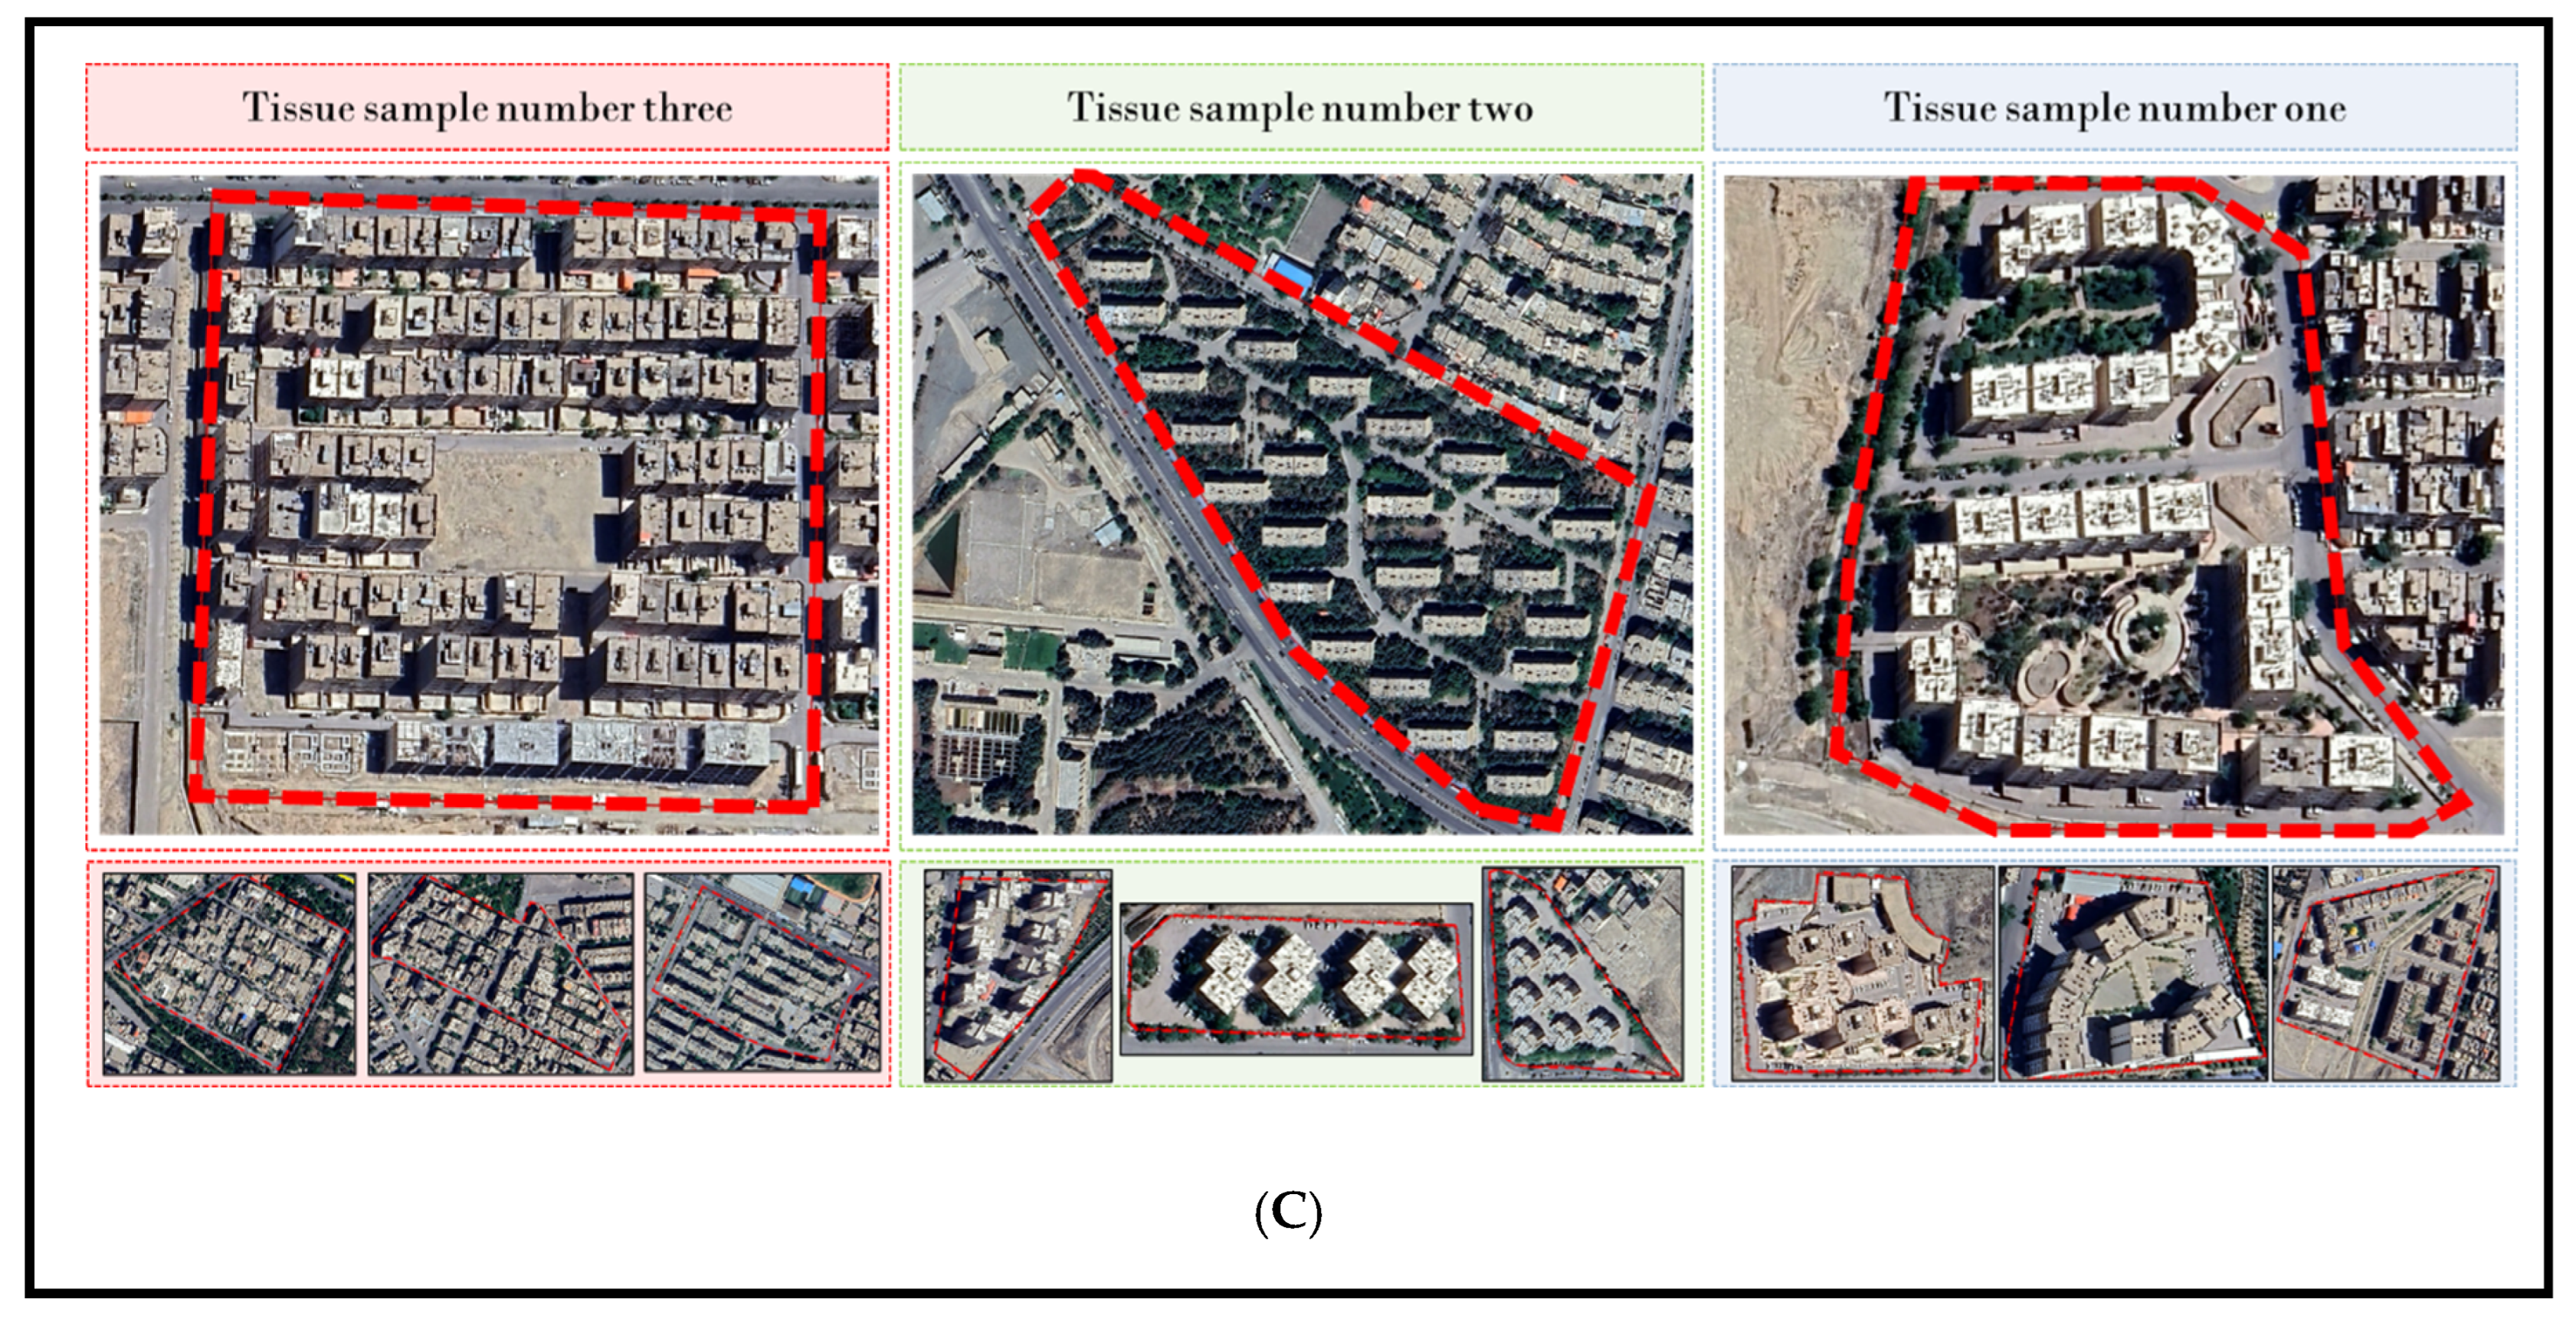
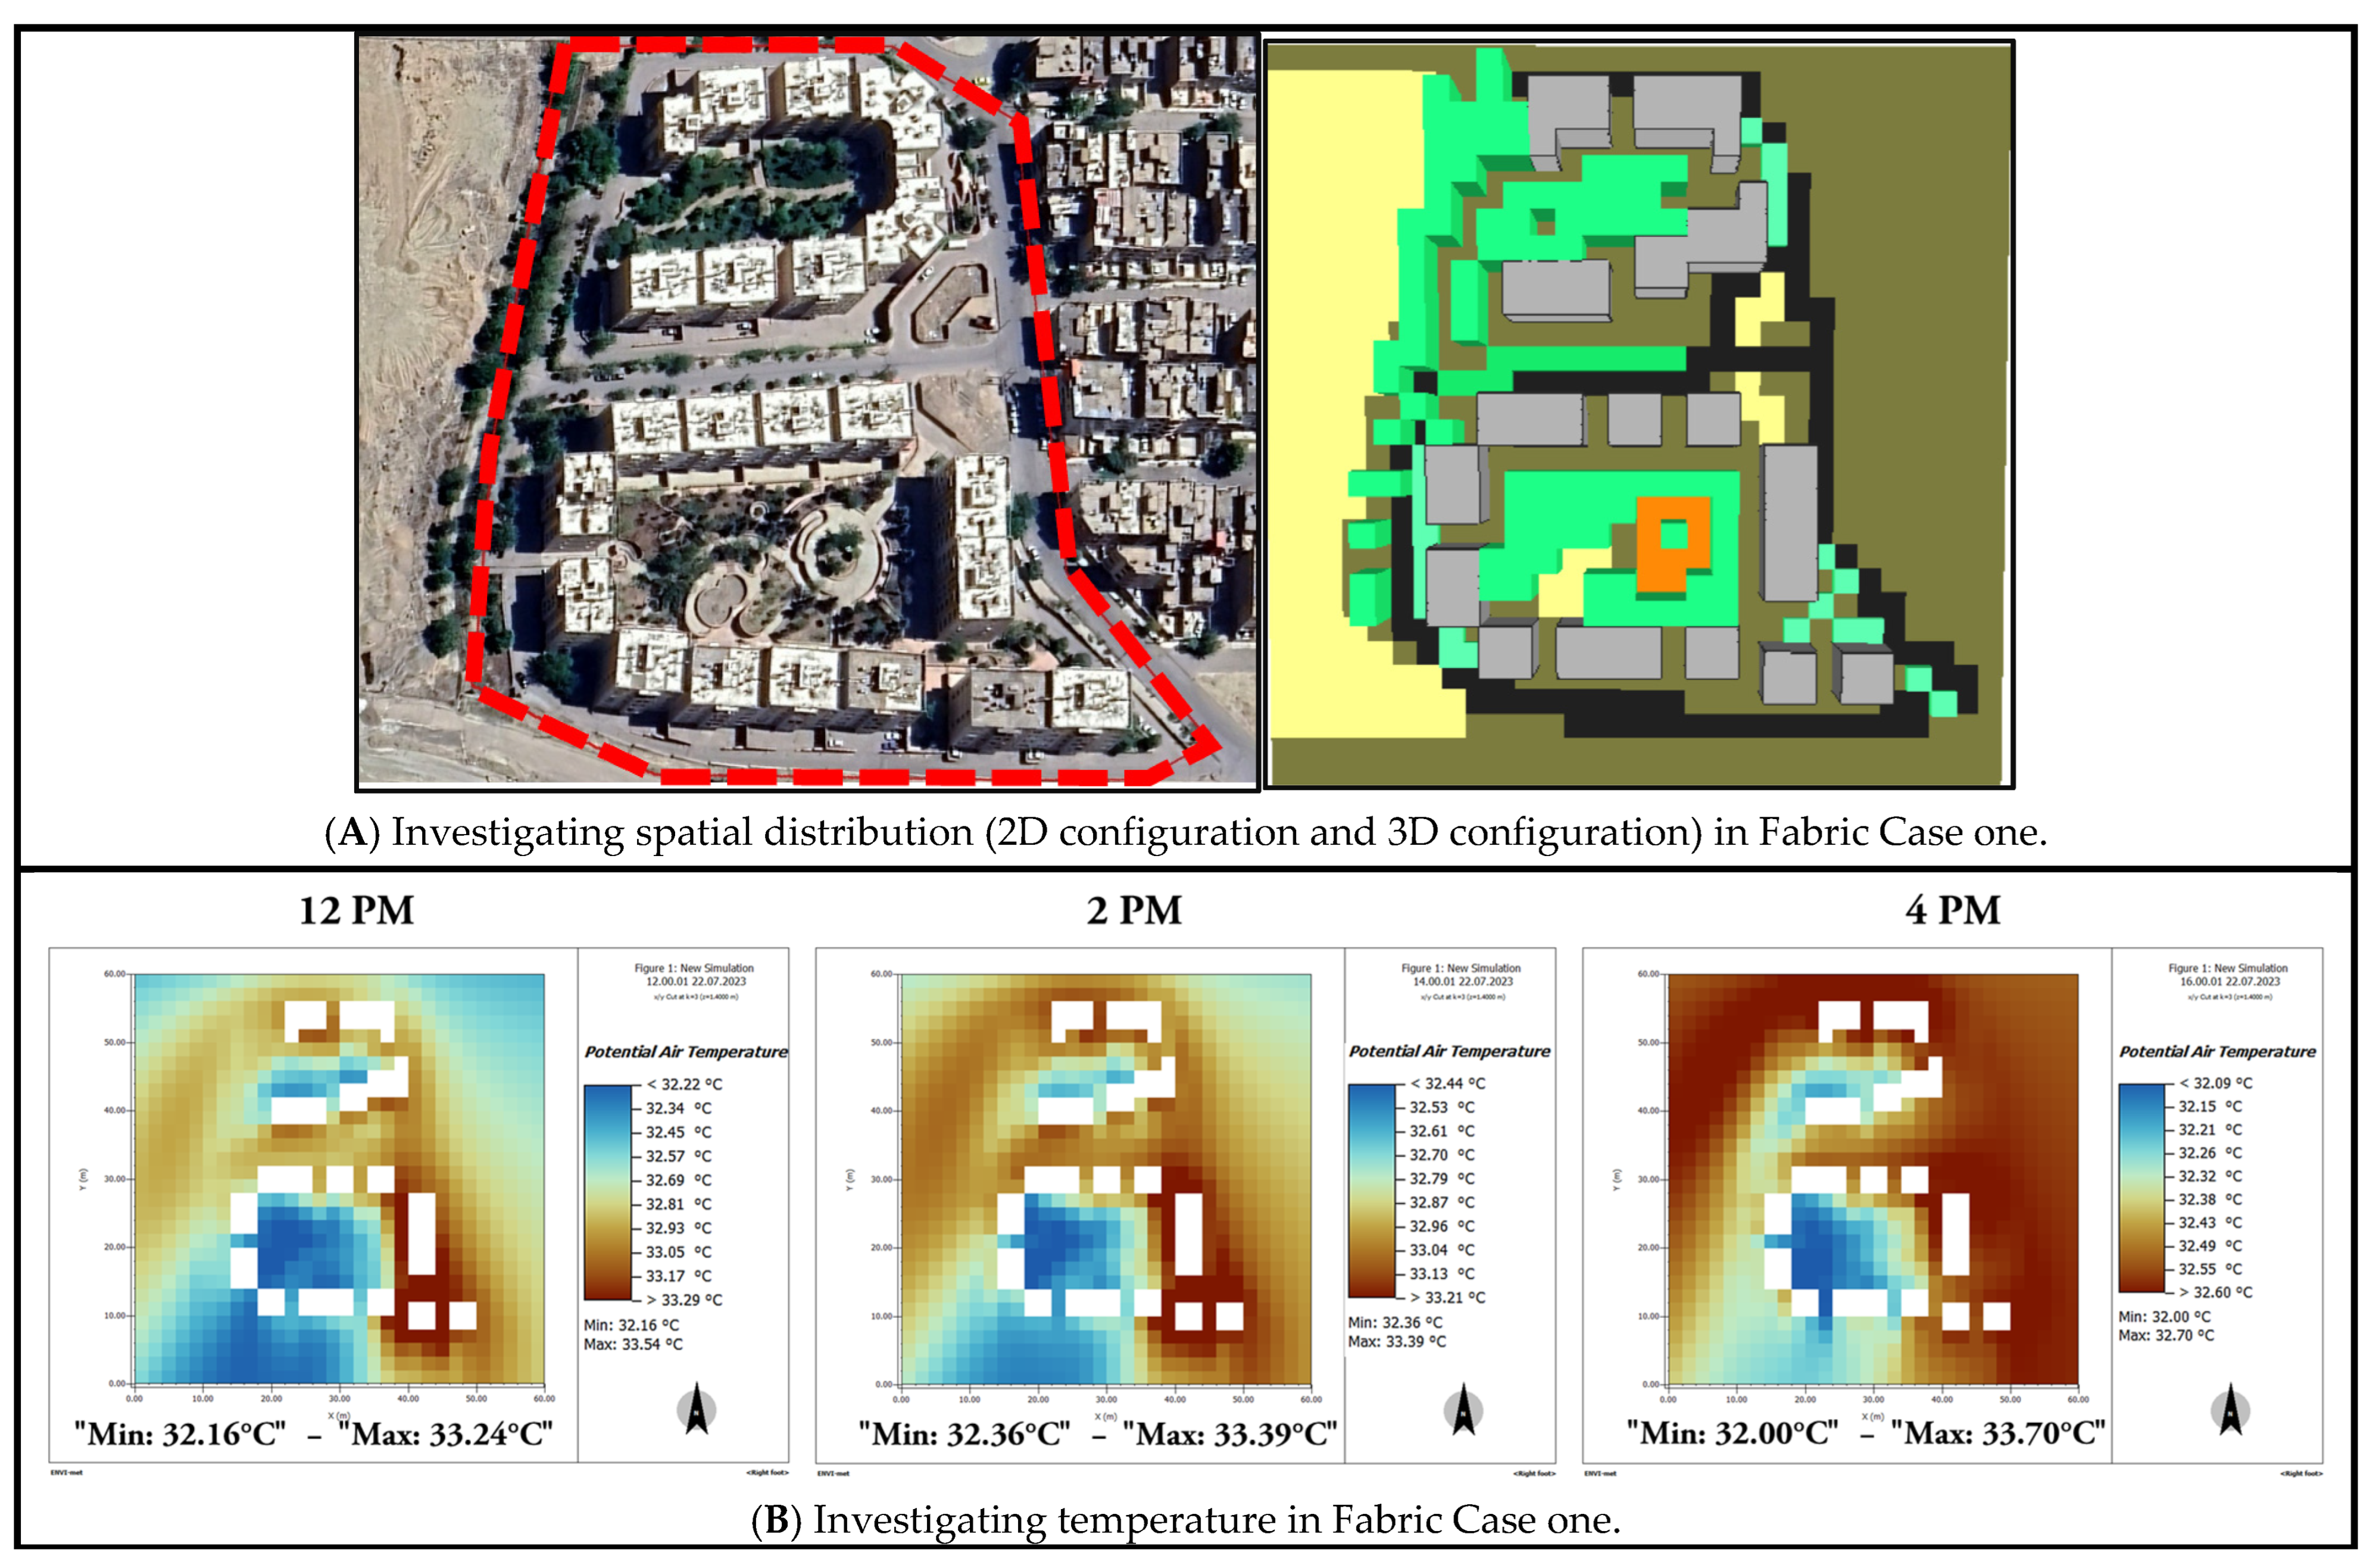
Figure 3, this urban fabric is a recent development in Mashhad’s 9th district, built over the past 10 years. The buildings typically range from 1 to 10 stories, with an average of 3.5 stories. This area has the highest average building and population density, which is consistent with its residential zoning (
Table 8). Consequently, the observed density aligns with expected values.
The buildings are designed with a central courtyard, which records the lowest temperature (32.21 °C), the lowest average radiant temperature (39.24 °C), and the highest humidity (22.77%). These favorable conditions are likely due to the vegetation and shading from the surrounding buildings. Additionally, the tall structures around the courtyard block wind, resulting in the highest wind speed (0.92 m/s) in this area.
Figure 6 presents the spatial distribution of key microclimatic variables—air temperature, relative humidity, mean radiant temperature (MRT), and wind speed—at three different times (12 PM, 2 PM, and 4 PM) for Texture Number 1. The findings underscore the significant impact of urban morphology on local environmental conditions.
Air Temperature: Throughout the day, air temperature fluctuates, with midday values ranging from 33 °C to 34 °C, influenced by partial solar exposure and shading. By 2 PM, direct solar radiation increases temperatures above 35 °C in exposed areas, while shaded regions remain around 33 °C, highlighting the cooling effect of building-induced shade. At 4 PM, temperatures slightly decrease to around 34 °C, though densely built areas retain residual heat due to their higher thermal inertia (
Figure 6B).
Relative Humidity: Humidity follows an inverse pattern to temperature changes. At 12 PM, moisture levels are relatively stable. By 2 PM, increased solar radiation intensifies evaporation, lowering humidity in sunlit areas, while shaded zones retain more moisture. At 4 PM, humidity levels stabilize or slightly rise as solar intensity decreases, reflecting how urban structures modulate local moisture dynamics (
Figure 6C).
Mean Radiant Temperature (MRT): MRT shows a clear temporal increase, ranging from about 31 °C (lighter hues) to nearly 40 °C (darker hues). At midday, MRT typically falls between 31 °C and 35 °C. By 2 PM, values increase to 35–38 °C, aligning with peak solar exposure. By 4 PM, large portions of the urban fabric experience MRTs exceeding 38 °C, with some areas nearing 40 °C (
Figure 6D).
Wind Speed: Wind patterns also highlight the role of urban morphology. At 12 PM, wind speeds range from 1.8 m/s to 2.6 m/s, with a prevailing direction around 130°. By 2 PM, wind speeds increase, particularly in the northern sector, surpassing 3.0 m/s, and shifting to a dominant direction of 145°. At 4 PM, wind speeds exceed 3.5 m/s in certain areas, stabilizing at a prevailing direction of 150° (
Figure 6E).
5.3. Urban Fabric Case Two
As shown in
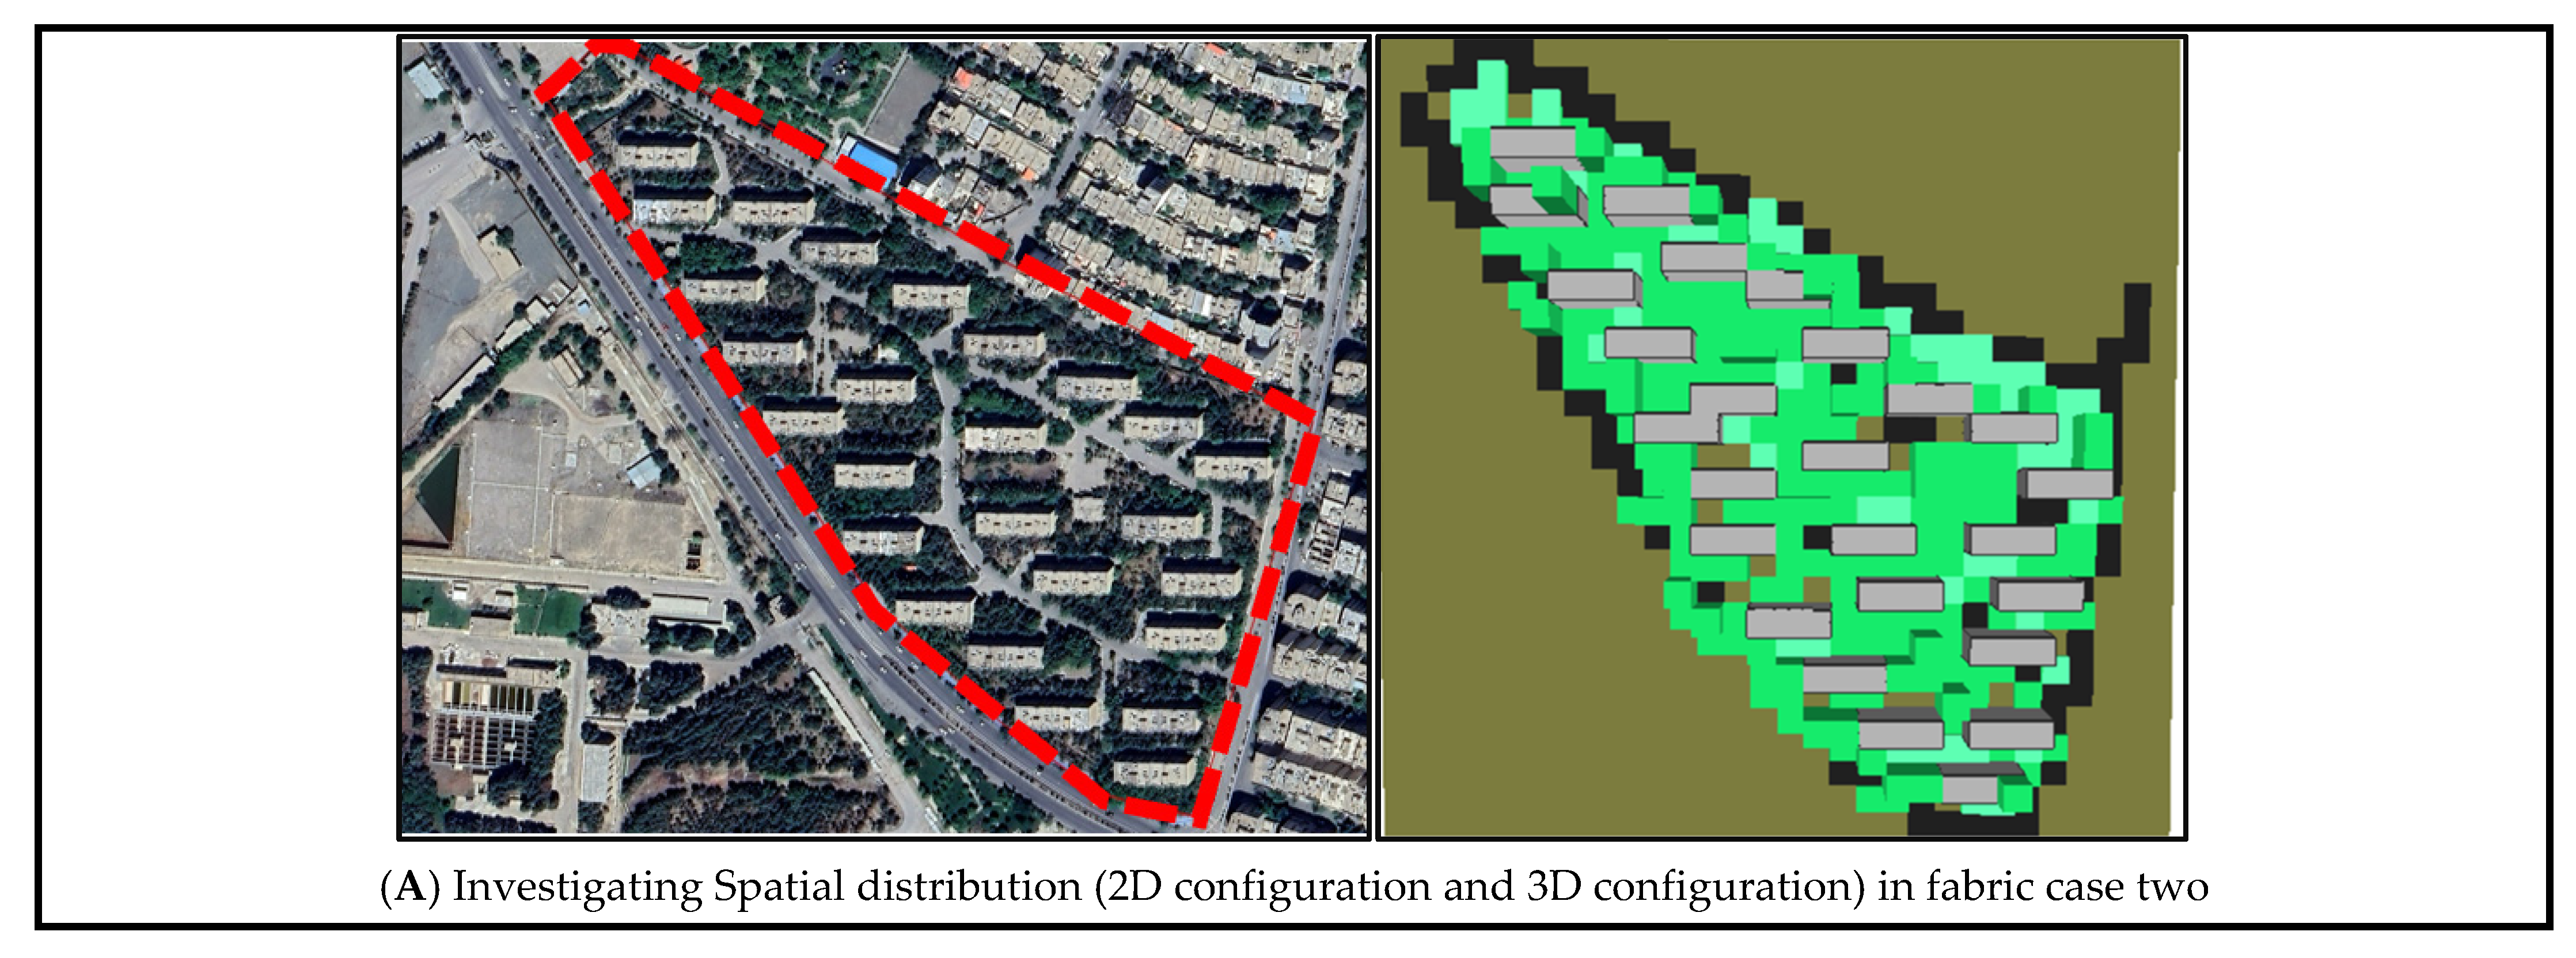
Figure 2, this urban fabric is spread across different parts of District 9 and cannot be considered entirely new or innovative. The buildings in this area are scattered and primarily designated for residential use, with an average of 2.84 stories per building (
Table 9).
The spaces between these buildings are densely planted with vegetation, particularly trees.
Dense vegetation inhibits wind flow, leading to the accumulation of hot and humid air, which is evident in the northern part of this fabric, where the temperature reaches 33.86 °C and wind speed is low (0.87 m/s) (
Table 7). The vegetation, which often matches the height of the buildings, also provides shade and prevents direct solar radiation in open and semi-open areas, resulting in the lowest average radiant temperature in most parts of this area.
The presence of open spaces in the southern part of the district (outside the studied area) facilitates the penetration of cooler air, leading to the lowest temperature (32.62 °C) in this section. As a result, the southern part of the fabric has a more comfortable temperature (33.17 °C), with high humidity (20.21%) and a higher wind speed (2.38 m/s).
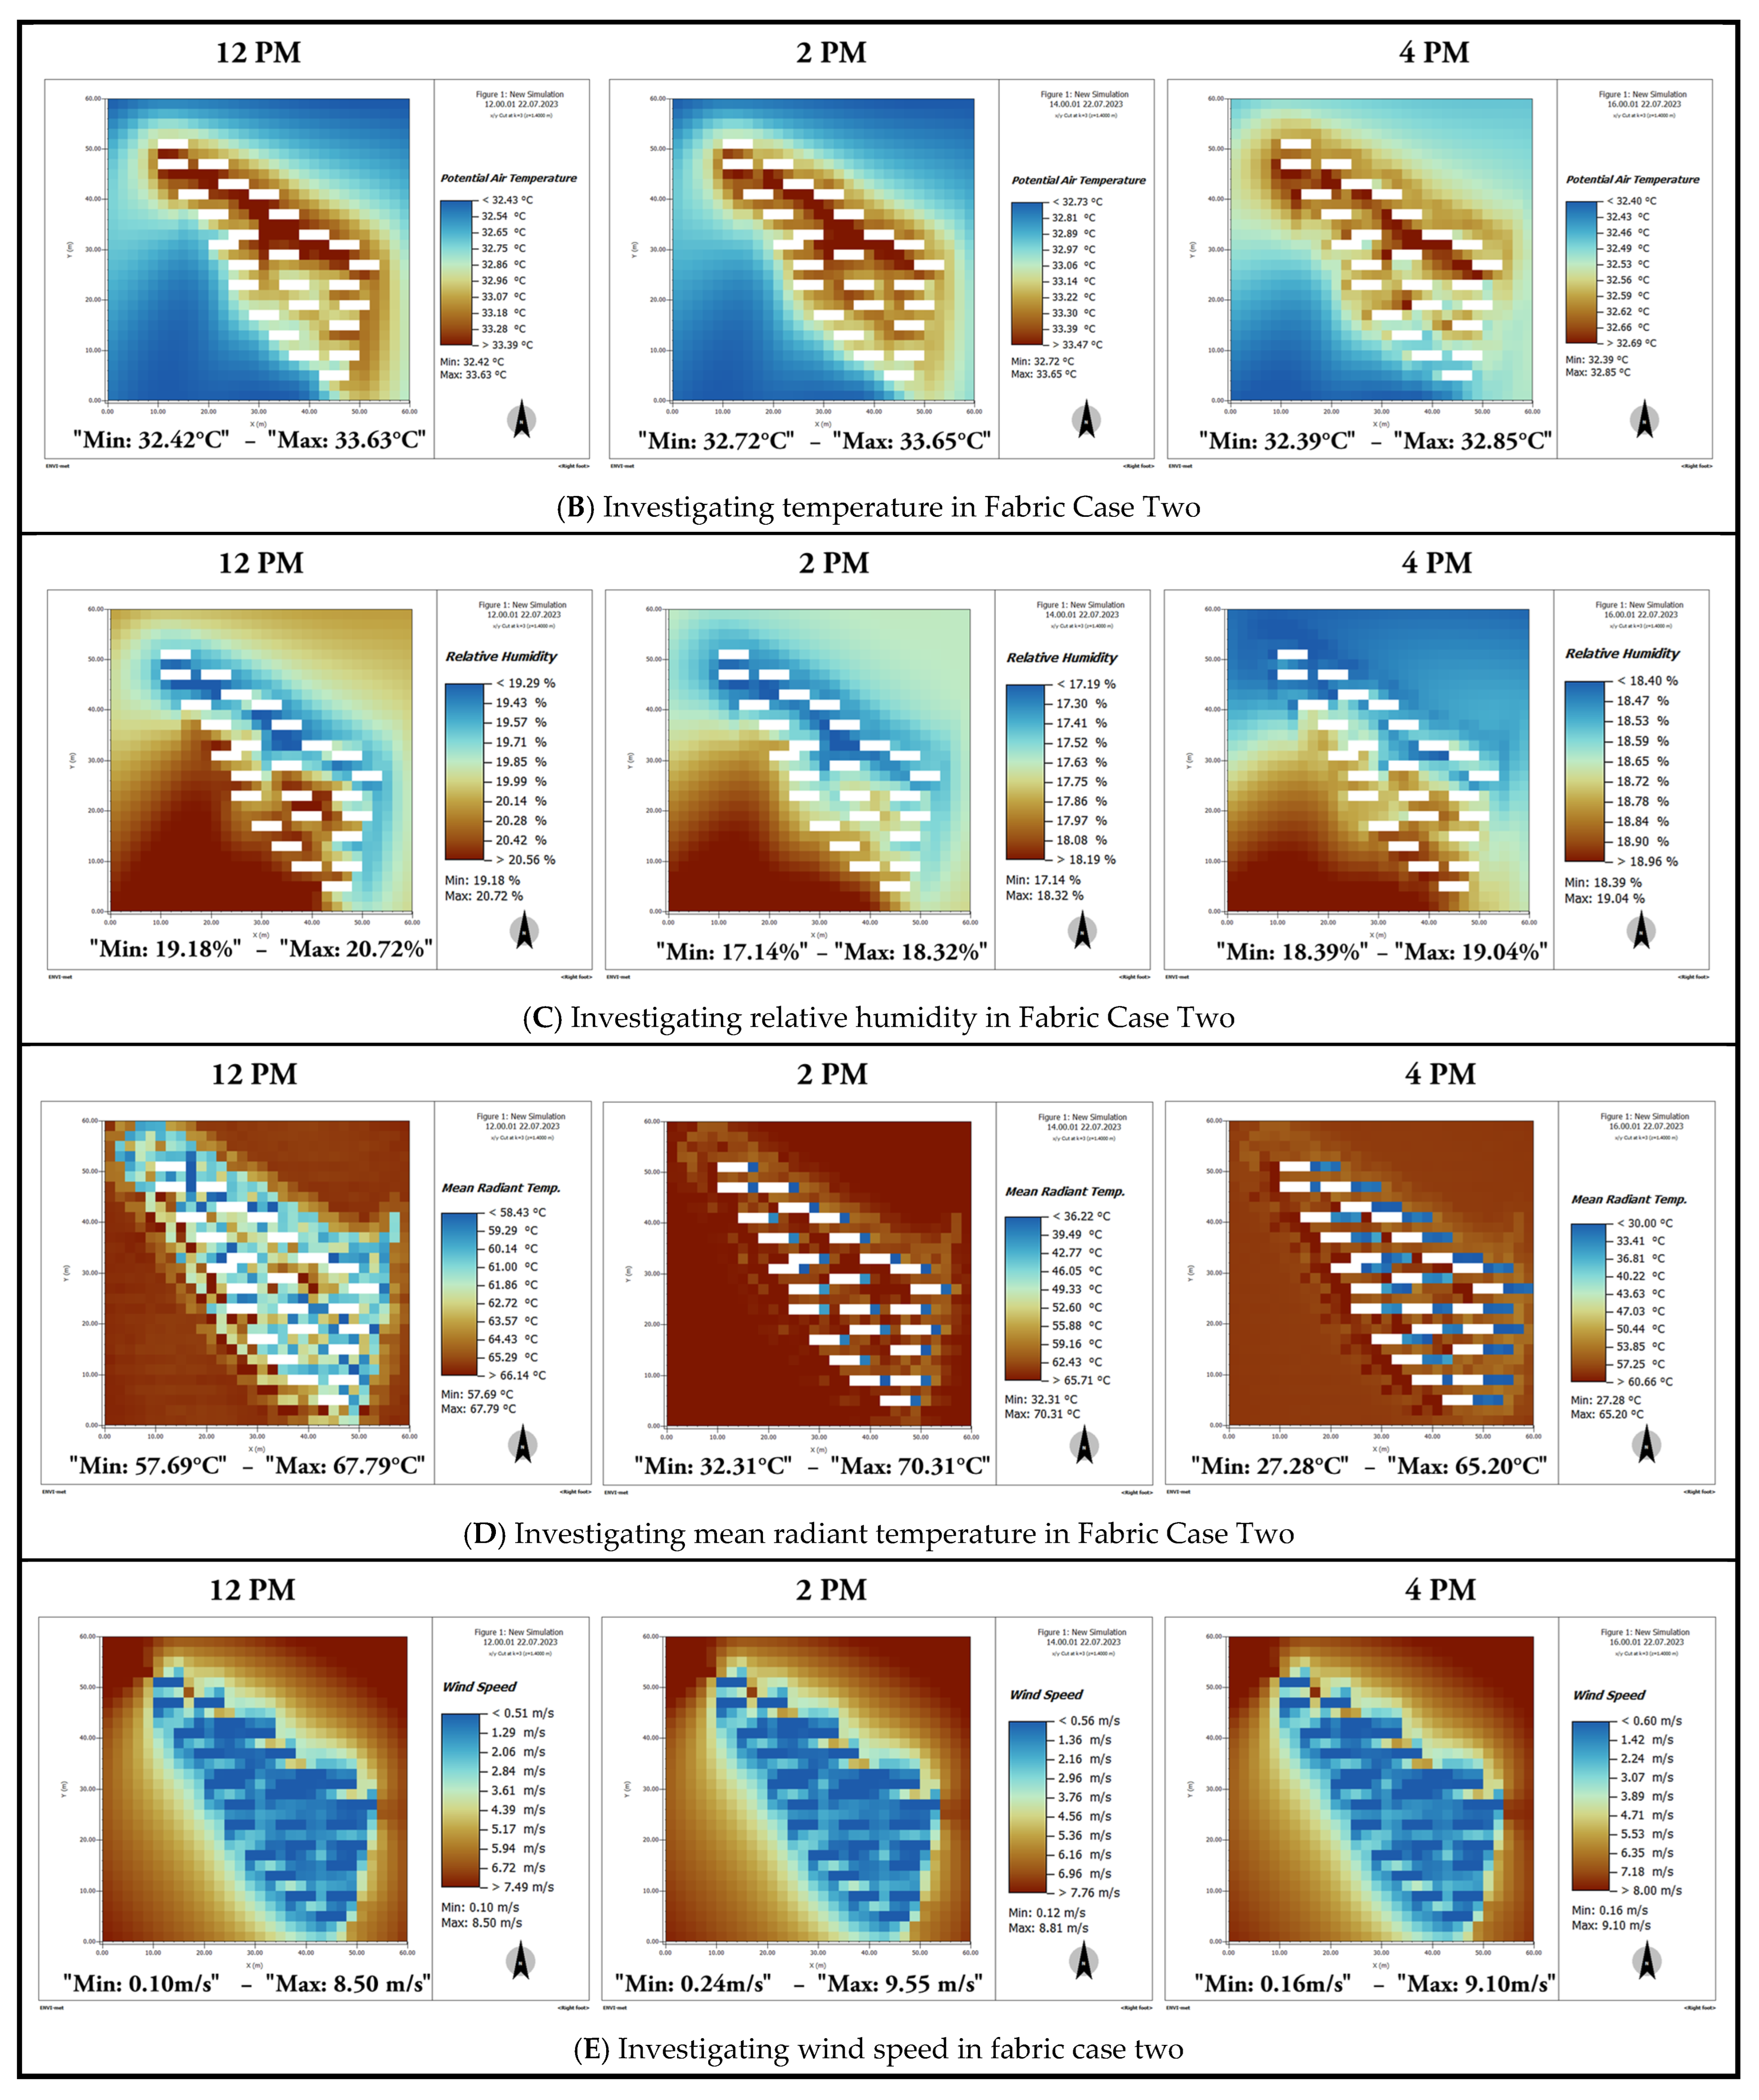
Figure 7 provides an integrated overview of the microclimatic variations for Texture Number 2, highlighting how urban morphology impacts temperature, humidity, mean radiant temperature (MRT), and wind speed throughout the day.
Air Temperature: At midday (12:00 PM), surface temperatures range from 31 °C to 34 °C, with higher temperatures in densely built areas due to restricted airflow and reduced shading, which amplify solar heating. Relative humidity is between 45% and 55%, with lower values in compact urban zones, where increased thermal mass and limited ventilation contribute to higher temperatures (
Figure 7B).
Relative Humidity: By 2:00 PM, when solar altitude reaches its peak, temperatures exceed 34 °C in sun-exposed areas, particularly in tightly clustered urban zones that retain heat due to poor ventilation. Relative humidity decreases to 40–45% in these regions, while shaded and vegetated areas maintain higher humidity levels, around 50% (
Figure 7C).
Mean Radiant Temperature (MRT): MRT values follow the same thermal pattern, with readings at 12:00 PM ranging from 40 °C to 50 °C, rising to 45–55 °C by 2:00 PM as heat accumulates, especially in canyon-like street configurations. By 4:00 PM, a slight cooling effect occurs, but dense areas remain above 32 °C, while MRT decreases to around 42–52 °C. Open and green spaces cool more rapidly (
Figure 7D).
Wind Speed: Wind speeds at 12:00 PM range from 1.0 to 2.0 m/s, with a prevailing wind direction around 220°, leading to localized variations based on the urban structure. By 2:00 PM, wind speeds increase to 1.5–2.5 m/s due to enhanced convection, particularly in areas aligned with the wind. By 4:00 PM, wind speeds stabilize or decrease back to 1.0–2.0 m/s as the cooling process takes effect (
Figure 7E).
5.4. Urban Fabric Case Three
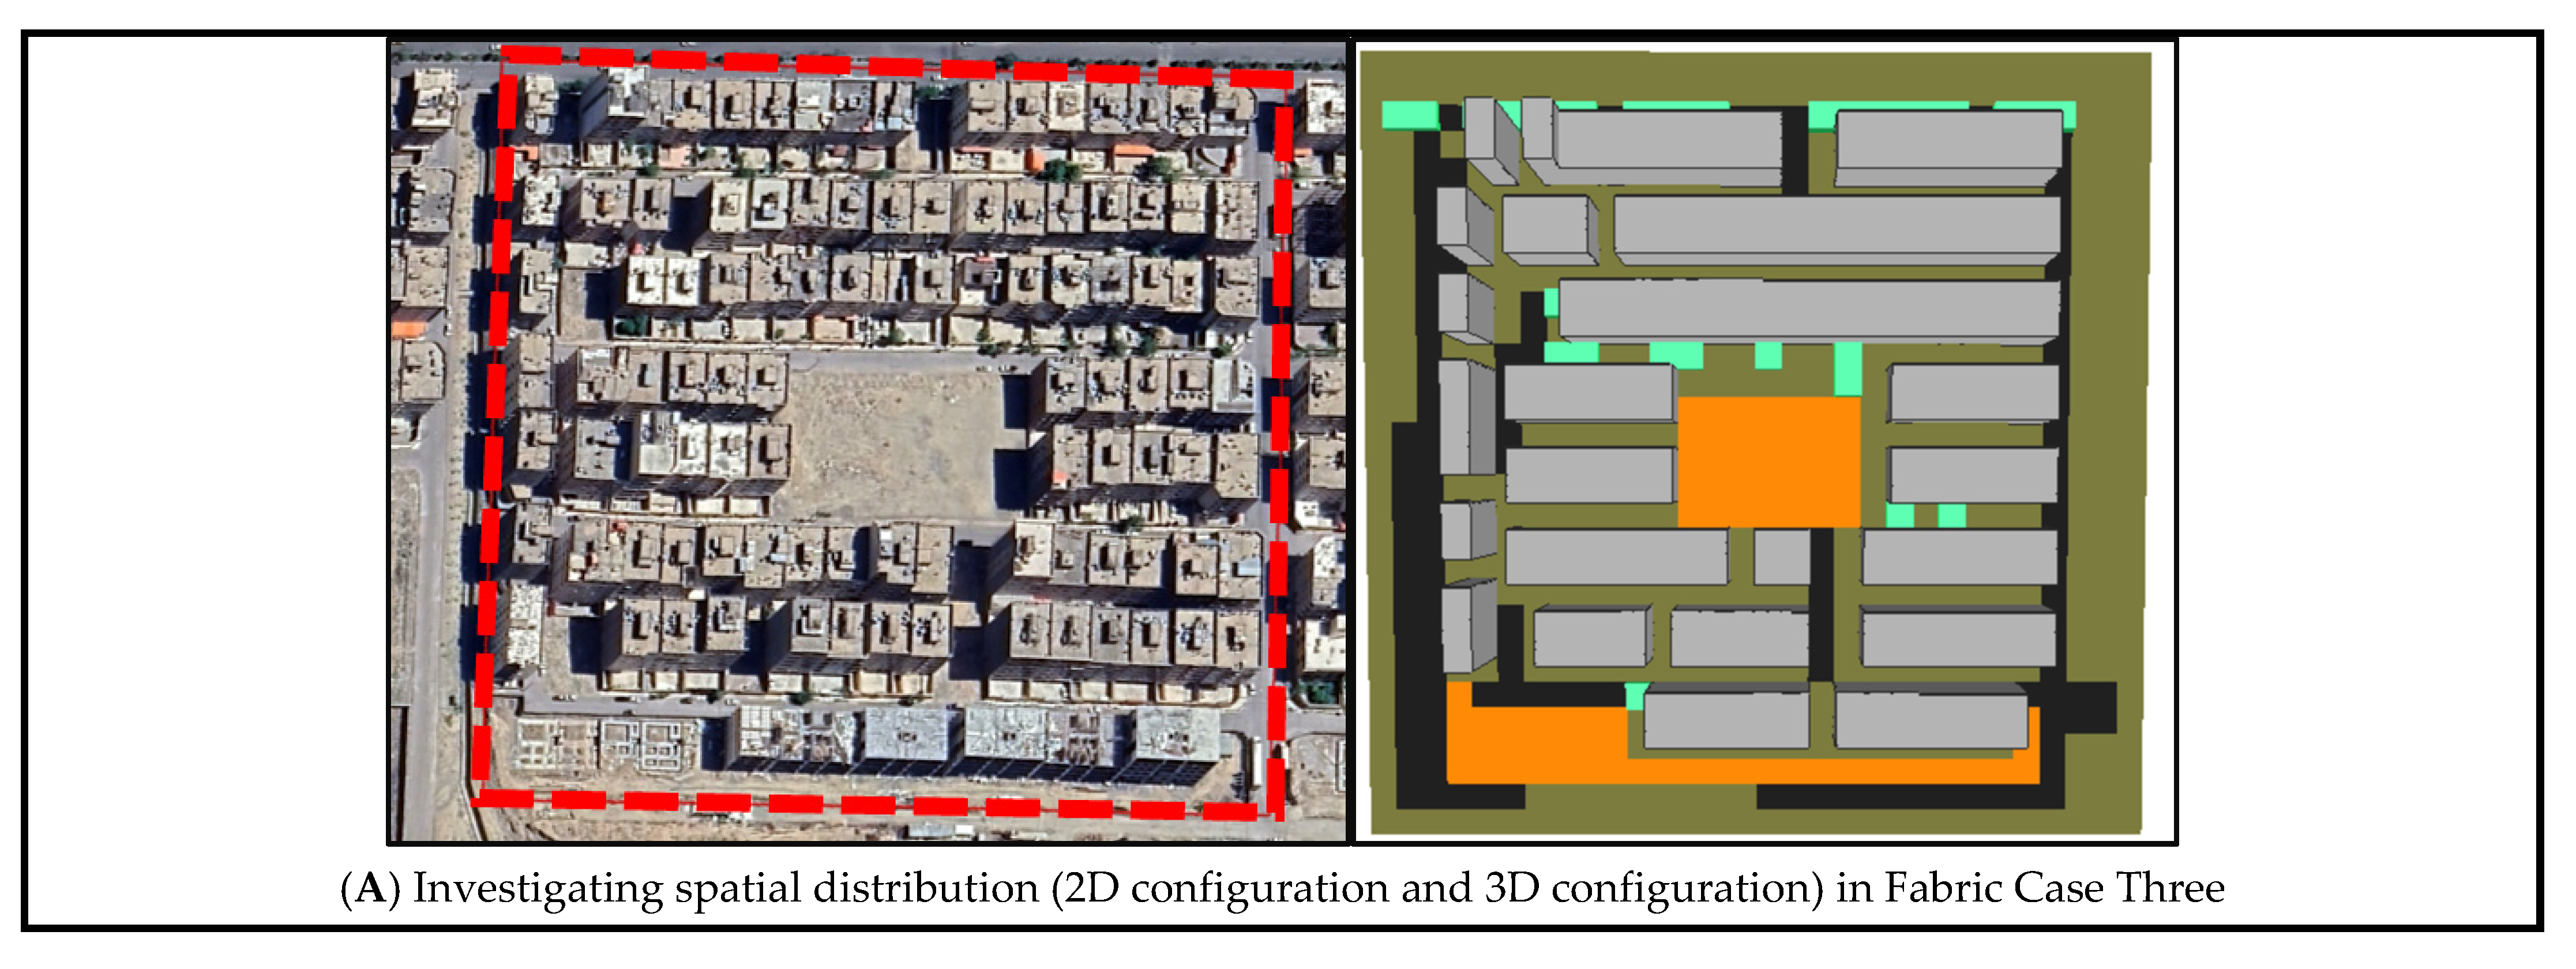
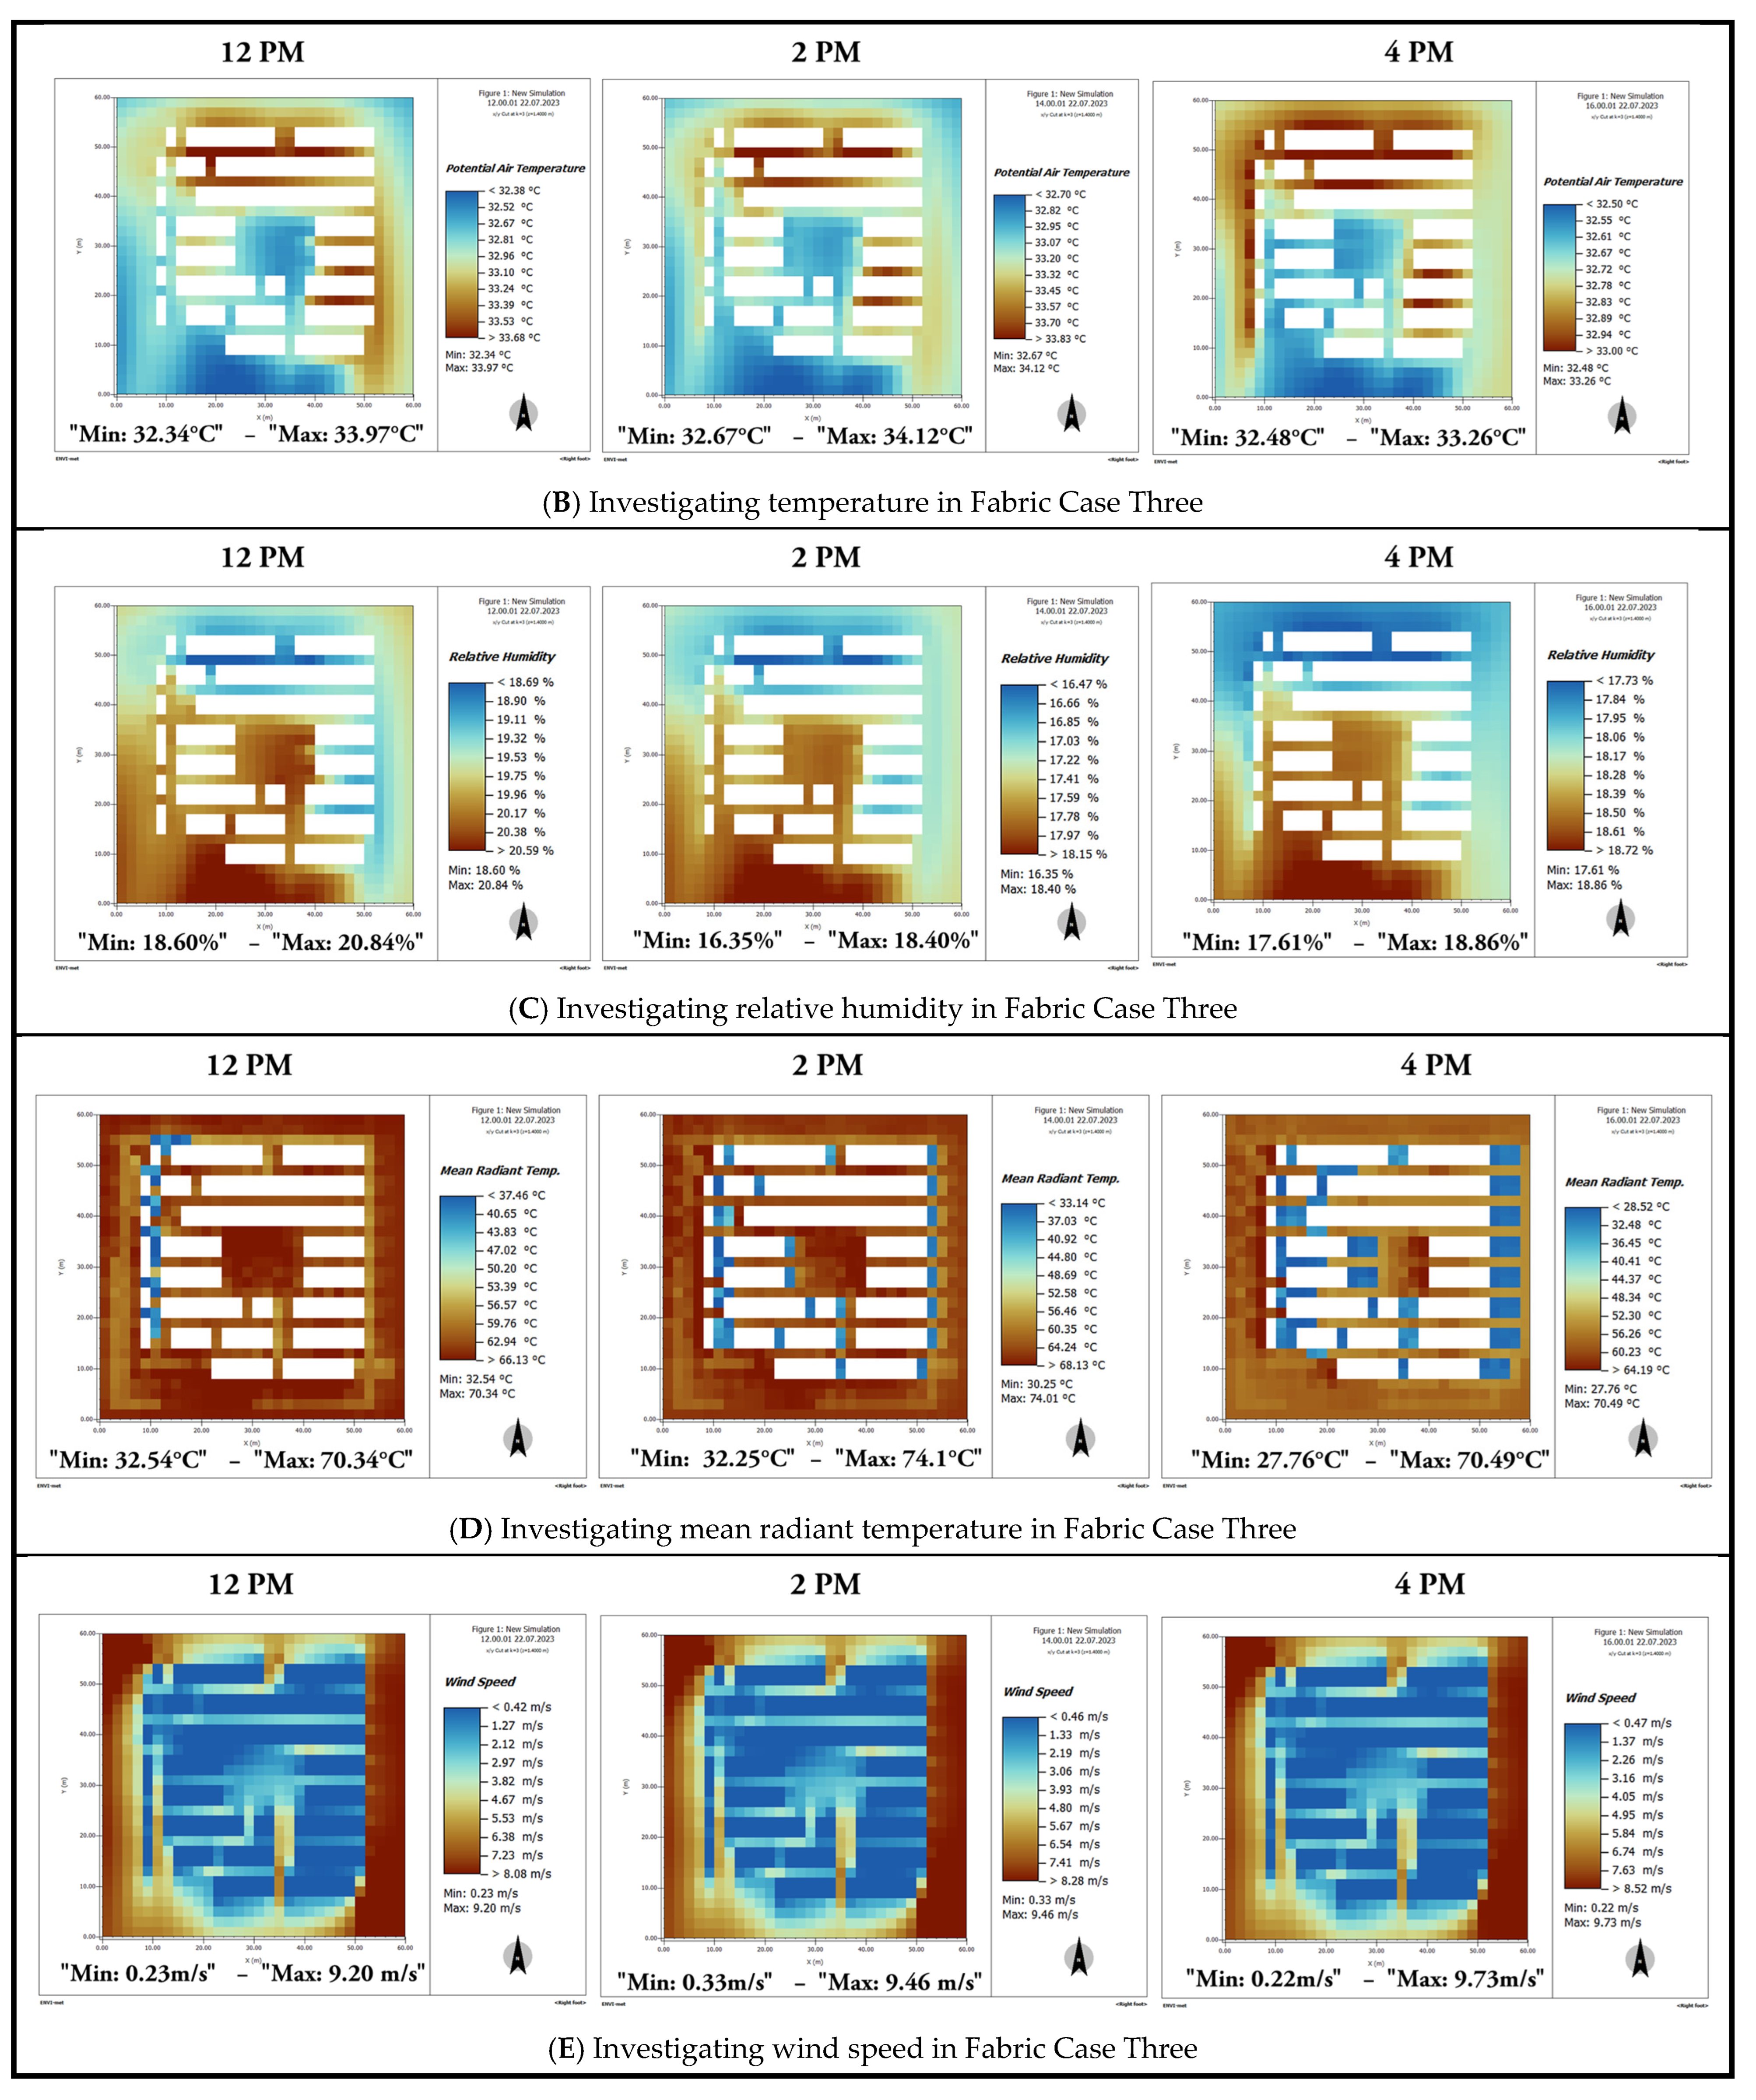
The most prevalent urban fabric in District 9 of Mashhad is Fabric Case three, characterized by mixed land uses, including services, facilities, and housing. This fabric exhibits the highest degree of densification (granulation), with an average density of 407.1 and an average of three building classes (
Table 10). One notable aspect of this fabric is the lack of vegetation used to mitigate air temperature. As shown in the images in
Figure 8, the average radiant temperature across most of the area exceeds 60 °C, which could be reduced by incorporating vegetation. The presence of buildings with solid concrete walls restricts wind flow between structures. To address this issue, buildings should avoid continuous walls and incorporate gaps. In areas like the central and southern parts of the fabric, where barren land and separate buildings are present, wind speeds have increased, relative humidity is higher, and air temperature has decreased.
Air Temperature: The diurnal microclimatic analysis of Texture Number 3 highlights the strong impact of urban form on local climate behavior. At noon, open spaces exhibit moderate air temperatures ranging from 31.5 °C to 33.5 °C, while densely built areas record higher temperatures due to limited ventilation and increased heat absorption. By 2:00 PM, solar radiation intensifies, pushing temperatures in exposed zones above 34 °C. Although a slight cooling occurs by 4:00 PM, high-density areas maintain elevated temperatures due to thermal inertia (
Figure 8B).
Relative Humidity: Relative humidity remains stable at 45–50% around midday but declines to 40–45% in compact urban clusters during the early afternoon when temperatures exceed 30 °C. In contrast, shaded spaces, such as courtyards and tree-lined streets, retain higher moisture levels. Humidity gradually recovers later in the day, especially in vegetated areas with lower thermal mass (
Figure 8C).
Mean Radiant Temperature (MRT): Mean radiant temperature (MRT) peaks at 45–50 °C in open plazas and wide streets around midday and can surpass 50 °C by 2:00 PM in unshaded locations. MRT decreases later, although surfaces with high thermal mass retain heat (
Figure 8D).
Wind Speed: Wind speed varies across the urban fabric: open spaces and broad streets maintain higher velocities (1.5–2.0 m/s), whereas narrow alleys and urban canyons experience lower speeds (0.5–1.0 m/s). By 2:00 PM, enhanced solar heating increases airflow in well-ventilated corridors. At 4:00 PM, cooling reduces wind speeds slightly, except where favorable street orientations sustain effective ventilation (
Figure 8E).
5.5. Comparison of Three Fabric Samples in Terms of Morphological Components
The study presents a detailed comparative analysis of urban microclimates, focusing on three distinct urban textures, each defined by unique building morphology, vegetation cover, and thermal dynamics (
Table 11).
In Texture 1, midday temperatures range from 33 °C to 34 °C, peaking above 35 °C in exposed areas by mid-afternoon before slightly decreasing by 4:00 PM. Densely built sections show a delayed cooling effect due to thermal inertia. Relative humidity remains stable at midday, drops in the early afternoon due to increased evaporation, and then stabilizes or rebounds as temperatures decrease later in the day.
Texture 2 exhibits a similar pattern, with midday temperatures ranging from 31 °C to 34 °C, which rise further in exposed zones by 2:00 PM. Relative humidity drops from 45–55% at noon to 40–45% during peak solar exposure. Mean radiant temperature (MRT) increases from 40–50 °C to 45–55 °C, before slightly declining in the afternoon. Wind speeds are relatively low at midday (1.0–2.0 m/s), with a prevailing wind direction of about 220°. Winds increase slightly by 2:00 PM before stabilizing or decreasing as cooling begins.
Texture 3 clearly demonstrates the influence of urban form on microclimatic conditions. Open spaces register moderate temperatures (31.5–33.5 °C) at midday, while densely built areas experience higher temperatures due to limited ventilation and higher heat absorption. By 2:00 PM, temperatures exceed 34 °C in exposed regions, and despite slight cooling by 4:00 PM, high-density zones retain elevated temperatures. Relative humidity drops during peak heat and gradually recovers, particularly in areas with vegetation. MRT reaches its peak in open plazas and broad streets at midday (45–50 °C) and can exceed 50 °C in unshaded areas by mid-afternoon. Wind speeds vary significantly: open areas support higher airflow, while narrow alleys and urban canyons impede wind movement.
As shown in
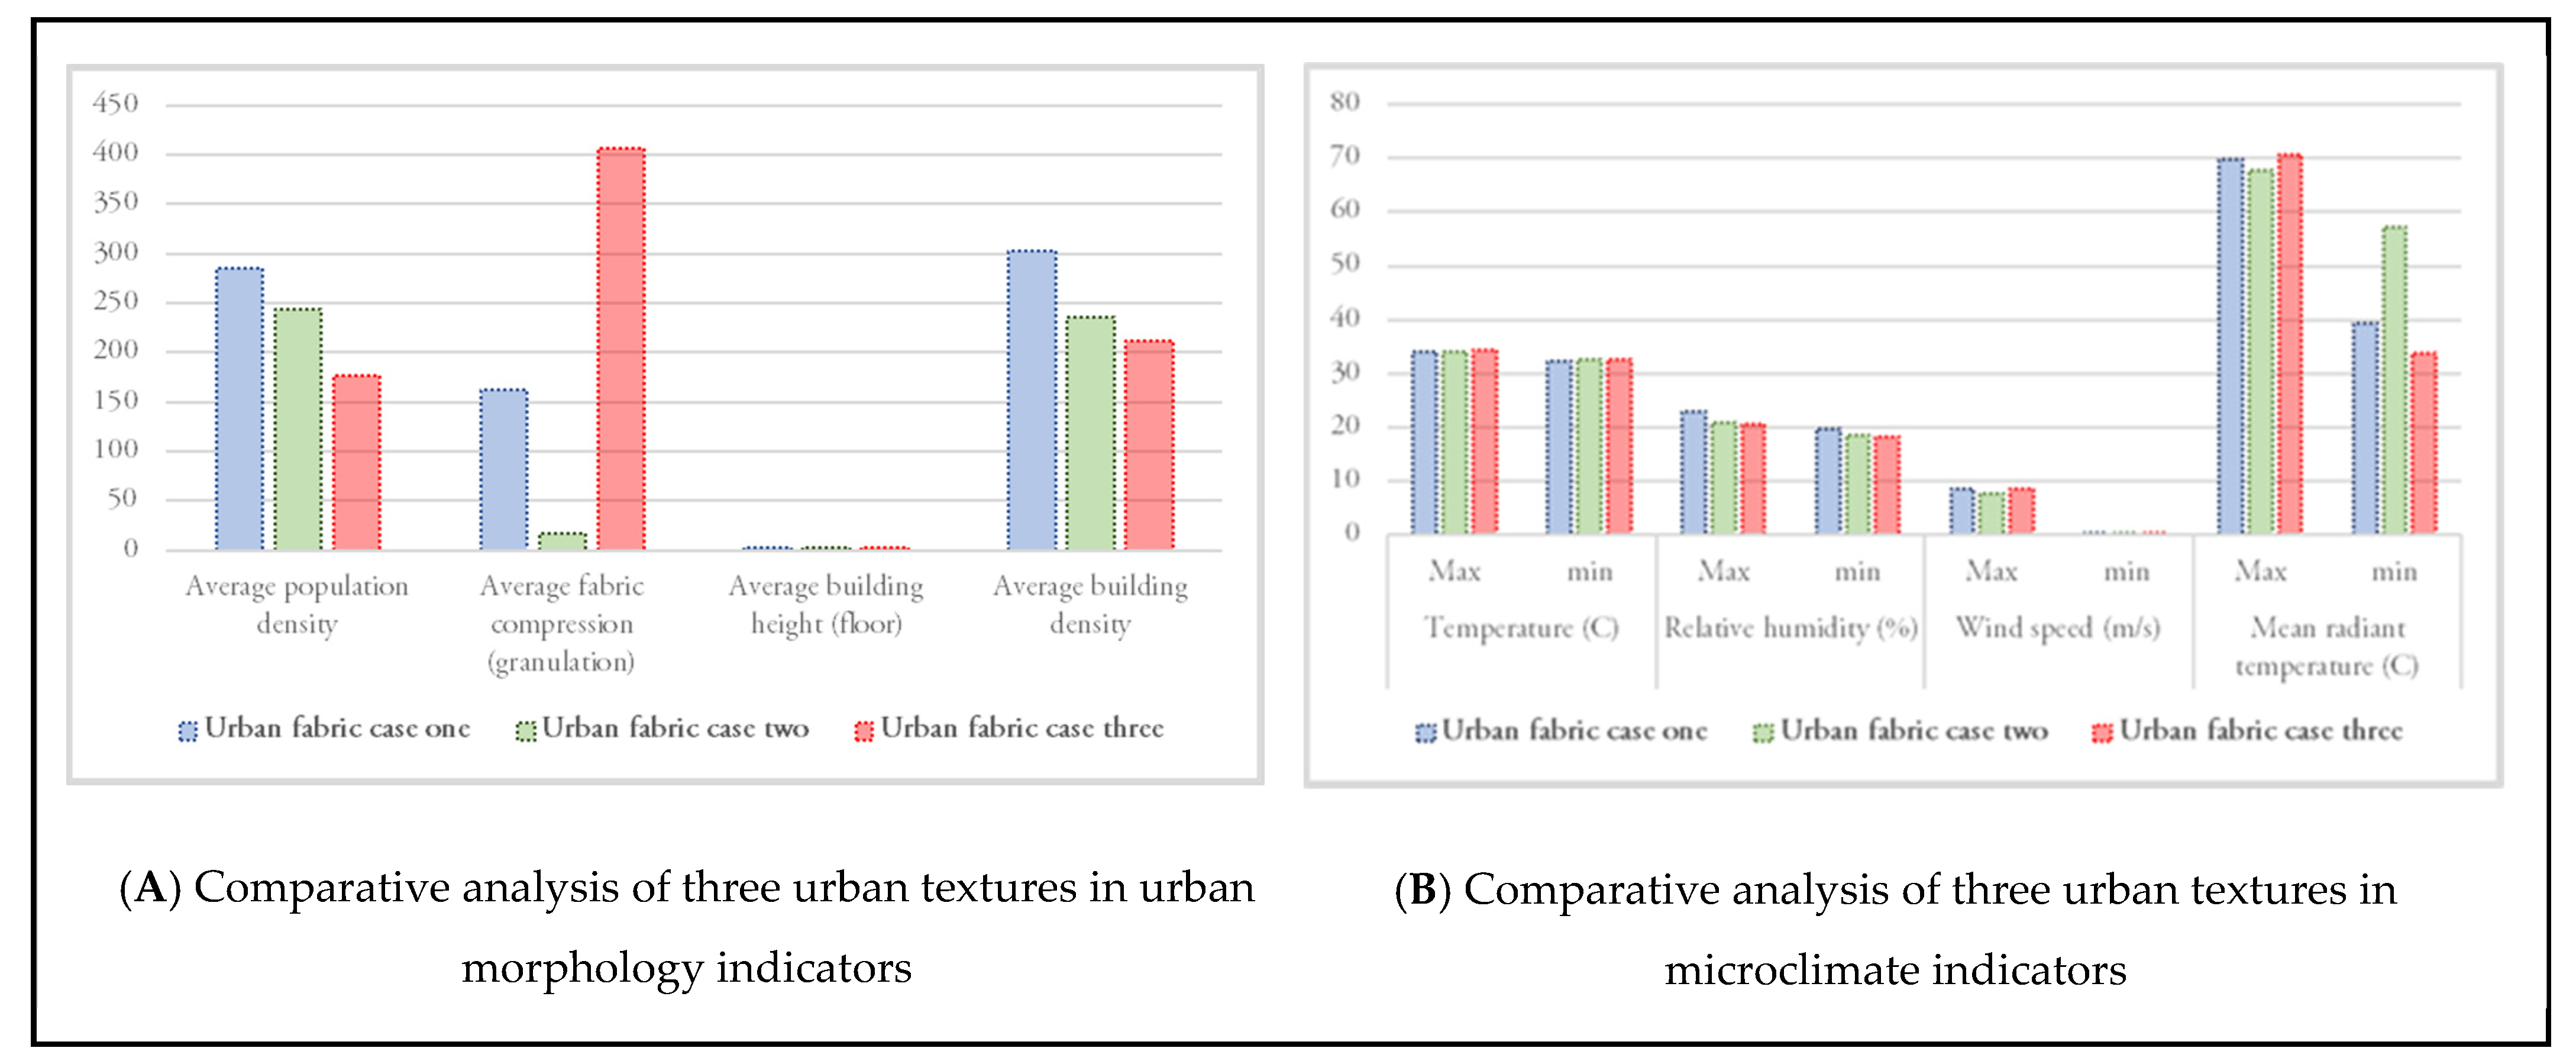
Figure 9, the comparative analysis of the three urban fabrics reveals distinct differences in their microclimatic performance.
Texture 1 exhibits the lowest average air temperature (approximately 32 °C) and the highest relative humidity (around 22.66%). This suggests that a more open urban form, coupled with moderate vegetation, effectively mitigates thermal stress. The balance between moderate temperatures and higher humidity offers a more comfortable environment, especially in hot and arid climates. However, its limited ventilation (indicated by low wind speed) may hinder airflow, though it compensates by retaining moisture and reducing diurnal heat fluctuations. This makes it ideal for climates where shade, density, and moisture retention are crucial for comfort.
Texture 3 recorded the highest average air temperature, approximately 34.12 °C, along with the lowest relative humidity at around 16.35%. This texture exhibits marked spatial variability. In the northern part, densely packed buildings restrict natural airflow, contributing to increased heat retention. Conversely, the more open southern zones allow for greater wind penetration, with wind speeds reaching up to 8.52 m/s, which facilitates localized cooling. Despite favorable conditions for ventilation and nighttime cooling evident in its high maximum wind speed and reduced mean radiant temperature, the compact built form leads to significant heat accumulation during daytime hours. This pattern intensifies microclimatic stress in the denser sections of the texture.
Texture 2 is the least favorable in terms of microclimatic performance. Although it records the lowest maximum temperature, it performs poorly in key factors such as relative humidity, wind speed, and mean radiant temperature. Its low urban fabric compression and modest building density reduce its capacity to provide adequate shading or regulate temperatures, making it more vulnerable to heat stress and thermal discomfort.
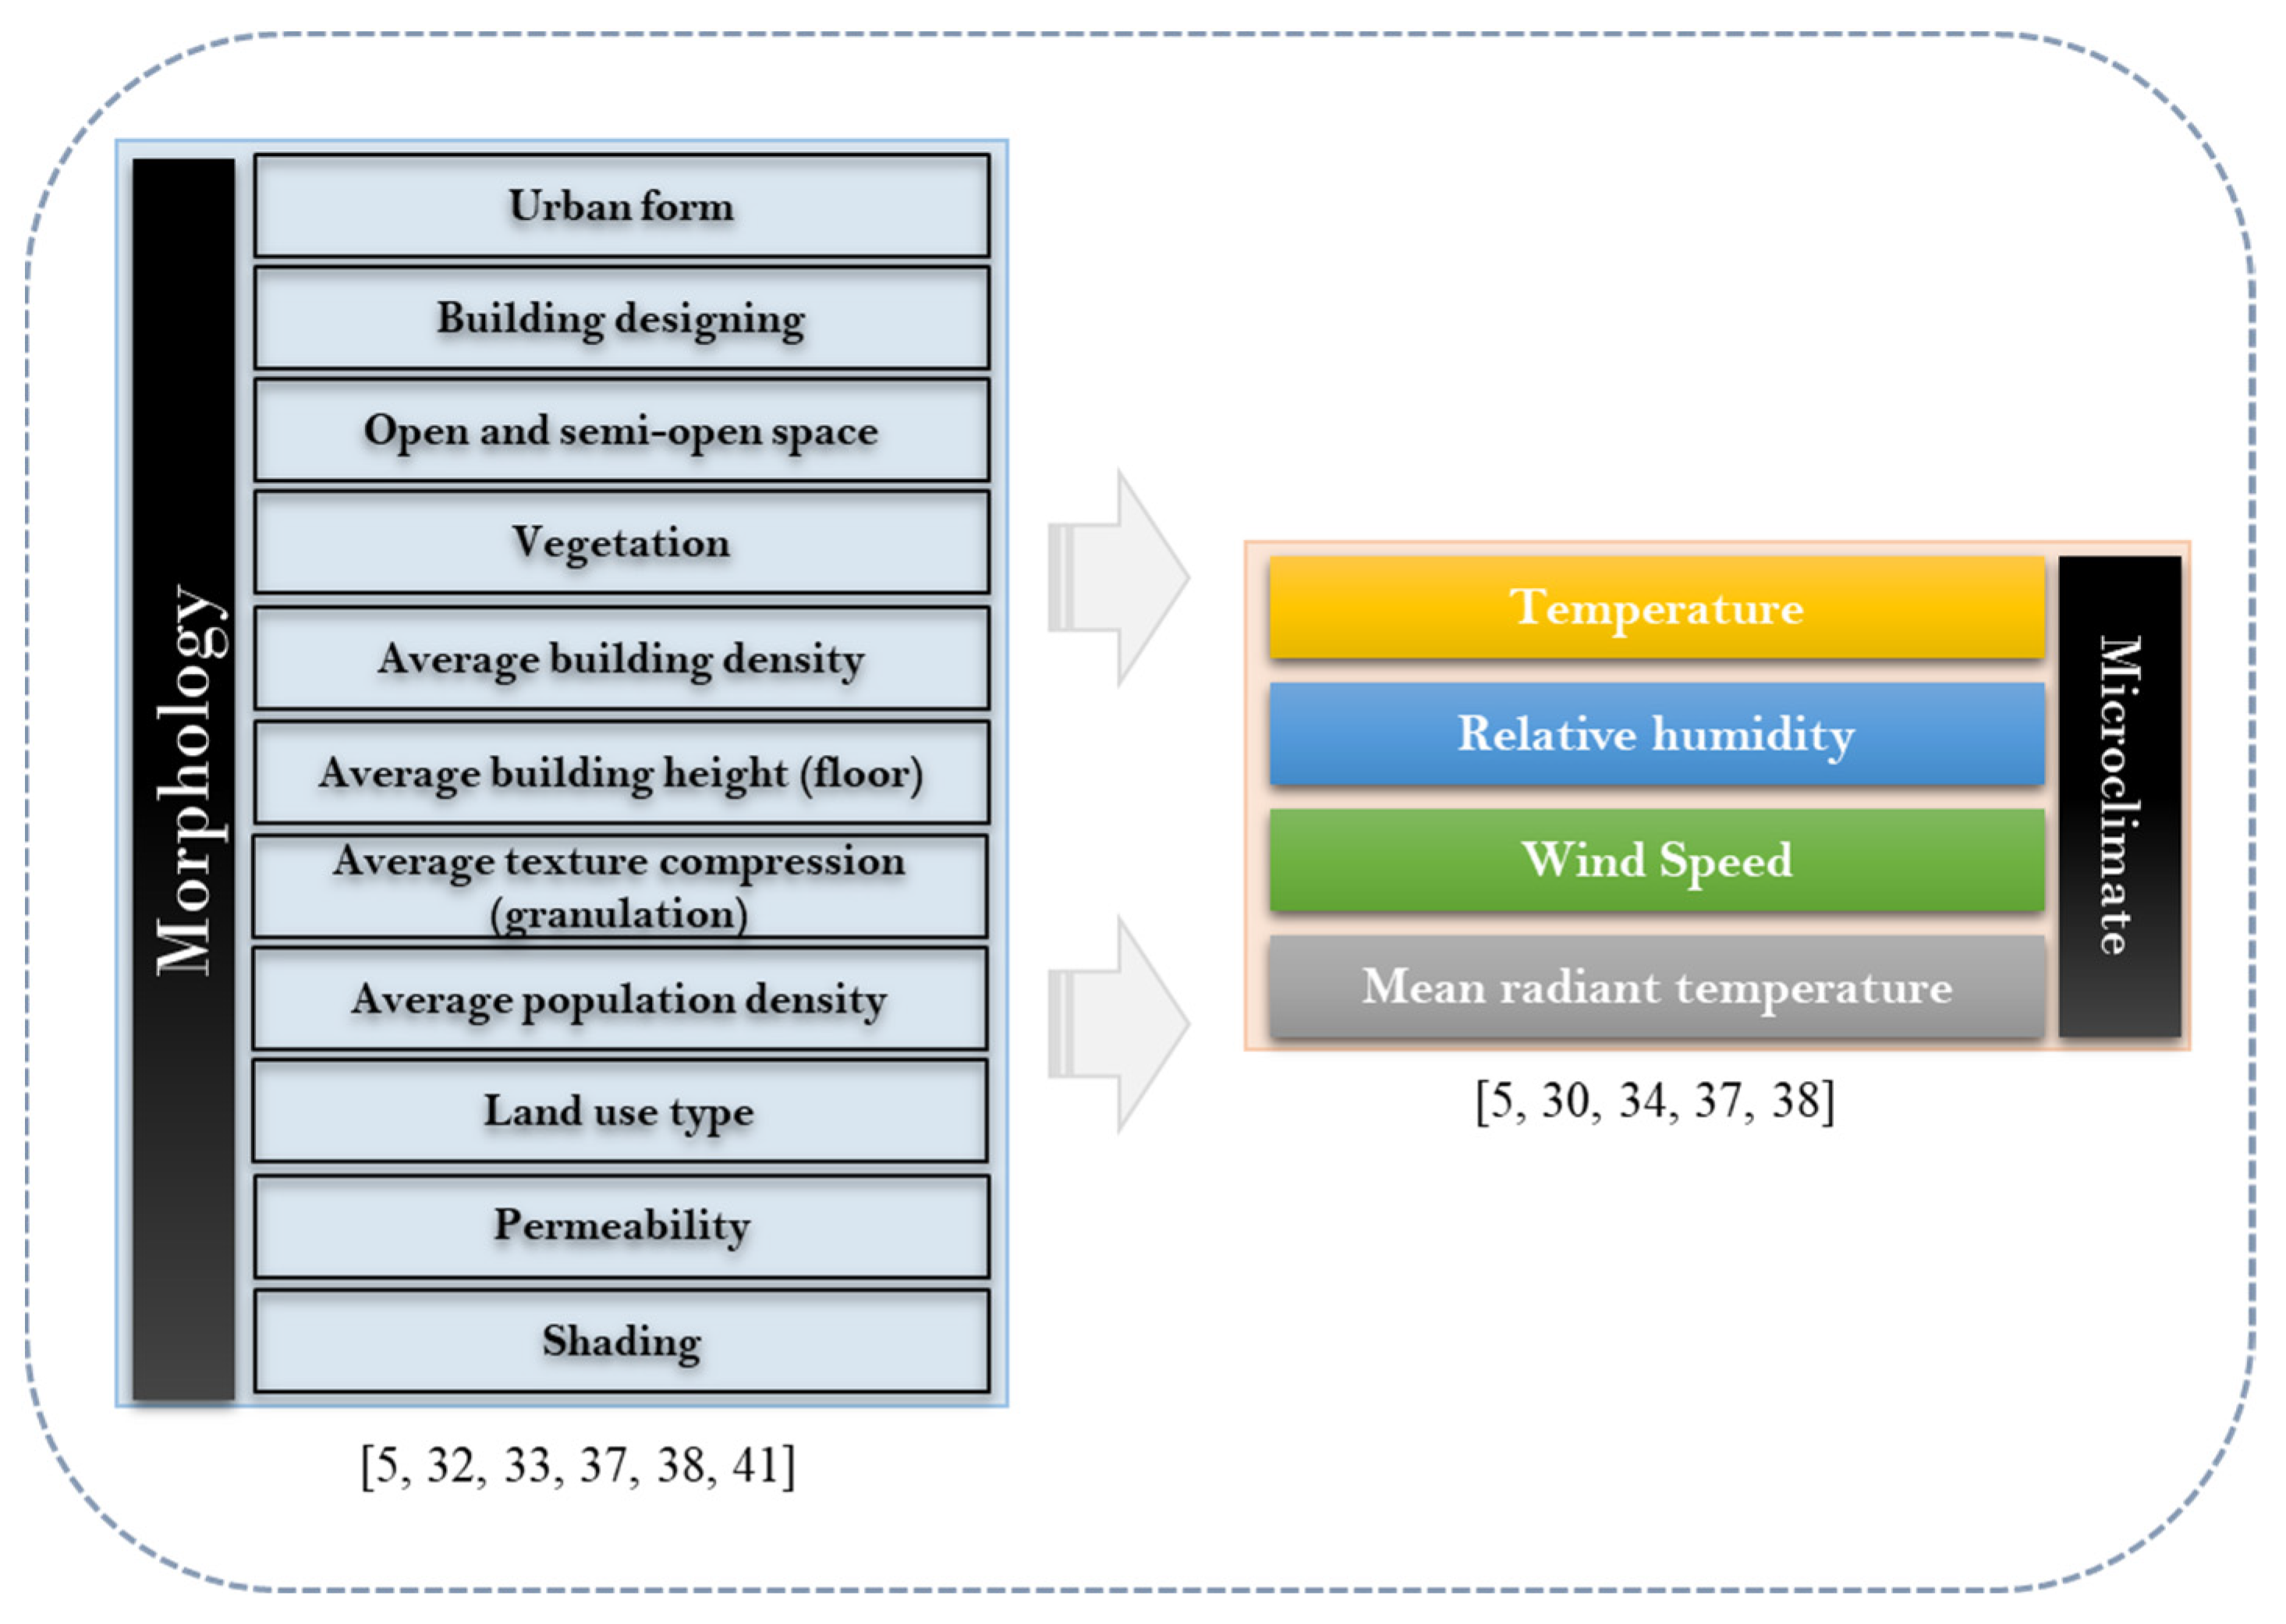
A comparative analysis of the three selected urban sites, as summarized in
Table 12, indicates that Urban Fabric Case one offers the most favorable performance in terms of morphological impact on microclimatic conditions. Its compact structure, higher building density, and well-balanced vertical profile contribute to improved environmental outcomes, particularly with regard to air temperature regulation and relative humidity levels. These findings underscore the significance of urban morphological parameters in influencing local climatic behavior.
The identification of Urban Fabric Case One as the most effective configuration represents a key contribution of this study. It highlights how specific spatial characteristics, such as density and building height, can be purposefully applied to mitigate microclimatic stress in high-density urban areas, especially within hot and arid climates. This insight provides a valuable foundation for future urban planning and design strategies aimed at enhancing climate responsiveness and promoting environmental resilience in rapidly urbanizing cities.
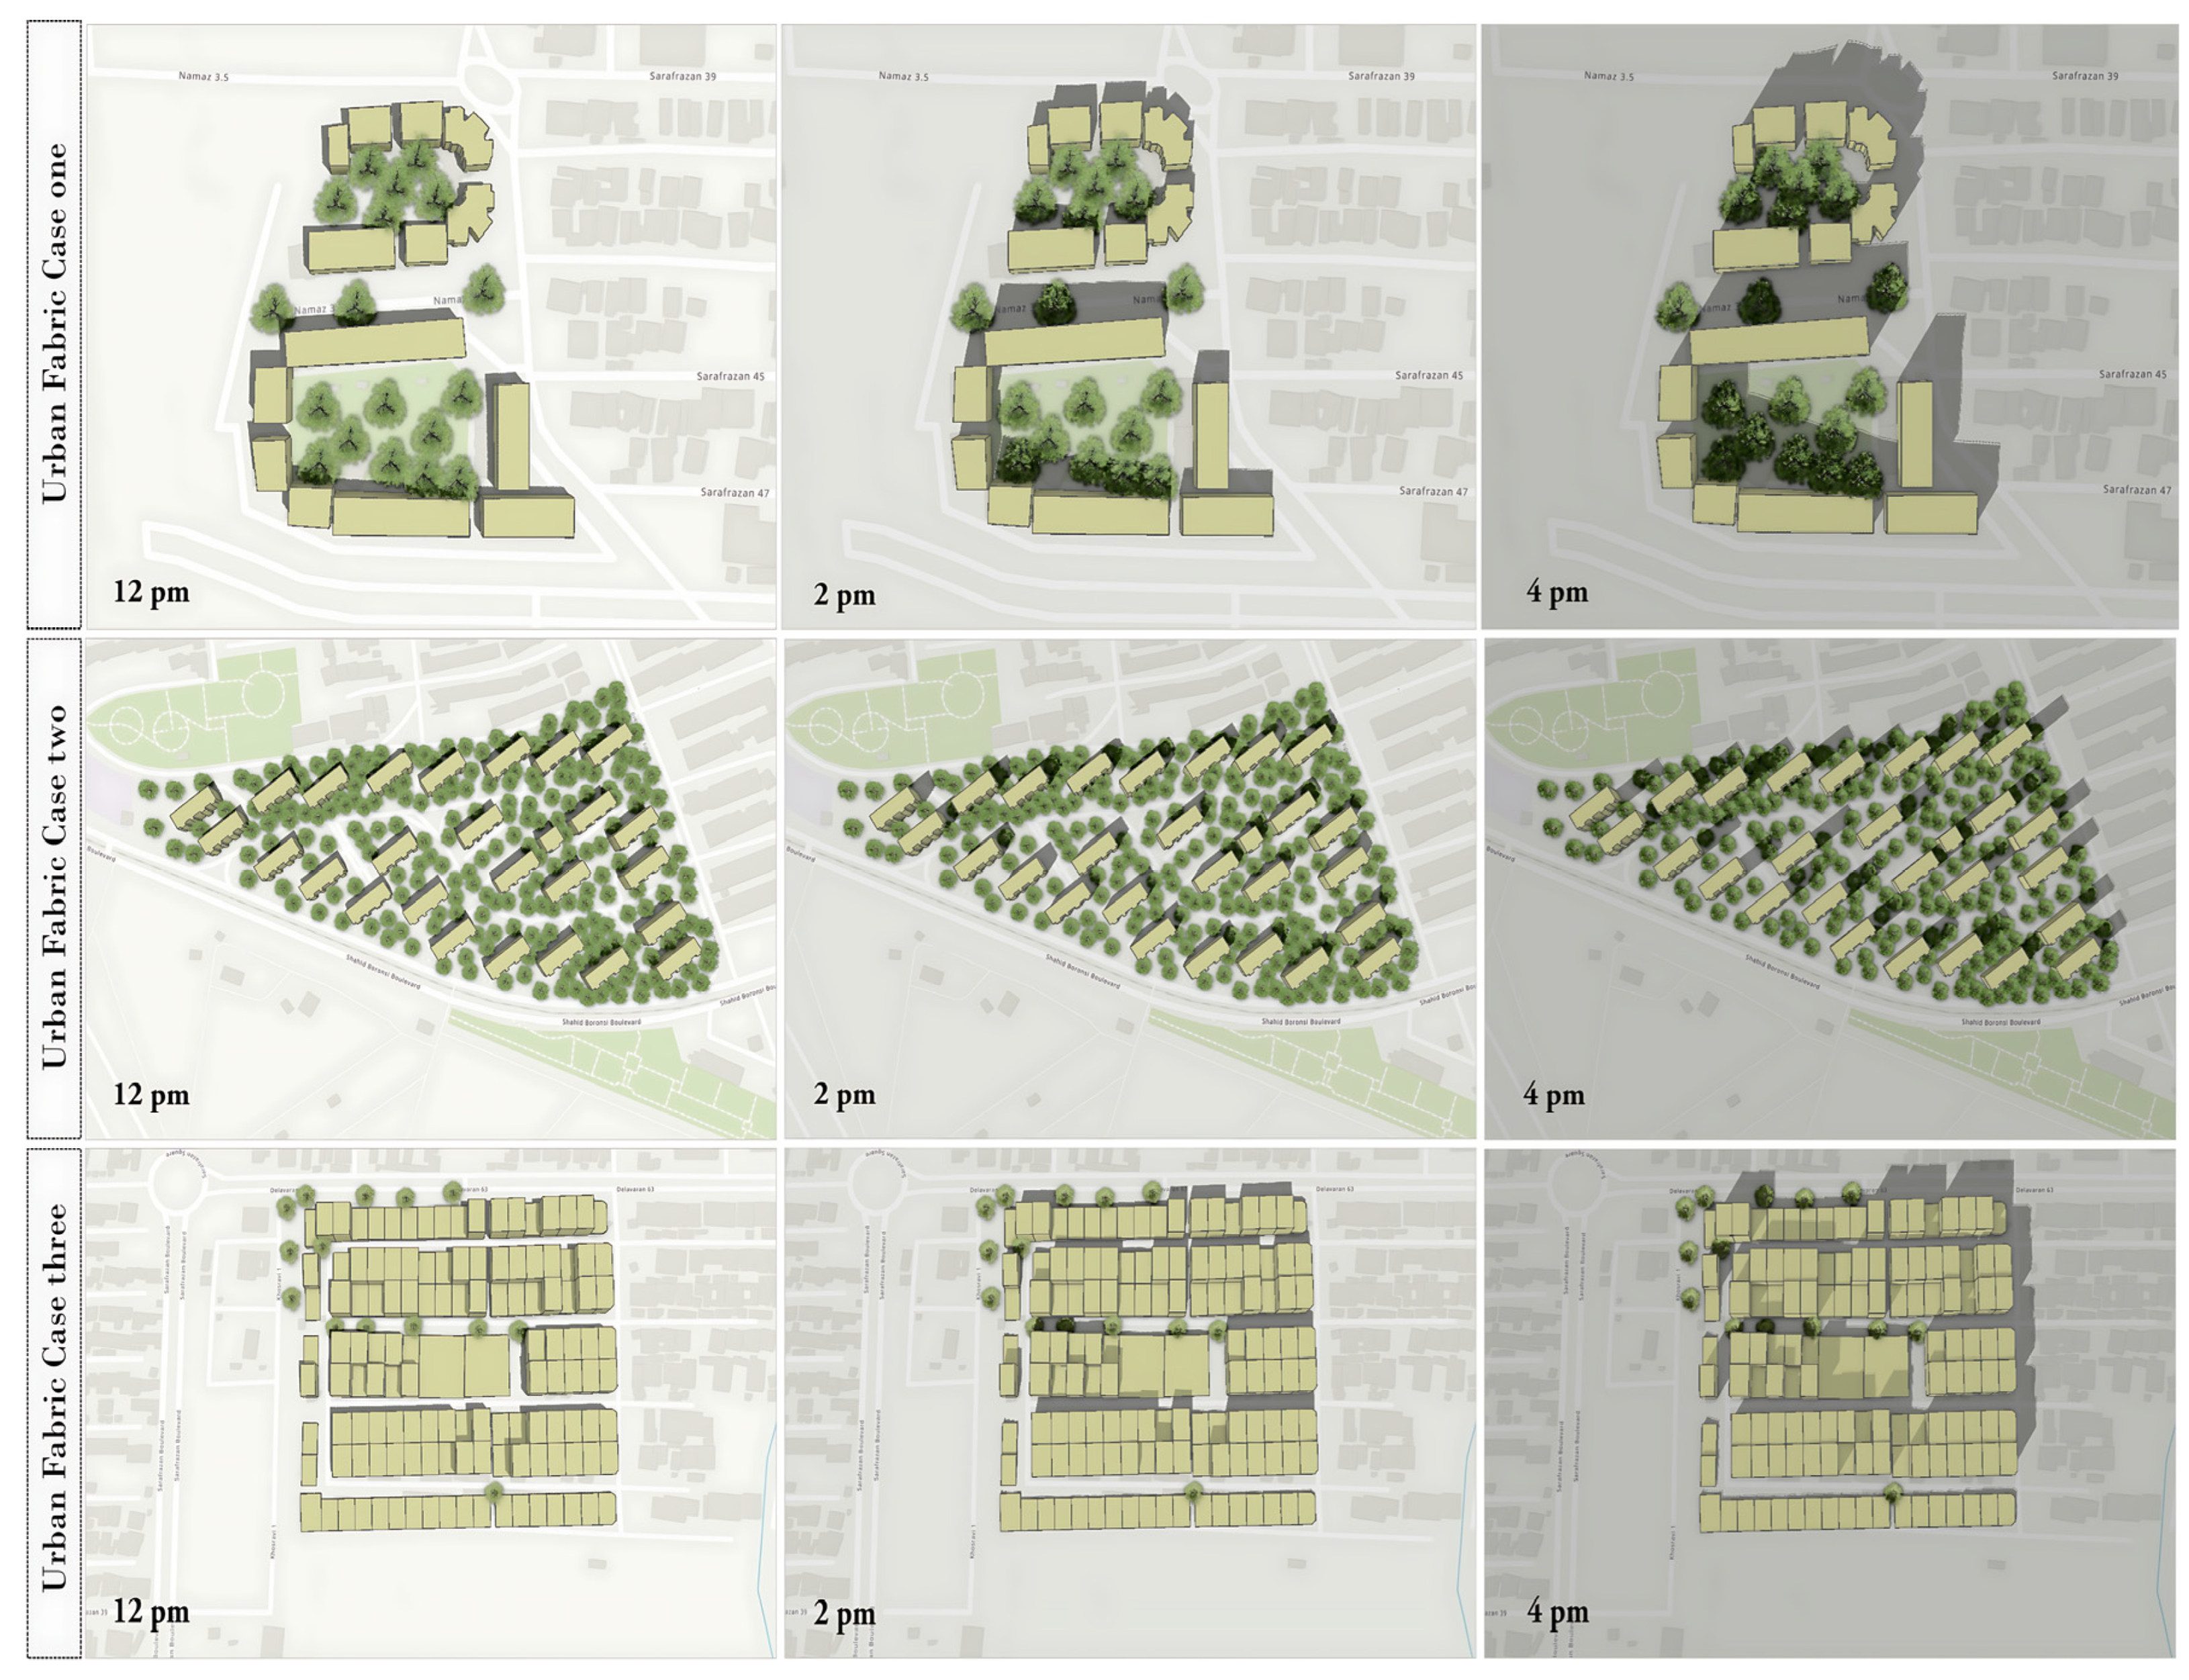
Analysis of vegetation cover, permeability, and shading using GIS Pro (
Figure 10) revealed that Urban Fabric Case Two had the highest surface permeability. However, its dense vegetation limited airflow, resulting in higher air temperatures. In contrast, Urban Fabric Case One allowed better wind circulation due to less obstructive vegetation.
When both permeability and vegetation were considered, Case One exhibited more favorable microclimatic conditions than the other cases. This suggests that while vegetation improves environmental quality, excessive density can hinder cooling by reducing wind speed.
In District 9 of Mashhad, the orientation of shadows shifts steadily throughout the day, reflecting the sun’s east-to-west path across the sky at this latitude. In the early morning, shadows are long and directed toward the southwest. As the sun rises, they gradually shorten and shift northward. Around noon, shadows reach their minimum length and point almost directly north. In the afternoon, they lengthen again, turning progressively toward the northeast and then east.
Shading analysis conducted at 12:00, 14:00, and 16:00 confirmed this directional shift from southwest to northeast over time. In Case One, open spaces remained shaded for longer durations, leading to reduced solar exposure. These findings underscore the critical role of urban design in managing heat gain and supporting microclimatic balance in semi-arid urban environments.

