Article

Mechanisms of Overburden and Surface Damage Conduction in Shallow Multi-Seam Mining

by
Guojun Zhang
1,2,*,
Shigen Fu
1,2,
Yunwang Li
1,2,
Mingbo Chi
1,2 and
Xizhong Zhao
1,2
1
Institute of Mine Safety Technology, China Academy of Safety Science and Technology, Beijing 100012, China
2
Key Laboratory of Non-Coal Mine Safety Risk Monitoring and Early Warning, National Mine Safety Administration, Beijing 100012, China
*
Author to whom correspondence should be addressed.
Eng 2025, 6(9), 235; https://doi.org/10.3390/eng6090235
Submission received: 30 July 2025 / Revised: 18 August 2025 / Accepted: 1 September 2025 / Published: 8 September 2025

Abstract

Focusing on the issues of severe mining pressure and discontinuous surface deformation caused by the large-scale mining of multiple coal seams, and taking into account the research background of Shigetai Coal Mine in Shendong Mining Area, this study adopts physical similarity simulation, theoretical analysis, and on-site verification methods to carry out research on rock migration, stress evolution, and overlying rock fracture mechanism at shallow burial depths and in multiple-coal-seam mining. The research results indicate that as the working face advances, the overlying rock layers break layer by layer, and the intact rock mass on the outer side of the main fracture forms an arched structure and expands outward, showing a pattern of layer-by-layer breaking of the overlying rock and slow settlement of the loose layer. The stress of the coal pillars on both sides in front of and behind the workplace shows an increasing trend followed by a decreasing trend before and after direct top fracture. The stress on the bottom plate of the goaf increases step by step with the collapse of the overlying rock layer, and its increment is similar to the gravity of the collapsed rock layer. When mining multiple coal seams, when the fissures in the overlying strata of the current coal seam penetrate to the upper coal seam, the stress in this coal seam suddenly increases, and the pressure relief effect of the upper coal seam is significant. Based on the above laws, three equilibrium structural models of overlying strata were established, and the maximum tensile stress and maximum shear stress yield strength criteria were used as stability criteria for overlying strata structures. The evolution mechanism of mining damage caused by layer-by-layer fracturing and the upward propagation of overlying strata was revealed. Finally, the analysis of the hydraulic support working resistance during the backfilling of the 31,305 working face in Shigetai Coal Mine confirmed the accuracy of the similarity simulation and theoretical model. The above research can provide support for key theoretical and technological research on underground mine safety production, aquifer protection, surface ecological restoration, and source loss reduction and control.

1. Introduction

According to the China Mineral Resources Report 2024 published by the Ministry of Natural Resources [1], China’s coal reserves totaled 218.57 billion tons by the end of 2023, with annual coal production reaching 4.71 billion tons. Coal constitutes 66.6% of the energy production structure and 55.3% of the primary energy consumption, underscoring its dominant role in China’s energy landscape, a trend that is unlikely to change soon. Furthermore, coal consumption has exhibited a steady upward trajectory in recent years. Since 2013, the strategic focus of China’s coal industry has increasingly shifted westward, with production becoming more concentrated in regions such as Shanxi, Shaanxi, Inner Mongolia, and Xinjiang [2]. These areas are characterized by shallow coal seams (averaging 200–300 m in depth), low gas emissions, and relatively simple hydrogeological conditions, making them conducive to large-scale mining practices that prioritize high yield, efficiency, safety, recovery rates, and economic benefits. Consequently, these regions have emerged as China’s primary coal production hubs. However, large-scale mining operations have induced extensive overburden movement and damage, leading to significant surface subsidence, soil erosion, and other adverse environmental impacts, which exacerbate the already fragile ecological conditions of mining areas.
The disturbances caused by shallow multi-seam mining in western mining regions are multifaceted, affecting both mine safety and the surrounding ecosystem. Factors such as inter-seam spacing, lithology, thickness, stress conditions, and production parameters influence the stability of mining operations. For instance, the collapse of the roof in the upper goaf can destabilize the roof of the lower coal seam, triggering multi-layer roof instability. The goaf formed by earlier mining activities introduces complexities for subsequent mining operations, as roof collapse and strata movement alter the stress environment of the lower seams, significantly increasing the challenges of roof management. The overlying strata, deprived of support, progressively collapse and fracture, transmitting these effects to the surface and causing extensive subsidence. This subsidence, coupled with soil degradation and direct damage from mining activities, results in a marked reduction in vegetation cover, thereby impairing the ecosystem’s carbon sequestration capacity, soil conservation, and climate regulation functions. Scholars worldwide have conducted extensive research [3,4,5,6,7,8,9,10,11,12,13,14,15,16,17,18,19,20,21,22,23] in response to these challenges. For example, The Li Quansheng team [3,4,5,6,7,8] has overcome the difficulties of damage transmission mechanism and quantitative evaluation from theoretical foundation to technical implementation, and further developed comprehensive technologies covering various aspects of well engineering and open-pit mining, as well as water resource protection, ecological restoration, etc. They have formed a complete theoretical and technical system for damage reduction mining, providing valuable practical experience and technical paradigms for the green development of the coal industry; In the field of coal resource mining, shallow buried close range coal seam mining faces many complex challenges due to its unique geological conditions. Huang Qingxiang’s team [9,10,11,12,13,14,15] has keenly focused on this key area and embarked on a deep and systematic exploration journey, conducting research work from multiple key levels, laying a solid foundation for building a sound shallow coal seam mining technology system. Guo Wenbing’s team [16,17,18,19] has conducted systematic research on the core problems of “severe overburden movement, large surface subsidence, and high ecological damage risk” in high-intensity mining of shallow and thick coal seams, from basic laws to technical applications. Multiple breakthroughs have been made in surface subsidence mechanisms, overburden damage characteristics, and mining technology optimization, ultimately constructing a high-strength mining technology system that is suitable for shallow and thick coal seam conditions, providing important support for the safe and efficient mining of this type of coal seam. The Liu Changyou team [20,21,22,23] focuses on the field of shallow coal seam mining, and has conducted in-depth and systematic research on various dimensions such as the mechanism of shallow buried dynamic loading and mining pressure, the spatiotemporal evolution of mining fractures, three-dimensional geological modeling and surface damage, stress field distribution, and mining pressure manifestation characteristics, in response to the many complex problems faced during the mining process. This provides a solid theoretical foundation and technical support for the safe and efficient mining of shallow coal seams. Nevertheless, research on the propagation of overburden to surface damage during multi-seam mining remains fragmented. Studies on coal mining primarily focus on the effects of overburden movement on working faces, coal pillars, and support systems, while research on mining subsidence emphasizes the impact of overburden movement on surface deformation. The actual overburden and surface damage caused by coal mining involves a process of damage propagation through the overlying rock and soil layers, which is mediated by the geotechnical medium.
Building on this understanding, this study leverages the engineering geological conditions of multi-seam mining at the Shigetai Coal Mine in the Shendong Mining Area to conduct laboratory-based physical similarity simulations. The stress distribution and evolution characteristics of the overburden and surface are analyzed by monitoring the stress evolution in coal pillars and goaf areas during multi-seam mining. A damage propagation model for mining-induced overburden is constructed, and a criterion for damage propagation in overburden and surface rock and soil layers is proposed. The reliability of this model is validated using field data from multi-seam mining at the Shigetai Coal Mine in the Shendong Mining Area.

2. Overview of the Coal Mine

The 31,305 working face spans a width of 285.2 m, with the main transport side advancing 4583.6 m and the return air side advancing 4587.8 m. The coal seam exhibits a thickness ranging from 1.8 to 4.3 m, with an average thickness of 3.5 m. The dip angle of the coal seam varies between 1 and 3 degrees, and its burial depth ranges from 130 to 180 m. The overlying bedrock thickness measures between 73 and 134.9 m, while the thickness of the overlying loose layer ranges from 3.7 to 53.9 m. Notably, the loose layer is significantly thicker in two distinct zones: between 1047 and 1911 m from the working face’s initial cut, and between 886 and 1294 m from the stopping line.
The 31,305 working face is situated within the 3-1 coal seam, whereas the 22,303 working face is located in the 2-2 coal seam. The vertical separation between the 3-1 and 2-2 coal seams ranges from 29.4 to 35.2 m, while the distance between the 3-1 and 1-2 coal seams varies from 66 to 75 m. The upper boundary of the 31,305 working face is adjacent to the mined-out area of the 22,303 working face. The working face is bounded by solid coal in the north; it is adjacent to the main roadway of the 3-1 coal seam’s third panel in the west; it borders the 31,304 working face in the south; it is demarcated by the mine field boundary in the east. The spatial relationships of various working faces are illustrated in Figure 1.
Through the comprehensive analysis of borehole logs from the 31,305 working face and the laboratory testing of geotechnical mechanical parameters, a detailed stratigraphic column from the surface to the floor of the 3-1 coal seam was constructed. Additionally, the physical and mechanical properties of the rock layers were determined. These findings are summarized in Table 1.

3. Similarity Simulation Test of Shallow Buried Multi Seam Mining

3.1. Design of Similarity Simulation Test

3.1.1. Similarity Simulation Test System

This study focuses on the 22,303 and 31,305 working faces in the Shigetai Coal Mine of the Shendong Mining Area as the engineering context to elucidate the mechanisms of overburden and surface movements, stress evolution, and damage propagation during shallow multi-seam mining. It investigates the dynamic evolution characteristics of the fracture field and stress field in the overburden and surface damage conduction under repeated disturbances in shallow multi-seam mining.
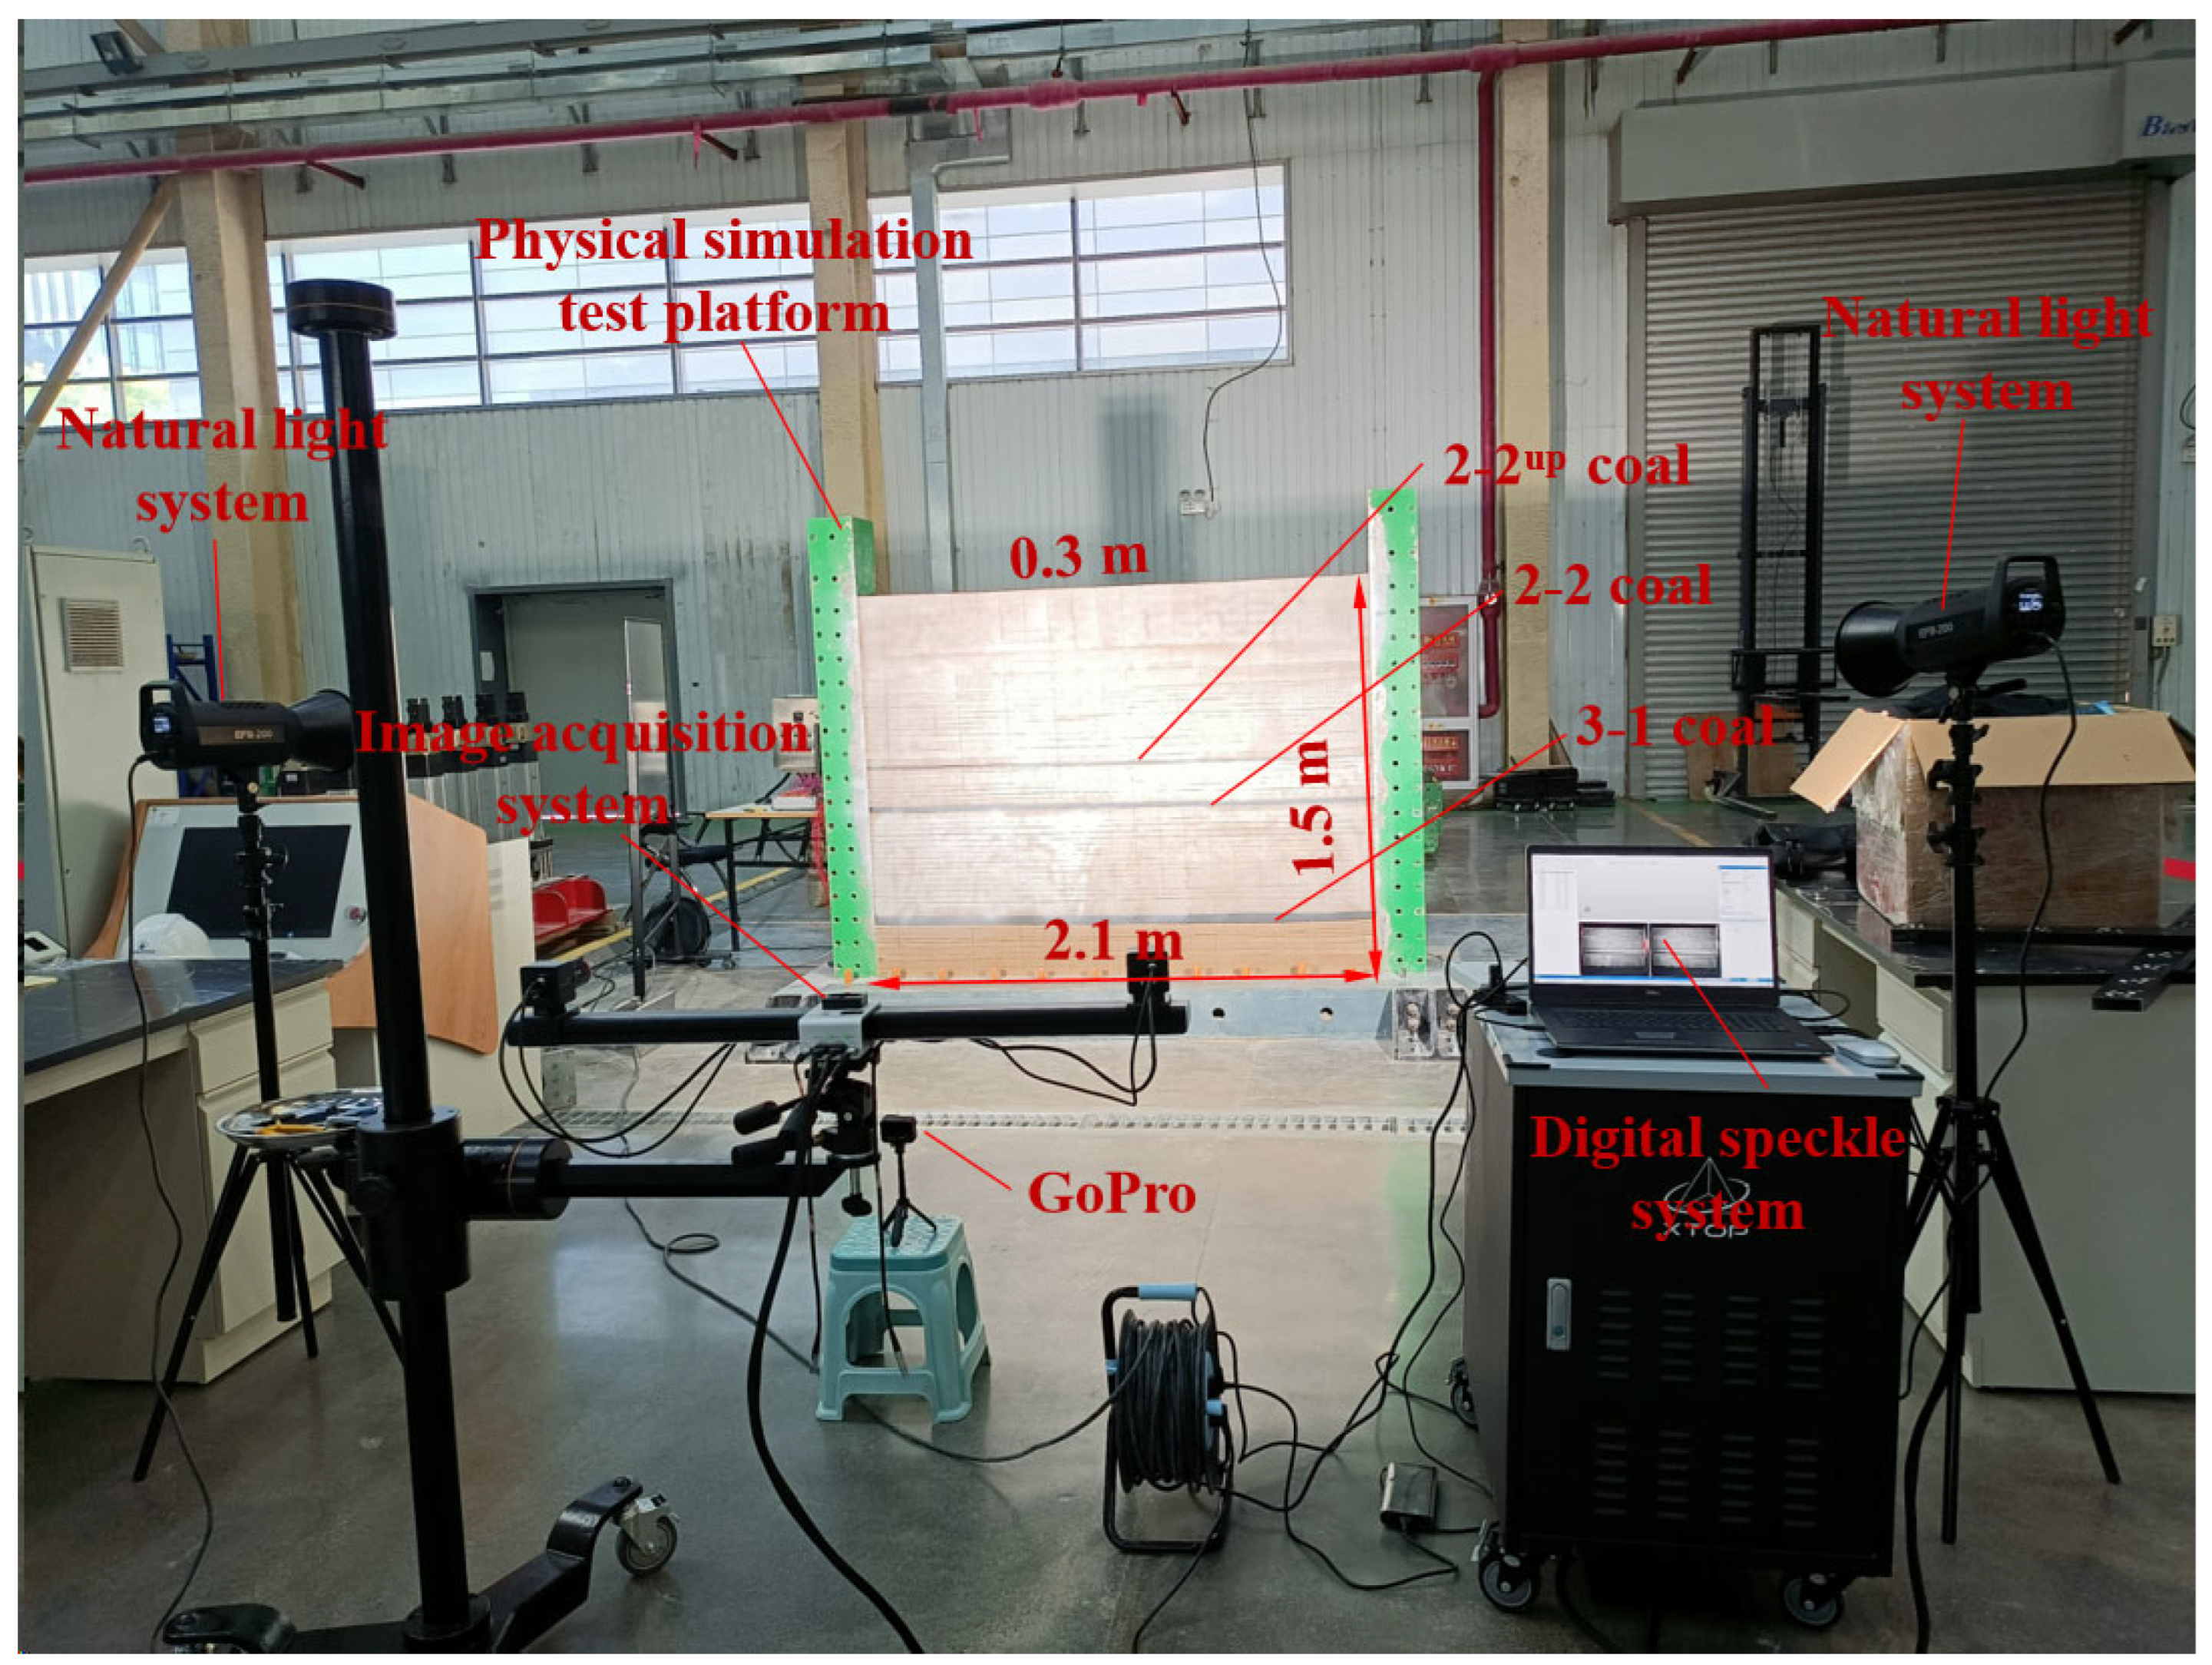
The experimental simulation system utilized in this study includes the multi-seam mining physical simulation platform from the National Key Laboratory of Water Resource Protection and Utilization in Coal Mining, a digital speckle system, a natural light system, and a GoPro motion camera. The dimensions of the experimental model are 2.1 m (length) × 1.5 m (height) × 0.30 m (thickness), as illustrated in Figure 2.

3.1.2. Sensor Arrangement

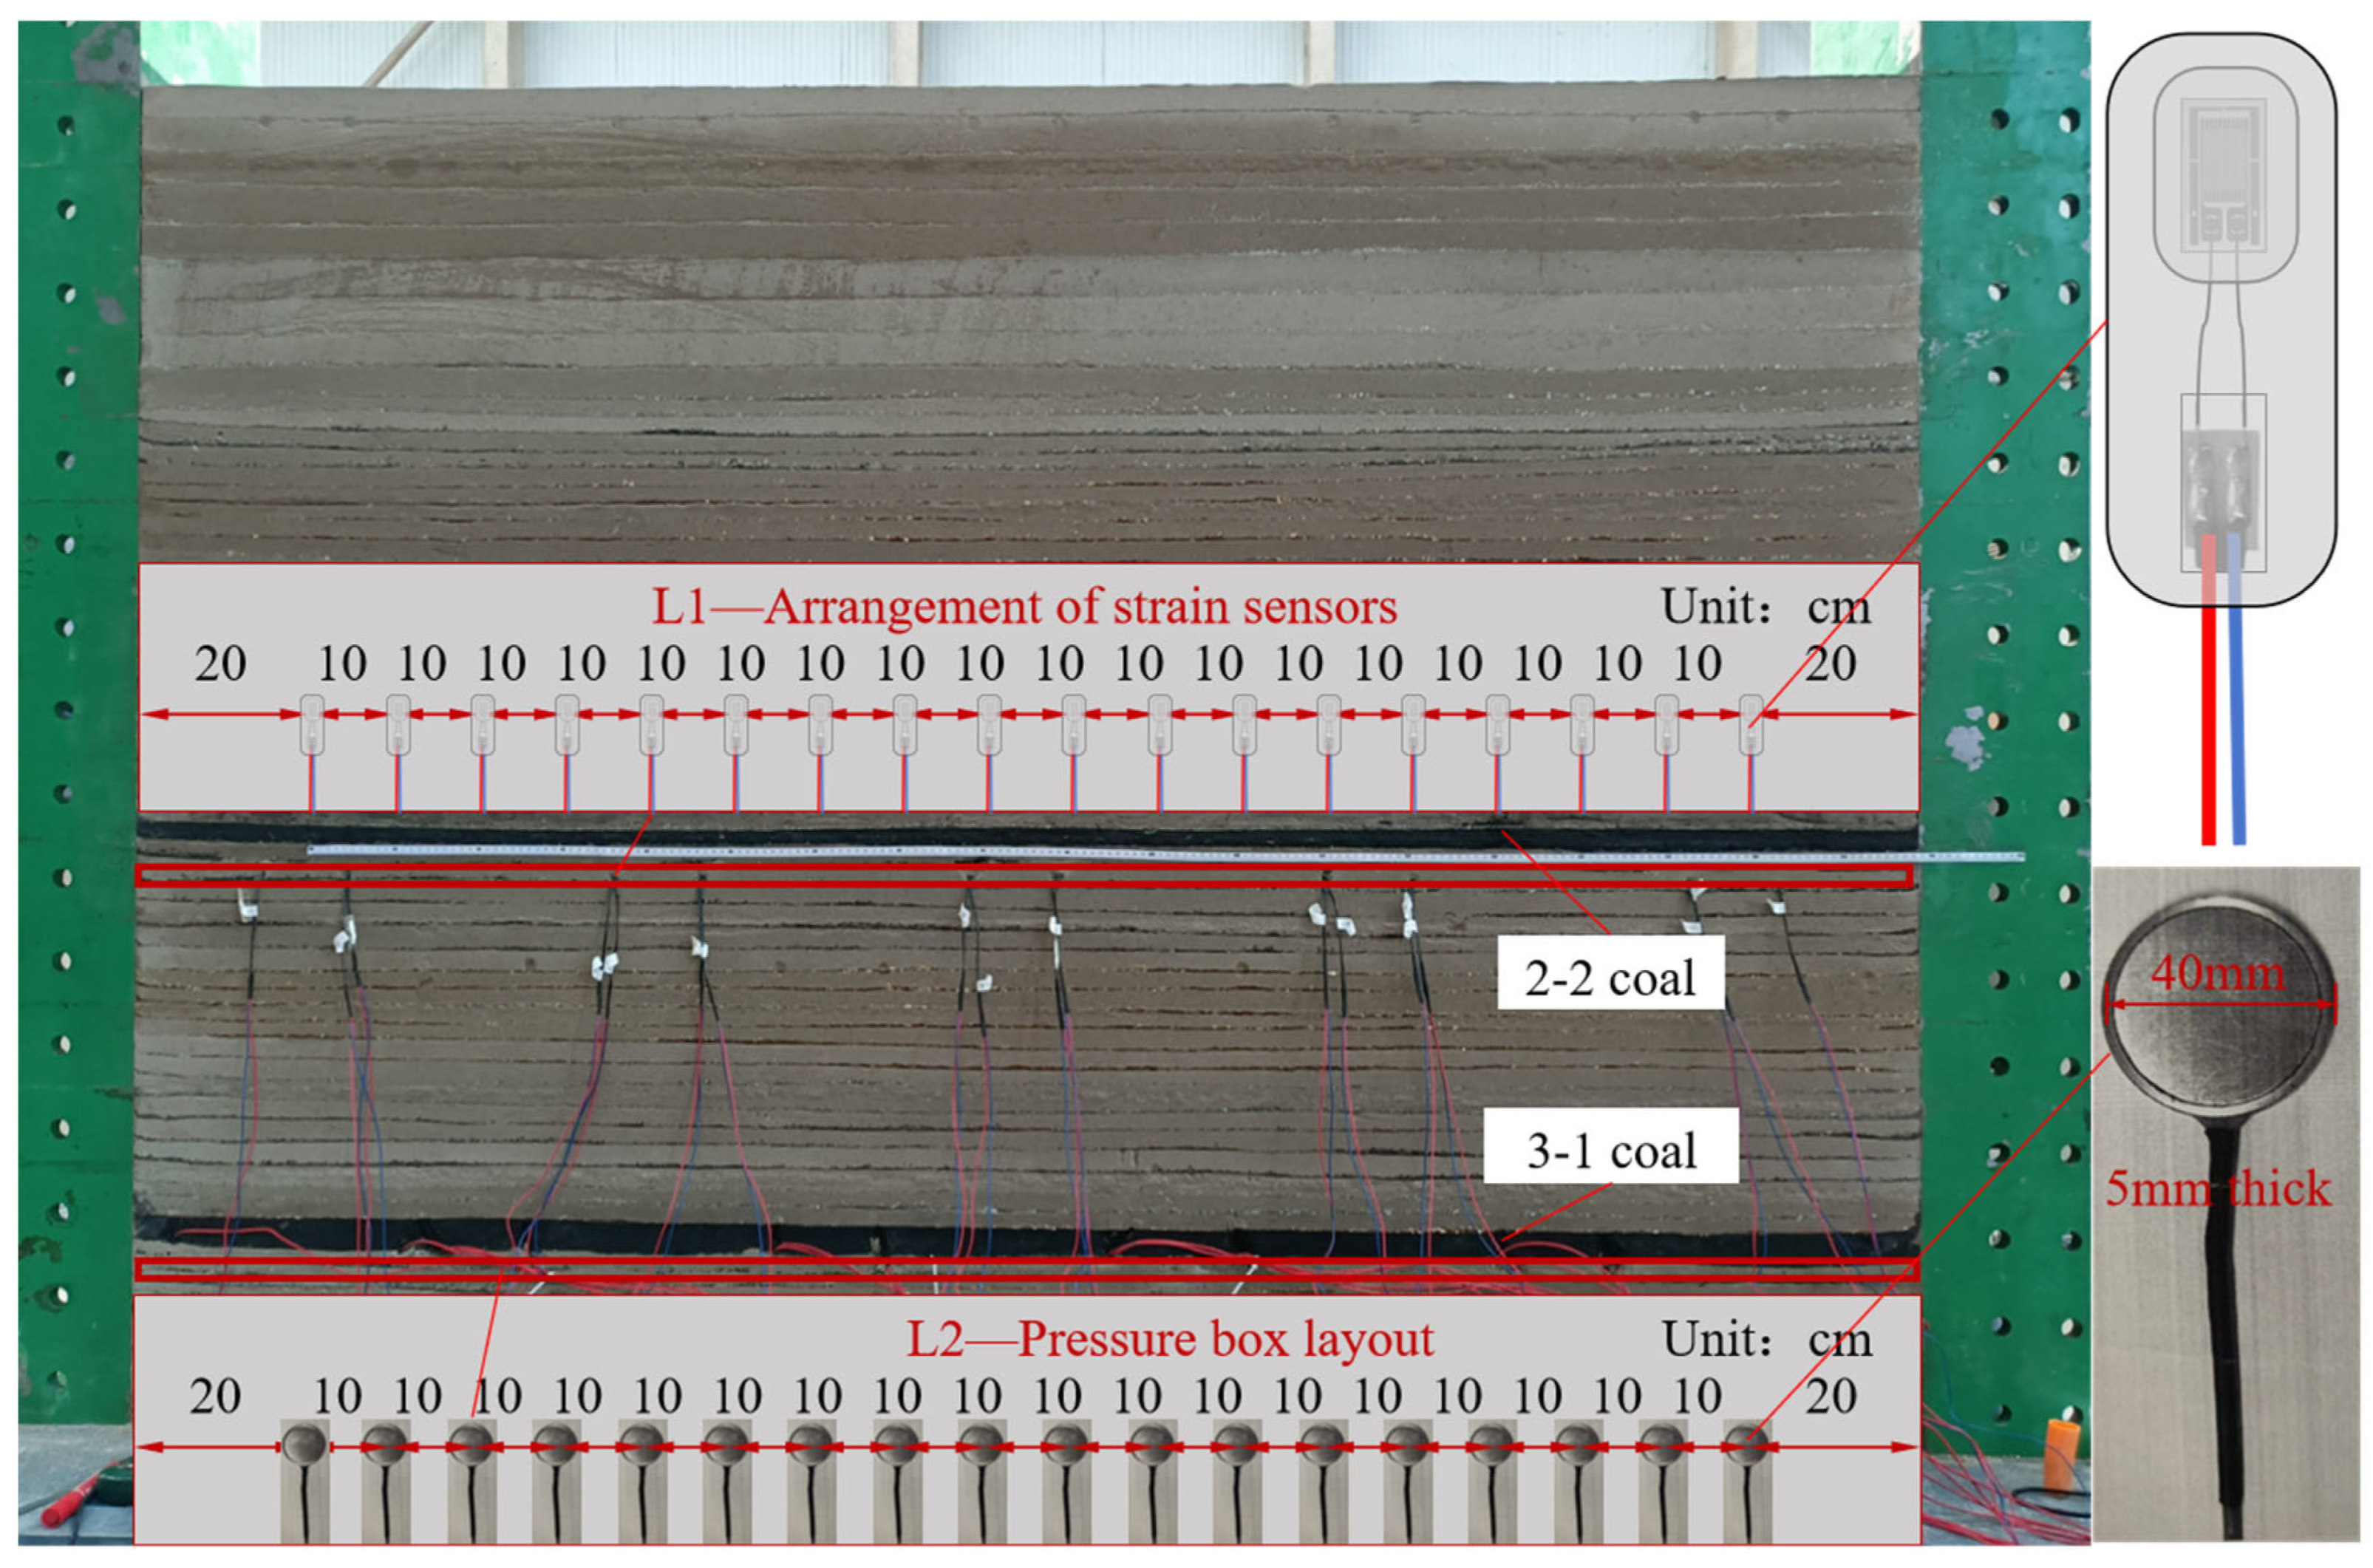
Two sets of sensors were strategically installed in the floor of the 3-1 and 2-2 coal seams during the model construction to capture the stress evolution process in coal pillars and goaf areas during multi-seam mining. Specifically, 18 earth pressure cells, each with a capacity of 200 kPa, a diameter of 40 mm, and a thickness of 5 mm, were deployed in the floor of the 3-1 coal seam. A total of 18 strain sensors were installed in the 2-2 coal seam to minimize the potential influence of sensor size and weight on the experimental results and to reduce external disturbances from the mining of the 2-2 coal seam on the 3-1 coal seam, as illustrated in Figure 3.

3.1.3. Experimental Proportioning and Mining Scheme

The similarity ratios adopted in the experiment are as follows: a geometric similarity ratio of 1:100, stress similarity ratio of 1:100, and time similarity ratio of 1:14. The materials used for the similarity simulation experiment include sand, lime, gypsum, mica, and water. Sand serves as the aggregate, lime and gypsum act as the binding materials, and mica is utilized as the interlayer separation material. Water constitutes 7.5% of the total weight of the similarity materials. After thorough mixing and compaction, the density of the material is 1720 kg/m3. Based on the thickness and density parameters of the rock layers listed in Table 1, the weighted average density of the rock layers in the Shigetai Coal Mine is calculated to be 1993 kg/m3. Consequently, the average density similarity ratio of the experimental design is 1:116, and the average stress similarity ratio is also 1:116. Using these ratios, the simulated strength of each rock layer in the similarity simulation experiment was determined. Additionally, the material composition ratios for each rock layer in the similarity simulation experiment were designed based on the historical data from previous similarity simulation model tests [24], as detailed in Table 2.
According to the stratigraphic column parameters in Table 1, the model was constructed layer by layer from the bottom to the surface, with each layer compacted during the process. Mica was employed as the interlayer separation material between rock layers. The left and right sides of the model were set as fixed boundaries, while the front, back, and top were designated as free boundaries. The coal seams modeled include the 2-2up coal seam, the 2-2 coal seam, and the 3-1 coal seam. The experiment simulated the mining sequence of the Shigetai Coal Mine, with the 2-2 coal seam and the 3-1 coal seam being extracted sequentially. The starting positions of the mining faces for both coal seams were set 30 cm from the model boundary. Each excavation step involved removing 5 cm of material, followed by a 15 min interval before the next excavation, with a total excavation length of 160 cm.

3.2. Strata Collapse Characteristics

3.2.1. Overburden Caving Characteristics of 2-2 Coal Mining

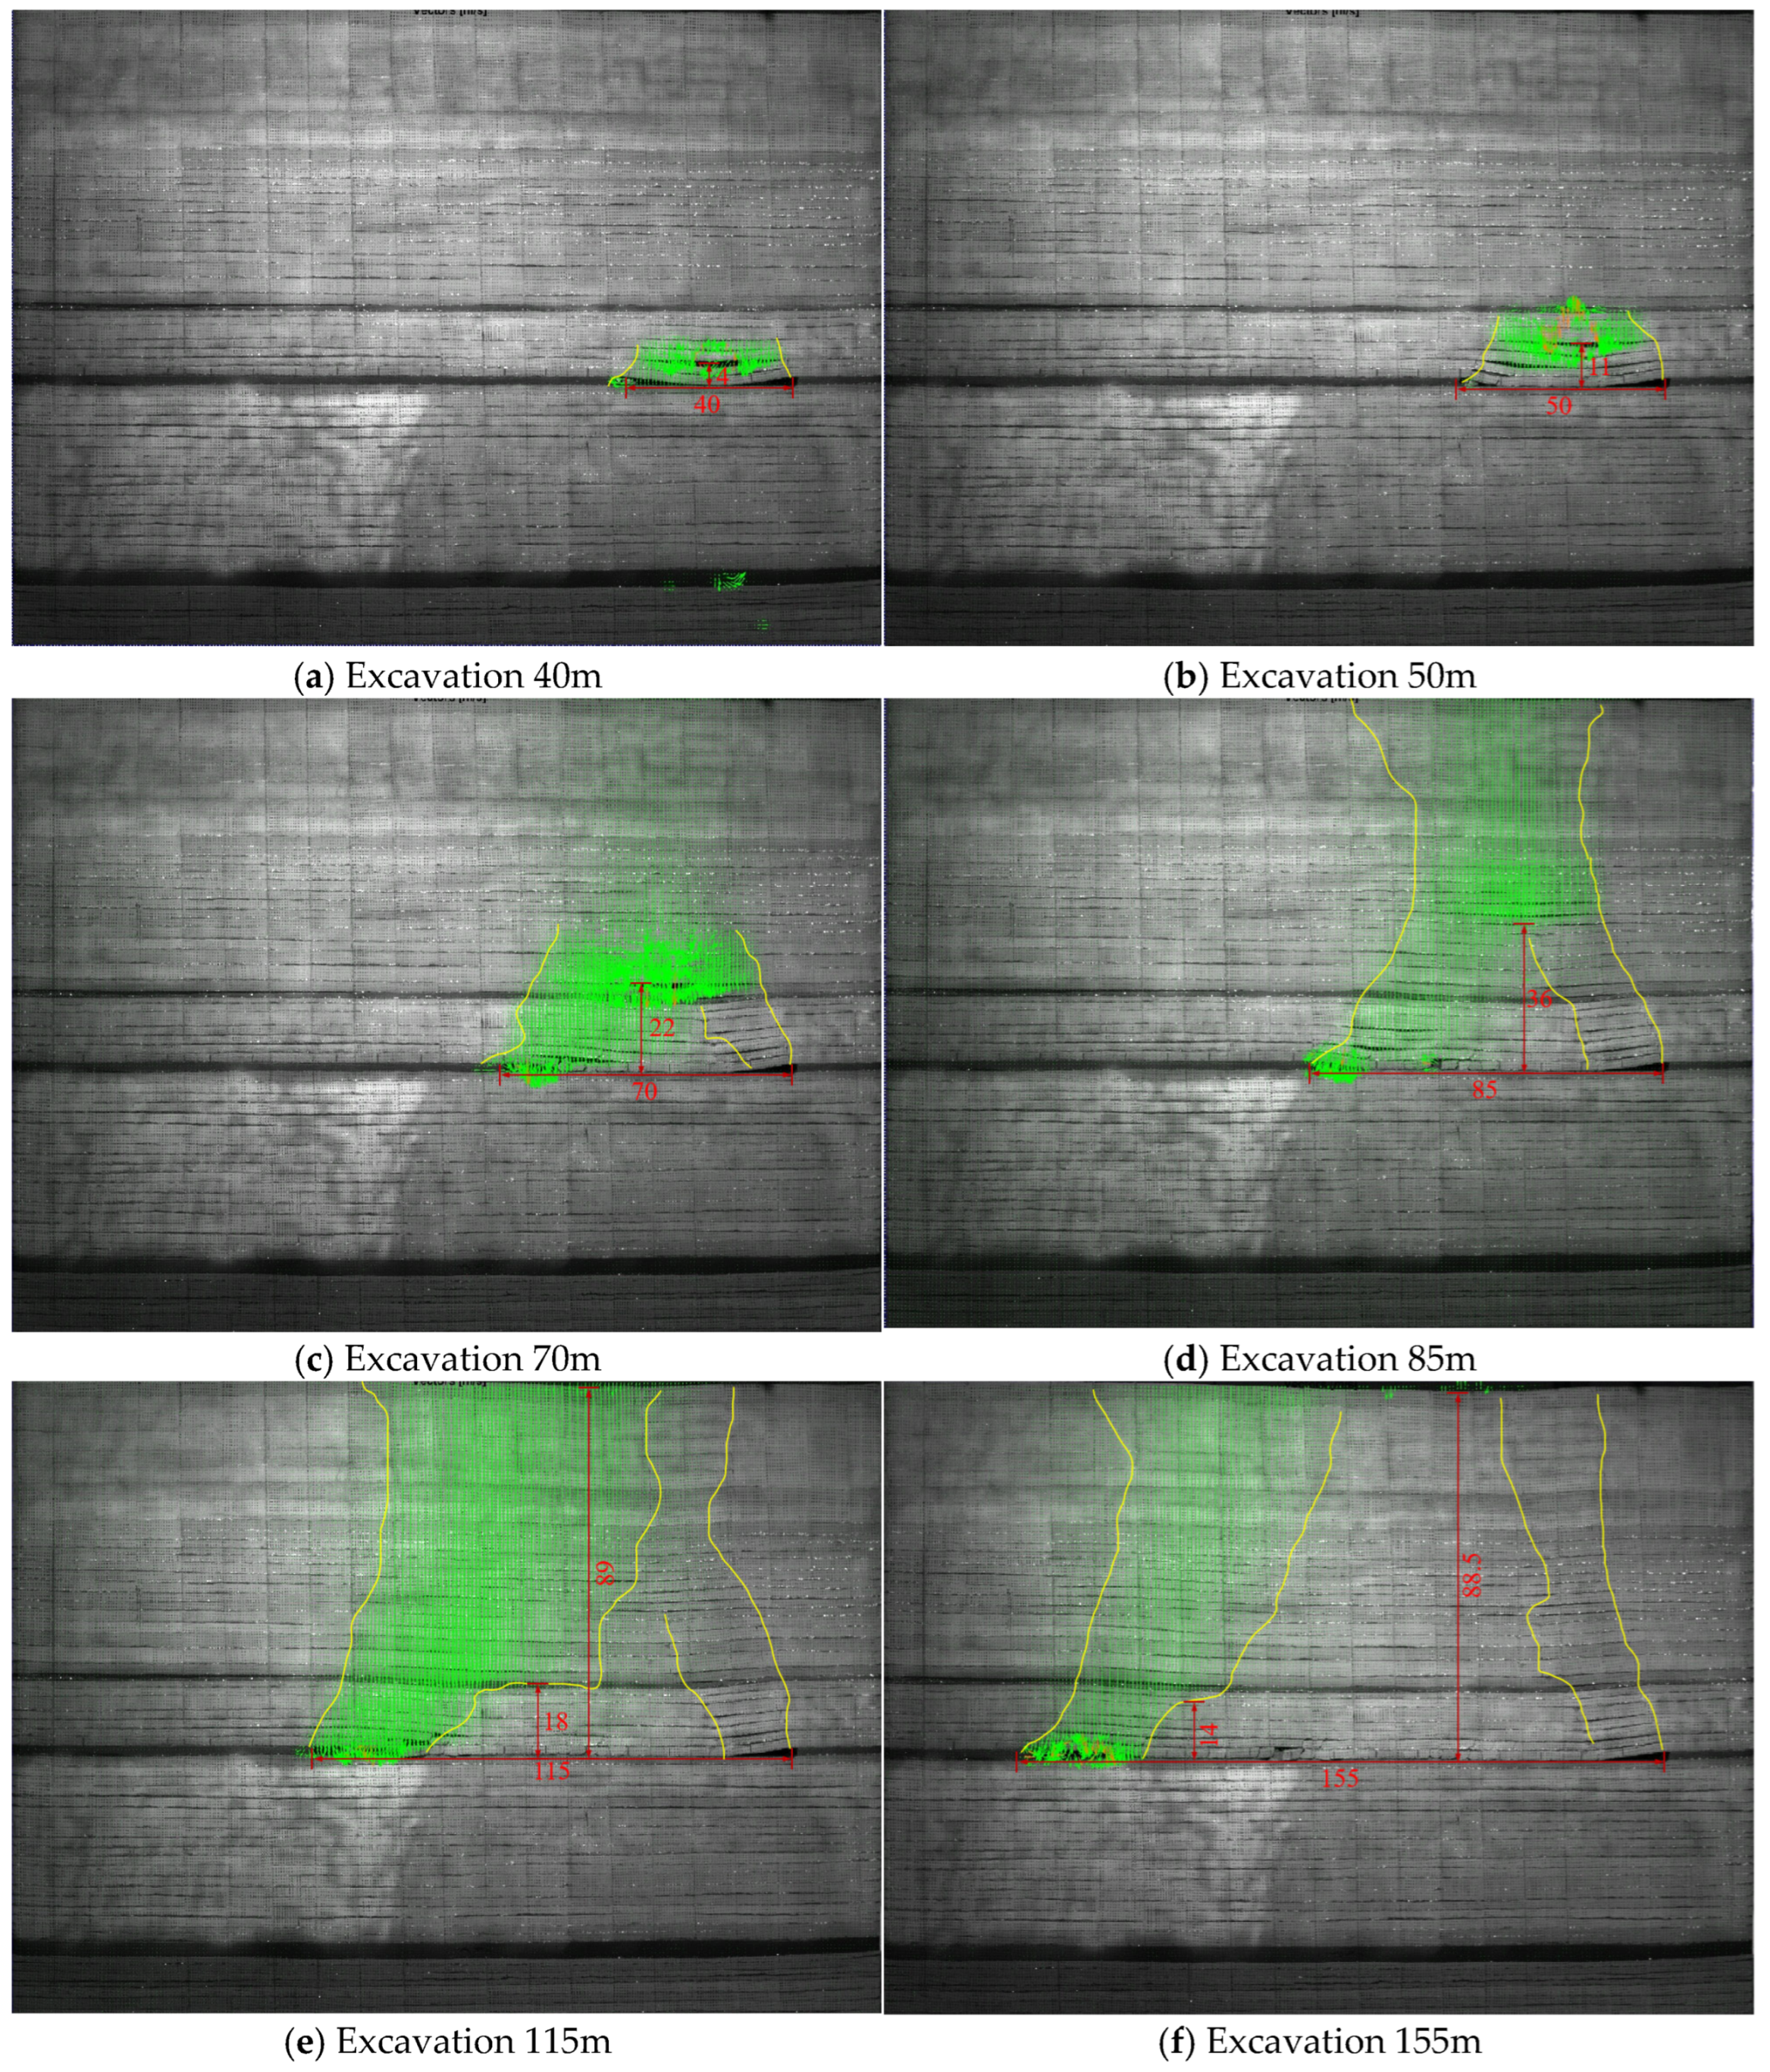
During the excavation of the 2-2 coal seam, the digital speckle system was employed to record the excavation process in real time. Simultaneously, the Particle Image Velocimetry (PIV) algorithm [25,26] was utilized to dynamically analyze the movement of the overlying rock strata. The distribution of rock layer collapse and primary fractures resulting from the excavation of the 2-2 coal seam is illustrated in Figure 4.
As illustrated in Figure 4, when the coal seam was excavated to a length of 40 m, the immediate roof above the goaf exhibited bending and subsidence. After a period of static conditions, the deflection of the overlying rock strata gradually intensified, leading to the collapse of the immediate roof above the goaf, with a collapse height of 4 m. The cracks at both ends propagated upward to a height of approximately 9.2 m. Upon reaching an excavation length of 50 m, the initial collapse of the basic roof above the goaf occurred, with a collapse height of 11 m and crack propagation heights of about 17 m at both ends. The collapsed roof in the central area of the goaf fully contacted the coal seam floor, while the sandy mudstone above the working face formed a hinged structure with the collapsed rock mass, creating a separation layer with the overlying medium-grained sandstone.
When the excavation extended to 70 m, the collapse height of the rock strata above the goaf reached 22 m, with crack propagation heights of approximately 32 m at both ends. A new fracture emerged in the rock strata above the cut hole, extending to a height of 14.6 m. At an excavation length of 85 m, the collapse height of the rock strata above the goaf increased to 36 m, with cracks propagating upward to the surface. Two significant separation layers formed within the rock strata within 10 m above the working face, accompanied by a step-like fracture with a height of 4 m. The second crack near the cut hole gradually extended to the separation layer at 36 m.
Upon reaching an excavation length of 115 m, the collapse of the goaf extended to the surface, resulting in three main fractures penetrating the surface, including one step-like fracture with a height of 18 m. The second crack near the cut hole continued to propagate upward and eventually connected with the central fracture. Meanwhile, some separation layers gradually compacted, leading to noticeable surface subsidence. When the excavation length reached 155 m, a subsidence basin formed on the surface, accompanied by four main fractures penetrating the surface, including one step-like fracture with a height of 14 m. The second main crack near the cut hole extended to the surface.
These observations indicate that as the excavation of the 2-2 coal seam progressed, the spatial extent of the goaf gradually increased, and the overlying rock strata collapsed in a step-like manner, with the propagation heights of the main cracks at both ends exceeding the collapse heights of the rock strata. The collapse process continued until the rock strata reached the surface. After the formation of the subsidence basin, the movement of the rock strata near the cut hole stabilized, and the fractures in the lower region of the subsidence basin gradually diminished or even closed.

3.2.2. Overburden Caving Characteristics of 3-1 Coal Mining

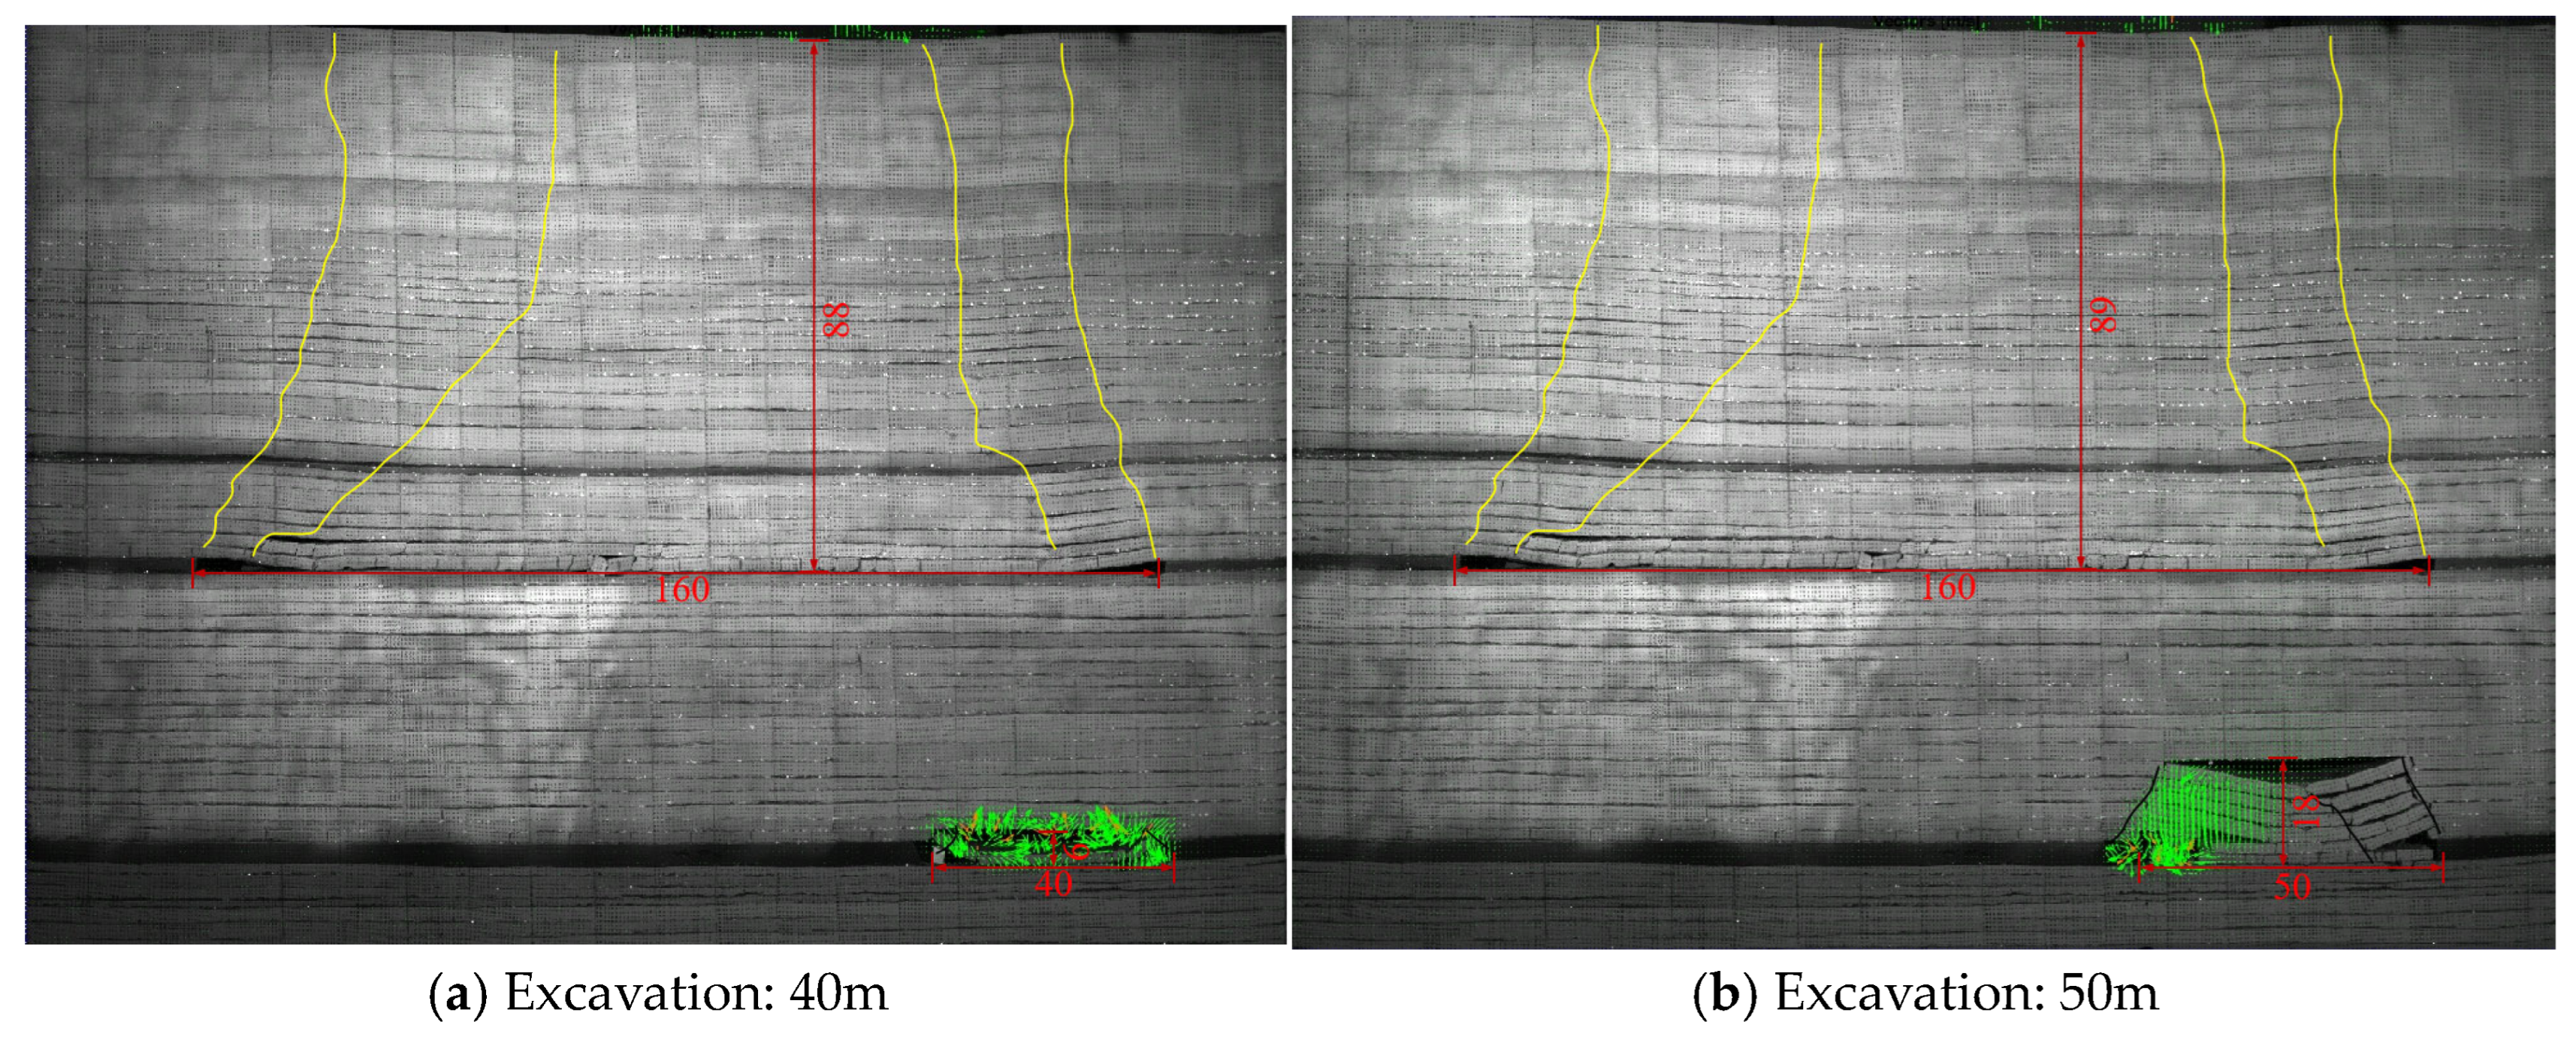
Upon the completion of the excavation of the 2-2 coal seam, a 12-h interval was implemented to ensure the full collapse of the overlying rock strata and the complete subsidence of the surface. Subsequently, the excavation of the 3-1 coal seam commenced. The distribution of rock layer collapse and primary fractures resulting from the excavation of the 3-1 coal seam is illustrated in Figure 5.
As depicted in Figure 5, following the excavation of the coal seam to a length of 40 m, the roof above the goaf exhibited bending and subsidence. After a period of static conditions, the deflection of the overlying rock strata gradually intensified, leading to the collapse of the immediate roof above the goaf, with a collapse height of 6 m. The cracks at both ends propagated upward to a height of approximately 3.4 m, causing disturbances to the 2-2 coal seam and its overlying rock strata. Upon reaching an excavation length of 50 m, the initial collapse of the basic roof occurred, with a collapse height of 18 m and crack propagation heights of about 14.5 m at both ends. The collapsed roof in the central area of the goaf fully contacted the coal seam floor, while the sandy mudstone above the working face formed a hinged structure with the collapsed rock mass. A second main fracture emerged at the cut hole, extending to the separation layer, further disturbing the 2-2 coal seam and its overlying strata.
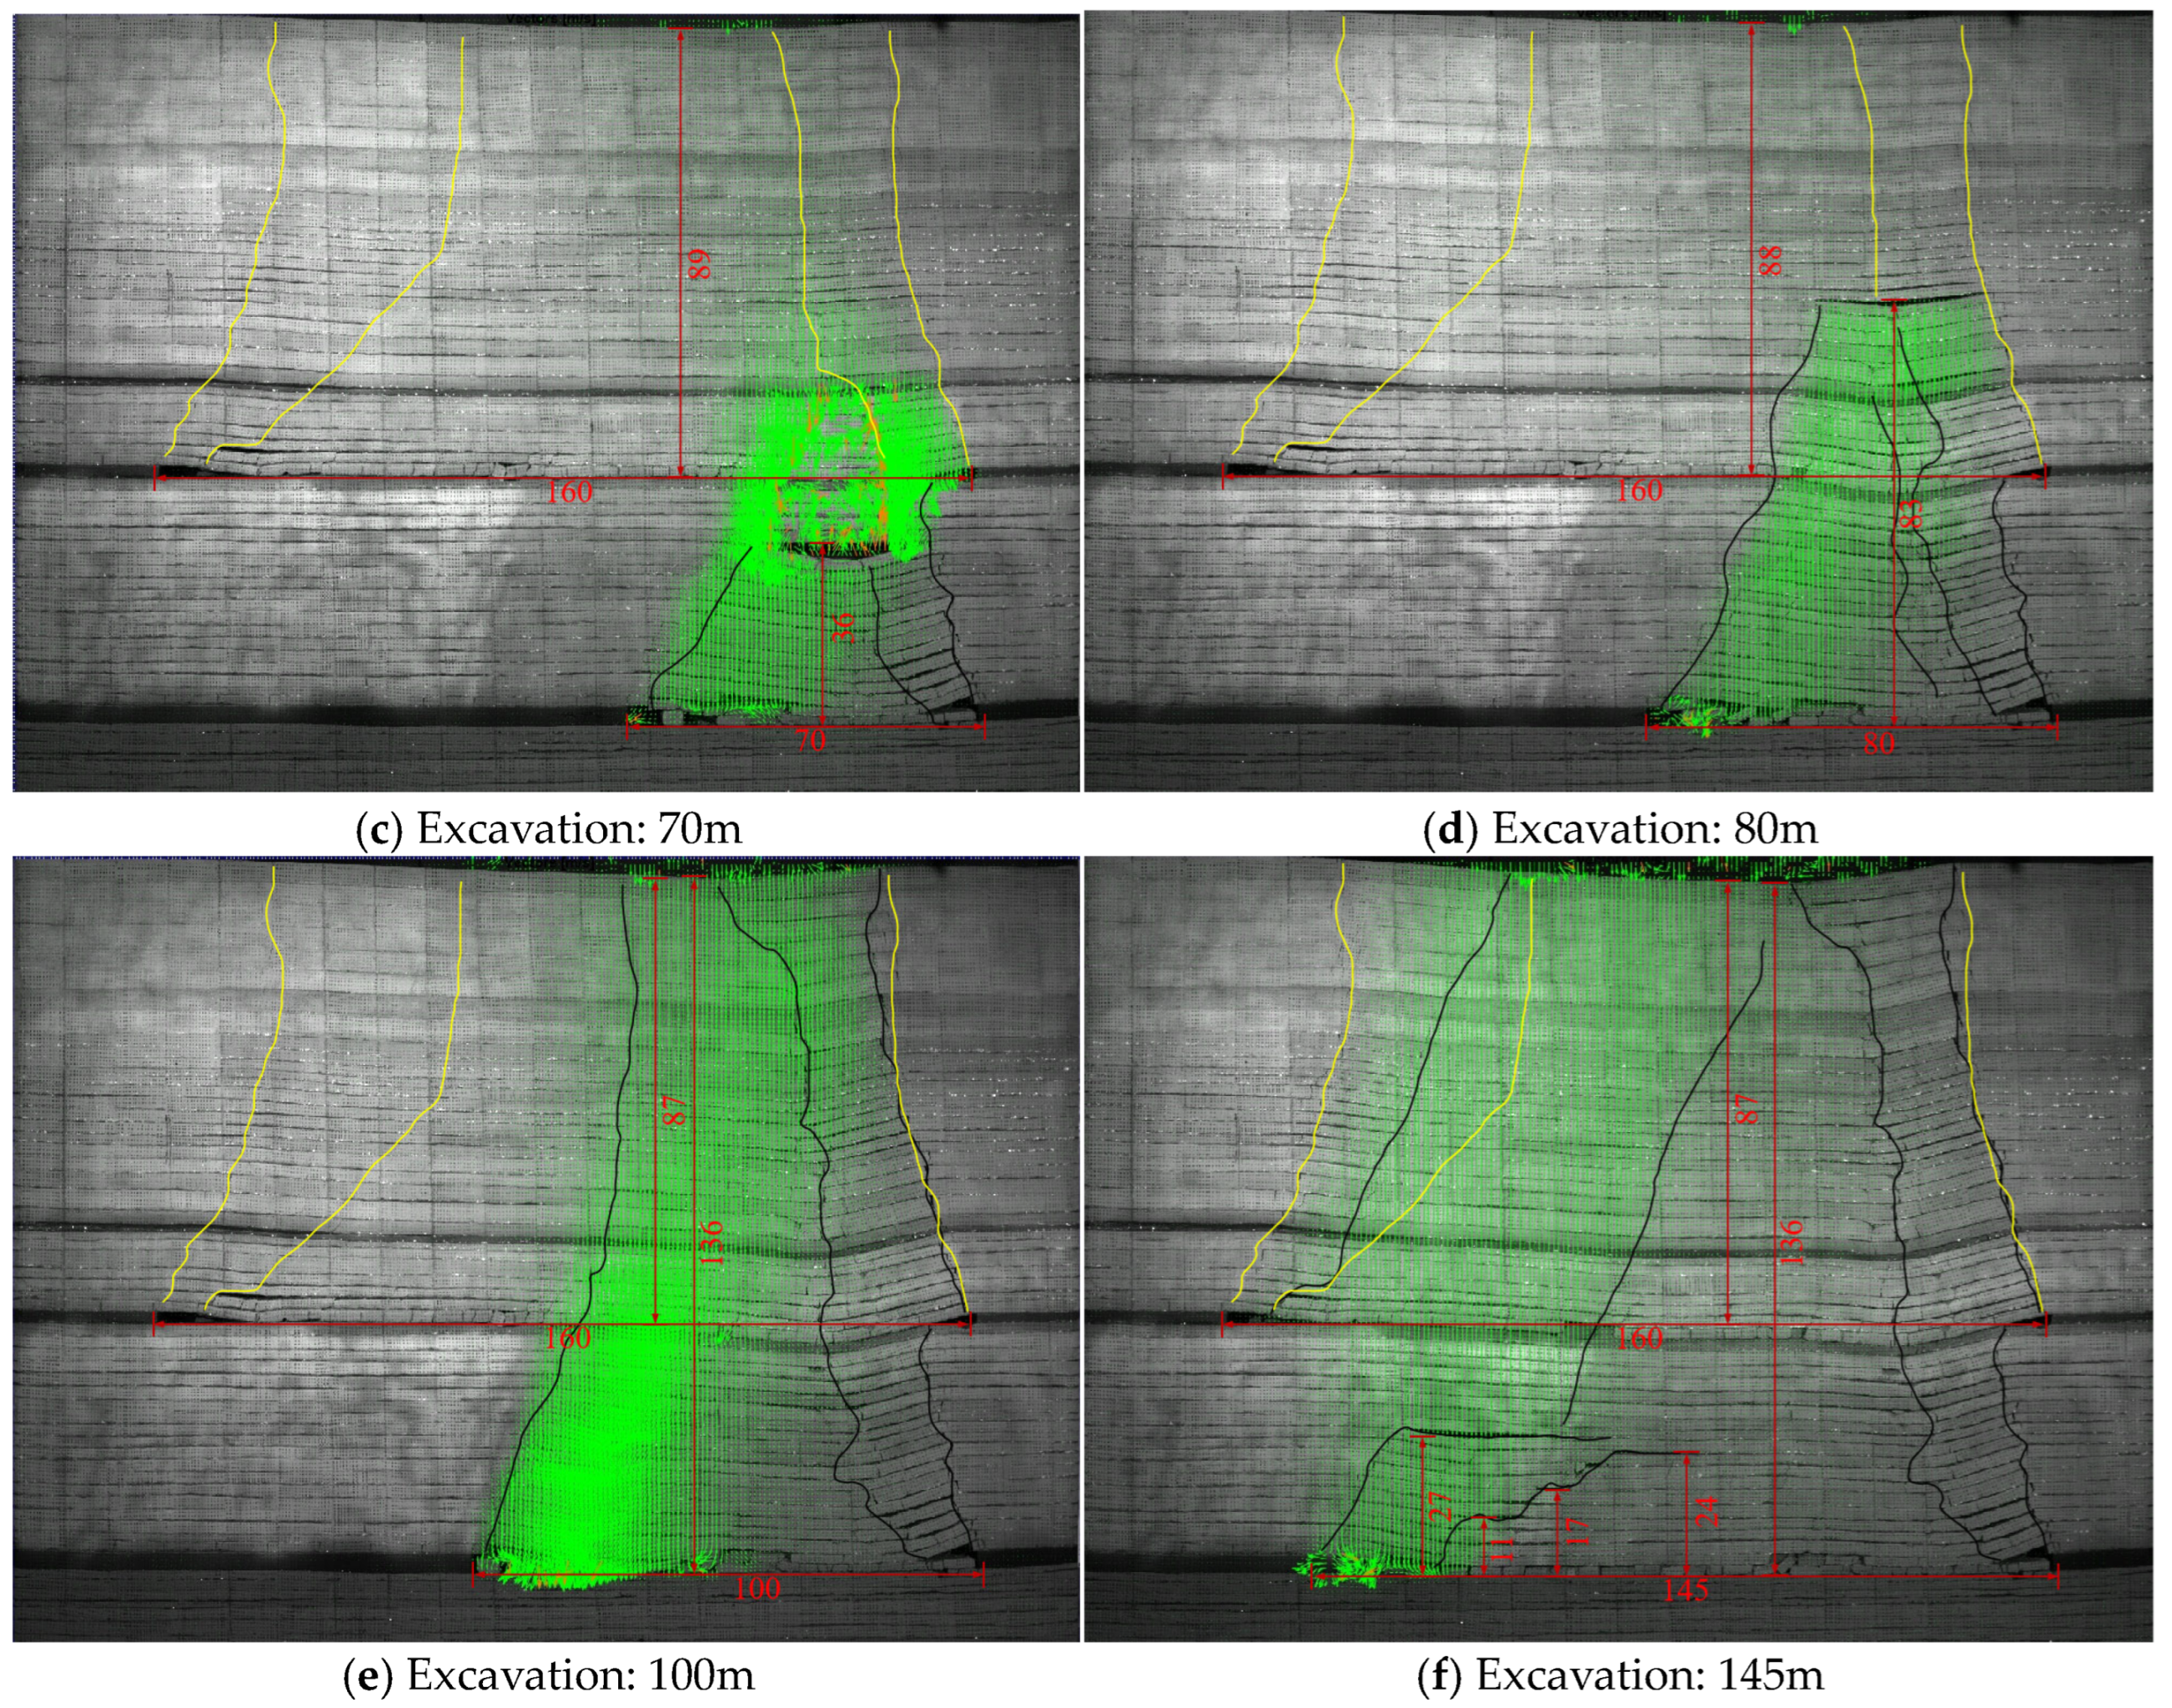
When the excavation extended to 70 m, the collapse height of the rock strata above the goaf reached 36 m. The main fracture at the working face end propagated upward to the fine-grained sandstone layer located 28.6 m above the 3-1 coal seam (with a thickness of 11.3 m), while the main fracture at the cut hole extended to the 2-2 coal seam. A second main fracture at the cut hole connected to the separation layer, further disturbing the 2-2 coal seam and its overlying strata. At an excavation length of 80 m, the fine-grained sandstone layer (11.3 m thick) located 28.6 m above the 3-1 coal seam collapsed, resulting in a collapse height of approximately 83 m above the 3-1 goaf. Four main fractures formed, with the main fracture at the working face end penetrating the 2-2 coal seam and further extending into the separation layer of its overlying strata. The main fracture at the cut hole penetrated the 2-2 coal seam and continued to propagate upward, while the main fracture at the cut hole connecting to the surface widened. The two central main fractures gradually extended into the separation layer, and the height of the repeatedly disturbed rock strata in the 2-2 coal seam was approximately 33.7 m.
Upon reaching an excavation length of 100 m, the collapse of the goaf extended to the surface, with a collapse height of about 136 m, forming three main fractures penetrating the surface. The main fracture at the cut hole widened compared to its state before the excavation of the 2-2 coal seam, and the surrounding fractured zone expanded. When the excavation length reached 145 m, a subsidence basin formed on the surface, with four main fractures penetrating the surface, including two step-like fractures.
These observations indicate that as the excavation of the 3-1 coal seam progressed, the spatial extent of the goaf gradually increased, and the overlying rock strata collapsed in a step-like manner, with the propagation heights of the main cracks at both ends exceeding the collapse heights of the rock strata. When the fine-grained sandstone layer (11.3 m thick) located 28.6 m above the 3-1 coal seam collapsed, the excavation of the 3-1 coal seam began to affect the overlying rock strata of the 2-2 goaf. However, the overlying rock strata of the 2-2 goaf still maintained a certain degree of stability. After the formation of the subsidence basin, the movement patterns of the overlying rock strata were similar to those observed during the excavation of the 2-2 coal seam. The movement of the rock strata near the cut hole gradually stabilized, and the fractures in the lower region of the subsidence basin gradually diminished or even closed.
In summary, as the working face advanced, the main fractures at the working face end and the cut hole continuously extended upward, with the intact rock mass outside the main fractures forming an arch-shaped structure that gradually expanded outward. The main fracture at the working face end propagated forward and upward in a step-like manner as the working face advanced, while some of the central main fractures gradually diminished or disappeared as surface subsidence occurred. The loose layers collapsed following the failure of the key strata, exhibiting a pattern of “overlying strata breaking layer by layer, arch-shaped expansion, and loose layers settling accordingly.”

3.3. Stress Strain Data Analysis

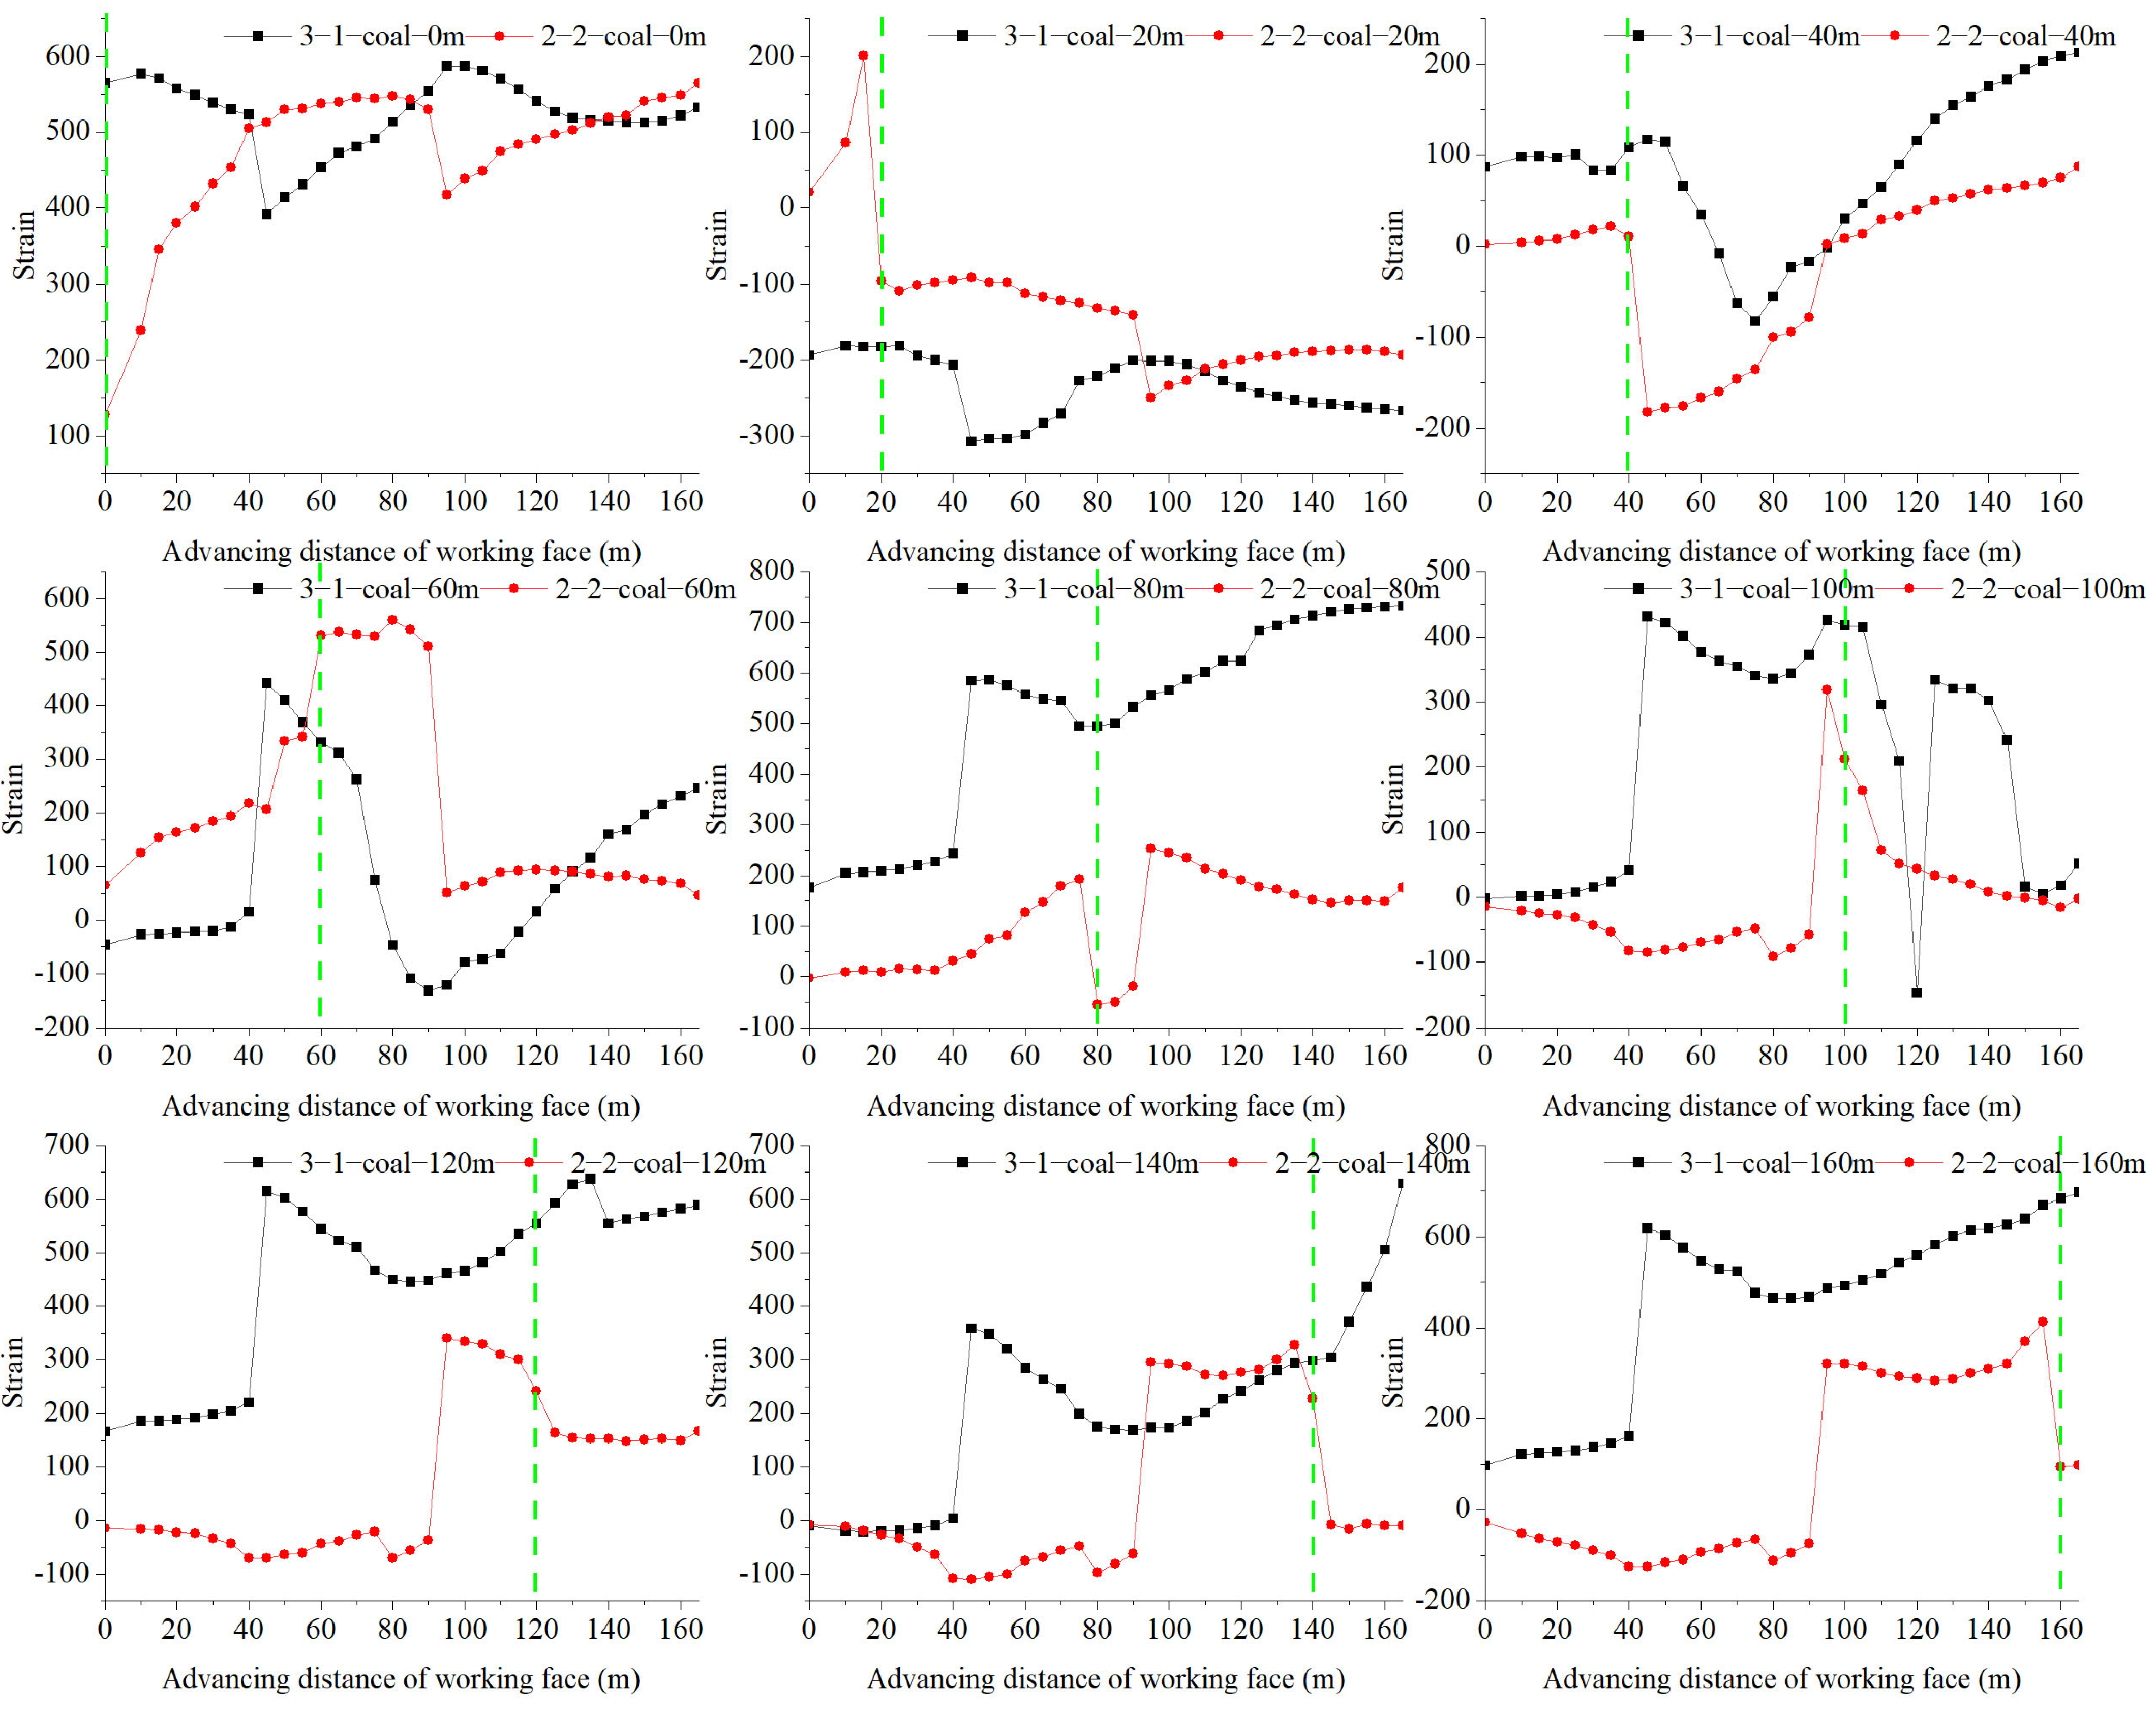
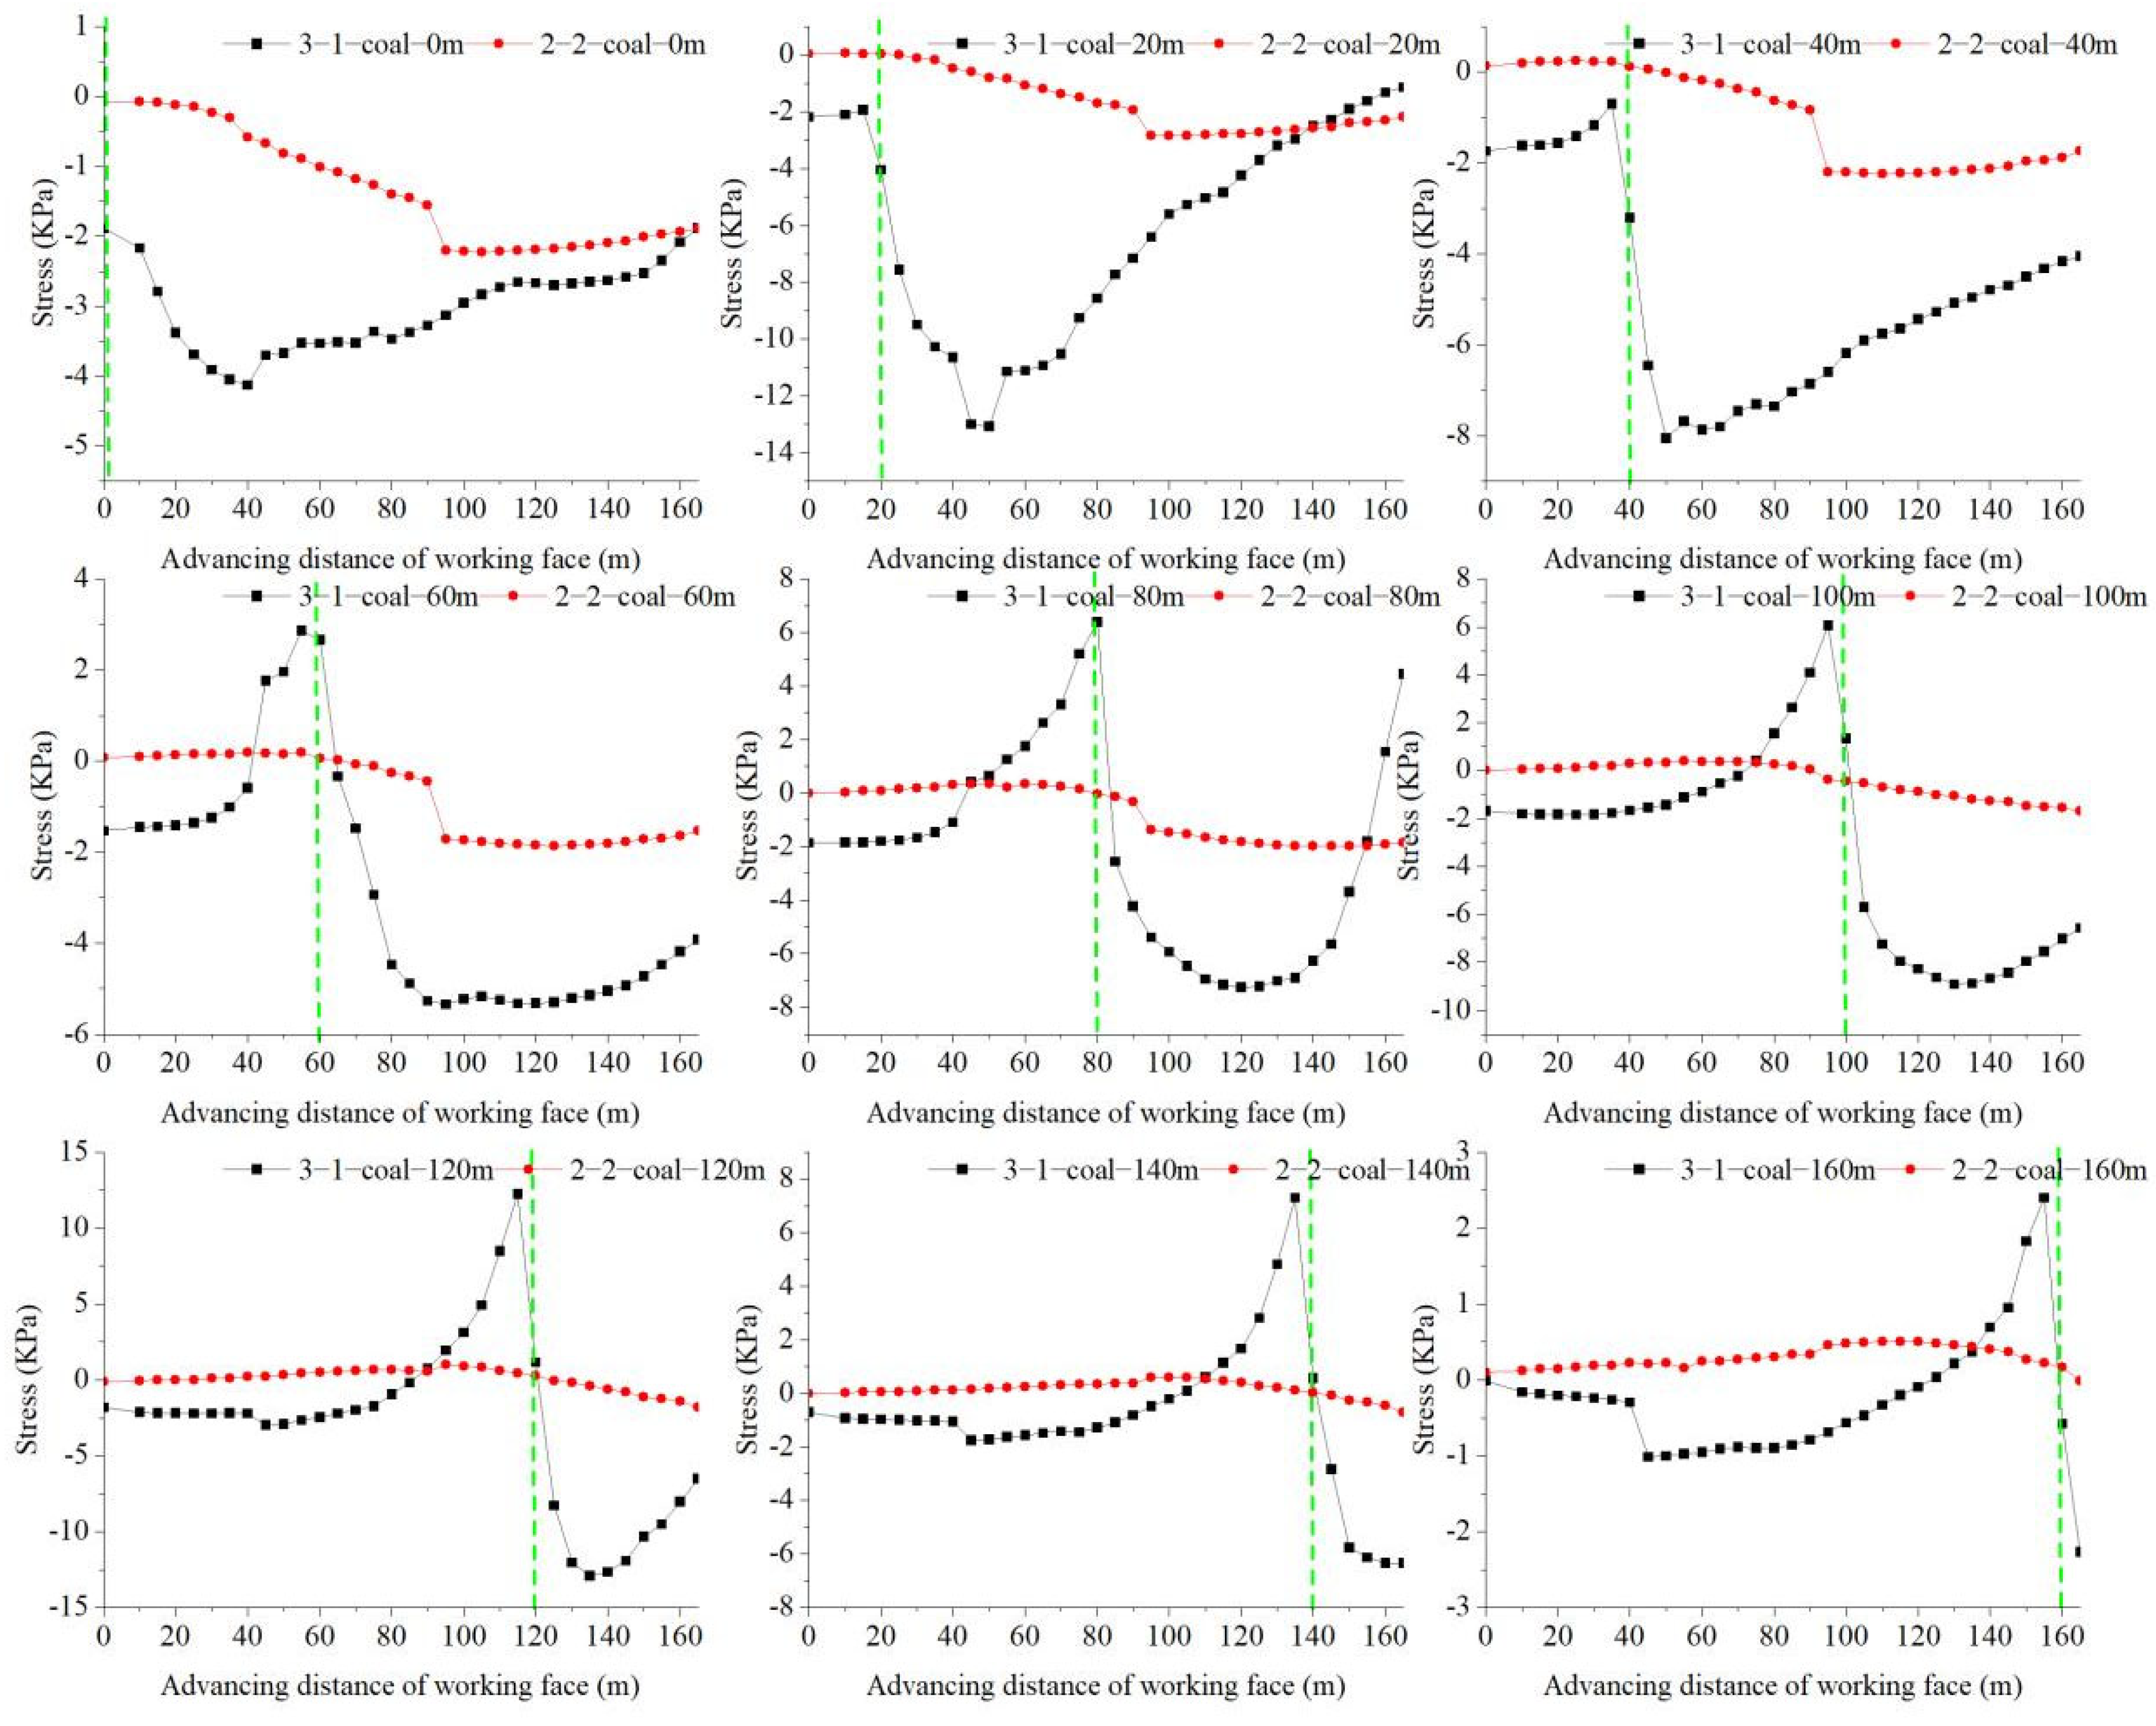
During the model setup process, 18 sets of sensors were embedded in the sandy mudstone layer beneath both the 2-2 and 3-1 coal seams. For analysis, sensors located at 0, 20, 40, 60, 80, 100, 120, 140, and 160 m from the cut hole were selected, as illustrated in Figure 6 and Figure 7. In these figures, the green vertical lines indicate the relative positions of the sensors with respect to the cut hole, the red curves represent the sensor data recorded during the excavation of the 2-2 coal seam, and the black curves depict the sensor data obtained during the excavation of the 3-1 coal seam.
Analysis of sensor data at different distances from the cut hole:
(1)
Sensor at 0 m: During the excavation of the 2-2 coal seam, when the working face advanced to 40 m, the initial collapse of the roof above the working face occurred. The upward propagation of fractures at the cut hole interrupted the stress transfer from the overlying strata to the cut hole, resulting in a gradual increase in subsequent stress. At an advance of 90 m, the roof above the goaf collapsed to the surface, disrupting the arch-shaped structure of the overlying strata and causing a sudden release of stress, as indicated by a sharp drop in sensor readings. As the working face continued to advance, the collapsed overlying strata were further compacted, leading to a gradual increase in stress at the cut hole. During the excavation of the 3-1 coal seam, the sensor readings initially decreased due to stress relief caused by the underlying mining activity. At an advance of 40 m, the roof collapsed, resulting in a sudden drop in sensor readings. As the working face progressed, the readings gradually increased. At an advance of 100 m, the roof above the goaf collapsed again to the surface, causing a decrease in sensor readings.
(2)
Sensor at 20 m: During the excavation of the 2-2 coal seam, a sudden drop in sensor readings was observed at an advance of 20 m. As the working face continued to advance, the readings stabilized due to the formation of a lower-arch structure in the fractured rock strata above the sensor. At an advance of 90 m, the readings dropped sharply and then increased slowly. During the excavation of the 3-1 coal seam, a sudden drop in sensor readings occurred at an advance of 40 m. As the working face progressed, the readings gradually increased. At an advance of 100 m, the readings decreased.
(3)
Sensor at 40 m: During the excavation of the 2-2 coal seam, a sudden drop in sensor readings was observed at an advance of 40 m. As the working face advanced, the readings gradually increased, showing a step-like rise at an advance of 90 m. During the excavation of the 3-1 coal seam, the readings gradually decreased at an advance of 50 m. Then, at an advance of 75 m, the readings transitioned from decreasing to increasing.
(4)
Sensor at 60 m: During the excavation of the 2-2 coal seam, step-like increases in sensor readings were observed at advances of 50 and 60 m, followed by stabilization. At an advance of 95 m, the readings dropped sharply and then stabilized. During the excavation of the 3-1 coal seam, the readings increased sharply at an advance of 50 m, then gradually decreased, reaching a minimum at an advance of 90 m, after which they gradually increased.
(5)
Sensor at 80 m: During the excavation of the 2-2 coal seam, a sudden drop in sensor readings occurred at an advance of 80 m, followed by a gradual increase. The readings peaked at an advance of 95 m and then gradually decreased. During the excavation of the 3-1 coal seam, the readings increased sharply at an advance of 45 m, then gradually decreased, reaching a minimum at an advance of 80 m, after which they gradually increased. A step-like increase was observed at an advance of 115 m.
(6)
Sensor at 100 m: During the excavation of the 2-2 coal seam, minor fluctuations in sensor readings were observed at advances of 40 and 75 m. At an advance of 95 m, the readings transitioned from increasing to decreasing and continued to decline. During the excavation of the 3-1 coal seam, the readings increased sharply at an advance of 45 m, then gradually decreased. At an advance of 80 m, the readings transitioned from decreasing to increasing. The readings dropped sharply between advances of 110 and 120 m, the readings dropped sharply, followed by a sudden increase at an advance of 125 m, after which they gradually decreased.
(7)
Sensor at 120 m: During the excavation of the 2-2 coal seam, the readings increased sharply at an advance of 90 m, then gradually decreased, stabilizing after an advance of 125 m. During the excavation of the 3-1 coal seam, the readings increased sharply at an advance of 45 m, then gradually decreased. At an advance of 80 m, the readings transitioned from decreasing to increasing. At an advance of 125 m, the readings dropped sharply and then gradually increased.
(8)
Sensor at 140 m: During the excavation of the 2-2 coal seam, the readings increased sharply at an advance of 90 m and then stabilized. At an advance of 135 m, the readings dropped sharply and then stabilized. During the excavation of the 3-1 coal seam, the readings increased sharply at an advance of 45 m, then gradually decreased. At an advance of 90 m, the readings transitioned from decreasing to increasing. A step-like increase was observed at an advance of 135 m, followed by an accelerated rise.
(9)
Sensor at 160 m: During the excavation of the 2-2 coal seam, the readings increased sharply at an advance of 90 m and then stabilized. At an advance of 155 m, the readings dropped sharply. During the excavation of the 3-1 coal seam, the readings increased sharply at an advance of 45 m, then gradually decreased. At an advance of 90 m, the readings transitioned from decreasing to increasing.
Figure 7 shows that during the excavation of the 2-2 coal seam, the readings from the earth pressure cells generally exhibited a declining trend. When the working face advanced to 90 m, the pressure cell readings at 0, 20, 40, 60, and 80m from the cut hole showed a stepwise decrease, while the readings from the remaining pressure cells initially increased before declining.
During the excavation of the 3-1 coal seam, the stress data from the pressure cell located 0m from the cut hole indicated an initial decrease followed by an increase, reaching its lowest value when the working face advanced to 40 m, after which it exhibited a stepwise increase, ultimately surpassing the initial stress value. The stress data from the pressure cell 20 m from the cut hole showed a decrease starting at 25 m of advancement, reaching its lowest value at 50 m, followed by a stepwise increase, ultimately exceeding the initial stress value. The stress data from the pressure cell 40 m from the cut hole began to decrease at 40 m of advancement, reaching its lowest value at 50 m, after which it gradually increased, ultimately remaining below the initial stress value. The stress data from the pressure cell 60 m from the cut hole showed a sharp increase at 45 m of advancement, peaking at 55 m, then gradually decreasing, reaching its lowest value at 90 m, stabilizing thereafter, and slowly increasing again after 130 m. The stress data from the pressure cell 80m from tmhe cut hole showed a sharp increase at 45 m of advancement, peaking at 80 m, then sharply decreasing, reaching its lowest value at 120 m, after which it gradually increased. The stress data from the pressure cell 100 m from the cut hole showed a sharp increase at 75 m of advancement, peaking at 95 m, then sharply decreasing, reaching its lowest value at 135 m, after which it gradually increased. The stress data from the pressure cell 120 m from the cut hole showed a sharp increase at 85 m of advancement, peaking at 115 m, then sharply decreasing, reaching its lowest value at 135 m, after which it gradually increased. The stress data from the pressure cell 140 m from the cut hole showed a sharp increase at 120 m of advancement, peaking at 135 m, then sharply decreasing, and slowly decreasing after 150 m. The stress data from the pressure cell 160 m from the cut hole showed a stepwise decrease at 45 m of advancement, followed by a slow increase, peaking at 155 m, then sharply decreasing.
In summary, during the excavation of the 2-2 coal seam, the stress at the cut hole end of the coal pillar gradually increased as the working face advanced. After the initial collapse of the overlying strata, the rate of stress increase at the cut hole end slowed until the main fracture extended to the surface, causing significant surface subsidence, at which point the stress at the cut hole end suddenly decreased before slowly increasing again. The stress on the floor of the goaf suddenly decreased with the excavation of the coal seam, and as the overlying strata collapsed, the stress on the goaf floor exhibited a stepwise increase, with the increase in stress being similar to the weight of the collapsed strata. After significant surface subsidence occurred, the rate of stress increase on the goaf floor stabilized. During the excavation of the 3-1 coal seam, the stress on the floor of the goaf suddenly decreased with the excavation of the cmoal seam, and as the overlying strata collapsed, the stress on the goaf floor exhibited a stepwise increase, with the increase in stress being similar to the weight of the collapsed strata. After the collapse height of the strata penetrated the 2-2 coal goaf, the stress sensing values below the 2-2 coal seam decreased, indicating a significant pressure-relief effect of the lower coal seam on the upper coal seam.

4. Mining Overburden Damage Conduction Model

4.1. Construction of Overburden Damage Conduction Model

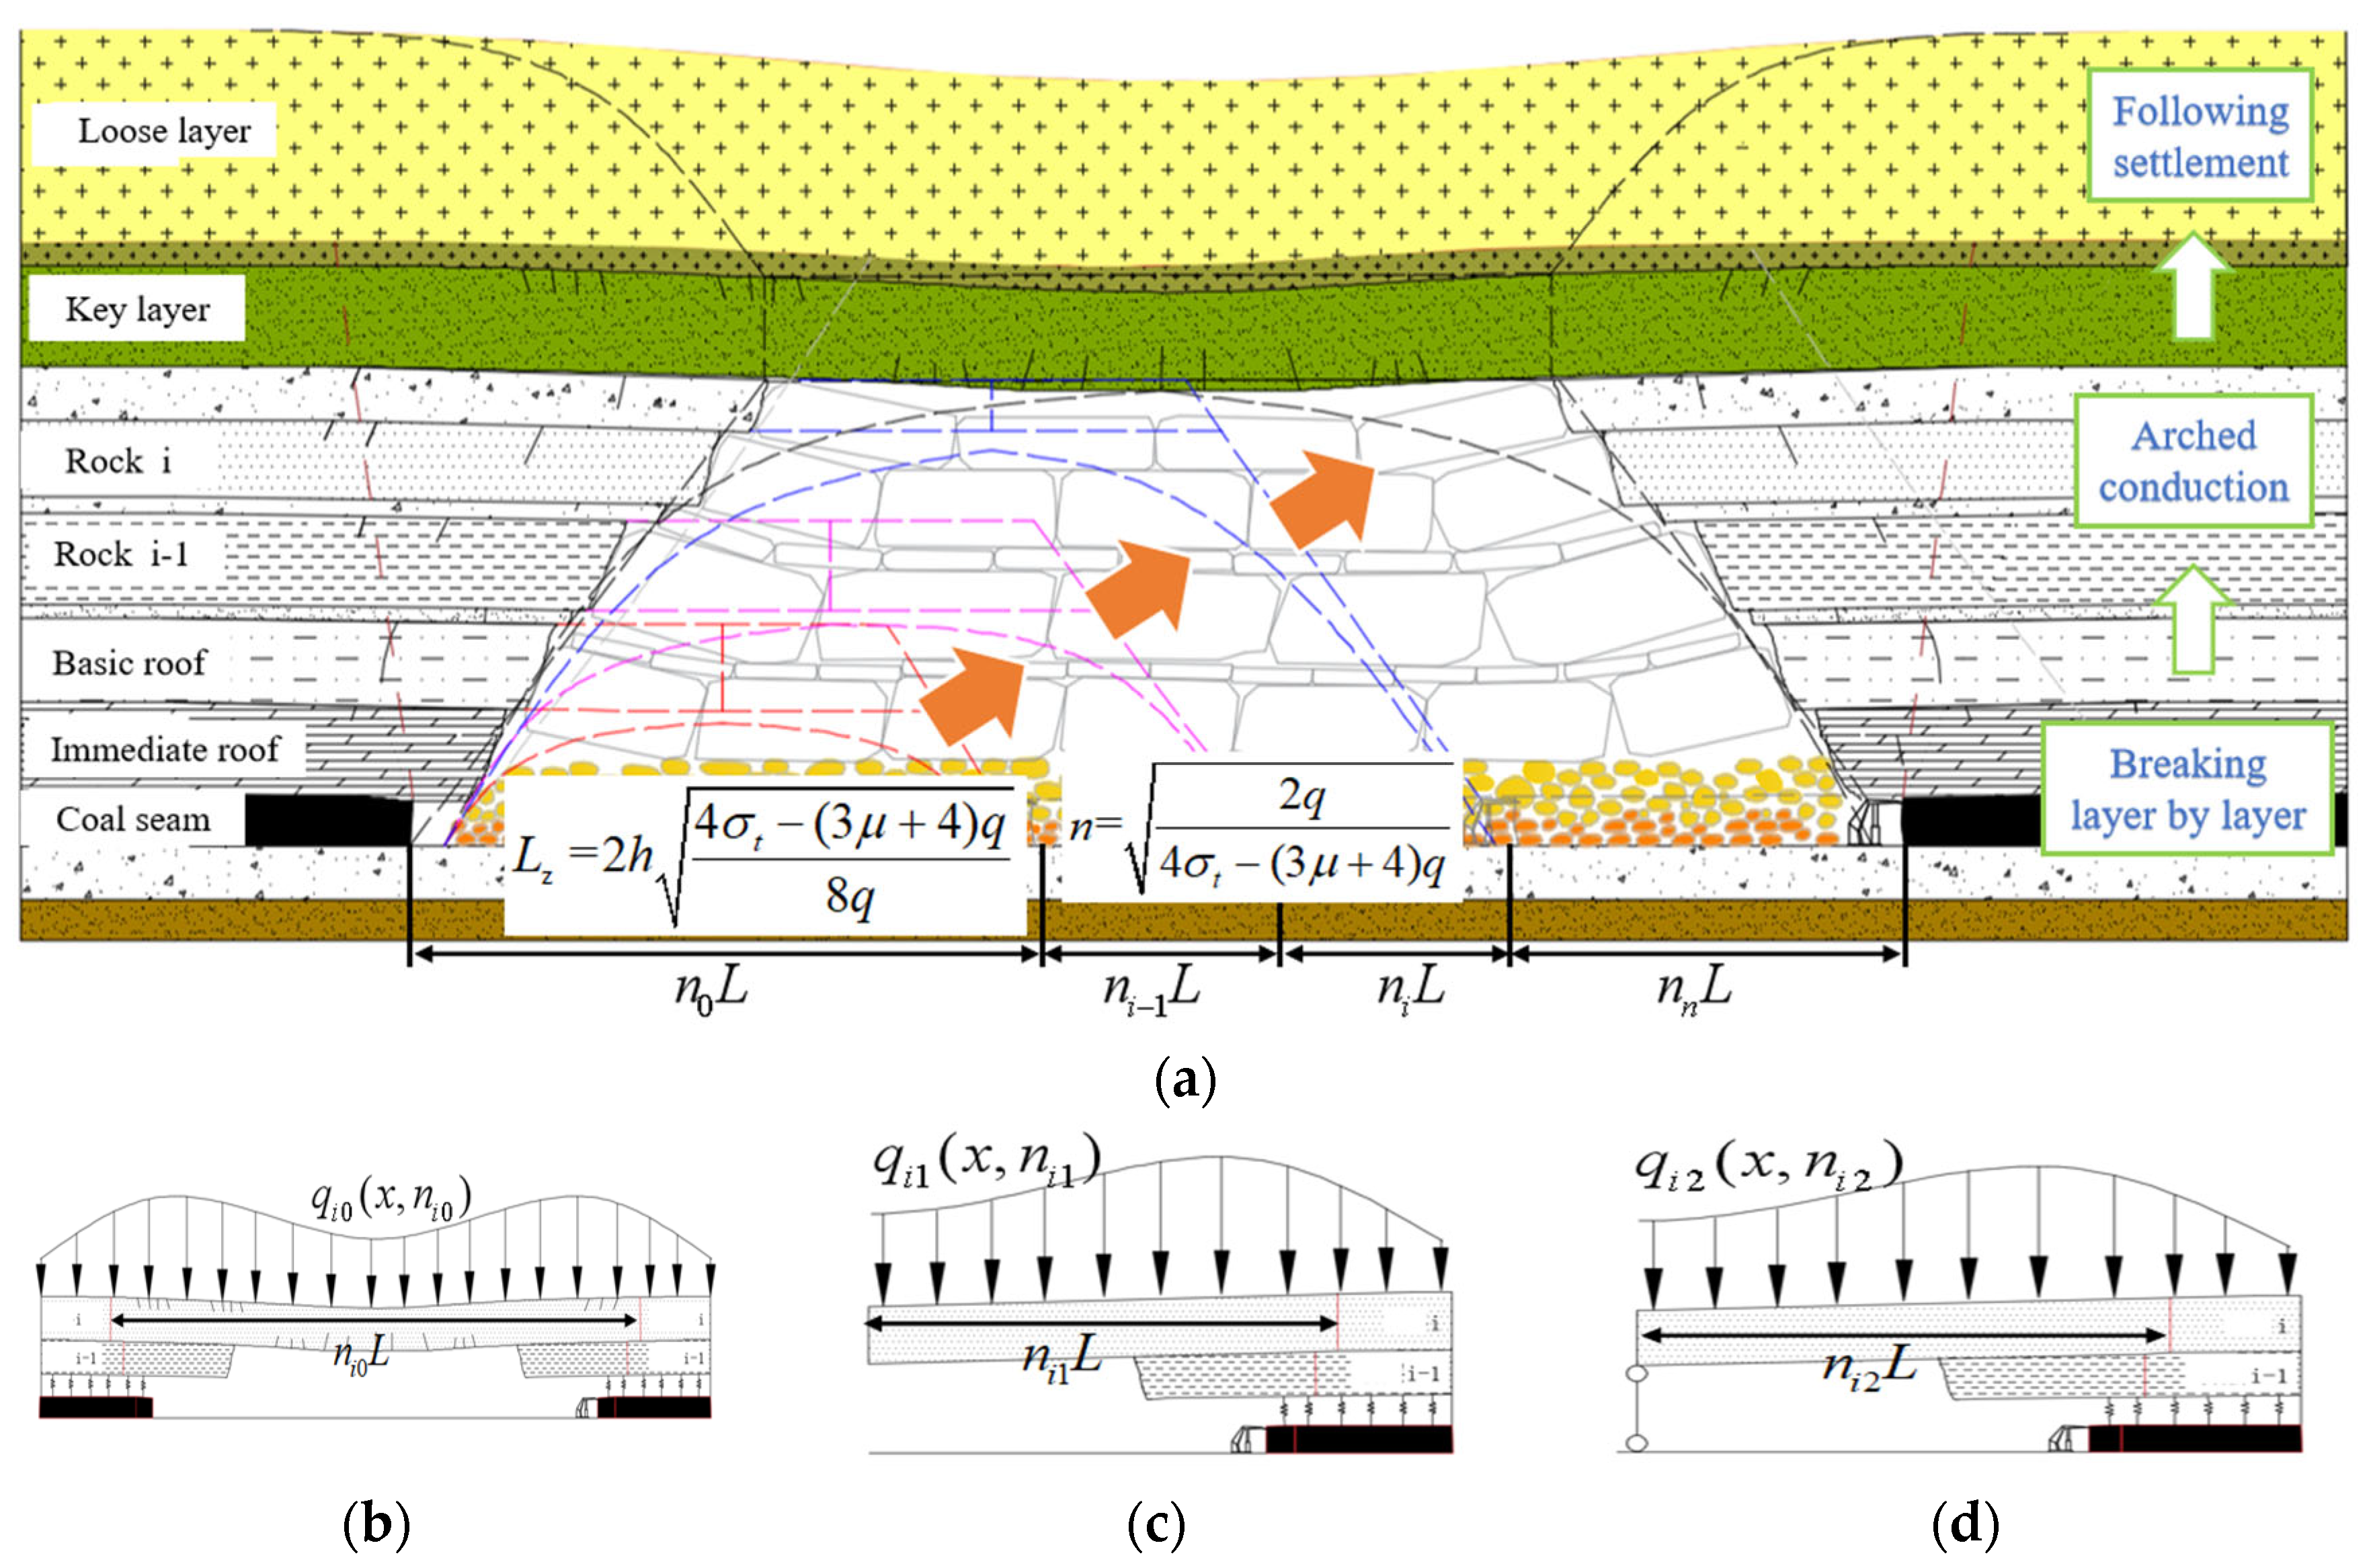
As coal seam extraction progresses, the mining space at the working face continuously expands, leading to the redistribution of stress in the overlying strata, deformation, fracturing, and movement of the rock layers, as well as surface subsidence and ecological damage in the mining area. Based on the results of the aforementioned similarity simulation experiments, it is observed that as the working face advances, the overlying strata undergo progressive fracturing. The main fractures extend outward in an arch shape from the intact rock mass above, with the basic roof and key strata fracturing at specific intervals. The fractures in the surface loose layer exhibit a corresponding relationship characterized by the “progressive fracturing of the overlying strata–arch-shaped extension–synchronous settlement of the loose layer.” This relationship is illustrated in the overburden–surface damage transmission model, as shown in Figure 8.
From the cut hole to the point before the fracture of the i-th layer of rock above the working face, the i-th layer of rock can be simplified as a beam structure fixed at both ends (Figure 8b). As the working face advances, when the tensile or shear stress within the i-th layer of rock reaches its failure limit, the i-th layer of the basic roof fractures, forming a cantilever beam structure (Figure 8c), resulting in the first weighting of the working face. With further advancement of the working face, the cantilever length of the i-th layer of rock increases. When the tensile or shear stress within the i-th layer of rock reaches the failure limit of the basic roof, the i-th layer of rock fractures again, leading to periodic weighting at the working face. If the advancement speed of the working face is sufficiently high, the free end of the cantilever beam structure may meet come into contact with the collapsed waste rock in the goaf, causing the i-th layer of rock to form a beam structure fixed at one end and simply supported at the other (Figure 8d). Similarly, the overlying key strata and sub-key strata above the basic roof undergo a process of ‘formation-failure-reformation’ of the fixed-end beam to cantilever beam structure. The stability-failure-stability of the overlying rock layers establishes a corresponding transmission relationship.

4.2. First Fracture Model of the i-th Stratum

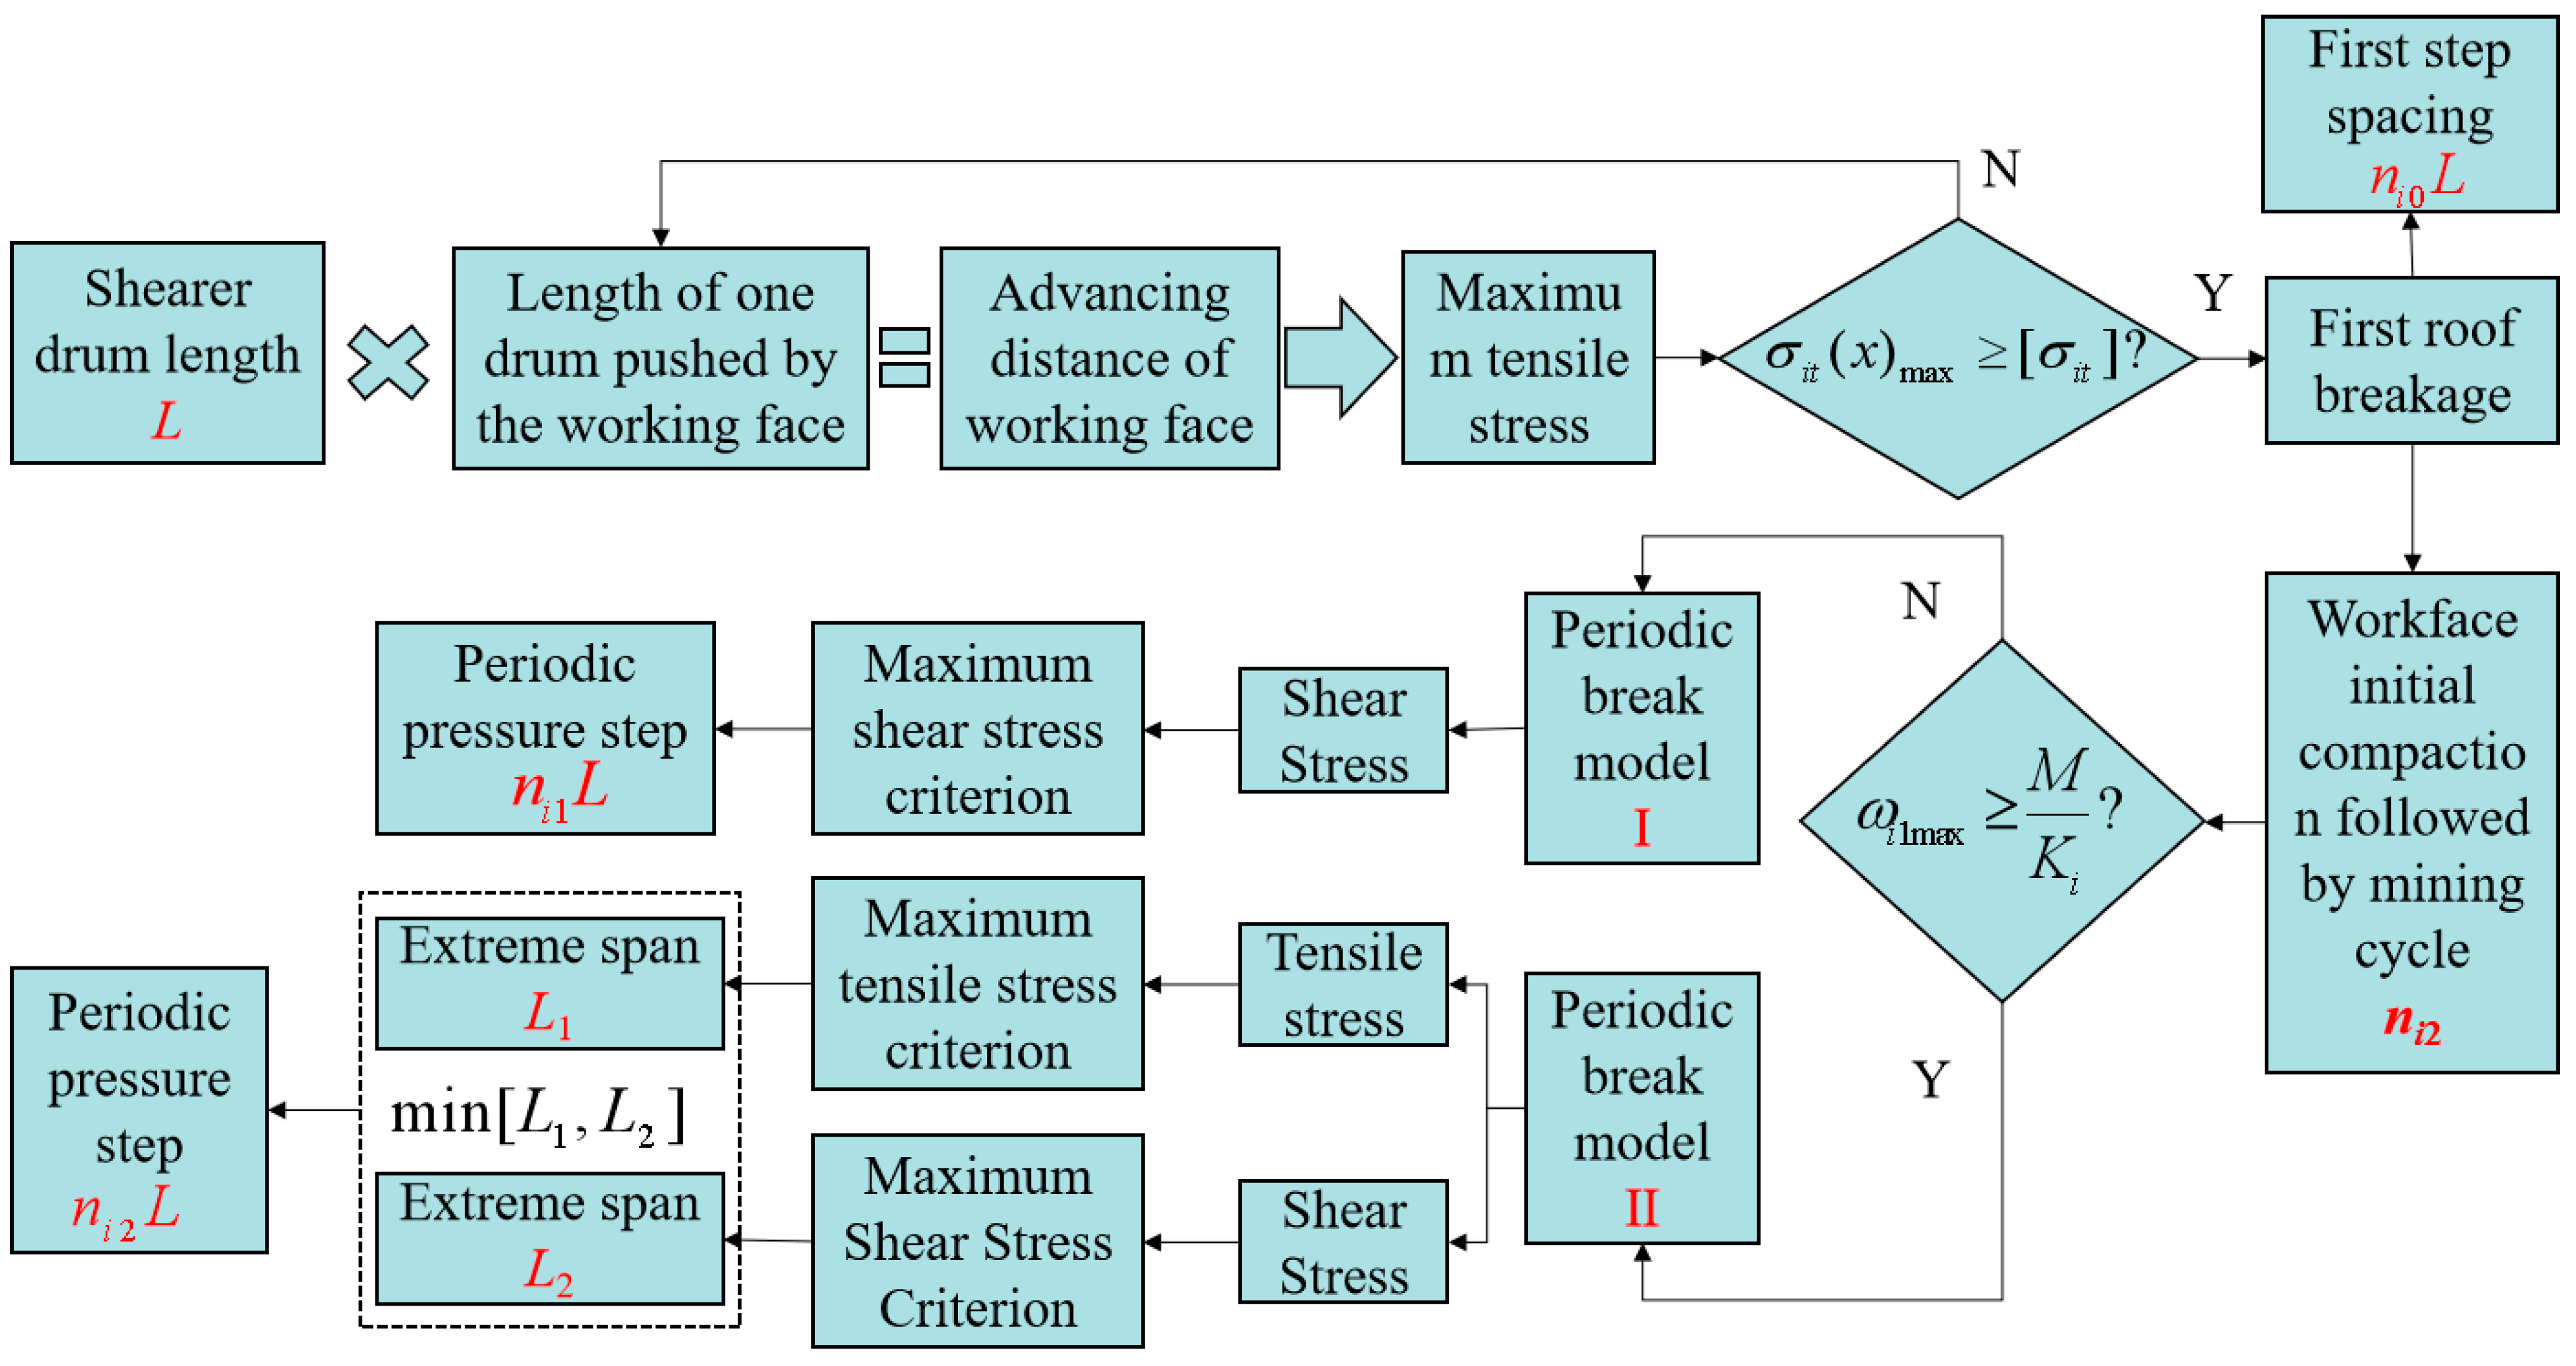
The product of the cutting depth of the drum (L) and the number of cycles (ni0) is used to represent the advancement length of the working face and establish the relationship between the advancement speed of the working face and the propagation of overburden failure. Prior to the initial fracture of the i-th layer of overburden, it can be simplified as a fixed-end beam (Figure 8b).
Considering the coal wall behind the cut hole as the coordinate origin and disregarding the influence of the advanced abutment pressure on the i-th layer, it is assumed that the deflection at the edge of the coal wall is zero. The deflection equation at any point can be derived based on the calculation method for fixed-end beams in material mechanics as follows [27]:
ω i 0 ( x ) = 1 E i I i 0 x 0 x 0 x q i 0 ( x , n i 0 ) x d x x 0 n i 0 L q i 0 ( x , n i 0 ) ( n i 0 L x n i 0 L ) d x d x d x
where ωi0 (x) represents the deflection at any point of the i-th rock layer before its initial fracture; L denotes the cutting depth of the drum at the working face; ni0 represents the number of working face cycles before the initial fracture of the i-th rock layer; qi0 (x,ni0) signifies the external load acting on the i-th rock layer before its initial fracture; Ei denotes the elastic modulus of the i-th rock layer; and Ii represents the moment of inertia of the i-th rock layer.
When the beam undergoes deflection in the normal direction, it experiences bending, and its neutral surface can be simplified as a curved line. Due to the fixed ends of the beam, the arc length in the axial direction exceeds the distance between the two fixed ends. As the span of the fixed-end beam increases, the internal stress within the beam becomes predominantly tensile [28]. Assuming only small deformations occur in the engineering structure during this stage, the tensile stress at any point of the fixed-end beam can be derived based on the arc length formula and the definition of linear elastic strain as follows:
σ i 0 t ( x ) = E i ( 1 + ω i 0 ( x ) 2 1 ) = E i 2 + 0 x 12 h i 3 0 x T d x d x 2 E i T = 0 x q i 0 ( x , n i 0 ) x d x x 0 n i 0 L q i 0 ( x , n i 0 ) ( n i 0 L x n i 0 L ) d x
where σi0t represents the tensile stress at any point within the i-th rock layer, and hi denotes the thickness of the i-th rock layer.
The load of rock layers mainly comes from the self-weight of the overlying rock layers and the constraint forces of adjacent rock masses. These forces exhibit a “continuous distribution” characteristic at the macroscopic scale: the overlying rock layers (such as sandstone and mudstone layers above coal seams) usually have stable thickness and lateral continuity. When their gravity is transmitted downward through the contact surface, it will be uniformly distributed on the bearing surface of the lower rock layers due to the integrity of the rock layers, rather than concentrated at a certain point; Even if there are local geological anomalies (such as interlayers and small cracks), from the macroscopic scale of engineering calculations (usually measured in meters), these local disturbances will be ‘averaged’ and the overall load can still be approximated as uniformly distributed.
When qi0 (x,ni0) is a uniformly distributed load, it can be treated as a constant. Under the action of a uniformly distributed load, the maximum deflection occurs at the midpoint of the beam, which can be expressed as follows:
ω i 0 max = q i 0 ( x , n i 0 ) ( n i 0 L ) 4 384 E i I i
The maximum tensile stress is given by
σ t ( x ) = E i ( 1 + q i 0 ( x , n i 0 ) 12 h 3 0 x 0 x 0 x x d x x 0 n i 0 L ( n i 0 L x n i 0 L ) d x d x d x 2 1 ) σ t ( x ) = E i ( 1 + q i 0 ( x , n i 0 ) x 4 2 2 ( n i 0 L ) 4 + ( n i 0 L ) 4 h 3 2 1 )

4.3. Periodic Fracture Model of the i-th Stratum-I

After the initial fracture of the i-th rock layer, as the working face advances, the i-th rock layer will forms a cantilever beam structure (Figure 8c). Considering the coal wall ahead of the working face as the coordinate origin, and neglecting the influence of the advanced abutment pressure on the fixed support point of the i-th layer, it is assumed that the deflection at the edge of the coal wall is zero. Based on the principles of material mechanics for cantilever beams, the deflection equation at any point can be derived as follows:
ω i 1 ( x ) = 1 E i I i 0 x 0 x 0 n i 1 L q i 1 ( x , n i 1 ) ( n i 1 L x ) d x d x d x
where ωi1 (x) represents the deflection at any point before the periodic fracture of the i-th layer, and ni1 denotes the number of working face cycles after the initial fracture of the i-th rock layer.
When qi1 (x,ni1) is a uniformly distributed load, the deflection equation at any point can be expressed as follows:
ω i 1 ( x ) = q i 1 ( x , n i 1 ) 24 E i I i [ 6 ( n i 1 L ) 2 x 2 4 ( n i 1 L ) x 3 + x 4 ]
Equation (6) shows that the deflection of the i-th rock beam reaches its maximum at the cantilever edge, which can be expressed as
ω i 1 max = q i 1 ( x , n i 1 ) ( n i 1 L ) 4 8 E i I i

4.4. Periodic Fracture Model of the i-th Stratum-II

Following the initial fracture of the i-th rock layer, as the working face advances, the i-th rock layer develops a cantilever beam structure (Figure 8c). When the advancing speed of the working face reaches a certain threshold, the i-th rock layer transitions into a structure characterized by one fixed end and one simply supported end (Figure 8d). The fundamental conditions for the formation of this structure are as follows:
ω i 1 max = 1 E i I i 0 x 0 x 0 n i 1 L q i 1 ( x , n i 1 ) ( n i 1 L x ) d x d x d x M K i
where, ωi1max represents the maximum deflection at any point before the periodic fracture of the i-th layer, M denotes the mining height of the working face, and Ki represents the average bulking coefficient of the rock layers below the i-th layer.
When the load is uniformly distributed, the deflection equation at any point for the structure with one fixed end and one simply supported end can be calculated based on the principles of combined deformation and superposition in material mechanics [26], as follows:
ω i 2 ( x ) = 1 E i I i 0 x 0 x 3 8 q i 2 ( x , n i 2 ) n i 2 L 3 E i I i M n i 2 L K i d x d x T 1 = ( n i 2 L x ) 1 2 q i 2 ( x , n i 2 ) ( n i 2 L x ) 2
The shear stress at any given point can be expressed as
τ i 2 = 3 8 q i 2 ( x , n i 2 ) ( n i 2 L ) 3 E i I i M ( n i 2 L ) 3 K i q i 2 ( x , n i 2 ) ( n i 2 L x )
The maximum tensile stress of this structure occurs at x = n i 2 L 3 q i 2 ( x , n i 2 ) ( n i 2 L ) 4 K i 12 E i I i M 4 q i 2 ( x , n i 2 ) ( n i 2 L ) 3 K i , and the corresponding maximum tensile stress is expressed as follows:
σ i 2 ( x ) max = 3 8 q i 2 ( x , n i 2 ) ( n i 2 L ) 3 E i I i M ( n i 2 L ) 3 K i 2 / 2 q i 2 ( x , n i 2 )

4.5. Criteria for Rock and Surface Fracture and Conduction

Prior to the initial fracture of the i-th rock layer, the rock layer can be simplified as a beam fixed at both ends, undergoing bending and tensile deformation. Given that rock is a brittle material with tensile strength significantly lower than its shear strength, failure is predominantly governed by tensile failure. Therefore, the adopted maximum tensile stress criterion is the yield criterion for roof failure. Following the initial fracture of the i-th rock layer, as the working face continues to advance, the mechanical structure of the i-th roof transitions from a beam fixed at both ends to a cantilever beam structure. Due to the presence of a free end, the i-th roof primarily undergoes bending deformation, and failure is dominated by shear failure. Consequently, the maximum shear stress criterion is employed as the yield criterion for roof failure. When the advancing speed of the working face reaches a certain level, the free end of the cantilever beam meets the collapsed rock layer below, transforming the structure from a cantilever beam to a beam fixed at one end and free at the other. The i-th rock layer experiences both bending and tensile deformation, with localized tensile and shear stress concentrations becoming the primary factors leading to rock failure. Therefore, the adopted combined criterion of maximum tensile stress and maximum shear stress is the yield criterion for roof failure, as illustrated in Figure 9.

5. Engineering Verification

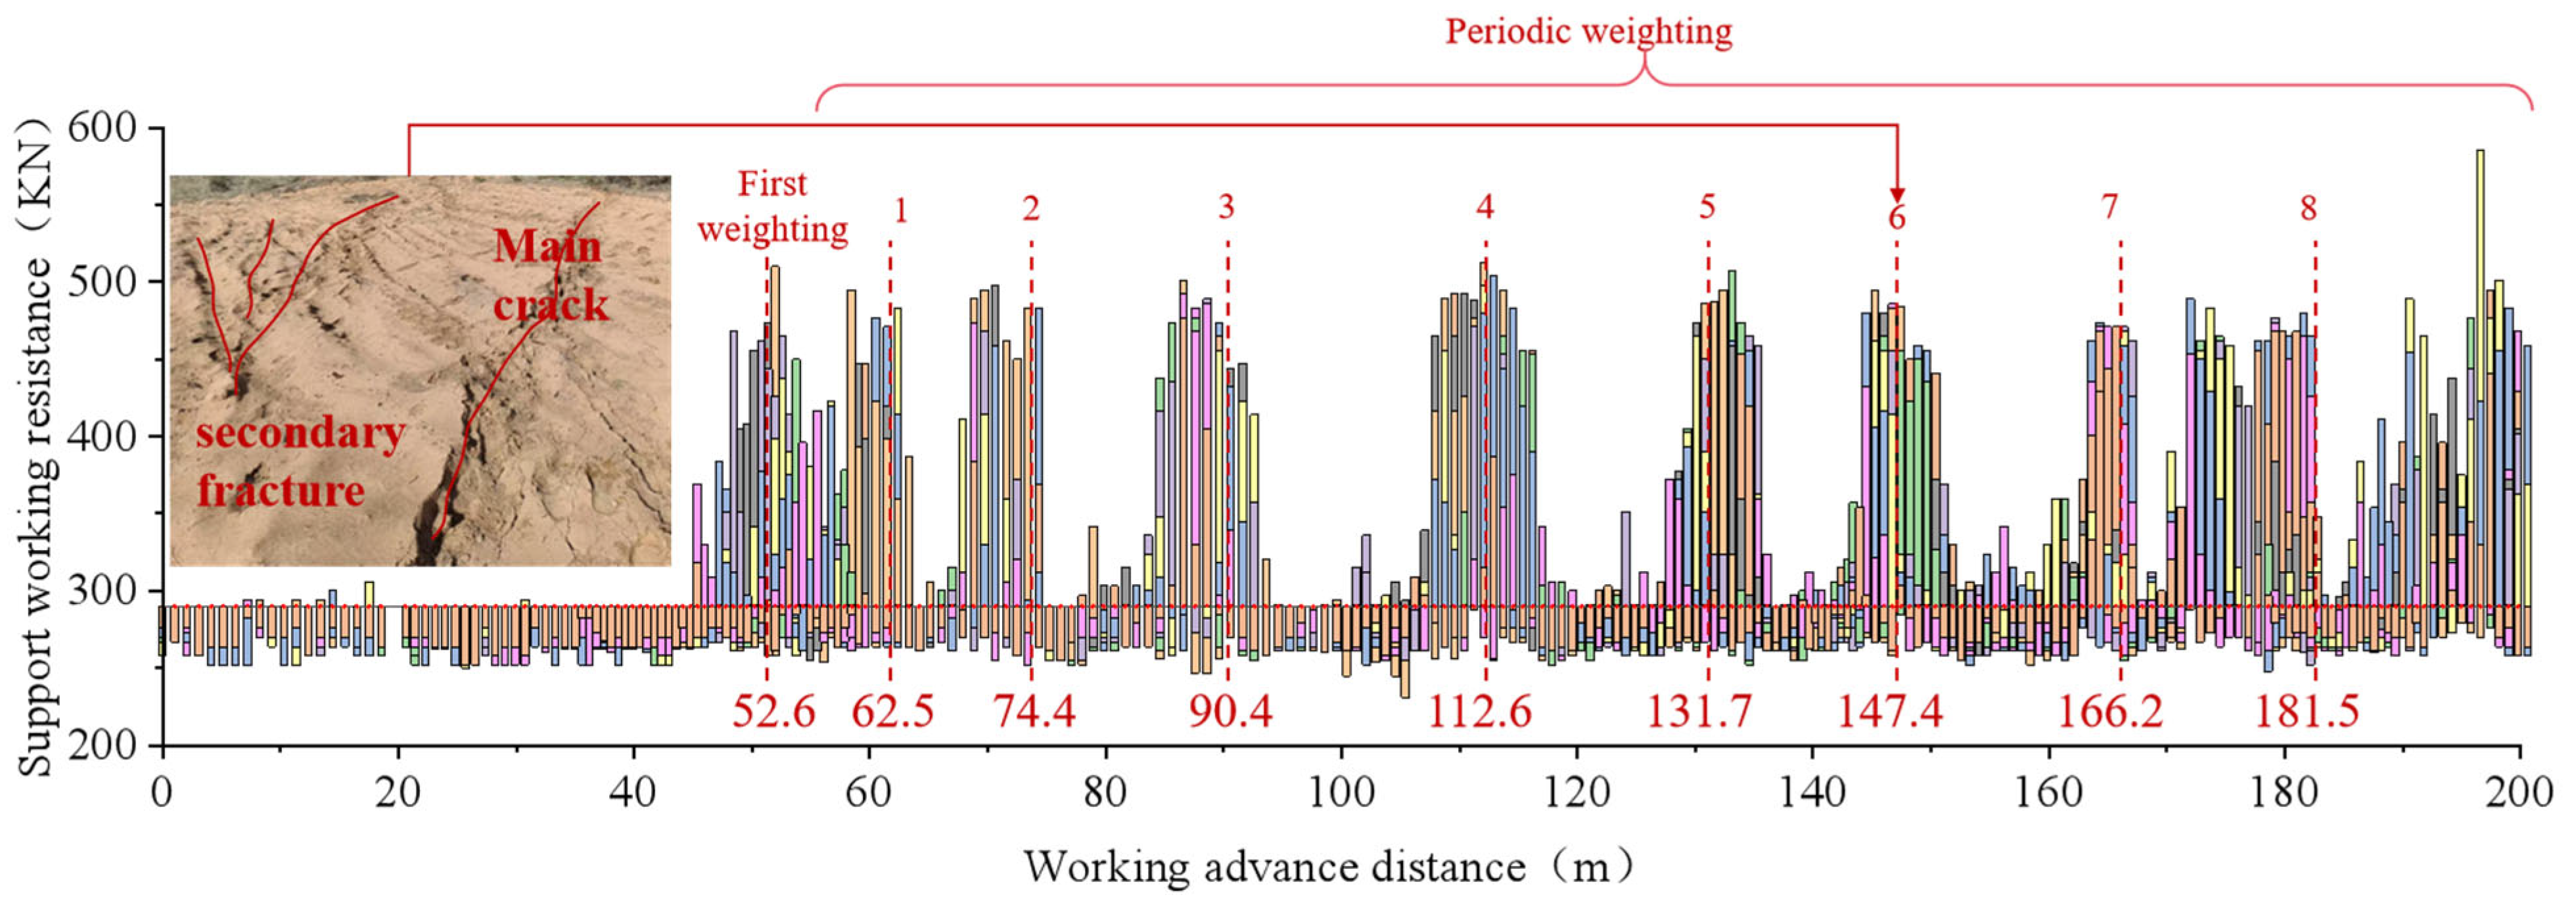
The surface movement and deformation characteristics during the mining process of the 31,305 working face in the Shigetai Coal Mine were collected and analyzed to validate the accuracy of the above-presented numerical simulation experiments and theoretical models. When the working face advanced to 50.5 m, surface movement and deformation began to occur. As the working face advanced to 76 m, the surface deformation entered an active phase, characterized by a subsidence rate exceeding 1.67 mm/day. Upon reaching approximately 150 m of advancement, a main fracture formed on the surface, transversely crossing the working face and resulting in significant subsidence. Additionally, the working resistance of the hydraulic supports at the 31,305 working face was monitored, along with the occurrence of the first and periodic roof weighting events, as illustrated in Figure 10.
As illustrated in Figure 10, the first roof weighting of the main roof occurred when the working face advanced to 52.6 m. Subsequently, the first to eighth periodic roof weightings were observed at 62.5, 74.4, 90.4, 112.6, 131.7, 147.4, 166.2, and 181.5, respectively; the corresponding advancement distances for each periodic weighting were 4.8, 5.6, 6.4, 8.8, 7.2, 7.2, 4.8, and 12 m, while the intervals between periodic weightings were 5.6, 4.8, 8, 13.6, 12.8, 11.2, 13.6, and 4 m, respectively.
In the numerical simulation experiments, the caving distance of the immediate roof was approximately 50 m, which is consistent with the initial weighting step distance derived from the working resistance of the hydraulic supports at the 31,305 working face. When the 3-1 coal seam was excavated to 145 m, a large through-going main fracture formed on the surface, accompanied by significant subsidence, aligning closely with the timing of surface fracture development. These findings demonstrate that the physical similarity simulation accurately reflects the movement processes of the overlying strata and surface, thereby validating the accuracy of the three proposed beam equilibrium structural models proposed for the overlying strata.

6. Discussion

Although this article has conducted research on the basic laws of overburden damage conduction and stress evolution in shallow coal seam mining, there is still room for expansion in terms of adaptability to complex geological conditions, multi field coupling mechanisms, and technological intelligence. In the future, we will focus on exploring the specific impacts of rock movement laws, crack development characteristics, and stress evolution mechanisms on surface ecological restoration and aquifer safety. We will analyze their mechanisms from the aspects of rock mass movement and crack development, and propose targeted protection strategies. In response to the limitations of the current model in deep high stress, steeply inclined coal seams, and multi fault development areas, insufficient consideration has been given to parameters such as rock dip angle, rock thickness, interlayer spacing, time effects, and geological structure. Future research will further analyze relevant parameters and optimize the existing model.
Existing research mostly focuses on the damage mechanism of single coal seam mining, while the synergistic effect of “upper layer mining residual damage and lower layer new disturbance” in shallow buried multi coal seam mining is not yet clear. In the future, a quantitative correlation model of ‘interlayer distance mining sequence damage superposition degree’ needs to be established. The coupling effect of “stress field fracture field seepage field surface deformation field” in shallow buried multi seam mining is the core driving force for cross layer transmission of damage, and it is necessary to break through the limitations of existing macroscopic analysis. The damage propagation in shallow buried multi seam mining has significant time effects (such as lagging cracks several years after mining), and existing research has insufficient attention to long-term evolution laws; In response to the ecological vulnerability of shallow buried multi coal seam mining (such as water conservation requirements in western mining areas), it is necessary to strengthen the research on the intervention mechanism of damage reduction technology on damage transmission; Constructing a complete theoretical and technical system of “damage source identification transmission path tracking dynamic regulation” for shallow buried multi seam mining, providing scientific support for the safe and green development of multi seam resources in ecologically fragile areas in the western region.

7. Conclusions

(1) As the working face advances, the main fractures at both the face end and the open-off cut end continuously propagate upward, while the external intact rock mass gradually expands outward in an arch-shaped structure. The main fracture at the face end extends forward and upward stepwise with the advancement, whereas some of the main fractures in the central section gradually diminish or even disappear as surface subsidence progresses. The loose layer settles synchronously with the collapse of the key stratum, exhibiting a pattern of “overlying strata fracturing layer by layer, arch-shaped expansion, and synchronous settlement of the loose layer.”
(2) The stress in the coal pillar at the open-off cut end gradually increases as the working face advances. After the initial collapse of the overlying strata, the rate of stress increase in the coal pillar slows down. When the main fracture propagates to the surface and triggers significant subsidence, the stress in the coal pillar suddenly decreases, followed by a slow recovery. The stress in the floor of the goaf increases stepwise with the collapse of the overlying strata, with the increment being approximately equivalent to the weight of the collapsed rock layers. In multi-seam mining, the stress in the floor of the lower seam goaf also increases stepwise. When the collapse height of the lower seam connects with the upper seam, the stress in the upper seam goaf initially decreases and then slowly recovers, demonstrating a significant pressure relief effect.
(3) Three beam equilibrium structural models for the overlying strata were established using the maximum tensile stress and maximum shear stress yield strength criteria as stability criteria for the overlying strata structures. These models reveal the evolution of mining-induced damage characterized by the progressive fracturing and upward propagation of the overlying strata. Finally, the consistency between the physical similarity simulation results and the theoretical models was validated by analyzing the working resistance of the hydraulic supports during the mining of the 31,305 working face in the Shigetai Coal Mine.

Author Contributions

G.Z.: methodology, investigation, writing—original draft, conceptualization, formal analysis, and writing—review and editing; S.F.: methodology, investigation, writing—original draft, and conceptualization; Y.L.: writing—original draft, conceptualization, formal analysis, and funding acquisition; M.C.: writing—original draft, conceptualization, and formal analysis; X.Z.: writing—original draft, conceptualization, and formal analysis. All authors have read and agreed to the published version of the manuscript.

Funding

This research was funded by the Special Funds Program for Basic Research Operating Expenses of China Academy of Safety Science and Technology grant number [2025JBKY02], the National Natural Science Foundation of China grant number [52374139], and National Science and Technology Major Project grant number [2024ZD1004505]. The APC was funded by [2025JBKY02].

Data Availability Statement

The datasets presented in this article are not readily available because the data are part of an on-going study. Requests to access the datasets should be directed to the corresponding author.

Conflicts of Interest

The authors declare no conflicts of interest.

References

  1. Ministry of Natural Resources, PRC. China Mineral Resources 2024; PRC: Beijing, China, 2024. [Google Scholar]
  2. Wang, S.; Liu, L.; Zhu, M.; Shen, Y.; Shi, Q.; Sun, Q.; Fang, Z.; Ruan, S.; He, W.; Yang, P.; et al. New way for green and low-carbon development of coal industry under the target of “daul-carbon”. J. China Coal Soc. 2024, 49, 152–171. [Google Scholar] [CrossRef]
  3. Li, Q.; Li, L.; Fang, J.; Guo, J.; Li, J.; Xu, Z.; Li, X. Ecological protection coal mining technology system and engineering practice. Coal Sci. Technol. 2024, 52, 28–37. [Google Scholar] [CrossRef]
  4. Li, Q. Reduction theory and technical system of underground coal mining. J. China Coal Soc. 2024, 49, 988–1002. [Google Scholar] [CrossRef]
  5. Li, Q.; Guo, J.; Zhang, K.; Yan, Y.; Zhang, C.; Xu, Z. Damage conduction mechanism and key technology of damage reduction in source for intensive coal mining in western China. J. China Coal Soc. 2021, 46, 3636–3644. [Google Scholar] [CrossRef]
  6. Li, Q.; Zhang, C. Damage conduction model of high intensity mining in western mining area based on conservation of mining space and its application. J. Min. Saf. Eng. 2021, 38, 1–8. [Google Scholar] [CrossRef]
  7. Zhang, G.; Li, Q.; Zhang, Y.; Du, F. Failure characteristics of roof in working face end based on stress evolution of goaf. Geomech. Geophys. Geo-Energy Geo-Resour. 2021, 7, 53. [Google Scholar] [CrossRef]
  8. Zhang, G.; Li, Q.; Xu, Z.; Zhang, Y. Roof fractures of near-vertical and extremely thick coal seams in horizontally grouped top-coal drawing method based on the theory of a thin plate. Sustainability 2022, 14, 10285. [Google Scholar] [CrossRef]
  9. Huang, Q.; Wang, X.; He, Y.; Li, K.; Li, J.; Liu, J.; Wang, S. Activated roof structure and support dynamic load in shallow-buried close coal seam mining. J. Min. Saf. Eng. 2022, 39, 857–866. [Google Scholar] [CrossRef]
  10. Zhou, J.L.; Huang, Q.X. Stability analysis of key structure structures of large mining height longwall face in shallow coal seam. Chin. J. Rock Mech. Eng. 2019, 38, 1396–1407. [Google Scholar] [CrossRef]
  11. Huang, Q.X.; Zhao, M.Y.; Huang, K.J. Study of roof double key strata structure and support resistance of shallow coal seams group mining. J. China Univ. Min. Technol. 2019, 48, 71–77+86. [Google Scholar] [CrossRef]
  12. Huang, K.; Huang, Q.; Wang, S.; Deng, Z.; Zhao, M. Research on roof structure and support resistance during periodic weighting in shallow group coal seams mining face. J. China Coal Soc. 2018, 43, 2687–2693. [Google Scholar] [CrossRef]
  13. Huang, Q.; Han, J. Study on fracture evolution mechanism of shallow-buried close coal seam mining. J. Min. Saf. Eng. 2019, 36, 706–711. [Google Scholar] [CrossRef]
  14. Huang, Q.; Cao, J.; Du, J.; Li, X. Research on three-field evolution and rational coal pillar staggered distance in shallow buried closely spaced multi-seam mining. J. China Coal Soc. 2019, 44, 681–689. [Google Scholar] [CrossRef]
  15. Huang, Q.; Du, J.; Hou, E.; Yang, F. Research on overburden and ground surface cracks distribution and formation mechanism in shallow coal seams group mining. J. Min. Saf. Eng. 2019, 36, 7–15. [Google Scholar] [CrossRef]
  16. Xu, F.; Guo, W.; Wang, C. Research on surface subsidence law in high-intensity mining of shallow buried with thick coal seam. Coal Sci. Technol. 2023, 51, 11–20. [Google Scholar] [CrossRef]
  17. Guo, W.; Bai, E.; Zhao, G. Current status and progress on overburden and surface damage and prevention technology of high-intensity mining. J. China Coal Soc. 2020, 45, 509–523. [Google Scholar] [CrossRef]
  18. Yang, D.; Guo, W.; Tan, Y.; Wang, Y.; Ma, X.; Li, Z. Lithology and fissure characteristics of overburden in high-intensity mining. J. China Coal Soc. 2019, 44, 786–795. [Google Scholar] [CrossRef]
  19. Guo, W.; Bai, E.; Yang, D. Study on the technical characteristics and index of thick coal seam high-intensity mining in coalmine. J. China Coal Soc. 2018, 43, 2117–2125. [Google Scholar] [CrossRef]
  20. Liu, C.; Li, J.; Zhao, J.; Chen, Y.; Zhang, H.; Yu, X. Dynamic strata pressure mechanism and distribution characteristics of overburden air leakage fissures in the condition of shallow thick coal seam in gully area. J. Min. Saf. Eng. 2023, 40, 965–971. [Google Scholar] [CrossRef]
  21. Li, J.W.; Liu, C.Y.; Bu, Q.W. Spatio-temporal evolution of overburden fissures in shallow thick coal seam mining. J. Min. Saf. Eng. 2020, 37, 238–246. [Google Scholar] [CrossRef]
  22. Zhao, J.; Liu, C.; Li, J.; Wang, W. Three-dimensional geological modeling and surface damage in gully area due to shallow coal seam mining. J. Min. Saf. Eng. 2018, 35, 969–977. [Google Scholar] [CrossRef]
  23. Zhao, J.; Liu, C.; Li, J. Stress field distribution and strata behavior characteristicsin shallow thick coal seam mining in gully region. J. Min. Saf. Eng. 2018, 35, 742–750. [Google Scholar] [CrossRef]
  24. Xu, Z.; Li, Q.; Zhang, G.; Yang, Y.; Sun, C. Study on the feature of overlying rock failure and the height of water-conductingfracture zone after muli-seam coal mining in Shendong Mlining Areal. J. Min. Strat. Control Eng. 2023, 5, 063042. [Google Scholar]
  25. Lei, P.; Yang, H.; Yin, Z.; Shan, F. Ghost particle suppression multiplicative algebraic reconstruction technique for tomographic PIV. Exp. Fluids 2025, 66, 29. [Google Scholar] [CrossRef]
  26. Fan, J.; Guo, C.; Gong, S.; Zhao, G.; Luo, C. Investigation of the correlation between nozzle structure and particle motion during shot peening using the PIV method. Int. J. Adv. Manuf. Technol. 2024, 134, 4839–4850. [Google Scholar] [CrossRef]
  27. Timoshenko, S.; Goodier, J.N. Theory of Elasticity; McGraw-Hill Book Company, Inc.: New York, NY, USA, 1951. [Google Scholar]
  28. Zhang, G.; Zhang, Y. Immediate roof first fracture characteristics of soberest and extremely thick coal. J. China Coal Soc. 2018, 43, 1220–1229. [Google Scholar] [CrossRef]
Figure 1. Spatial location relationship of working faces 22,303 and 31,305.
Eng 06 00235 g001
Figure 2. Panoramic view of similarity material simulation test setup.
Eng 06 00235 g002
Figure 3. Sensor arrangement.
Eng 06 00235 g003
Figure 4. (af) Rock movement and main fissure distribution during excavation of 2-2 Coal (the green arrow in the figure represents the distribution of strata displacement vector obtained by PIV algorithm, and the yellow curve represents the main fracture contour).
Eng 06 00235 g004
Figure 5. (af) Rock movement and main fissure distribution during excavation of 3-1 coal (the green arrow in the figure denotes the distribution of strata displacement vector obtained by PIV algorithm, the yellow curve denotes the main fracture contour of 2-2 coal seam excavation, and the black curve denotes the new main fracture contour of 3-1 coal seam excavation).
Eng 06 00235 g005aEng 06 00235 g005b
Figure 6. Strain evolution laws for strain sensors.
Eng 06 00235 g006
Figure 7. Stress evolution law of soil pressure box stress sensors.
Eng 06 00235 g007
Figure 8. Schematic diagram and mechanical model of overburden and surface damage conduction. (a) Schematic diagram of damage conduction in overburden and surface. (b) First fracture model of the i-th stratum. (c) Periodic fracture model of the i-th stratum-I. (d) Periodic fracture model of the i-th stratum-II.
Eng 06 00235 g008
Figure 9. Guidelines for determining roof breakage and conduction.
Eng 06 00235 g009
Figure 10. Working resistance of the hydraulic support in the 31,305 working face.
Eng 06 00235 g010
Table 1. Histogram, physical and mechanical parameters of rock strata.
No.Rock StratumThickness
/m
Density
kg/m3
RQDTensile strength/MPaCompressive Strength/MPaModulus of Elasticity/GPaPoisson’s RatioCohesion/MPaFriction Angle/°
1Aeolian sand36.017200.000.000.720.010.300.0220.0
2Fine-grained sandstone2.9221970.191.8122.623.080.2610.7224.9
3Sandy mudstone 3.5230863.712.7034.012.890.2621.0621.8
4Fine-grained sandstone3.6221970.191.8122.623.080.2610.7224.9
5Medium-grained sandstone10.5210834.611.064.570.350.245.8127.6
6Siltstone4.9231388.922.7730.952.660.2911.6733.1
7Fine-grained sandstone3.0221970.191.8122.623.080.2610.7224.9
8Sandy-mudstone 3.4236861.934.2172.5614.010.2419.9925.9
9Siltstone2.6235350.113.6264.736.510.2423.8022.3
102-2 coal loading0.8127463.081.1724.751.990.2819.2524.5
11Siltstone3.5235350.113.6264.736.510.2423.8022.3
12Fine-grained sandstone2.8237053.432.5266.4111.650.2515.4830.9
13Medium-grained sandstone4.0229494.372.3834.477.420.2415.6828.7
14Sandy mudstone 3.9242161.535.2452.497.270.2018.9626.1
152-2 coal1.8127463.081.1724.751.990.2819.2524.5
16Sandy mudstone 2.2242161.535.2452.497.270.2018.9626.1
17Fine-grained sandstone11.3237053.432.5266.4111.650.2515.4830.9
18Siltstone12.1239069.006.6172.4110.850.2421.7828.9
19Sandy mudstone 2.5232661.175.0354.297.590.2124.3628.3
20Fine-grained sandstone8.6235574.985.6772.2313.080.3422.3931.8
21Sandy mudstone 3.4232661.175.0354.297.590.2124.3628.3
223-1 coal3.5127463.081.1724.751.990.2819.2524.5
23Sandy mudstone 3.1232661.175.0354.297.590.2124.3628.3
24Siltstone1.5241374.179.26101.7312.870.2535.6024.7
25Fine-grained sandstone1.1235951.765.6142.837.390.2830.9120.0
26Sandy mudstone 7.0239194.906.6681.6510.560.2527.7926.6
27Siltstone7.0248068.366.9189.0713.960.2728.9630.9
Table 2. Similarity ratios and proportioning schemes for each rock formation.
No.Rock StratumCompressive Strength
/MPa
Density
kg/m3
Density Similarity RatioStrength Similarity RatioSimilar Material Strength/kPaSand
/kg
Lime
/kg
Gypsum
/kg
Water
/kg
1Rock stratum0.7217201.0001007.200357.590.0032.5129.26
2Aeolian sand22.6222191.290129175.33327.932.441.052.36
3Fine grained sandstone34.0123081.342134253.45434.131.901.902.84
4sandy mudstone 22.6222191.290129175.33334.683.031.302.93
5Fine grained sandstone4.5721081.22612337.288101.1410.112.538.53
6Medium grained sandstone30.9523131.345134230.15147.792.652.653.98
7Siltstone22.6222191.290129175.33328.902.531.082.44
8Fine grained sandstone72.5623681.377138527.04132.752.052.052.76
9sandy mudstone 64.7323531.368137473.16425.041.571.572.11
10Siltstone24.7512740.74174334.1447.710.670.290.65
112-2 coal loading64.7323531.368137473.16433.712.112.112.84
12Siltstone66.4123701.378138481.96326.971.691.692.28
13Fine grained sandstone34.4722941.334133258.45039.012.172.173.25
14Medium grained sandstone52.4924211.408141372.91537.562.821.883.17
15sandy mudstone 24.7512740.74174334.14417.341.520.651.46
162-2 coal52.4924211.408141372.91521.191.591.061.79
17sandy mudstone 66.4123701.378138481.963108.846.806.809.18
18Fine grained sandstone72.4123901.390139521.110116.557.287.289.83
19Siltstone54.2923261.352135401.45724.081.811.202.03
20sandy mudstone 72.2323551.369137527.54082.845.185.186.99
21Fine grained sandstone54.2923261.352135401.45732.752.461.642.76
22sandy mudstone 24.7512740.74174334.14434.683.031.302.93
233-1 coal54.2923261.352135401.45729.862.241.492.52
24sandy mudstone 101.7324131.403140725.13714.221.021.021.22
25Siltstone42.8323591.372137312.28310.600.790.530.89
26Fine grained sandstone81.6523911.390139587.36167.421.696.745.69
27sandy mudstone 89.0724801.442144617.74466.374.744.745.69
Disclaimer/Publisher’s Note: The statements, opinions and data contained in all publications are solely those of the individual author(s) and contributor(s) and not of MDPI and/or the editor(s). MDPI and/or the editor(s) disclaim responsibility for any injury to people or property resulting from any ideas, methods, instructions or products referred to in the content.