1. Introduction
Unlike traditional Monofacial Photovoltaic (mPV) modules, Bifacial Photovoltaic (bPV) technology generates electricity on both sides of their solar cells, capturing direct and reflected sunlight from the surrounding environment, particularly in areas with high ground reflectivity [
1,
2]. This distinctive feature allowed bPV to be highly versatile, supporting integration into buildings (BIPV) [
3,
4], agricultural settings (agrivoltaics) [
5,
6], space projects [
7], floating systems on water bodies [
8,
9], vertical installations in rural or urban areas [
10,
11], and large-scale power plants [
12,
13]. As a result, bPV modules have become the new industry standard, meeting the demands of the rapidly growing solar market [
14].
According to [
15], bPV modules led the market in 2024 with about 64% and are expected to dominate by 2035, achieving a market share of 81%, while bifacial cells will represent 95% of the market, leaving only 5% for traditional mPV technology. The global bPV market was valued at USD 184.8 billion in 2024 and is estimated to grow at a compound annual growth rate (CAGR) of 9.2% from 2025 to 2034 [
14] with the most optimistic scenario projecting a growth of up to 18.7% to 2032 [
16]. The need for higher power in utility-scale projects, aimed at optimising the active module area, is expected to further accelerate bPV adoption [
14].
Furthermore, the Top Listing records of [
17], which quantifies the most efficient and powerful modules in the world market, demonstrate the dominance of bifacial technology among premium products: of the 50 most powerful and efficient modules of 32 manufacturers, 45 are bifacial. It seems that this technology has an open road to dominate the market because during calendar week 44 of 2024 [
18], the prices of monofacial and bifacial passivated emitter and rear cell (PERC) p-type modules converged approximately
USD/W, marking around these dates the lowest price ever recorded for photovoltaic (PV) modules.
Despite their growing prominence, market projections, historical price drop, and wide variety of manufacturers and module options, bPV manufacturers have left a notable gap in their product documentation on bifacial power capacity and energy yield. Firstly, perhaps for marketing reasons, no installation conditions are included for the estimation of the rear power, and only the front power is guaranteed with a general tolerance of +5%.
Furthermore, not all manufacturers report the energy gain of the rear side, and those that often do, present it with electrical gains in current and power as a constant percentage relative to the front side, while assuming a fixed open-circuit voltage (), an assumption that does not reflect real operating conditions. However, this proportional relationship lacks substantiation as manufacturers do not provide corroborating evidence such as rear-side I-V curves or comprehensive performance data that would validate these claimed proportional gains. Those external factors combined with limited information on optimal installation conditions make it difficult for end-users to make informed decisions. In addition, manufacturers’ installation manuals typically provide only conventional mechanical recommendations without geometric installation guidelines that would maximise the power output of these components. The absence of clear technical installation criteria further hinders the identification of the most suitable module for a given application, adding even more uncertainty to the selection process.
In recent years, bPV technology has been the subject of various and diverse experimental studies to validate this additional gain, related to installation sites, installation height, and reflective surfaces (albedos), all of which influence its electrical performance and cost effectiveness [
19], almost always compared to mPV technology. The gain reported in the production of bPV energy under special conditions is around 15%, but can reach 30–35% with the use of single-axis tracking systems [
20]. However, the gains cannot be generalised since the studies have been diverse in numbers of modules and positions, e.g., using a single module in general [
1,
21,
22,
23], using reflective materials on the floor [
24], in desert conditions [
25], passing through 6-module arrays on vertical trackers [
26] or arrays of 9 horizontal fixed modules [
27,
28], and arrays of 22 vertical modules with single tracker [
29].
Moreover, several studies [
27,
28,
29,
30] evaluated horizontally installed bPV modules to avoid row shading, but this orientation diverges from standard industry practices and may limit the representativeness of the results. Portrait installations use less material, require less space, and experience fewer soiling and structural issues. Additionally, the full-cell modules used in those studies are more vulnerable to shading losses due to their single-string configuration. In contrast, our use of half-cut modules combined with a carefully designed structure improves shading resilience and better reflects real-world performance, offering a key methodological advantage.
In addition, some other studies focus on isolated modules [
23,
24,
25]. As shown by [
31], subsequent irradiance in a central module within a 7-row array of 10 modules can receive up to 50% less radiation compared to single-module studies. Since real-world PV systems typically consist of multiple modules as in distributed generation facilities, measuring a central module in a three-module setup better reflects actual irradiance conditions and performance, resulting in more representative and reliable data.
Finally, very few studies take into account the entire preconditioning process of bPV modules before their evaluation of outdoor performance, and some others have focused on applying standardised measurement corrections. For example, [
26] used the IEC 60981 [
32] standard for this purpose, while [
33] conducted controlled laboratory experiments based on the standard draft IEC-TS 60904-1-2, and by testing a variety of configurations, the study concluded that the rear irradiance non-uniformity should be better accounted for.
The technical specification IEC TS 60904-1-2 [
34], which is the standard for this technology, suggests calculating the Maximum Bifacial Power
using a reference rear-irradiance of 135 W/m
2. However, this implies challenges for designers and installers, because rear irradiance is often not precisely known, and for that, adequate measurement equipment is frequently unavailable. Even when radiometers are used, accurate irradiance determination depends on several variables, since measurements must be taken at specific multiple points even for extended periods to achieve adequate accuracy and can become cost prohibitive. These can lead to overestimations or underestimations in system design. In addition, most meteorological stations do not measure albedo, adding further uncertainty. Irradiance also varies daily with seasonal changes and cloud cover, which affects the reflected irradiation data necessary to estimate bifacial performance. As a result, significant challenges remain in accurately simulating the performance of bifacial modules [
20].
In response to the urgent need to bridge the persistent divide between manufacturers’ information, theoretical potential, and industry demands, and adequately estimate the performance in the real-world environment of evolving bPV technologies, this study presents a well-structured and rigorous methodology for measuring the performance of the bPV module under indoor and outdoor conditions based on international standards with detailed empirical observation. Our objective is to determine the energy gain of bPV modules under specific geometric installation conditions, by measuring the instantaneous maximum power, and to compare this with theoretical estimates derived from mathematical models. Furthermore, verify whether these proposed models are suitable for accurately predicting the energy output of bPV systems deployed in geographic locations between and latitude.
The present study carefully integrates multiple layers of analysis, from preconditioning, laboratory parameter correction, and outdoor testing on a specific surface that varies in tilts and heights. The indoor evaluation encompassing from visual inspection to the verification of electrical parameters supplied by the manufacturers significantly strengthens the reliability of subsequent outdoor measurements. Through this systematic approach, the study not only scrutinises the manufacturer’s technical datasheet claims but also enriches the empirical understanding of bPV energy and power output in full-day cycles. This methodology provides practical insights for installers, bPV system designers, and researchers by offering a hands-on perspective that helps inform and optimise bPV configurations based on tangible field-validated data before exposing the bPV modules to real environments. The study stands out for its sophisticated instrumentation and strong emphasis on practical implementation, while the inclusion of a mathematical model further supports the analysis by enabling meaningful comparison between measured and estimated energy outputs.
4. Experimental Methodology
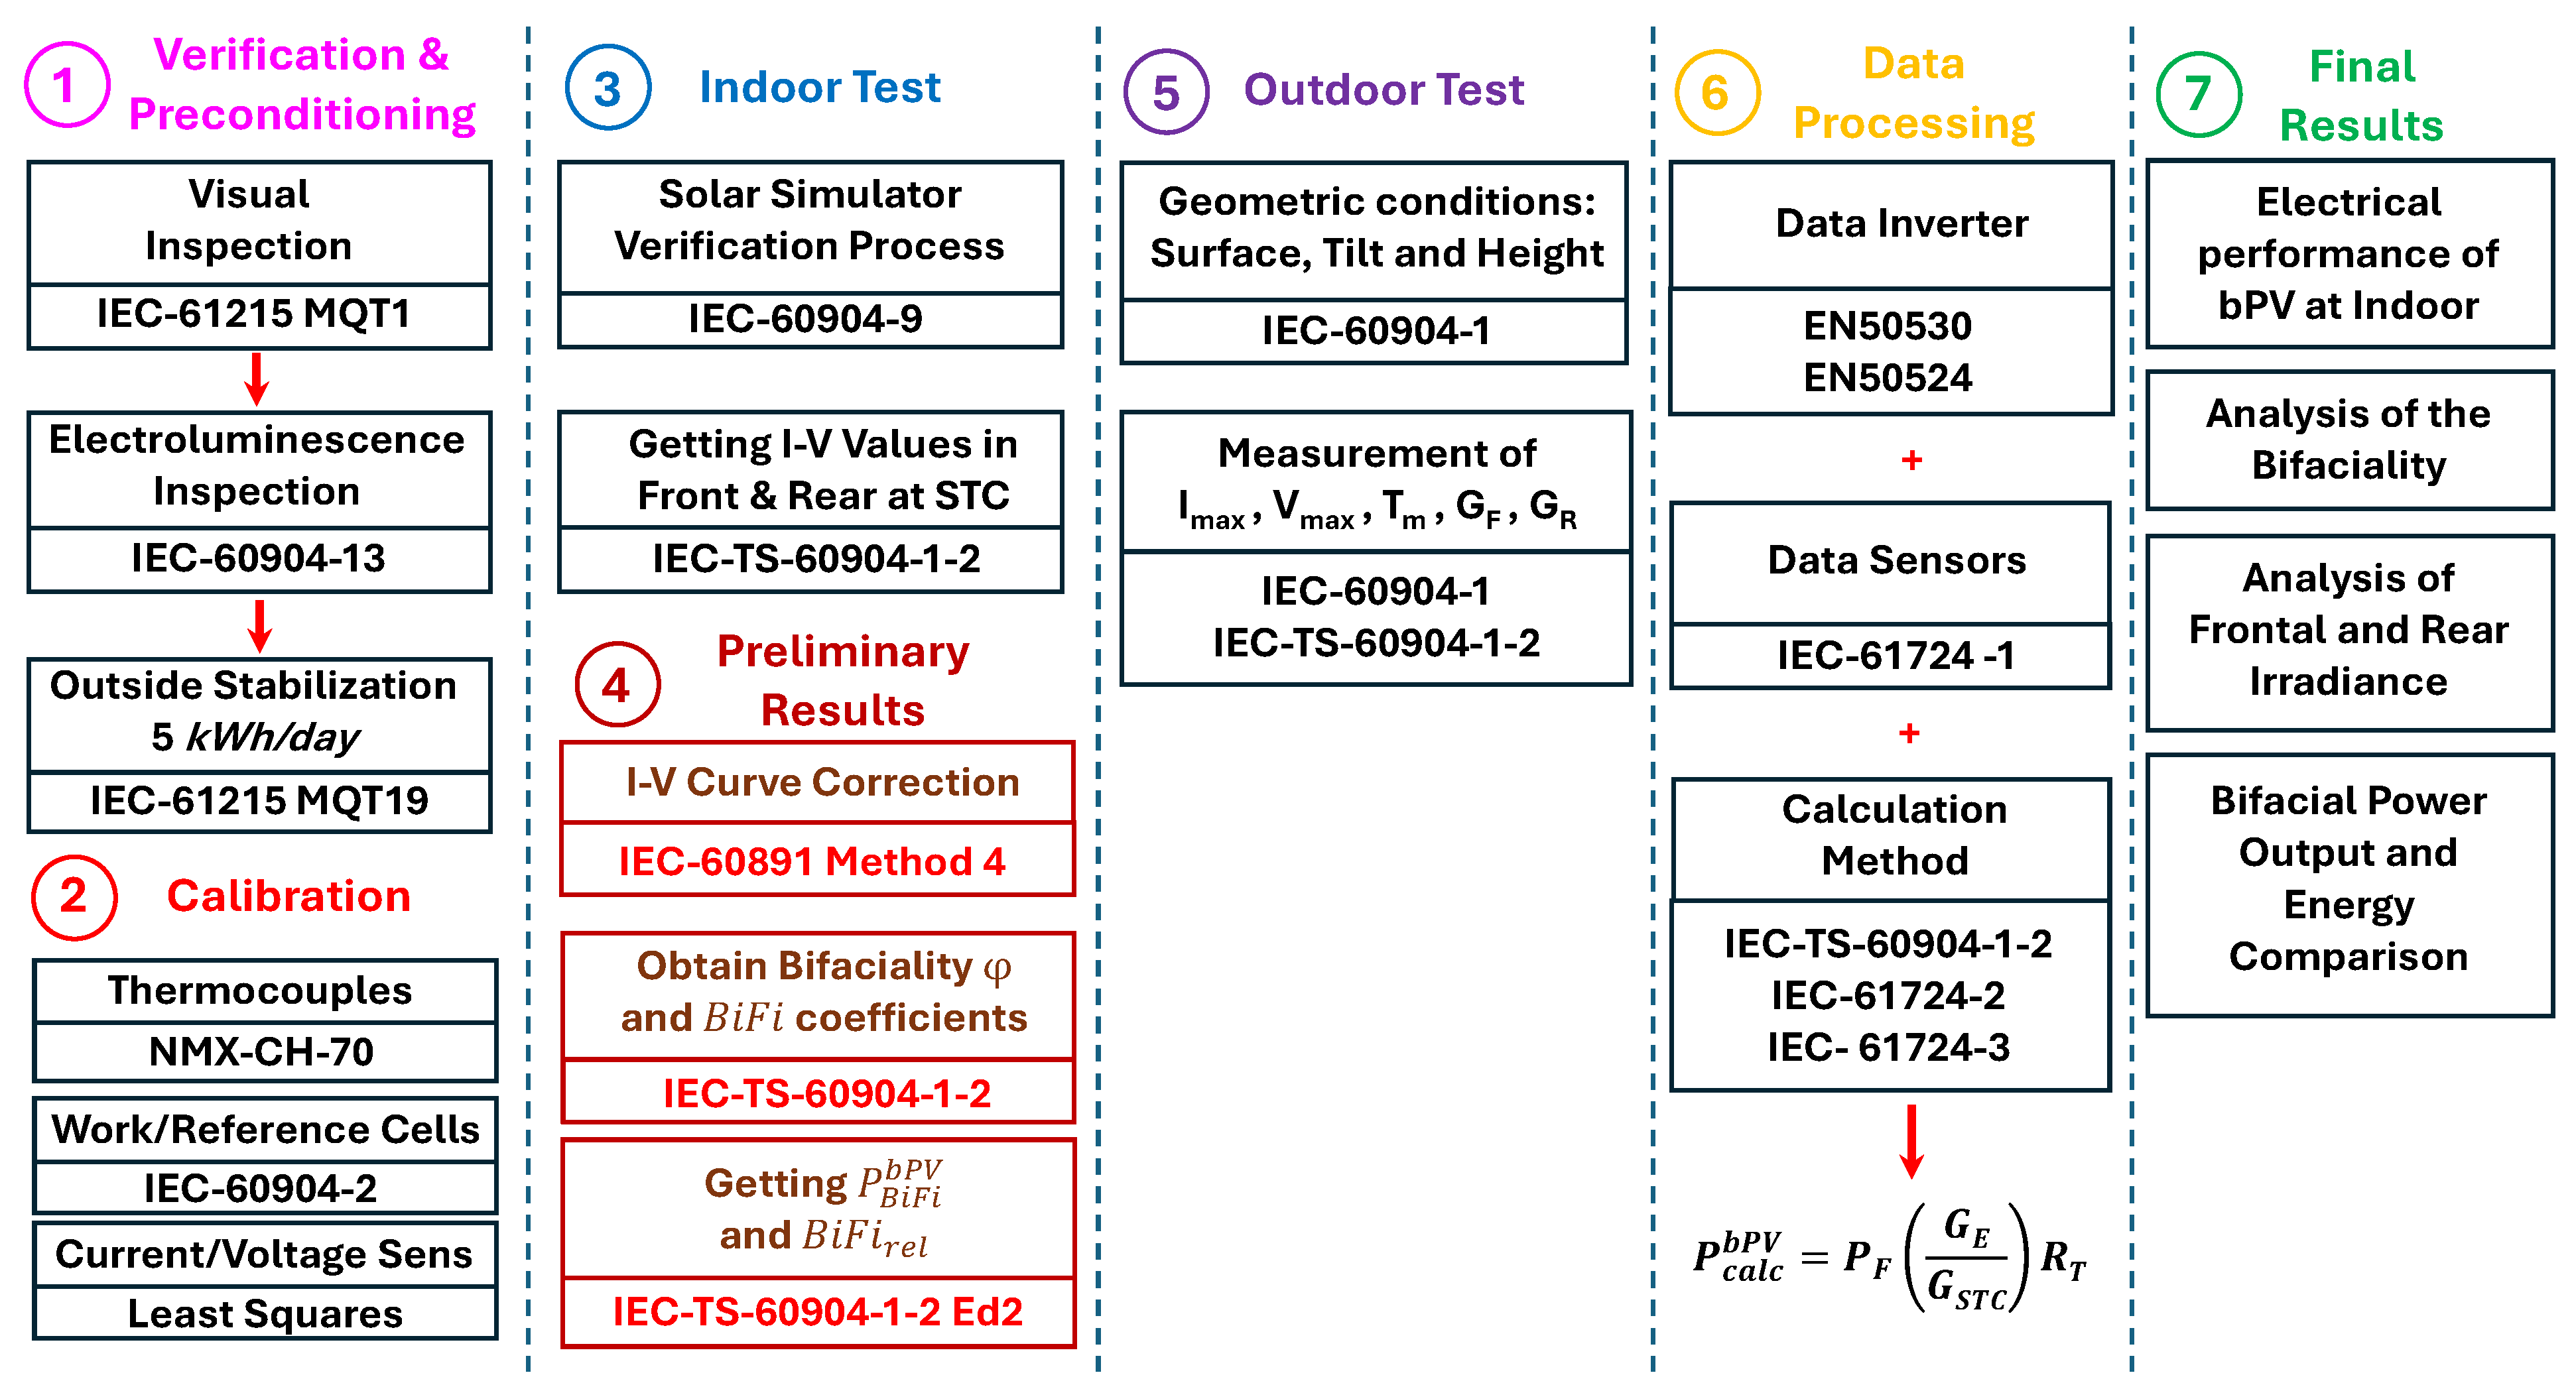
The experiments were achieved following sequential steps shown in
Figure 4.
Stage 1: To ensure the optimal performance of the PV modules during the testing, a three-step verification protocol was implemented upon receiving the modules. First, a cleaning process and a comprehensive visual inspection were performed to verify the physical integrity of the module, following the guidelines outlined in IEC 61215-1 [
43]. The protocol continues with an electroluminescence test according to IEC 60904-13 [
44]. The purpose of this test is to identify potential microcracks that are not detectable by the human eye. Third, the modules were preconditioned according to [
43] by being exposed to sunlight to receive an approximate cumulative energy of 10 kWh reached in two days for mPV, and four days for bPVs on both faces. Preconditioning helps to electrically stabilise the cell’s performance and mitigate potential degradation effects before rigorous testing or real conditions deployment. This step is crucial because initial exposure to light can cause changes in the electrical characteristics of the module, a phenomenon known as light-induced degradation (LID), particularly in technologies such as PERC and heterojunction technology (HJT), which are silicon materials commonly used in bPV modules.
After the cell calibration process, the thermocouples and sensors in stage 2, indoor tests were carried out in stage 3. In this step, the power of light in the solar simulator must be verified by comparison with a previously calibrated solar reference module. The bifaciality coefficients of the modules and I-V curve for both sides were measured according to the bifacial standard [
34]. These tests were implemented under STC conditions in the solar simulator. The data collected from I-V curves were adjusted and corrected for each side of the module to STC, based on the standard IEC 60891:2022 Method 4 [
32]. The results obtained (stage 4) for the indoor test measurements allow us to determine the ideality factor, the series resistance (
), and the bifaciality factors (
) for the current (I), voltage (V) and power (P).
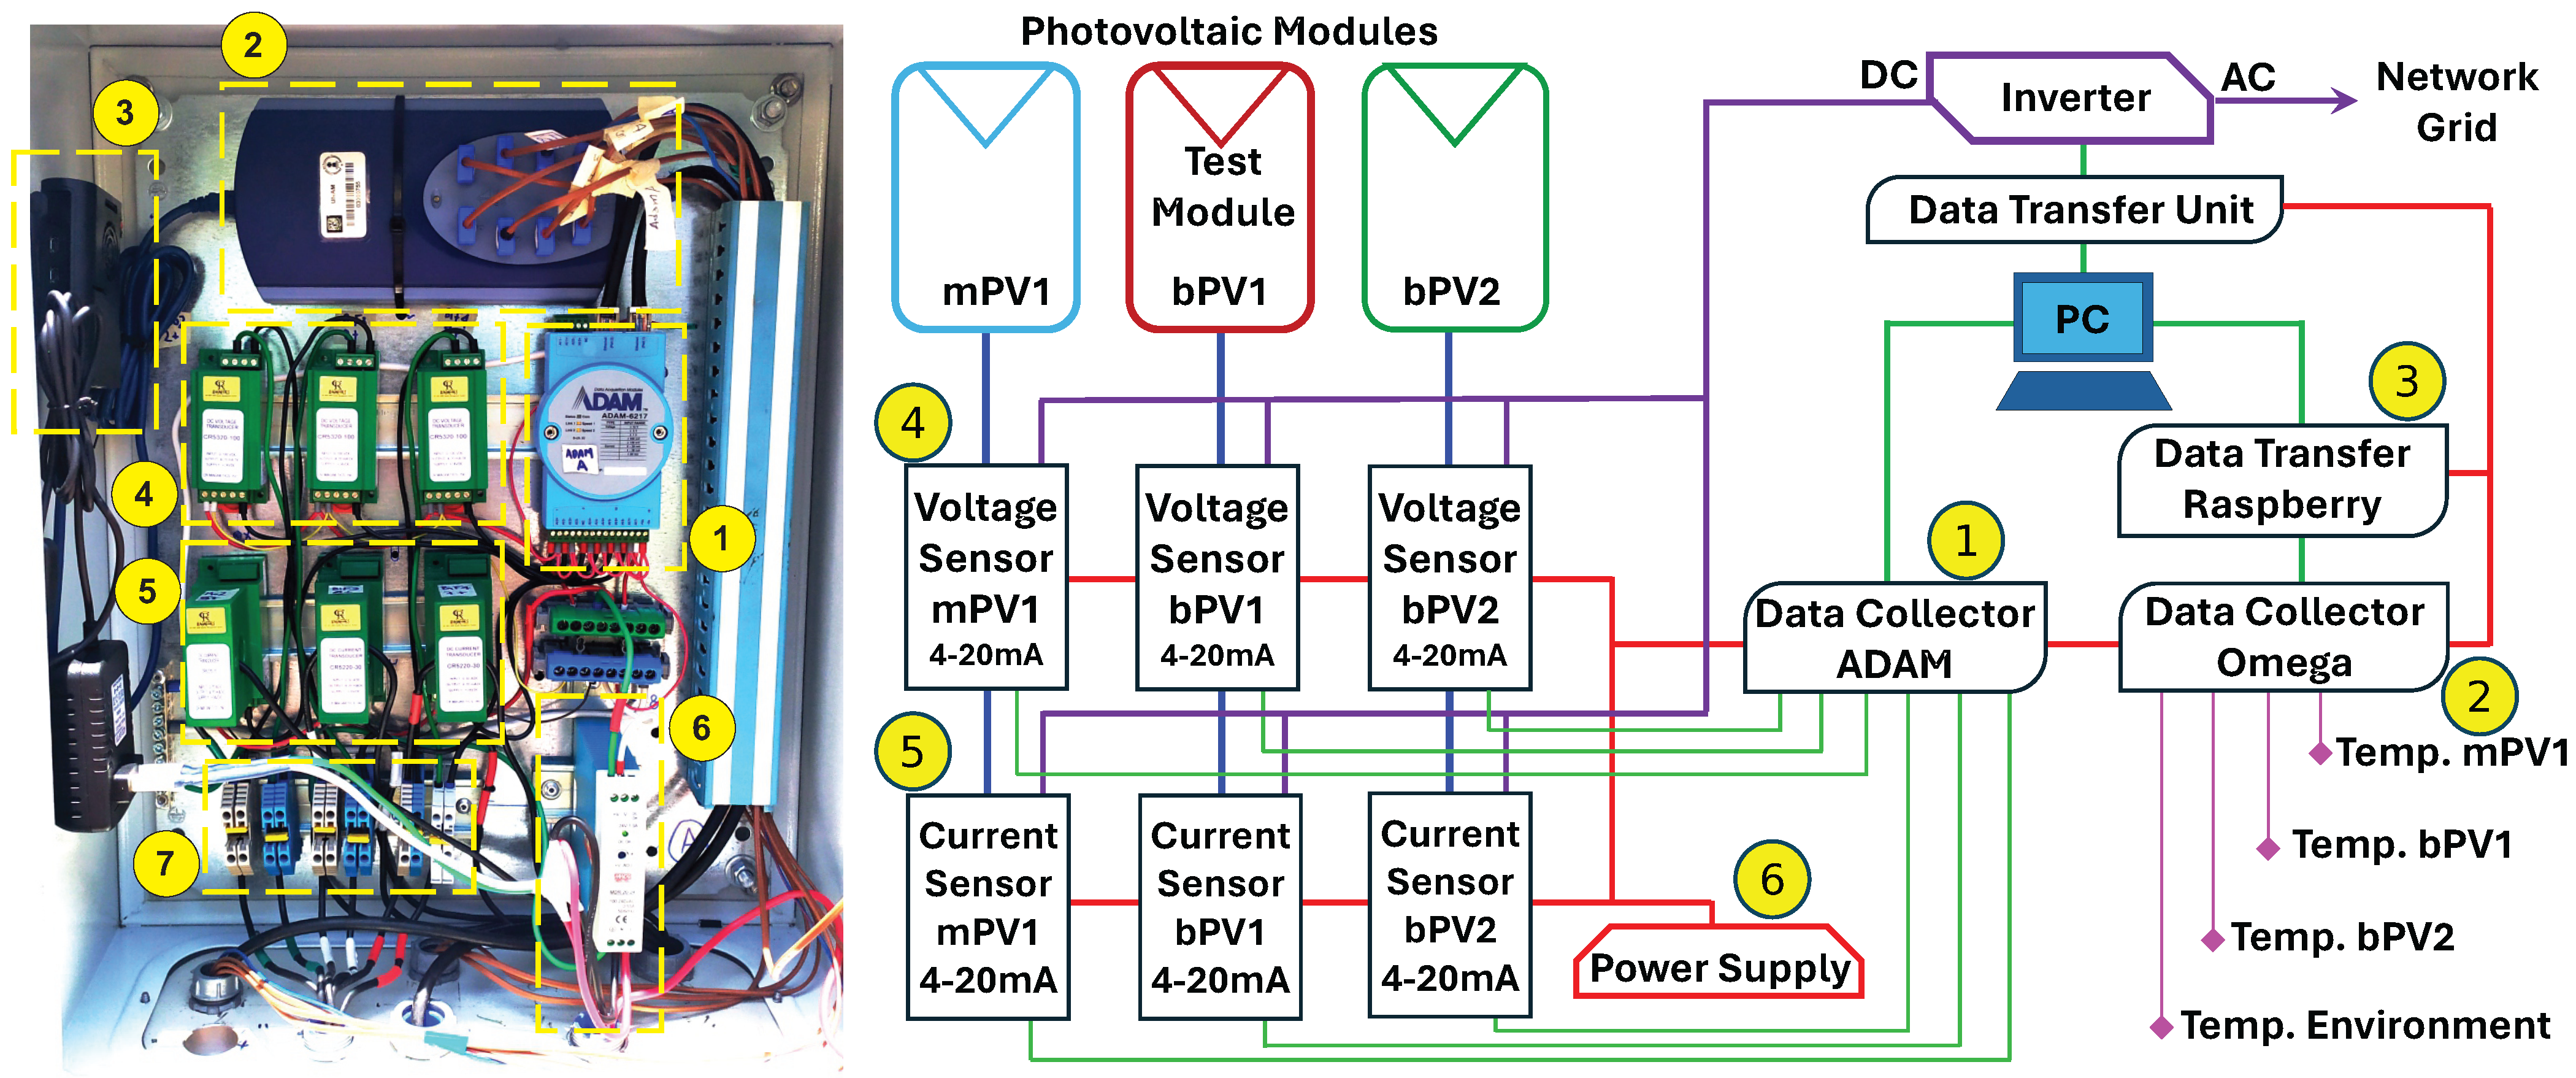
Outdoor tests were carried out in stage 5 to determine the power output of the bPV modules. Current and voltage sensors were installed in the input DC circuits of the inverter, which measured the voltage and current at maximum generated power. T-type thermocouples were installed on the back of the modules in one central cell, and two m-Si work cells were installed as an albedometer on the bottom edge of the mPV reference module, coplanar to its surface, to collect global and rear irradiance (diffused and reflected from the ground). Data processing was carried out, incorporating results from the inverter, sensors, and the bifacial power model.
The experimental data collected were used to compare three different datasets (stage 6): those calculated by the model, those recorded by the installed sensors, and those captured by the inverter. This comparison offers a comprehensive assessment of system performance and serves to validate the accuracy of both the estimated and the measurement values. The final results are presented for all conditions used: surface for the reflection process located on the ground; height 1.5 m and tilt angle range from 0° to 90°.
5. Results and Discussion
In the experimental trials, three different PV modules of various manufacturers were used. The mPV1 was set as a reference, while the two bPV modules were evaluated for their performance. All the following analysis and results presented are referred to the bPV1 module located in the middle of the array shown in
Figure 2.
5.1. Electrical Performance at Indoor Test
Following the methodology outlined in
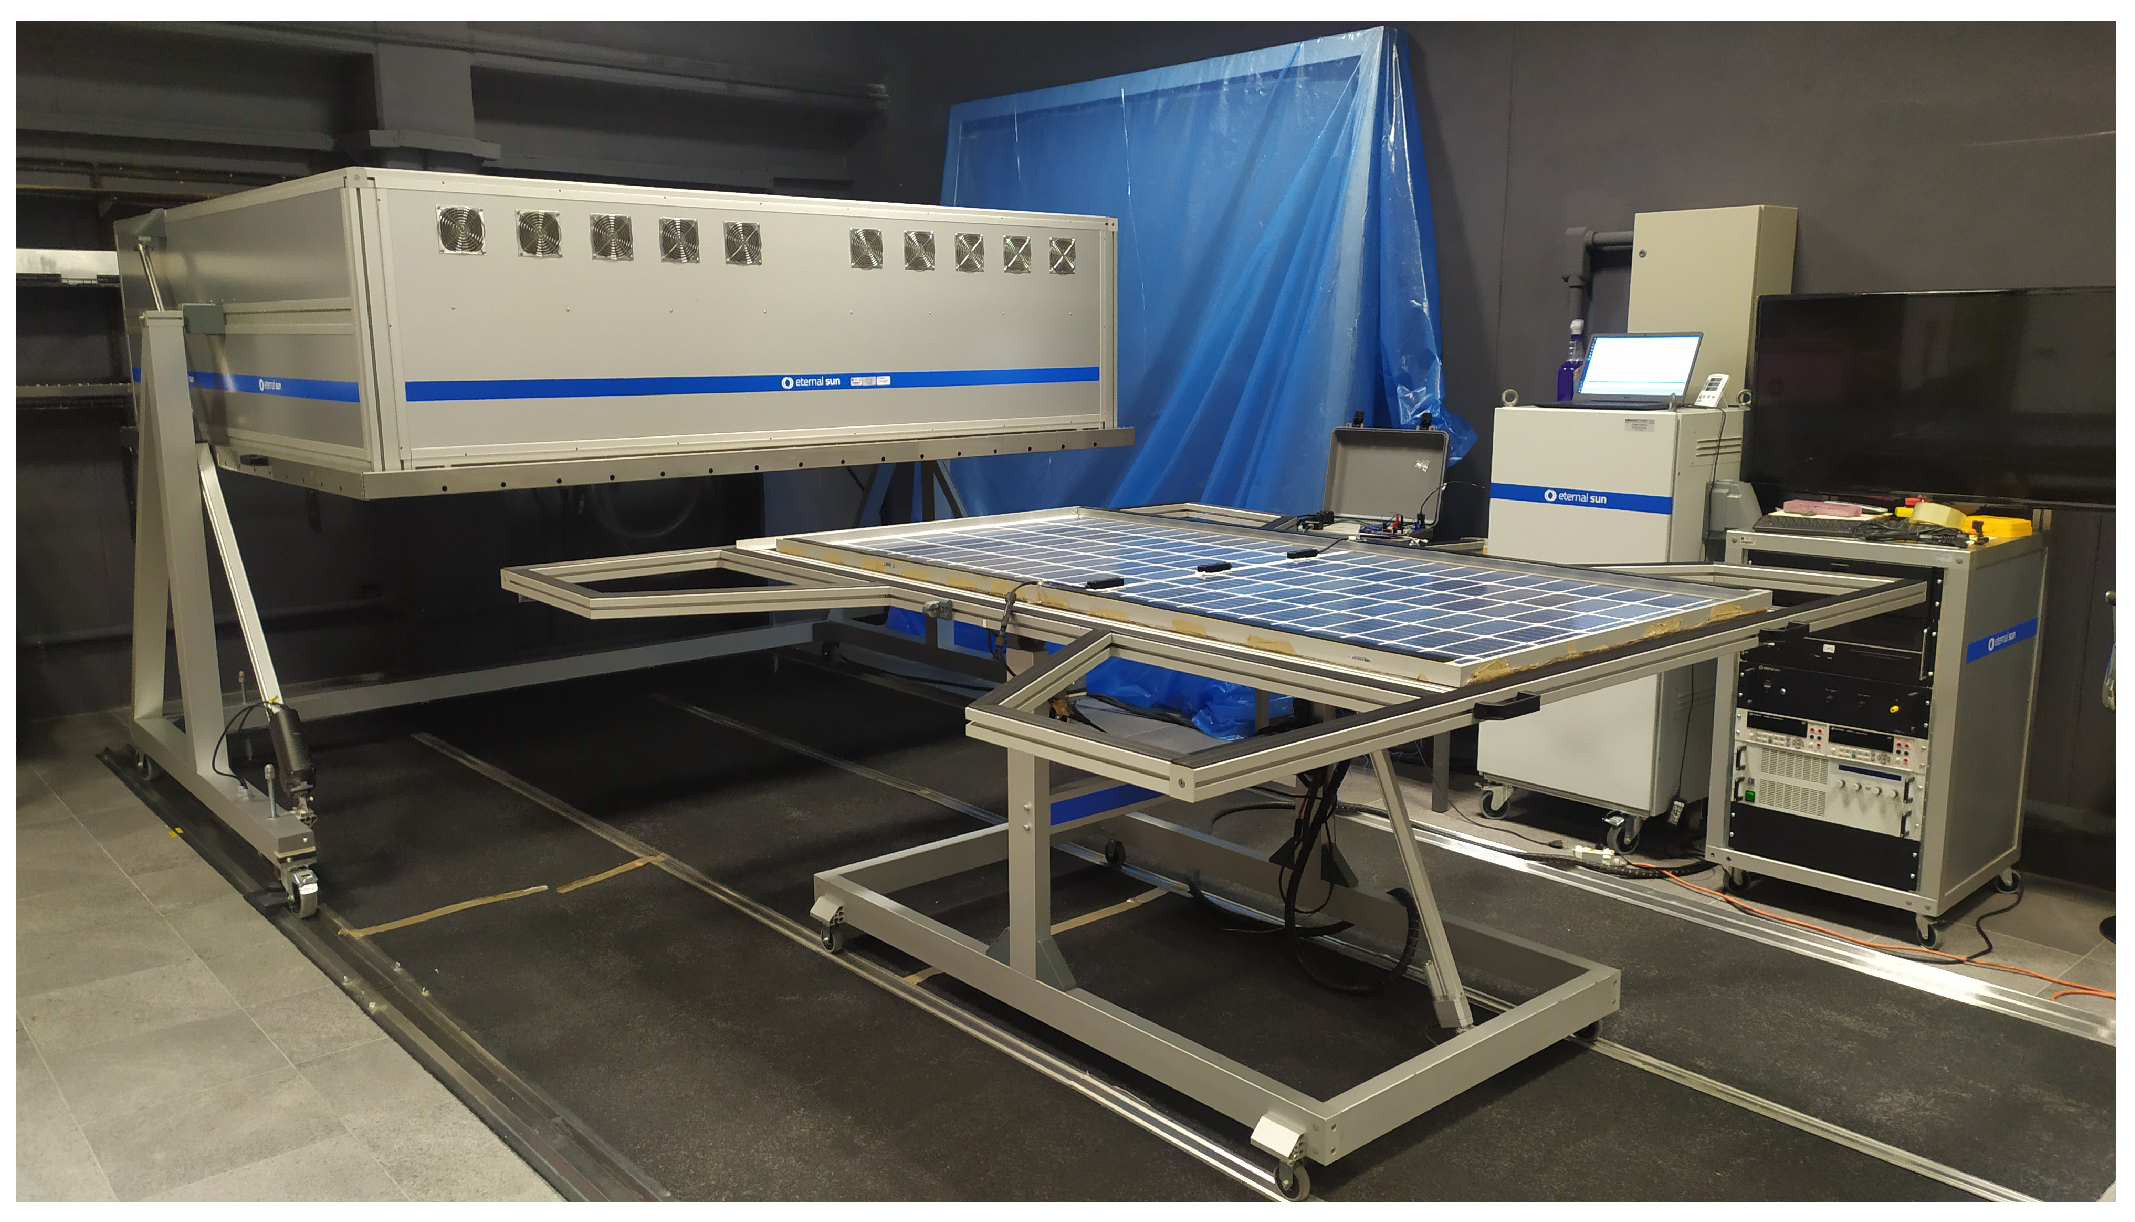
Figure 4, and after verification and preconditioning, the electrical performance of the PV modules was evaluated. The modules were mounted coplanar to the surface of the solar simulator. The temperature was measured using a T-type thermocouple, and irradiance was recorded using a calibrated reference cell. The electrical performance of the bPV modules was measured separately for the front and rear sides. During front-side measurements, the rear was covered, and vice versa for the rear-side measurements.
The I-V curve was obtained at normal incidence irradiance
and module temperature
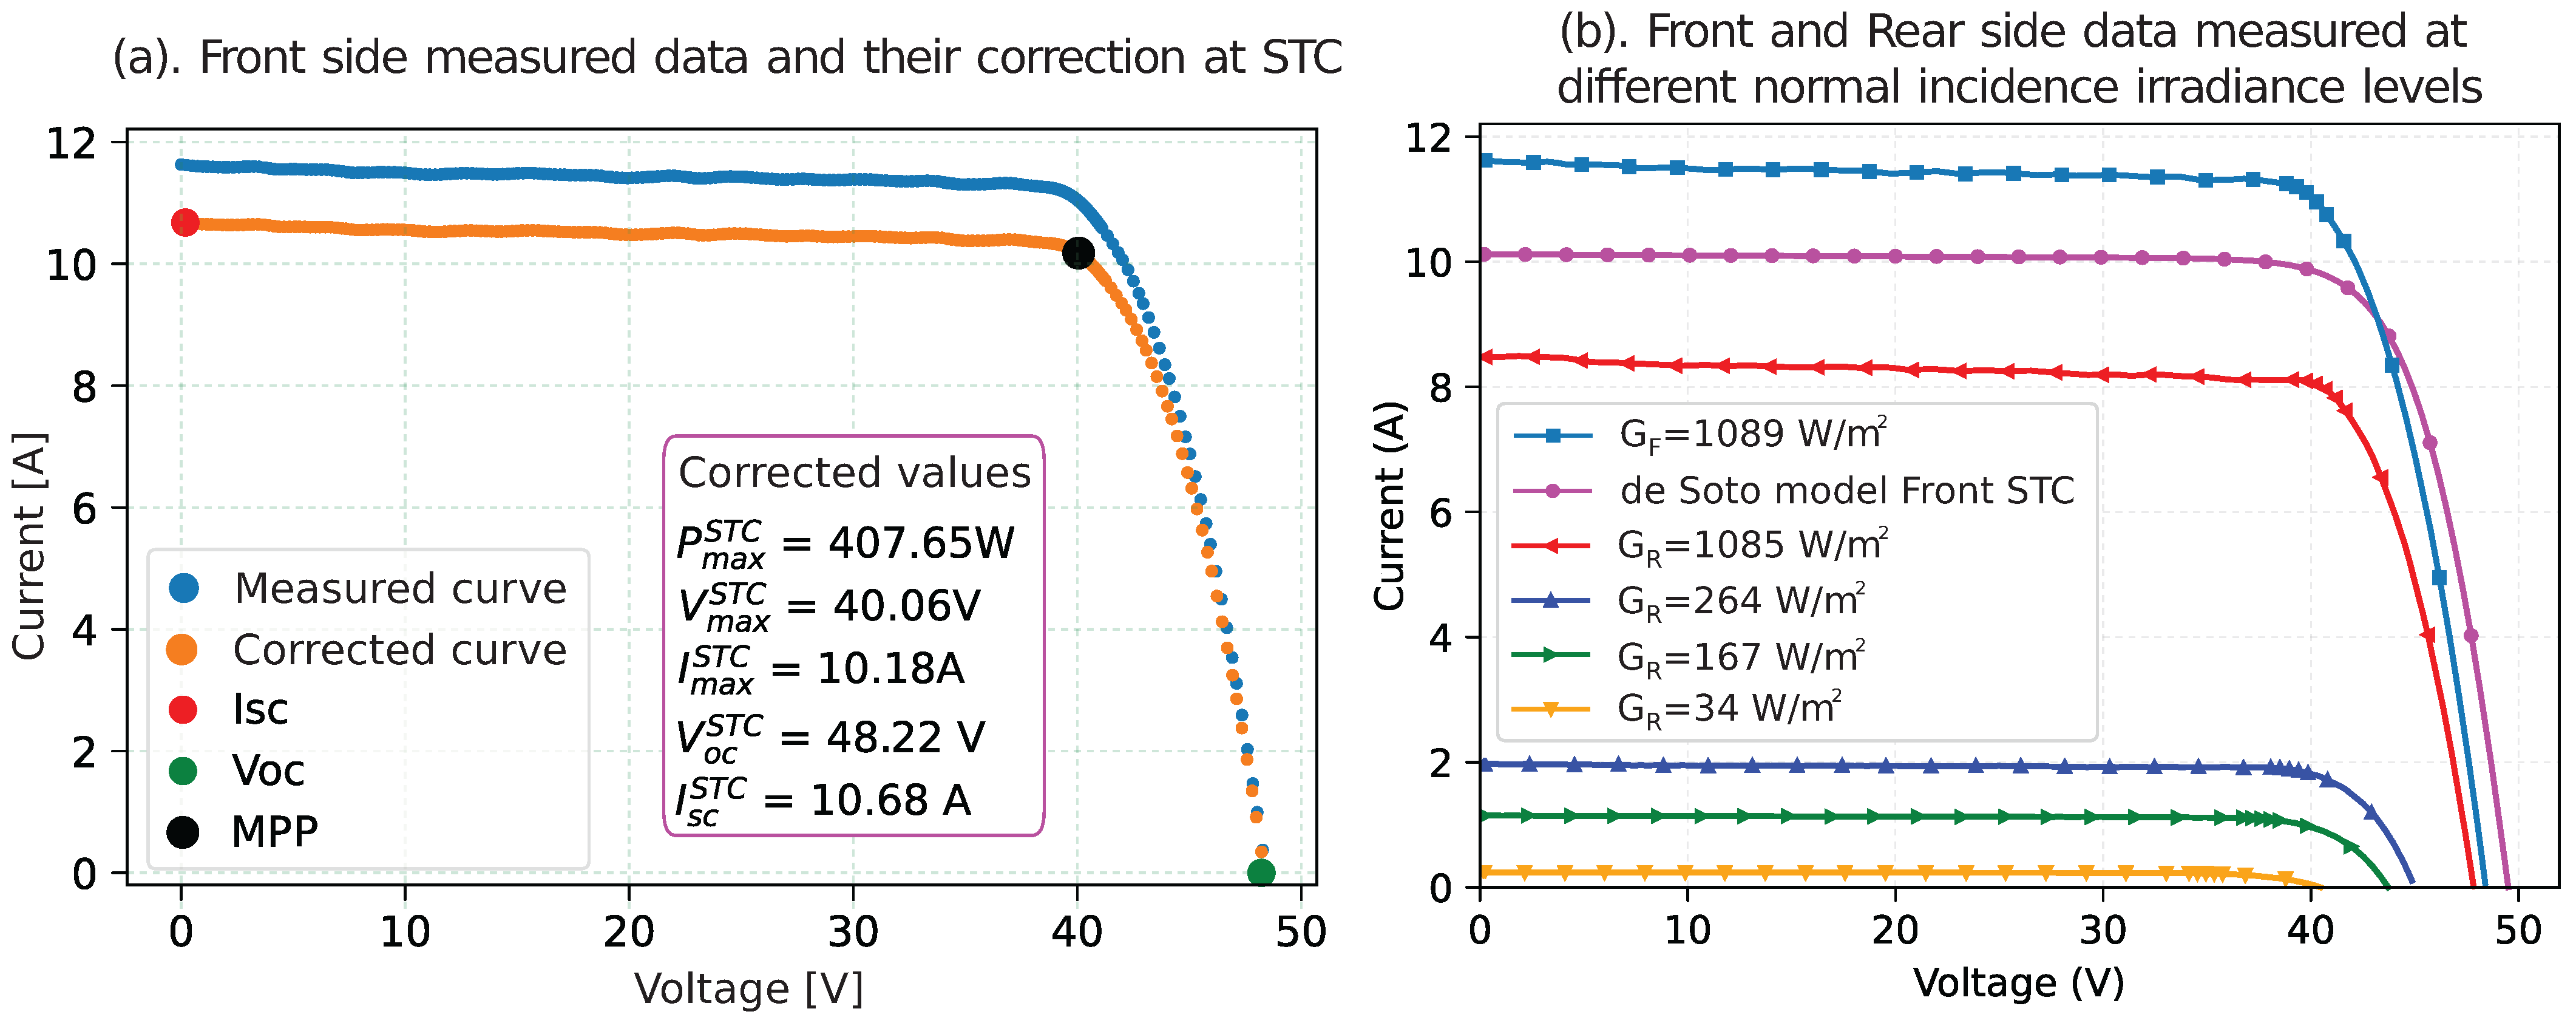
, and the data collected were translated into STC conditions. As an example of the behaviour of electrical properties,
Figure 5a shows the I-V curve of bPV1 for the front side, measured at
= 1089 W/m
2,
°C and corrected for STC.
Figure 5b shows the I-V curve of bPV1 for both front and rear sides at different irradiance levels and also a modelled with the de-Soto model [
45], plotted I-V curve at STC from manufacturer specification data.
The uncertainties in the measurements were determined from the uncertainty in the measurement equipment; the values are presented as follows: in voltage , in current , in power , and in temperature °C.
Table 2 summarises the results of the indoor test for the bPV1 and mPV1 modules, with all measured values adjusted to STC. In these results, the Percent Difference (
) is reported as
according to [
46] where X is the experimental value and Y is the theoretical value of the technical datasheet.
The results of the electrical parameters for bPV and mPV compared with those provided by the manufacturer in their specification sheet (, , , , ) are highly consistent, with no difference exceeding 7.4% in all parameters. Regarding the bifaciality coefficient, the difference is −5.1%, which is within the manufacturer’s specified tolerance range.
5.2. Analysis of the Bifaciality
The bifaciality coefficients , and were calculated using the values and obtained from the current (I) vs. voltage (V) measured under STC conditions; both for the front and rear sides of the bPV modules.
The collected values were , and in both cases, and the bifaciality coefficients were calculated with the following result values: . and .
The coefficient reported based on IEC-TS [
34] is
. This value is equivalent to the manufacturer’s reported value, which is
on its specification sheet. The experimentally determined bifaciality (73.2%) is consistent with the manufacturer’s specification, falling within the expected tolerance range and indicating both satisfactory module performance and measurement methodology.
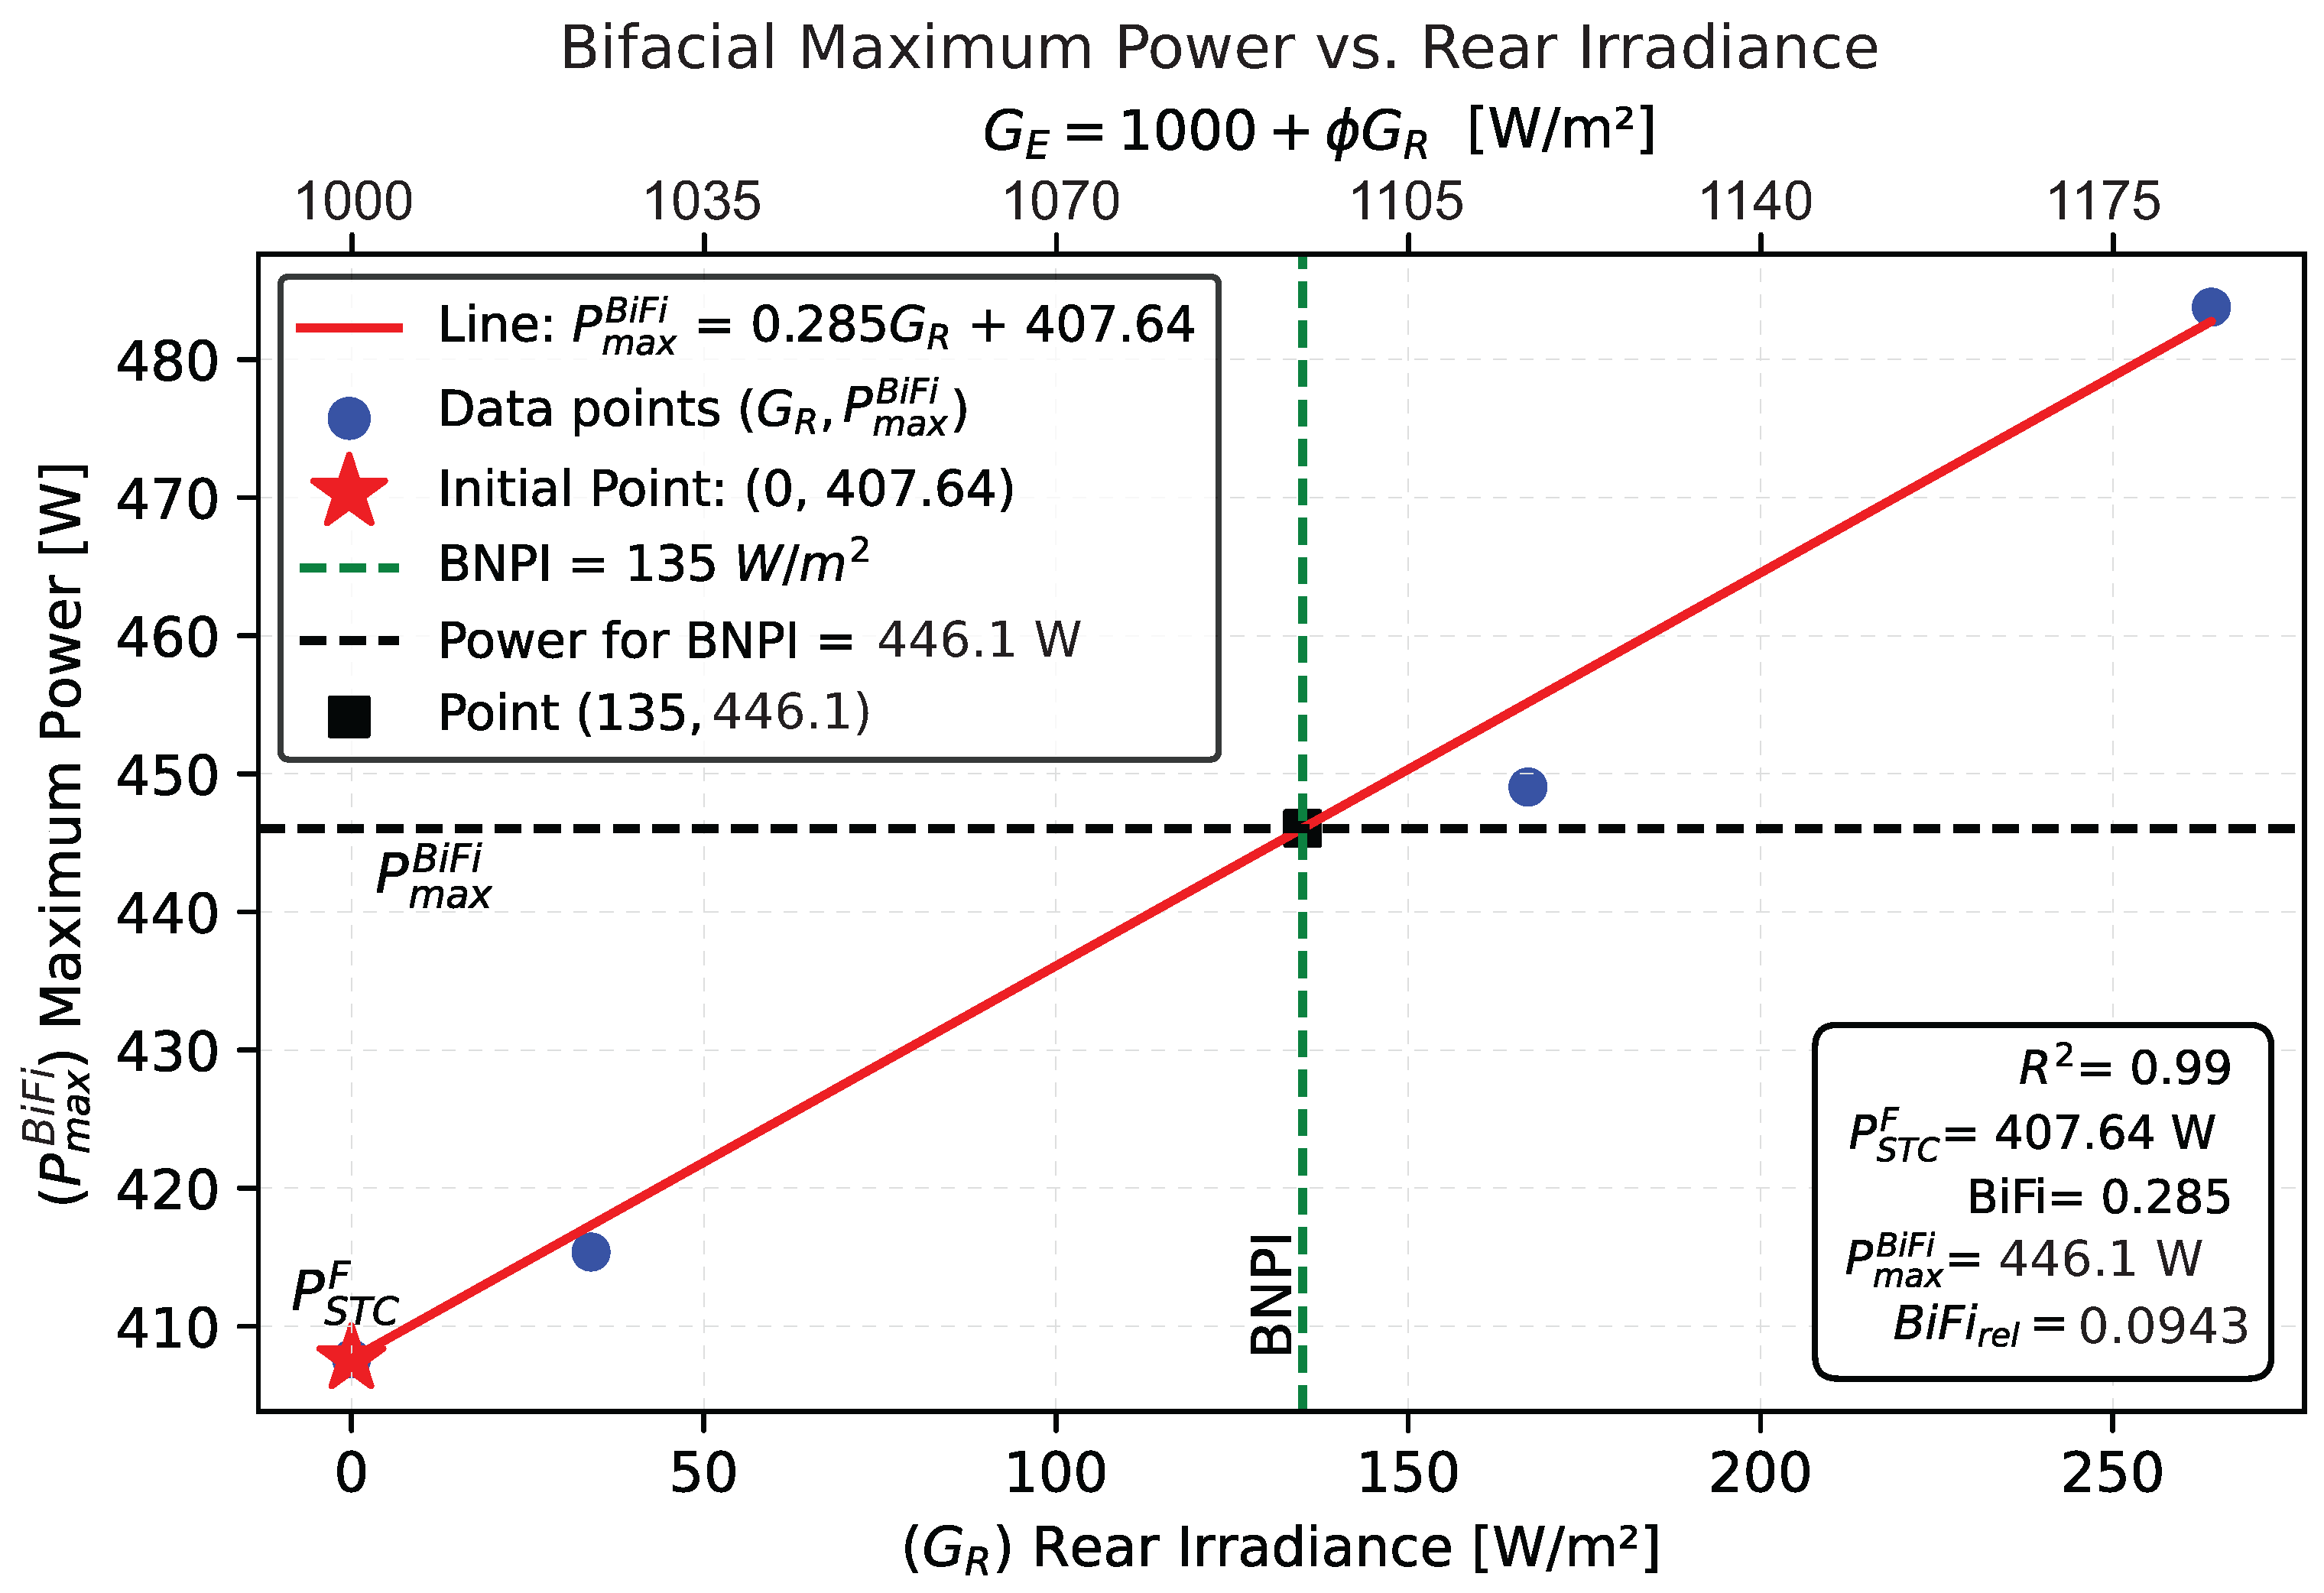
The Rear Irradiance Power Gain coefficient (BiFi) of the modules is determined according to IEC-TS [
34] from the slope of the behaviour of
vs.
, where
is the irradiance applied on the rear side of the bPV1 module with values lower than 200 W/m
2, starting with the point (0,
), where
is the maximum frontal power in STC, in this case
W.
Since the solar simulator used in these experiments has a lower limit of 200 W/m
2, to attenuate this value, some meshes with different shading factors were used for each one, the I-V curve was traced and the values of
were identified. The behaviour of
vs.
for the collected data, which is a linear relationship, is shown in
Figure 6.
According to IEC-TS [
34], a straight line must be drawn between these points, and its slope provides the BiFi power gain coefficient of the module. It was determined that
with a coefficient of
.
As a consequence of the previous result, the maximum bifacial power that the bPV1 module could generate as a function of
is given by Equation (
2):
Using Equation (
2), for bPV1 it was obtained
, which is valid with an uncertainty of 0.3%.
According to the IEC-TS recommendation [
34], the average reflected irradiance received by the rear side of a bPV module is approximately
= 135 W/m
2. Therefore, the maximum bifacial power to be reported should correspond to this irradiance condition. Based on the graph in
Figure 6 and Equation (
2), the module under study yields a maximum bifacial power of
W.
However, a more realistic approximation of the power gain should be made with respect to the contribution of rear radiation and not as a percentage of the front power as specified by the manufacturer. A summary of the results obtained with
and those provided by the manufacturer is shown in
Table 3.
The given by for the bPV module under study has a value of 9.4%, which is the power gain generated by bPV compared to frontal power. Although the standards do not specify it, the relation could be considered the updated expression for what is known in the literature as Bifacial Gain (BG), which is a term widely expanded in a large part of the research on this technology. Here, is relative to the front side of the same module and is not referred to a mPV module of the same power.
Taking into consideration the previous results, manufacturers should provide in their module’s datasheet the equation that determines the power gain under STC conditions, i.e., Equation (
2), which would be the maximum value that the bPV module can generate. In this way, designers and end users of the technology could have a more precise estimation of power generation than is currently indicated by manufacturers.
Under normal operating conditions, the bPV module should be installed with optimal geometric conditions suited to the installation site to capture the maximum amount of reflected irradiance from the rear side, since the way the module perceives such irradiance depends on both the Angle of Incidence (AOI) and the type of surface or albedo of the site. Under such geometric installation conditions, the model described by the IEC-TS [
34] can provide the bifacial power more accurately and for that; it is necessary to measure the rear and front irradiance at the same time with the geometric installation conditions.
Analysing the expressions for the maximum power Equations (
1) and (
2) and considering STC without thermal effects, both expressions show consistency in their results:
with Equation (
1) and
with Equation (
2); obtaining a difference of 0.4%. This indicates that the consistency in the expressions fundamentally depends on the way the irradiance is measured on the rear side of the bPV module. For this purpose, the following studies were conducted in this work.
5.3. Procedure to Measure Front and Rear Irradiance
In order to determine the energy produced by the bPV module in a given location, it is necessary to study the daily behaviour of the power generated from field measurements. This requires considering the geographic coordinates, environmental conditions, and solar resource of the location. In addition, it is essential to select the appropriate geometric conditions for the installation of the bPV module. For this study, it was decided to measure both the global irradiance that will strike the front face of the bifacial modules and the solar irradiance from reflections off the installation site surface, which will strike the rear side of the modules.
Frontal global and reflected solar irradiance by the surface in this study were measured using calibrated m-Si work cells adapted in the shape of an albedometer, one cell on top of the other, one of them facing the sky to measure frontal global irradiance and the other facing the floor to measure reflected irradiance by the surface, both coplanar to the module. The albedometer-configured work cells were located at the bottom of the modules, in the area closest to the ground, according to IEC-TS [
34]. The arrangement and location of the work cells is represented as “
S” in
Figure 2; and both measure exactly the amount of frontal global (
Cell-Up) and rear reflected (
Cell-Down) solar irradiance that the bPV modules perceive.
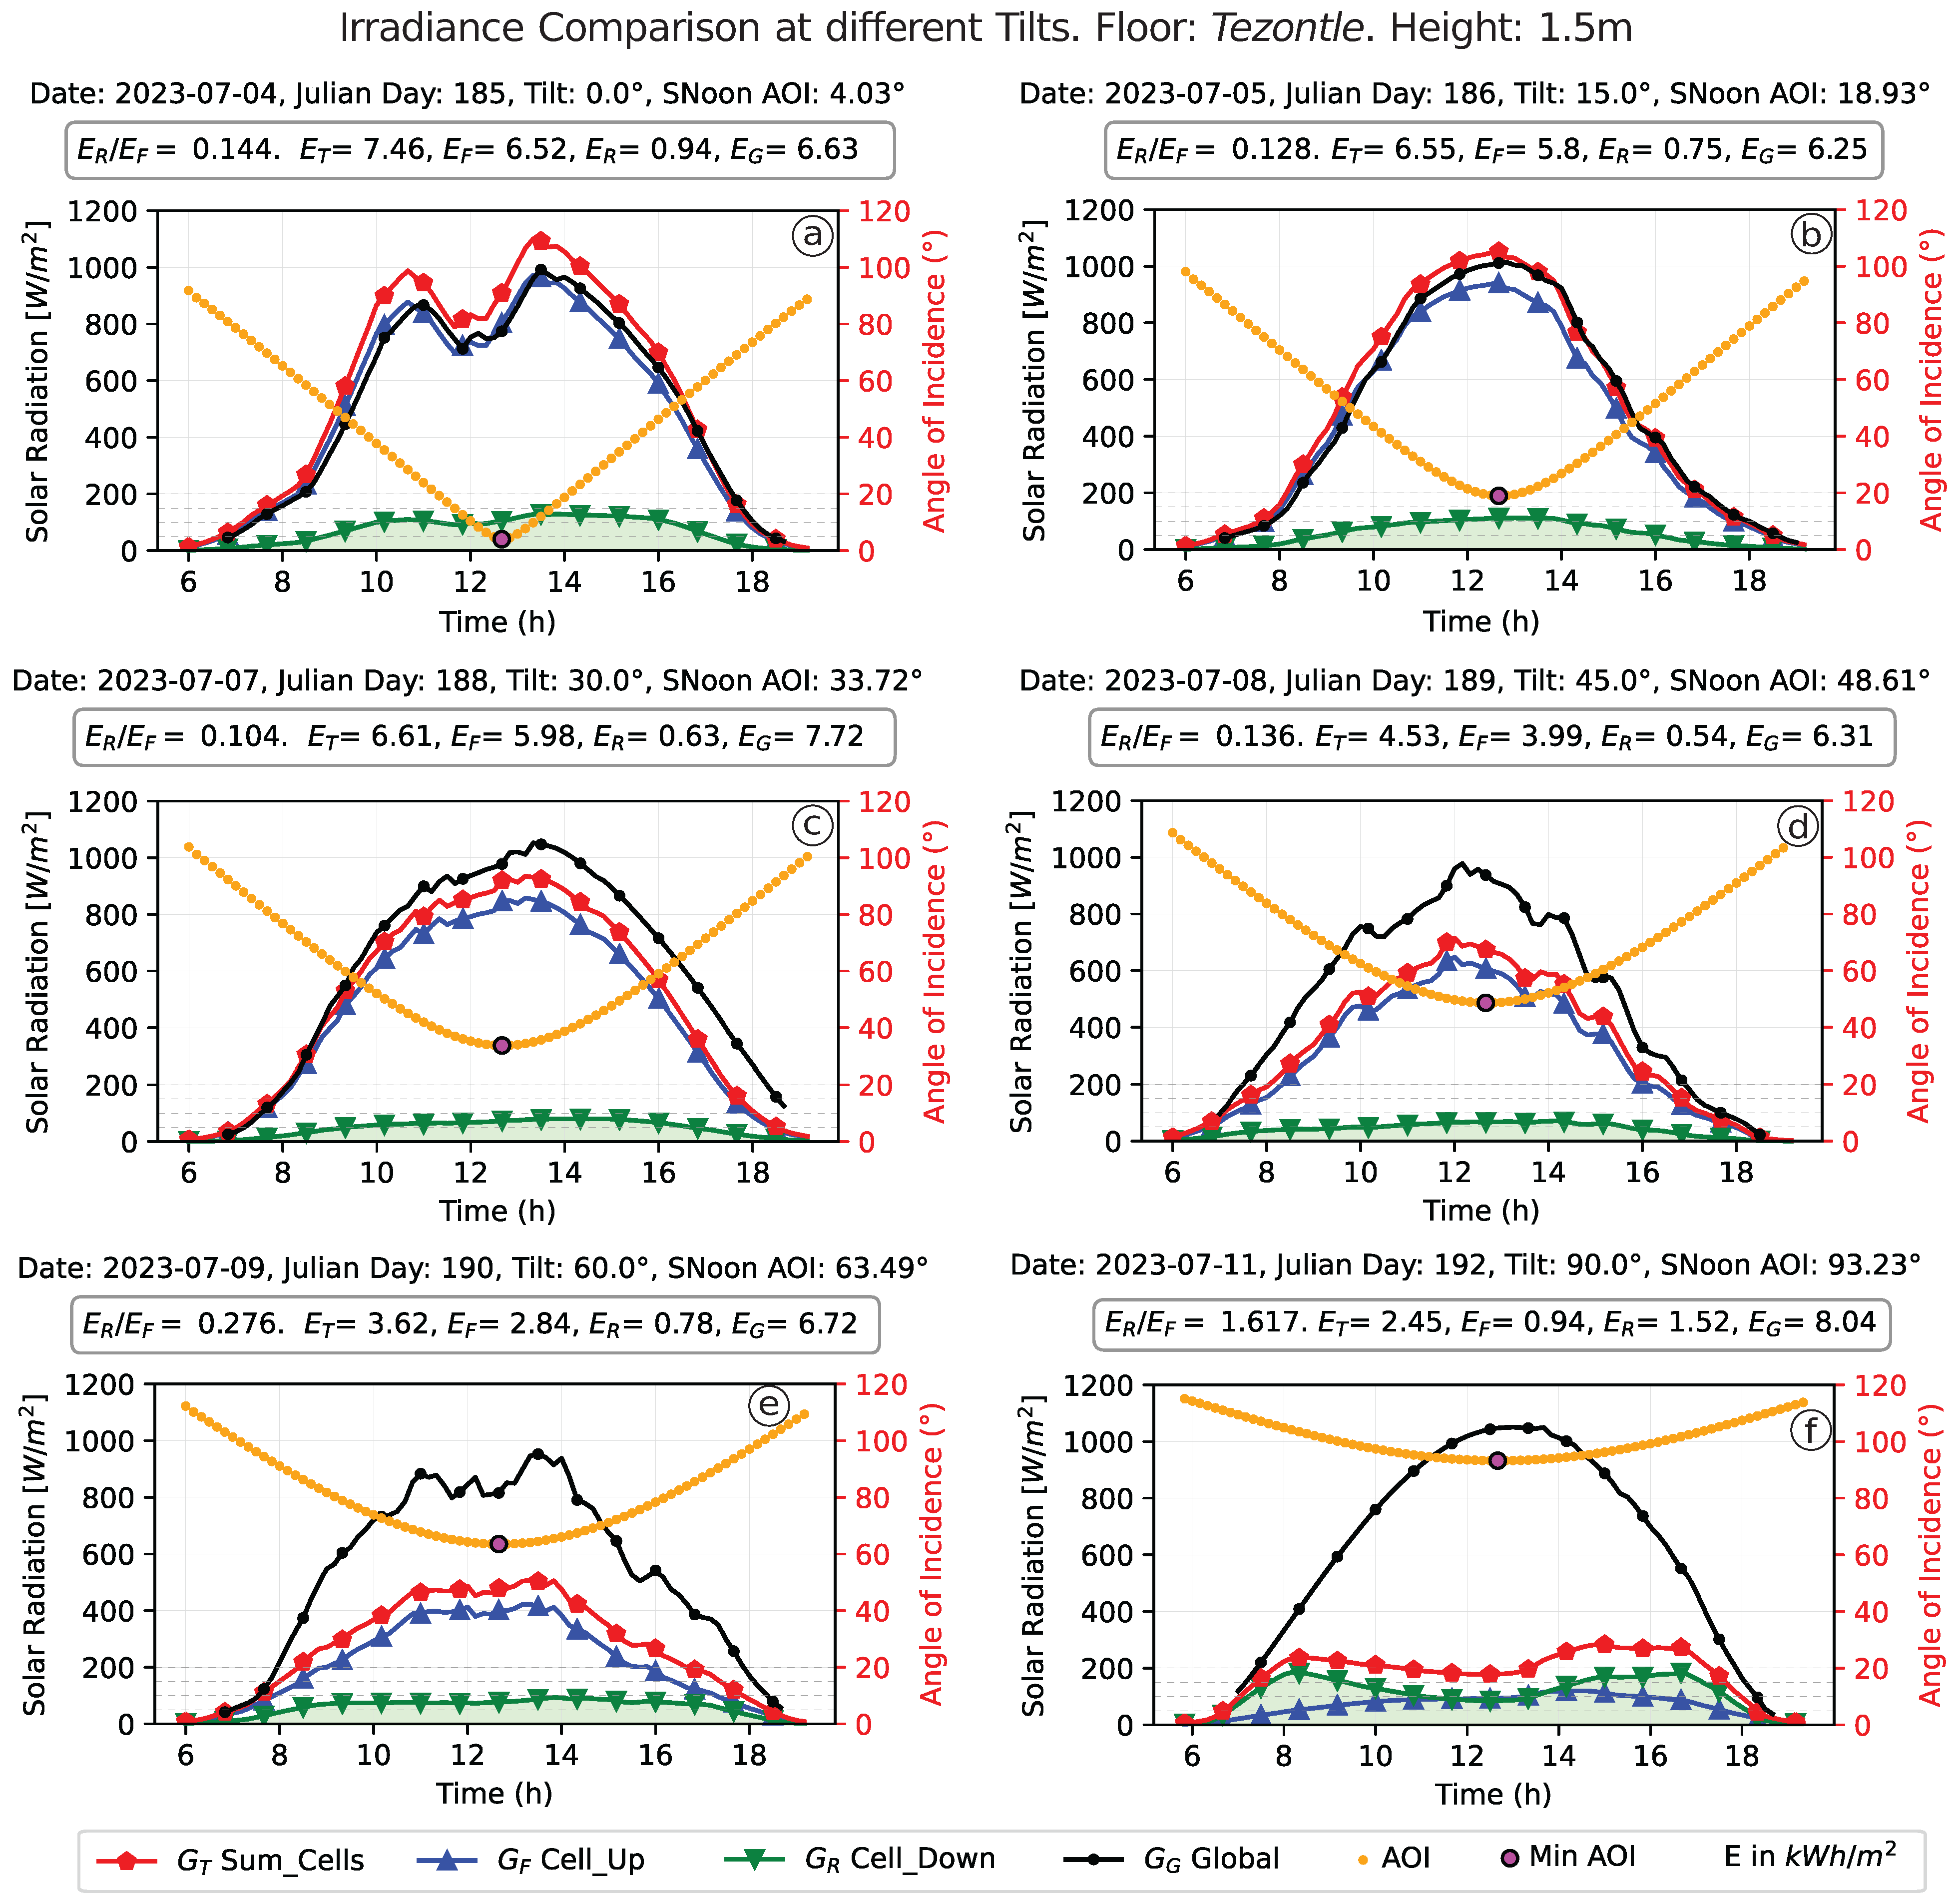
An example of the behaviour of the measured irradiance
(blue line),
(green line) and
(red line), where
as total irradiance; and
(black line) the global horizontal irradiance, as a function of the hourly time that the bPV modules will receive, is presented in
Figure 7 for
(Tezontle) as reflective material, at different MTAs for
H = 1.5 m. The MTAs ranged from 0° to 90° in steps of 15°; one angle per day. The experiments were carried out at latitude 18.9° N and longitude 99.2° W, starting with Julian day 185 (MTA = 0°) to Julian day 192 (MTA = 90°) at the beginning of the summer season.
The AOI of direct solar radiation, defined with respect to the zenith line of the module surface, was conventionally calculated using the principles of solar geometry [
47], based on geographical coordinates mentioned above. As illustrated in
Figure 7, the AOI (represented by the orange line) is considered positive from sunrise to solar noon and again from solar noon to sunset. This angle decreases from a maximum value at sunrise (which varies depending on the measurement day) to a minimum at solar noon, when the sun is nearly overhead and almost perpendicular to the module surface due to the site’s geographic location. After solar noon, the AOI increases again, reaching another maximum at sunset, which also depends on the specific day of measurement.
For example, the AOI values vary in relation of MTA, such that for 0°, it gives values for AOI smaller than those for a tilt angle greater than 0° (15° to 90°). It can be seen in
Figure 7 that the smallest AOI (zenith angles) corresponds to an
0° and consequently higher irradiance values.
As a consequence of what was previously observed, it is evident that for those specific measurement days, at the beginning of summer at a latitude of 18.8°, a surface with a horizontal tilt angle 0° will capture greater irradiance than those collectors with MTA greater than 0°. Although there was a cloudy sky during the measurement days, the previous argument is verified by the magnitude of the measured irradiance and the shape of the curves. However, it is well known that for geographical sites with latitudes between 15° N and 30° N, the maximum solar energy capture in summer is obtained for collectors with a tilt angle equal to the latitude minus 15° (
− 15°), which in our particular case is approximately
4° (18.9 − 15°), a value that is consistent with the behaviour of the irradiance for the case at which
0°, having an
4° at noon and a highest irradiance capture (see
Figure 7).
The Total Solar Energy (TSE) available at the specific site for a bPV module is determined from the area under the irradiance curve versus time of day:
vs. Time,
vs. Time and
vs. Time. In
Figure 7, respectively, the solar energy available for the different MTAs is included. For these specific measurement days (beginning summer in the location), the maximum available TSE of 7.46 kWh/m
2 (frontal energy of
kWh/m
2 plus rear energy of 0.94 kWh/m
2) corresponds to a
0° due to the position of the Sun in the sky.
From the other MTAs, the available TSE decreases as the MTA increases, the expected behaviour due to the component of direct irradiance that penetrates the collector
, decreases as the MTA increases. The TSE values included in
Figure 7 shows this trend, although for
and
the values are similar because on the day measured, the behaviour of G vs. t for
the overall energy was higher than for
, this tendency is valid.
Concerning the behaviour of
vs. t for different tilt angles shown in
Figure 7, it can be observed that the shapes of the curves are similar and their values for a selected time depend on the global irradiance available for that measurement day. For example, for MTA of
at solar noon, a frontal irradiance of
W/m
2 was presented with a rear irradiance of
W/m
2, and for an angle of
, a frontal irradiance of
W/m
2 was presented with a rear irradiance of
W/m
2. It can be seen that the values of reflected irradiance are very similar.
For the case of modules placed at
m and using the same reflective material, during the Julian days from 178 to 183, the behaviour of the irradiance and the AOI are very similar, as shown in
Figure 7. If the AOI values for each tilt angle are compared for modules at 1.5 m height with those at 2.0 m height, it was found that the variation ranges are very small because, even if the AOI depends on the solar declination, it varies very little during the time interval in which these measurements were made for the red stone
Tezontle. In addition, there is a relationship between the irradiance values and the AOI for the different tilt angles of the bPV used. The higher the inclination angle of the module, the lower the energy capture in the bPV.
Due to the area under the graph G vs. t being the energy available on this day, for each graph, the daily available energy was calculated for each case in
Figure 7. The variation in the energy captured by the albedometer with respect to the variation of the MTA and the two different heights of the work cells is presented in
Figure 8.
The highest energy captured during the six Julian days corresponds to the MTAs between 0° and 30°, with the highest value occurring at 0°. This is clearly explained by the fact that solar rays strike the module surface at low zenith angles, such that, for this location at solar noon, the zenith angle approaches zero. The tilt angles that do not favour energy collection greater than 4.5 kWh/m
2 are those corresponding to incidence angles greater than or equal to 30°, which exhibit lower energy capture as shown in
Figure 7.
However, when comparing the ratios between the rear energy density and the global horizontal energy density for heights of 1.5 and 2.0 m, the values obtained are similar for the respective MTA in the (0–30°) range, with observed differences of . The same pattern occurs when considering the ratio of the rear reflected energy to the global horizontal energy. Consequently, the amount of energy captured by the rear side for heights between 1.5 and 2.0 m will have very similar values.
Therefore, for the study of the behaviour of the bPV module, the following geometric conditions have been selected: H = 1.5 m and 0° for the position of the module.
5.4. Bifacial Power Output for Tezontle in Outdoor Conditions
To use the previous results presented on the behaviour of the data for frontal and reflected irradiance on the same days and tilts, in this work, only the maximum power generated by the bPV and mPV module for Tezontle as reflective surface and m of height were analysed. Power was calculated using the conventional relationship between Voltage (V) and Current (I), i.e., . The measurements of current (I) and voltage (V) for each module under study were obtained by the sensors installed in the MPPT DC input circuit of the inverters; as a consequence, its values correspond to the MPP in the I-V curve of the modules, so their product gives the of the bPV module and of the mPV module. Furthermore, all of the inverters that were used in this experiment have an electronic device (DTU) that can measure the current and voltage at the output of the MPPT (according to the manufacturer’s datasheet) and also provide the DC input power before the DC/AC conversion. The inverter is assumed to track the MPPT at all time with an efficiency of 99.8% according to the manufacturer’s specification.
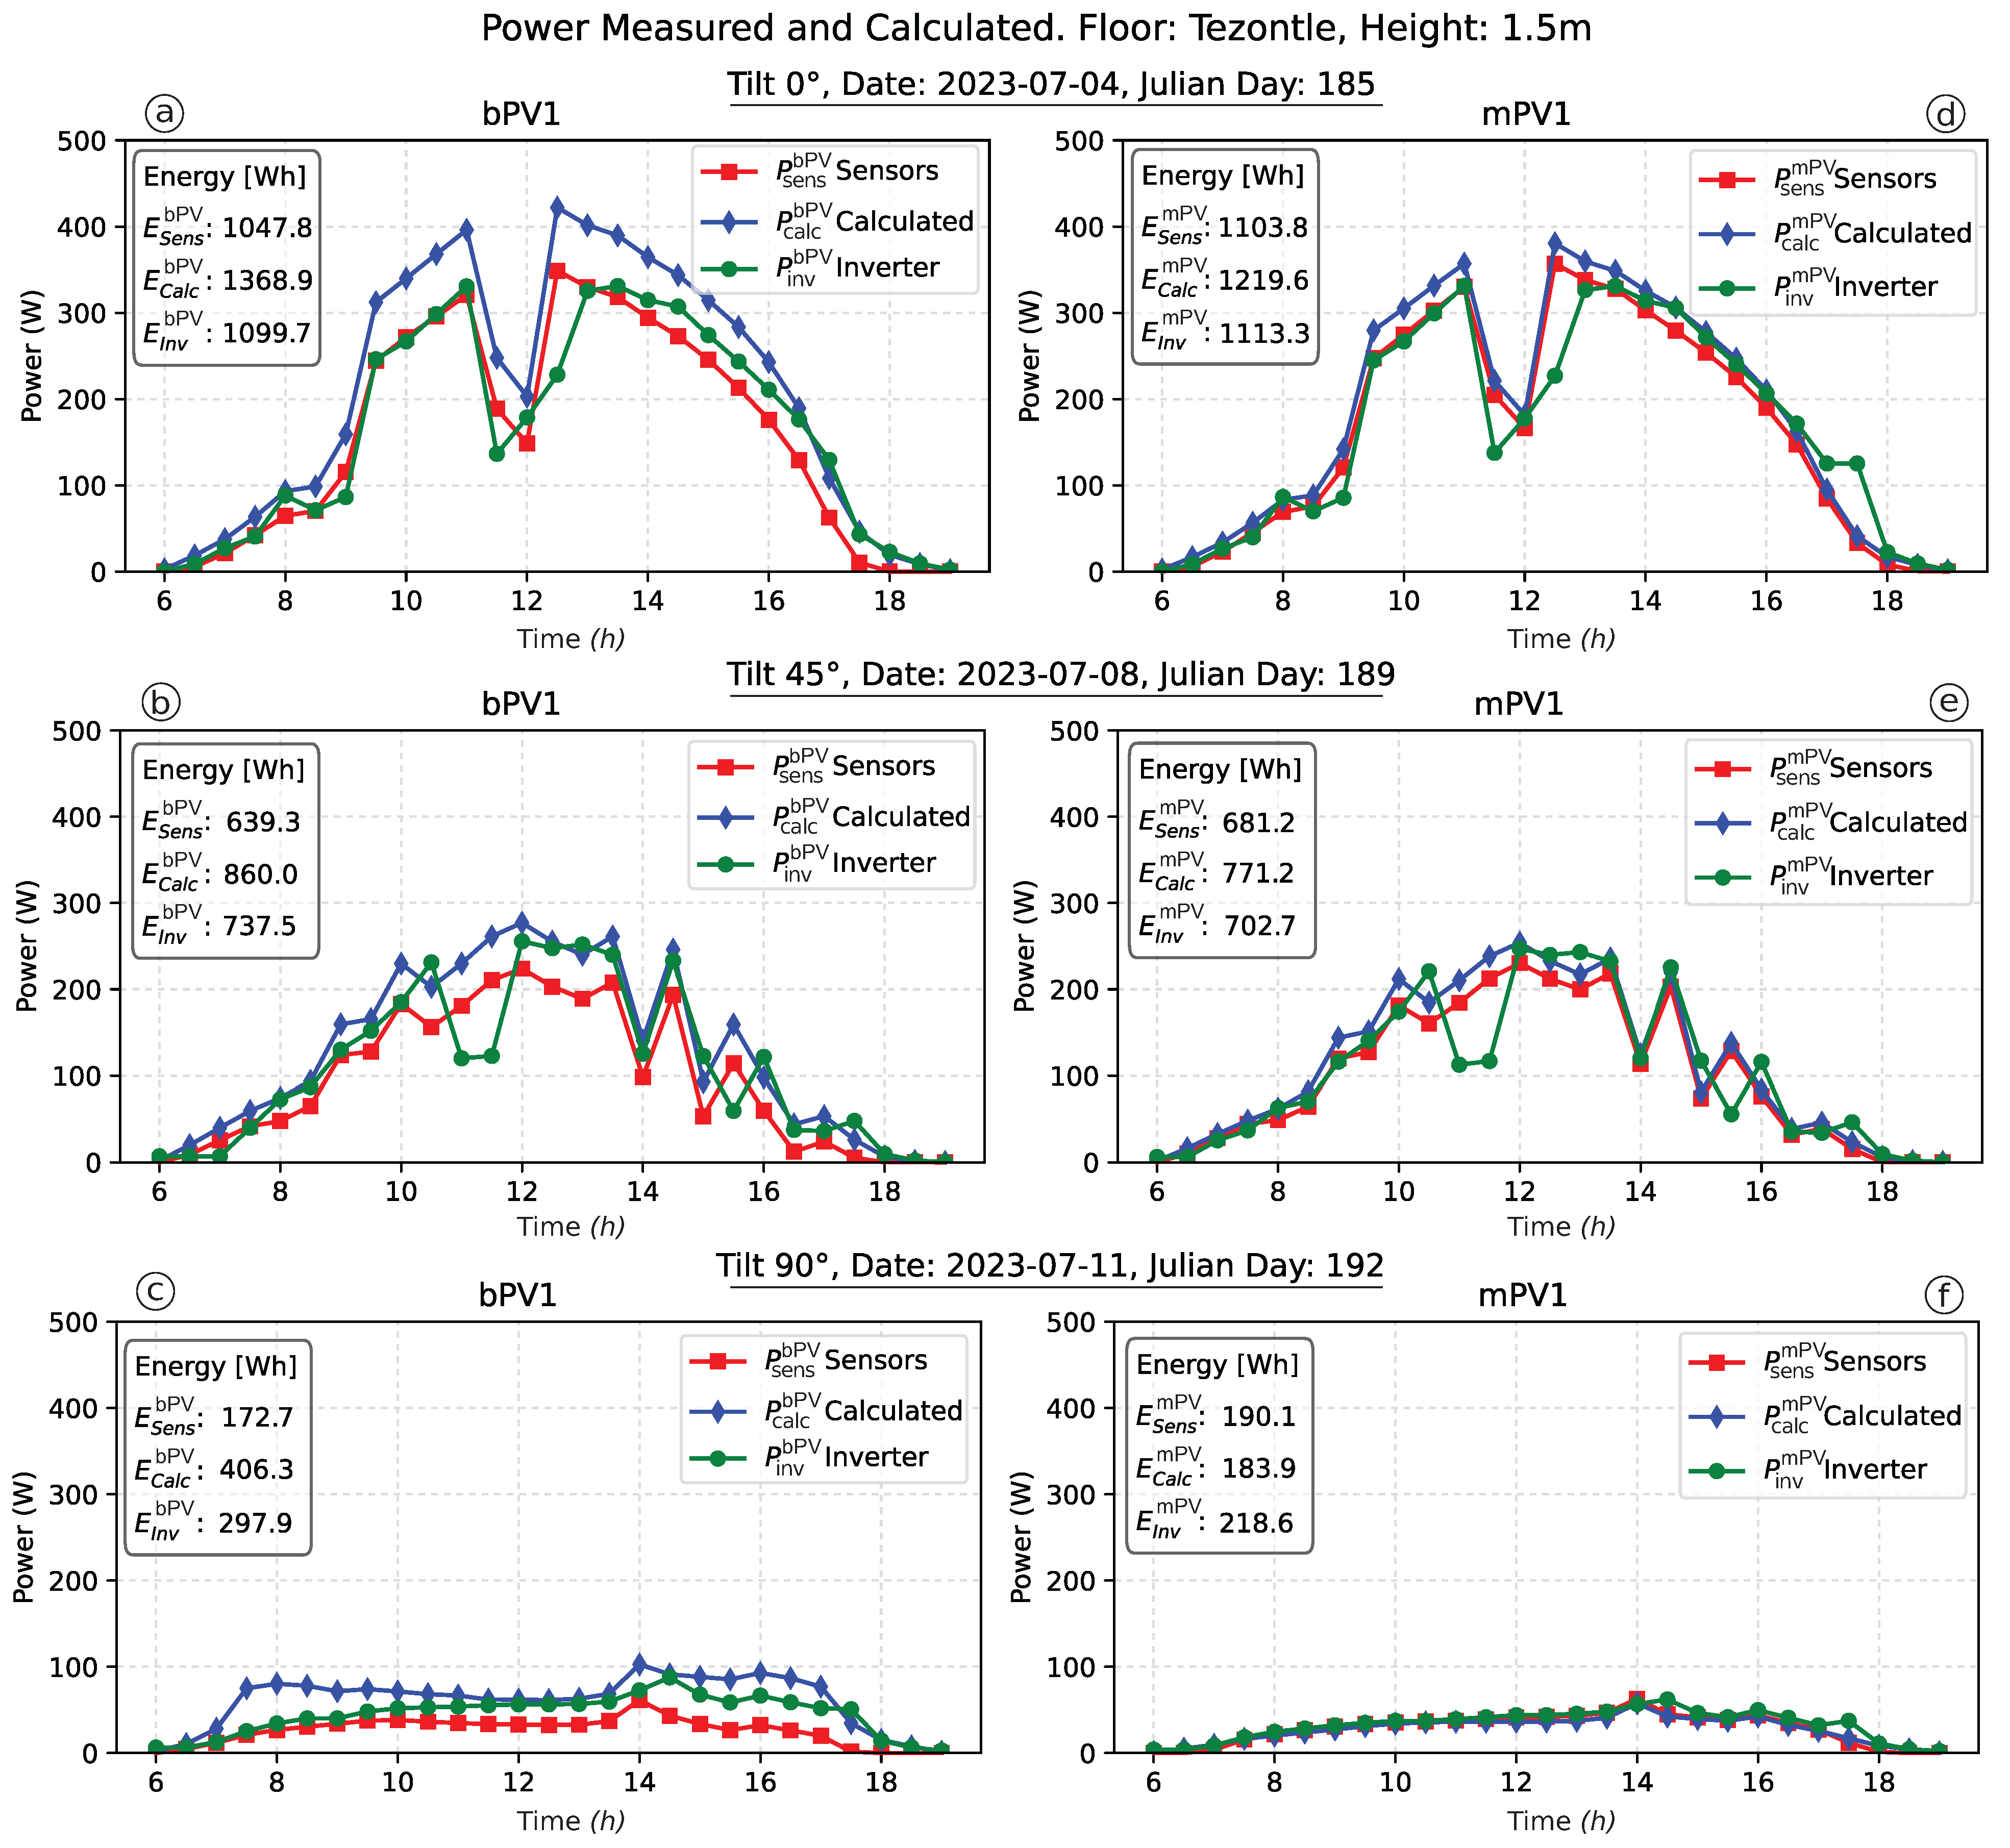
The comparison of power generated at different MTAs for mPV (graph on the right) and bPV (graph on the left) is shown in
Figure 9. The maximum power registered by the sensors
is shown with a red line, while the DC power input
before the DC/AC conversion is shown with a green line. On the other hand, using the measured values
at STC,
,
and
, with the model given by Equation (
1), the
for each MTA was calculated and plotted with blue lines in
Figure 9.
The results presented correspond to the dates between 4 July (Julian Day 185) and 11 July (Julian Day 192) in 2023, with one day for each tilt starting from horizontal (MTA = 0°) and ending in vertical (MTA = 9°).
According to
Figure 9, it can be seen the following facts:
- 1.
mPV module: The graphs on the right show the generated and calculated power for the mPV module at different MTAs.
- (a).
For each MTA, the daily behaviour of the power calculated by the model
, the power recorded by the inverter
, and the power measured by the sensors
exhibit the same behaviour in both shape and magnitude. This confirms the thermal model provided in Equation (
1) generates data consistent with those measured at the input of the inverter. Consequently, these results validate Equation (
1) where
.
- (b).
The shape of the three curves, blue, green, and red, is almost the same. The green and red lines, which correspond to the power provided by the inverter measured in the MPP, and provided by the installed sensors, can be considered equivalent; showing consistency in the measurement process.
- 2.
bPV module: The graph on the left shows the generated and calculated power for the bPV module at different MTAs.
- (a).
From sunrise until 10:00 h and from 15:00 h until sunset, the three plotted power curves (red, green, and blue lines) can be considered identical in both shape and magnitude.
- (b).
Between 10:00 h and 15:00 h, the blue curve, which represents the bPV power calculated using the thermal model from Equation (
1), provides values that, in some cases, exceed those measured at the input of the inverter. The discrepancy between the power values provided by the model and those measured could be attributed to the rear irradiance data, which were measured according to the [
34] standard, obtained values probably higher than the bPV module captures throughout its entire rear surface. This hypothesis is further examined later in the study.
- 3.
Considering that the area under the Power vs. Time curve represents energy, the total energy generated was determined for all graphs shown in
Figure 9.
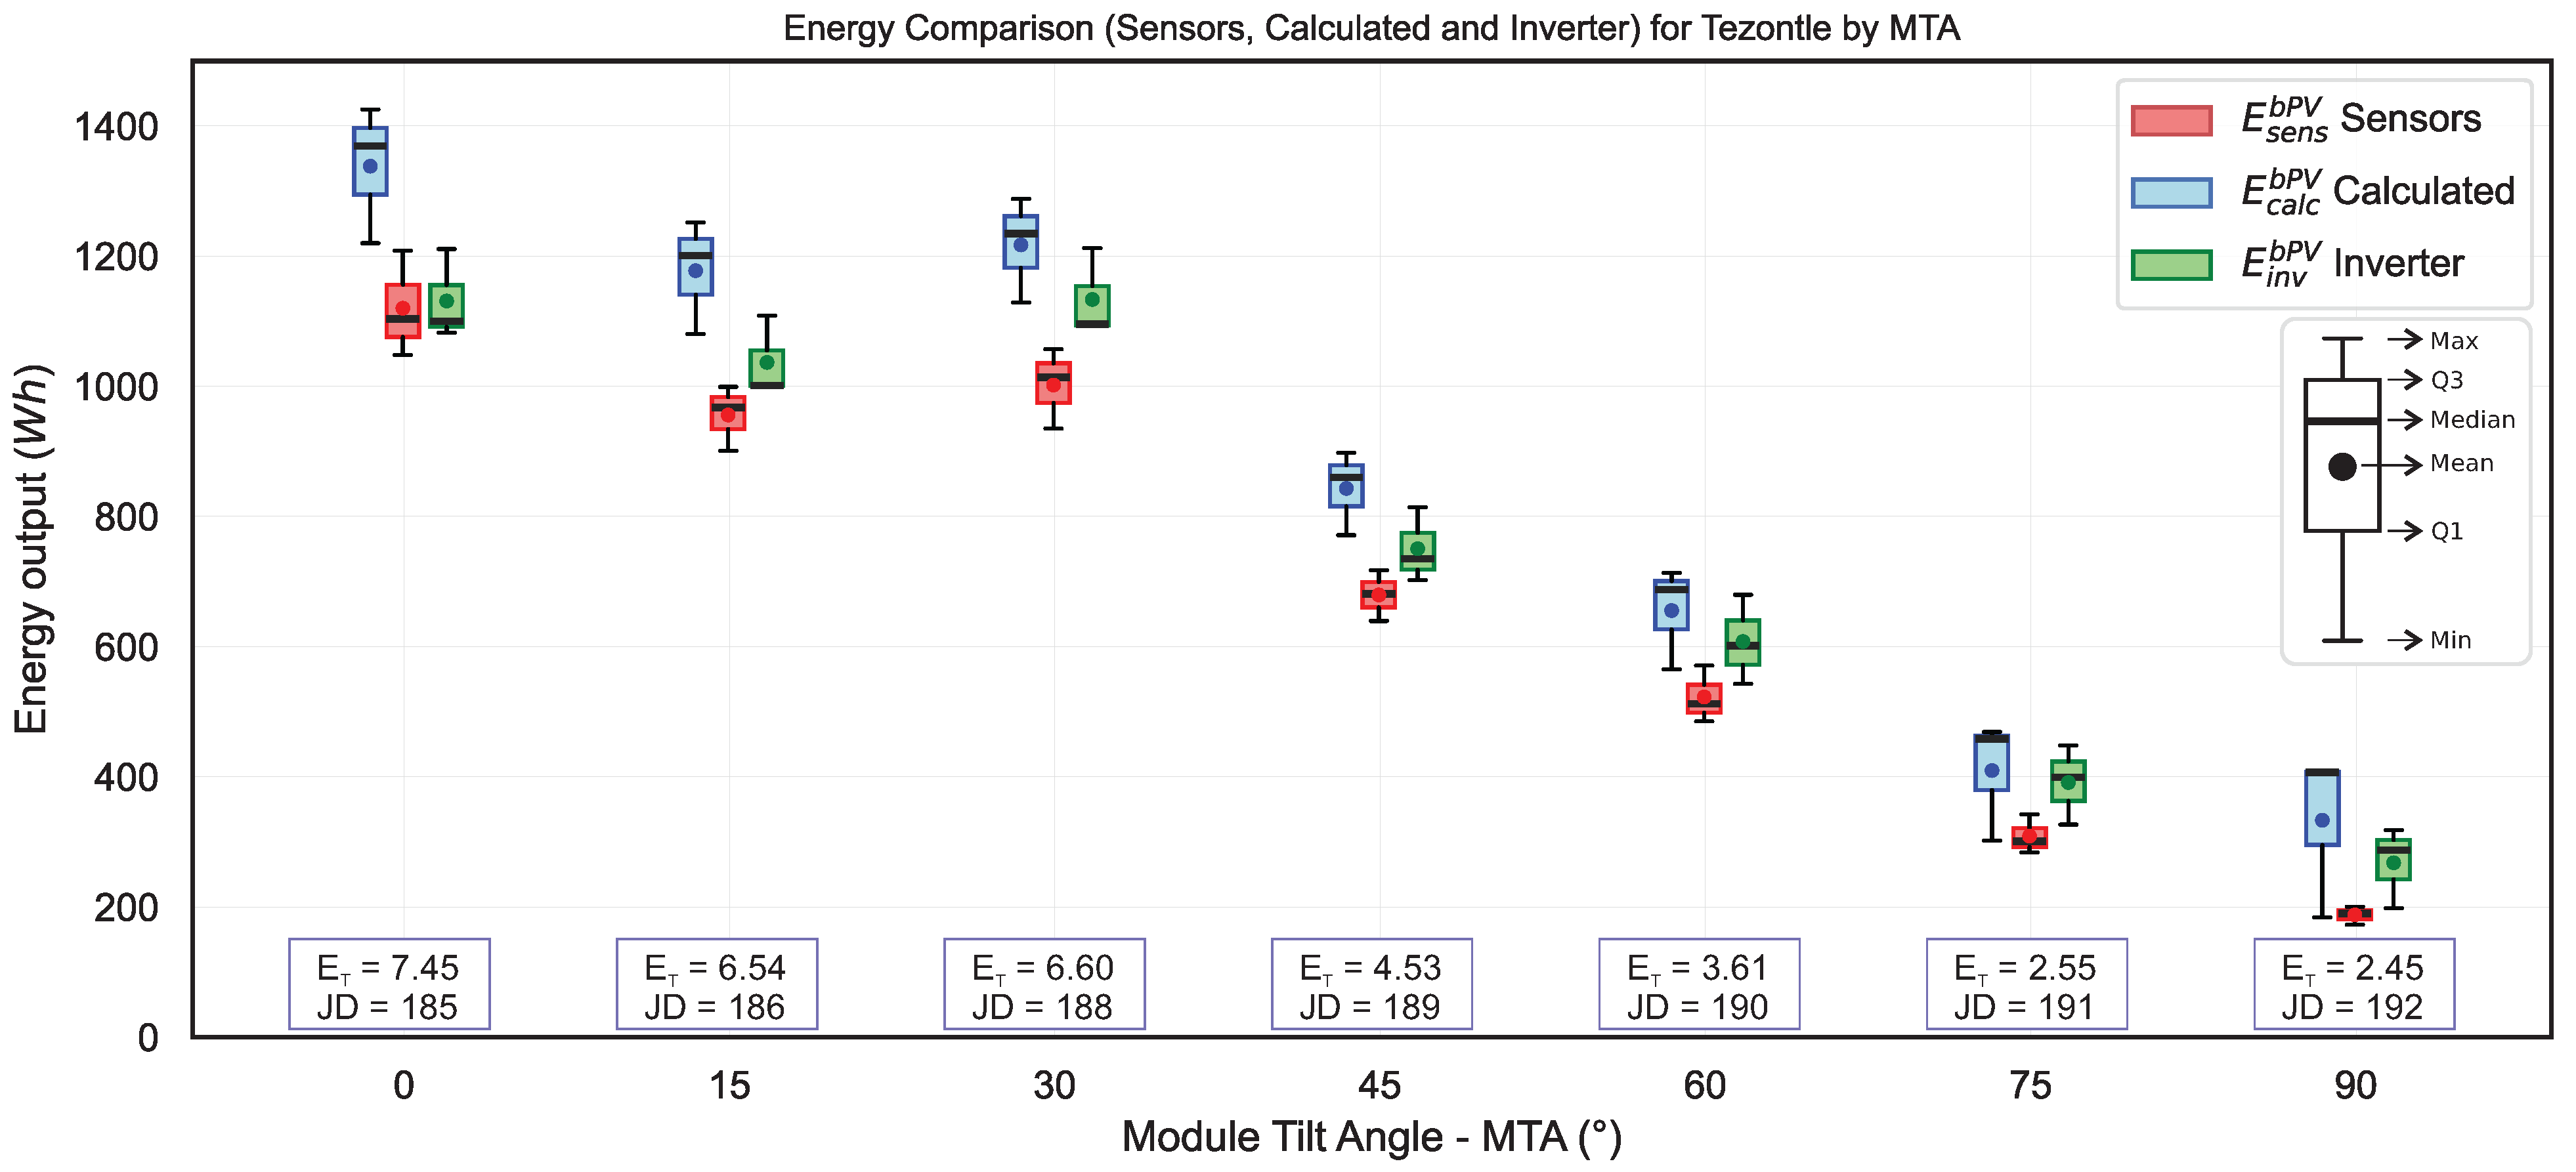
Figure 10 displays the energy generation behaviour of the bPV module at different MTAs, ranging from
to
. The maximum energy value is found when the bPV module is at
. This is not surprising, as the measurement dates correspond to the second week of early summer. Based on established knowledge [
47], the optimal tilt angle for a fixed south-facing collector that maximises solar capture in summer is given by (latitude (minus)
). In this case study, the location has a latitude of
, which means that the optimal tilt angle for maximum summer capture is
. Consequently, a tilt of
results in the highest solar energy capture and, therefore, the maximum energy generation.
- 4.
It was also determined that the bPV module at
and
generates more energy than those at MTAs greater than
(
to
). This occurs because the total incident energy density available on the front side (
) of the bPV module at
and
is greater than for the other tilt angles (see
Figure 9). Additionally, the energy generated at
is greater than at
because on this specific day (JD = 188), the total incident energy density was greater than on Julian day 186, when the power measurements were taken for
.
Furthermore, it is observed that the energy calculated by the model, after 10 a.m and until 3 p.m. tends to be higher than that during other time intervals, a possible effect associated by the measured rear irradiance. For MTAs greater than
(
to
), the calculated energy obtained from
Figure 9 (bPV power generated by the three procedures) and shown in
Figure 10 presents a decreasing trend for each respective angle. This decrease is due to reduced frontal incident energy density captured on the front side of the bPV module, with only the rear side contributing to energy generation.
As a result of the energy generation behaviour as a function of MTA, it is confirmed that the maximum energy generated by the bPV module during the summer season at the latitude at which this study was conducted is obtained when the MTA corresponds to the angle determined by the difference (latitude (minus) ). This angle is recommended as optimal for maximising energy capture in summer for fixed installations of mPV modules.
For all MTA variations, (see
Figure 10) the calculated energy (
) is higher than both the energy obtained by the sensors (
) and the energy reported by the inverter (
), due to the way that the rear side of the bPV captures the reflected irradiance
and the measured value for this parameter by the albedometer used in this experiment that was installed on the lower edge of the bPV module as recommended by the standard.
On the other hand, the differences observed between the energy obtained with the installed sensors and that reported by the inverter may be due probably of two issues: one of them, a lack of synchronisation between the time base used by the inverter to capture data, which is every 15 min, and the used by the installed sensors; and with this condition, could be that when the inverter capture current and voltage data, a higher irradiance may have occurred, resulting in values of greater magnitude than those obtained by averaging the measured data over 15 min intervals. Another issue could be the lack of calibration of the internal inverter sensors with respect to the external sensors installed.
Taking into account the above, the comparisons made between the energies obtained by the thermal model and those obtained with the installed sensors remain valid. In contrast, for mPV1, the difference between the calculated energy and sensor measurements is only 9.5%, indicating a much better model agreement.
5.5. Rear Irradiance in the bPV1
Based on IEC-TS [
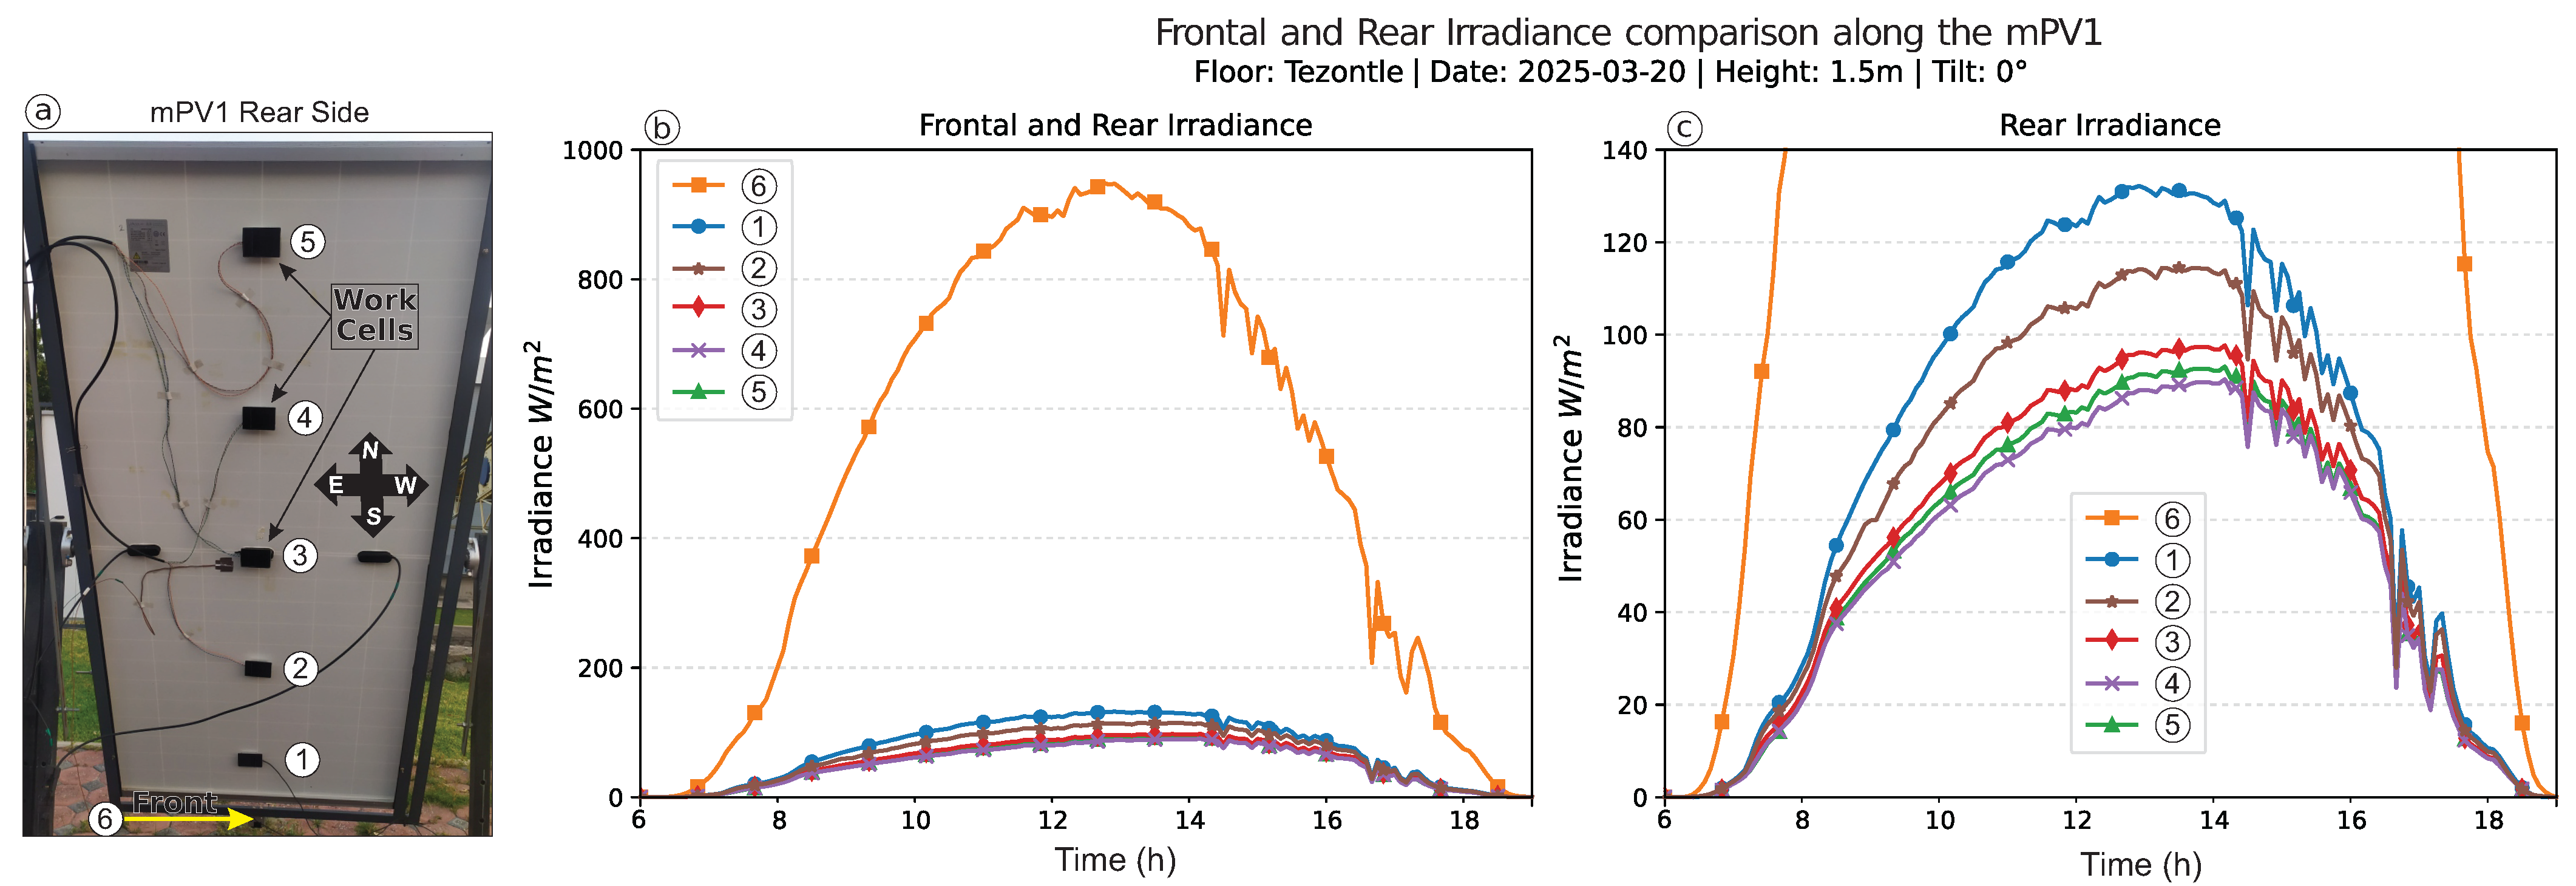
34], the suggested position for measuring the rear irradiance for a bPV is to place the albedometer at the lower edge of the module, which corresponds to the closest point to the ground of the module when it has any tilt angle. At this position, the sensor captures the reflected irradiance with higher values compared to other points on the rear side of the module. To verify this statement, five solar radiation sensors (working cells) were mounted on the rear side of the mPV (see
Figure 11a), and irradiance measurements data were taken for an MTA = 0° (horizontal position).
The behaviour of the measured frontal and rear irradiance data for a module at a height of 1.5 m with
Tezontle as a reflective material for 22 March 2025, which almost corresponds to the spring equinox, is shown in
Figure 11b, and a wide scale of rear irradiance is presented in
Figure 11c. For MTA = 0°, the lower albedometer has a full view of the ground, representing the full exposure of the reflective surface seen by the rear side of the bPV module. As shown in
Figure 11b, based on the shape of the frontal irradiance curve, the day was mostly clear. The behaviour of the rear irradiance shown in
Figure 11c indicates that the highest magnitude corresponds to the sensor #1, located at the edge of the module in the south position, showing a tendency to decrease as the measurement moves toward the north of the module.
As can be seen in
Figure 11c, even for a horizontal position, the rear irradiance captured by the module is not uniform. The contribution of the rear irradiance is higher in the cell located below position #1 at the edge of the module facing the south; this position is indicated according to the standard IEC-TS [
34]. According to
Figure 11a, the cell marked with position #1 receives the highest radiation contribution.
For this horizontal case, cell #1 has an energy density contribution of
kWh/m
2, which is 32% higher than the measurement zone closer to the centre of the module at the position of cell #4, with an energy density of
kWh/m
2. These data confirm the hypothesis that the position of the albedometer to measure rear irradiance, as suggested by IEC-TS [
34], does not provide the actual irradiance values observed by the bifacial module from the rear; for this specific case of
0°.
Since the albedometer is an equipment designed to be mounted on structures to see the sky and the ground coplanar and aligned between them, this geometric configuration is correct for measuring the albedos of reflective surfaces and has been presented in other standards [
48] and recommendations [
49]. However, this condition cannot be managed to measure the reflected irradiance from any ground surface for bPV modules due to the non-uniformity of rear irradiance, and even more so when the module is rotating on its central axis, changing the reflection height.
Due to the difficulty of measuring rear irradiance at multiple representative points in a bPV array, and given that the tests were carried out under summer conditions with clear skies over an optically stable material such as Tezontle with a horizontal albedo of 0.144, this difference 32% between the rear irradiance measured at the lower edge and the central point of the module could be considered a safety factor as a maximum limit for designers and installers. For practical purposes in dimensioning systems, it is suggested to apply this percentage to measurements taken from ground reflected irradiance (), especially when measurements were made at the lower edge of the module or array. This could provide a more realistic adjusted value as a practical mitigation strategy to avoid overestimating the power output of bPV.
5.6. Strengths, Weakness and Limitations
This study demonstrates several methodological strengths throughout its approach. Few studies on bifacial modules fully integrate international standards into their analysis, and even fewer explicitly address the critical verification and preconditioning processes required prior to operational testing. In particular, most research lacks adequate documentation of cell stabilisation procedures, which is particularly essential for PERC-type modules, and does not specify calibration protocols for measurement instruments used to assess current, voltage, temperature, and irradiance variables, which could limit the reproducibility of the results.
As with any field-based study, some limitations must be acknowledged. First, outdoor measurements are inherently sensitive to variability in environmental conditions, which can affect rear irradiance on different days. Second, a significant limitation influencing the final results is related to the temporal resolution of the data.
Although sensor data was originally recorded at 5 min intervals to comply with standard IEC 61724-1:2021 [
50] Class A requirements for high-accuracy PV monitoring, the inverter DTU captures data every 15 min. This discrepancy required us to average both the sensor and model data to this range to match the same scale and ensure consistency for comparative analysis. In agreement with the standard, this range represents the upper limit allowed for ground-based monitoring systems classified as Class B (medium accuracy) as the minimum resolution required for PV plant performance studies. This resolution smooths out very short transient effects, such as wind gusts and cloud cover, and helped us better represent the clear-sky conditions as possible. These transient effects could be considered in future research given the importance of distinguishing between clear, partially cloudy, and overcast day conditions with higher-precision Class A measurements. It is also recommended to know the uncertainties and precision of the internal current and voltage sensors of the DTU inverter.
Furthermore, many studies assume fixed values for bifaciality coefficients and surface albedo. However, these parameters fluctuate over time and in different environmental contexts. The durability and optical stability of reflective materials over time can have an impact on long-term energy gains. Future research should therefore consider dynamic modelling of these coefficients to capture their temporal variability more accurately.
This work has identified new research opportunities that could improve the information provided by manufacturers regarding the energy gain of bPV modules, as well as the guidance offered by IEC TS 60904-1-2:2024 [
51] regarding the electrical performance of bPVs.
6. Conclusions
This study represents an exhaustive technical analysis of the electric performance of a bPV module in terms of certain geometric installation conditions and a fixed albedo. The analysis was performed according to the standards dedicated to this technology. This study has taken into account some necessary steps prior to outdoor performance testing that have been overlooked in some studies. Initially, the modules were preconditioned to stabilise the solar cell, followed by laboratory tests with a solar simulator to obtain bifacial coefficients to be used in the thermal performance model.
The following findings were observed: no visible defects were detected in the modules under study and no microcracks were identified by electroluminescence imaging.
After preconditioning, the indoor test results obtained from the STC I-V curve in front-side illumination show no more than a 5% difference between the measured and those provided by the manufacturer, electrically guaranteeing that bPVs remained unaffected throughout the supply chain and that the test results are highly reliable. The electrical performance of the bPV in STC showed values of W for the maximum power of the front, W for the maximum power of the rear side and a bifacial coefficient , approximately 5.2% higher than the values provided in the manufacturer’s datasheet. In addition, following IEC-TS it was found for rear irradiance lower than 200 W/m2 that the slope of the straight line P vs. named the BiFi coefficient for the bPV module under study has a value of W/(W/m2), and the equation that could provide the total power generated by the bPV module is .
No significant discrepancies were found between the electrical values provided by the manufacturer and those measured indoors. However, the rear power table supplied by the manufacturer lacks clarity on its derivation method, and current estimates can show discrepancies that exceed 5.2%, as illustrated in
Table 3. We suggest that instead of providing a table with estimated power percentages based solely on front-side cell characteristics (which lacks actual rear-side experimentation), the manufacturer should provide the module’s characteristic equation Equation (
2) that includes the BiFi coefficient.
Ideally, manufacturers should provide more comprehensive technical data to allow the design and calculation of PV plants to better reflect real performance conditions. Given the inherent complexity of manufacturing processes and solar cell variability, and the extensive procedure demonstrated here to obtain the BiFi parameter according to the standard, manufacturers must facilitate a standardised BiFi report, include the BiFi parameter in the datasheet or in the .PAN file, or provide detailed batch-specific performance parameters. This is crucial because, as illustrated in
Table 3, current estimates can show discrepancies that exceed 5.2%.
For outdoor tests aimed at studying the electrical performance of the bPV modules, a previously designed structure was used that allows the installation of three PV modules at different tilt angles and heights. Two bPV modules and one mPV module were used for comparison purposes. These were installed on the structure so that the bPV module under study was placed between the other two modules. Following the specifications of the IEC-TS 60904-1-2 standard, an albedometer was installed coplanar to the surface of the modules to measure both the global front-side irradiance and the reflected irradiance from the ground surface, which affects the rear side of the bPV module under study. The measured irradiance behaviour yielded the following results:
(a). For a fixed height of 1.5 m and varying the tilt angle of the modules, it was determined that, for the site’s latitude during the summer season, the total energy captured by the albedometer—given by the sum of front and rear energy—is maximised at a tilt angle of
0°, which is close to the recommended tilt angle for the maximum capture of the front side in summer, , for locations with latitudes between 15° and 30°. (b). A decreasing trend in total captured energy was also observed as the tilt angle increased from 0° to 90°. (c). No significant change in energy values was found when the height was increased to 2 m.
In turn, to measure the maximum power generated by the bPV module, three different data collection methods were used: the first with independent calibrated sensors, the second with data provided by the inverter, and the third with the use of a thermal performance model. The data collected are on the same daily scale for comparison.
As MTA changes from a horizontal to vertical position, its AOI increases. An ideal condition is to maintain a low AOI during the day, which implies perpendicularity of the sun’s rays. As MTA increases, it is observed that it loses frontal radiation at angles greater than 45°. As can be seen in
Figure 7a where there are almost no variations in frontal radiation for a condition between 0° and 30° of inclination, the relationship between
(albedo) remains within the typical ranges of material
and
. However, for the high values of 60° and 75° of the MTA, the gain of
is relatively higher, with albedos of
for the case of inclination of 75°, but with a loss of frontal radiation that barely reaches 200 W/m
2.
The comparison of the three methods analysed reveals that the results obtained from the current and voltage sensors, the inverter, and those calculated through the model that is a function of the rear irradiance show an average energy overestimation of 27.6% for bPV1 and 12.4% for mPV1. The BTPM is a linear and computationally economical approach that stands out for its simplicity for fast and practical applications. The overestimation obtained is influenced by the () factor, which expresses the relative gain of a bPV versus a mPV, as seen in the comparison between the two types of modules. The location of the rear radiation sensor on the lower edge of the module—as indicated in the standard—is also a determining factor in the observed increase as evidenced by the non-uniformity of the irradiance. Since it was determined that the rear irradiance captured on the rear side of the bPV module is not uniform, with almost a difference of 32% between the horizontal position of the albedometer and the centre of the module on the rear side, this overestimation of 27.6% remains within this expected margin for a horizontal position. Likewise, the BTPM linearly relates current and irradiance, considering only thermal losses, which partly explain the overestimation, which can be interpreted as a maximum limit. By incorporating additional losses (optical, electrical, or shading), this would tend to decrease.
We found various opportunities to improve the information that the updated IEC-TS 60904-1-2:2024 standard provides, as well as the bifacial module manufacturers. First, the standard shows the location of the albedometer at the lower edge of the bPV through a figure without any geometric specifications, such as height or depth. The findings could prove that the irradiance distribution exhibits significant non-uniformity across the rear surface of the bPV module, so the lack of a geometrically clear specification of the standard for the positioning of the albedometer could provide erroneous readings between researchers that do not accurately represent what the entire back surface of the bPV experiences along its longitudinal extension.
Furthermore, for laboratory conditions, the standard neither specifies nor recommends any type of anti-reflective material for the rear side, despite indicating that the non-reflective surface should not exceed 5 W/m2, leaving two areas for improvement to suggest for a standard that already presents significant technical challenges in itself.
However, manufacturers could provide information about the power gain as a function of the bifacial coefficient
or the rear bifacial power gain (BiFi) using Equation (
2). However, these equations require the value of the irradiance reflected by the surface albedo, a parameter that should be provided by the manufacturer along with a recommended value to optimise the generated power.
The results of the bifacial power output in this study are applicable to a range of latitudes between 15° and 30° that correspond to the geographical region of study (Mexico), where the latitudes of the northern and southern cities of the country are located. Since empirical models of radiation or temperature were not used, but experimental measurements were, the results should not be extrapolated without specific validation in other latitudes or without the verification of radiation models in such contexts. However, the experimental design included the evaluation of different inclinations of the modules in order to cover a representative range that may be of interest at other latitudes, taking into account similar weather conditions.
