Article

A Numerical Investigation of the Trade-Off Between Sound Insulation and Air Ventilation for a Partially Open Door

1
School of Thermal Engineering, Shandong Jianzhu University, Jinan 250101, China
2
School of Transportation Engineering, Shandong Jianzhu University, Jinan 250101, China
*
Author to whom correspondence should be addressed.
Eng 2025, 6(9), 223; https://doi.org/10.3390/eng6090223
Submission received: 23 July 2025 / Revised: 23 August 2025 / Accepted: 1 September 2025 / Published: 3 September 2025
(This article belongs to the Section Chemical, Civil and Environmental Engineering)

Abstract

As urban buildings become increasingly dense, indoor personnel are often exposed to noise disturbances from adjoining rooms which can reduce working efficiency and affect mental health. Closing the door is one of the ways to reduce noise transmission, but it can cause a decrease in indoor air circulation. This paper investigates the sound insulation effect and air ventilation performance of a door in a partially open state by numerical simulation. To acquire the effect of sound insulation, an acoustic–structural solver is employed to calculate the sound transmission losses with different door opening angles in the frequency domain. To evaluate the ventilation performance, the mass flow rates across door opening are calculated by computational fluid dynamics. The simulation results confirm the trade-off relation between the sound insulation effect and the ventilation performance. To calculate the effect of noise and ventilation on work efficiency, a comprehensive evaluation index workplace environmental score (WES) was introduced and calculated by the Technique for Order Preference by Similarity to Ideal Solution (TOPSIS) method. A clear sound insulation effect corresponds to an opening angle (θd) of less than 15° with minimum air ventilation. Good ventilation performance could be obtained when the door opening angle is larger than 45°, while the sound insulation effect is negligible. A good compromise between the sound insulation effect and the air ventilation performance is found to be in the range of θd = 15°~25°, which provides practical recommendations in daily routines.

1. Introduction

With the acceleration of urbanization, buildings are becoming increasingly dense, and occupants are more often exposed to noise disturbances from adjoining rooms [1,2]. These noise disturbances can reduce people’s working efficiency [3,4,5]. However, closing the doors between rooms to create a quieter environment would reversely lead to a degradation of air circulation and quality that can also affect the physical and mental health of occupants [6,7,8].
The insulation of sound by doors has received interest from acousticians and has turned out to be an important factor in the design, construction and maintenance process for buildings [9,10]. Generally, sound transmission through doors is considered twofold: the structural transmission and the leak transmission, and they are of equivalent importance. As a part of the walls, fundamental studies on the structural sound insulation by doors rely initially on the theories concerning panels. According to Sharp’s theory [11], the acoustic impedances of thin, thick and multi-layer panels are related with the stiffness and mass of the panel in different frequency ranges. Later, Hongisto [12,13] specified and verified the prediction models for realistic door structures such as double panels with an air cavity, rigid connection, and absorbents. Soni et al. [14] experimentally examined the sound transmission loss through composite panel doors with different panel materials. By comparison, it was found that a better sound transmission class could be obtained with good design of the inner configuration. Besides structural insulation, it is also found by researchers that sound transmission due to leakage is another important factor that influences the total sound insulation of doors. This research direction has also yielded many studies starting from the empirical formulae by Gompert [15,16] and Wilson et al. [17] on the characteristics of sound leakage through gaps and slits in walls. Based on these formulae, Hongisto provided specialized prediction models in the context of doors. Then, improvements on the sound insulation of door sets with slits were proposed with sealings such as absorbent treatments [18,19,20] and special structural silencer [21].
On the other hand, ensuring adequate air ventilation is equally critical for a healthy indoor environment. Working in rooms with low air quality can reduce work efficiency and affect physical and mental health [22,23], making natural ventilation a common necessity. While the strategic opening of doors and windows is a widely used method to improve the indoor thermal environment and air exchange [24,25], its effectiveness is governed by complex dynamics. For instance, recent studies highlight how external factors like wind flow can create unfavorable pressure conditions that impair ventilation performance [26]. In parallel, innovative passive systems, such as the Trombe wall, have been developed to enhance air circulation without mechanical aid [27]. There is a direct trade-off between the inherent complexity of achieving good ventilation and acoustic control, as simple ventilation measures can also provide clear pathways for sound transmission.
It is acknowledged that the challenge of balancing acoustic comfort and natural ventilation is a complex, multi-scale problem influenced by numerous factors, from architectural design to urban traffic, as rightly pointed out by environmental comfort researchers [28]. A single measure, such as adjusting a door’s opening, cannot holistically solve these large-scale issues. Therefore, the present study does not aim to propose the partially open door as a universal, practical solution. Instead, it utilizes this geometry as a canonical, simplified model to achieve a more fundamental objective of precisely isolating and quantifying the basic physical trade-off between sound insulation and air ventilation. By focusing on this elemental case, we aim to establish a robust methodological framework—coupling computational fluid dynamics, acoustic simulations, and multi-criteria decision analysis—that can later be applied to more complex, real-world scenarios such as specialized ventilation louvers or smart window systems.
Previous studies have focused more on evaluating the acoustic performance of doors when they are closed, and the sound insulation and ventilation performance of doors when they are partially open remains an unresolved issue [29]. However, in our daily routines, we sometimes want doors to be partially open to maintain good air circulation between rooms, while still requiring doors to have sufficient sound insulation. In this study, the above issue is investigated by means of numerical simulation. In detail, the acoustic and flow fields of one partially open door in a wall are simulated with the acoustic–structural solver and Computational Fluid Dynamics (CFD) solver separately to acquire the door’s sound insulation characteristics and the allowed flow rate through the door set. By changing the opening angle of the door, the sound insulation and ventilation performance of partially opened doors can be obtained. In order to more systematically assess the combined effects of door opening angles on noise propagation and air quality in buildings, and to quantify their effects on work efficiency, this study introduces a new comprehensive evaluation parameter, the Workplace Environmental Score (WES); the weight values are calculated using the Entropy-Weight Technique for Order Preference by Similarity to Ideal Solution (TOPSIS) method. This index provides data support for optimizing the door control design through multi-dimensional quantitative analysis.

2. Methodologies and Validation

Figure 1 illustrates the flowchart of this study. The first step is to build the two-room model. The second step is to numerically evaluate the acoustic and ventilation performance of the partially opened door. We used an acoustic structure solver and a CFD solver, respectively. The acoustic–structural solver calculates the sound field in a two-room reverberant–anechoic configuration. Since sound energies could enter the receiver room either by traveling across the door opening or by a transmission through the door body, the acoustic–structural solver actually takes account the interaction between the sound field and the vibration of the door body. The CFD solver is responsible for providing predictions of mass flow across the door opening. The third step is the calculation of WES by the TOPSIS method.

2.1. Geometry of the Investigated Model

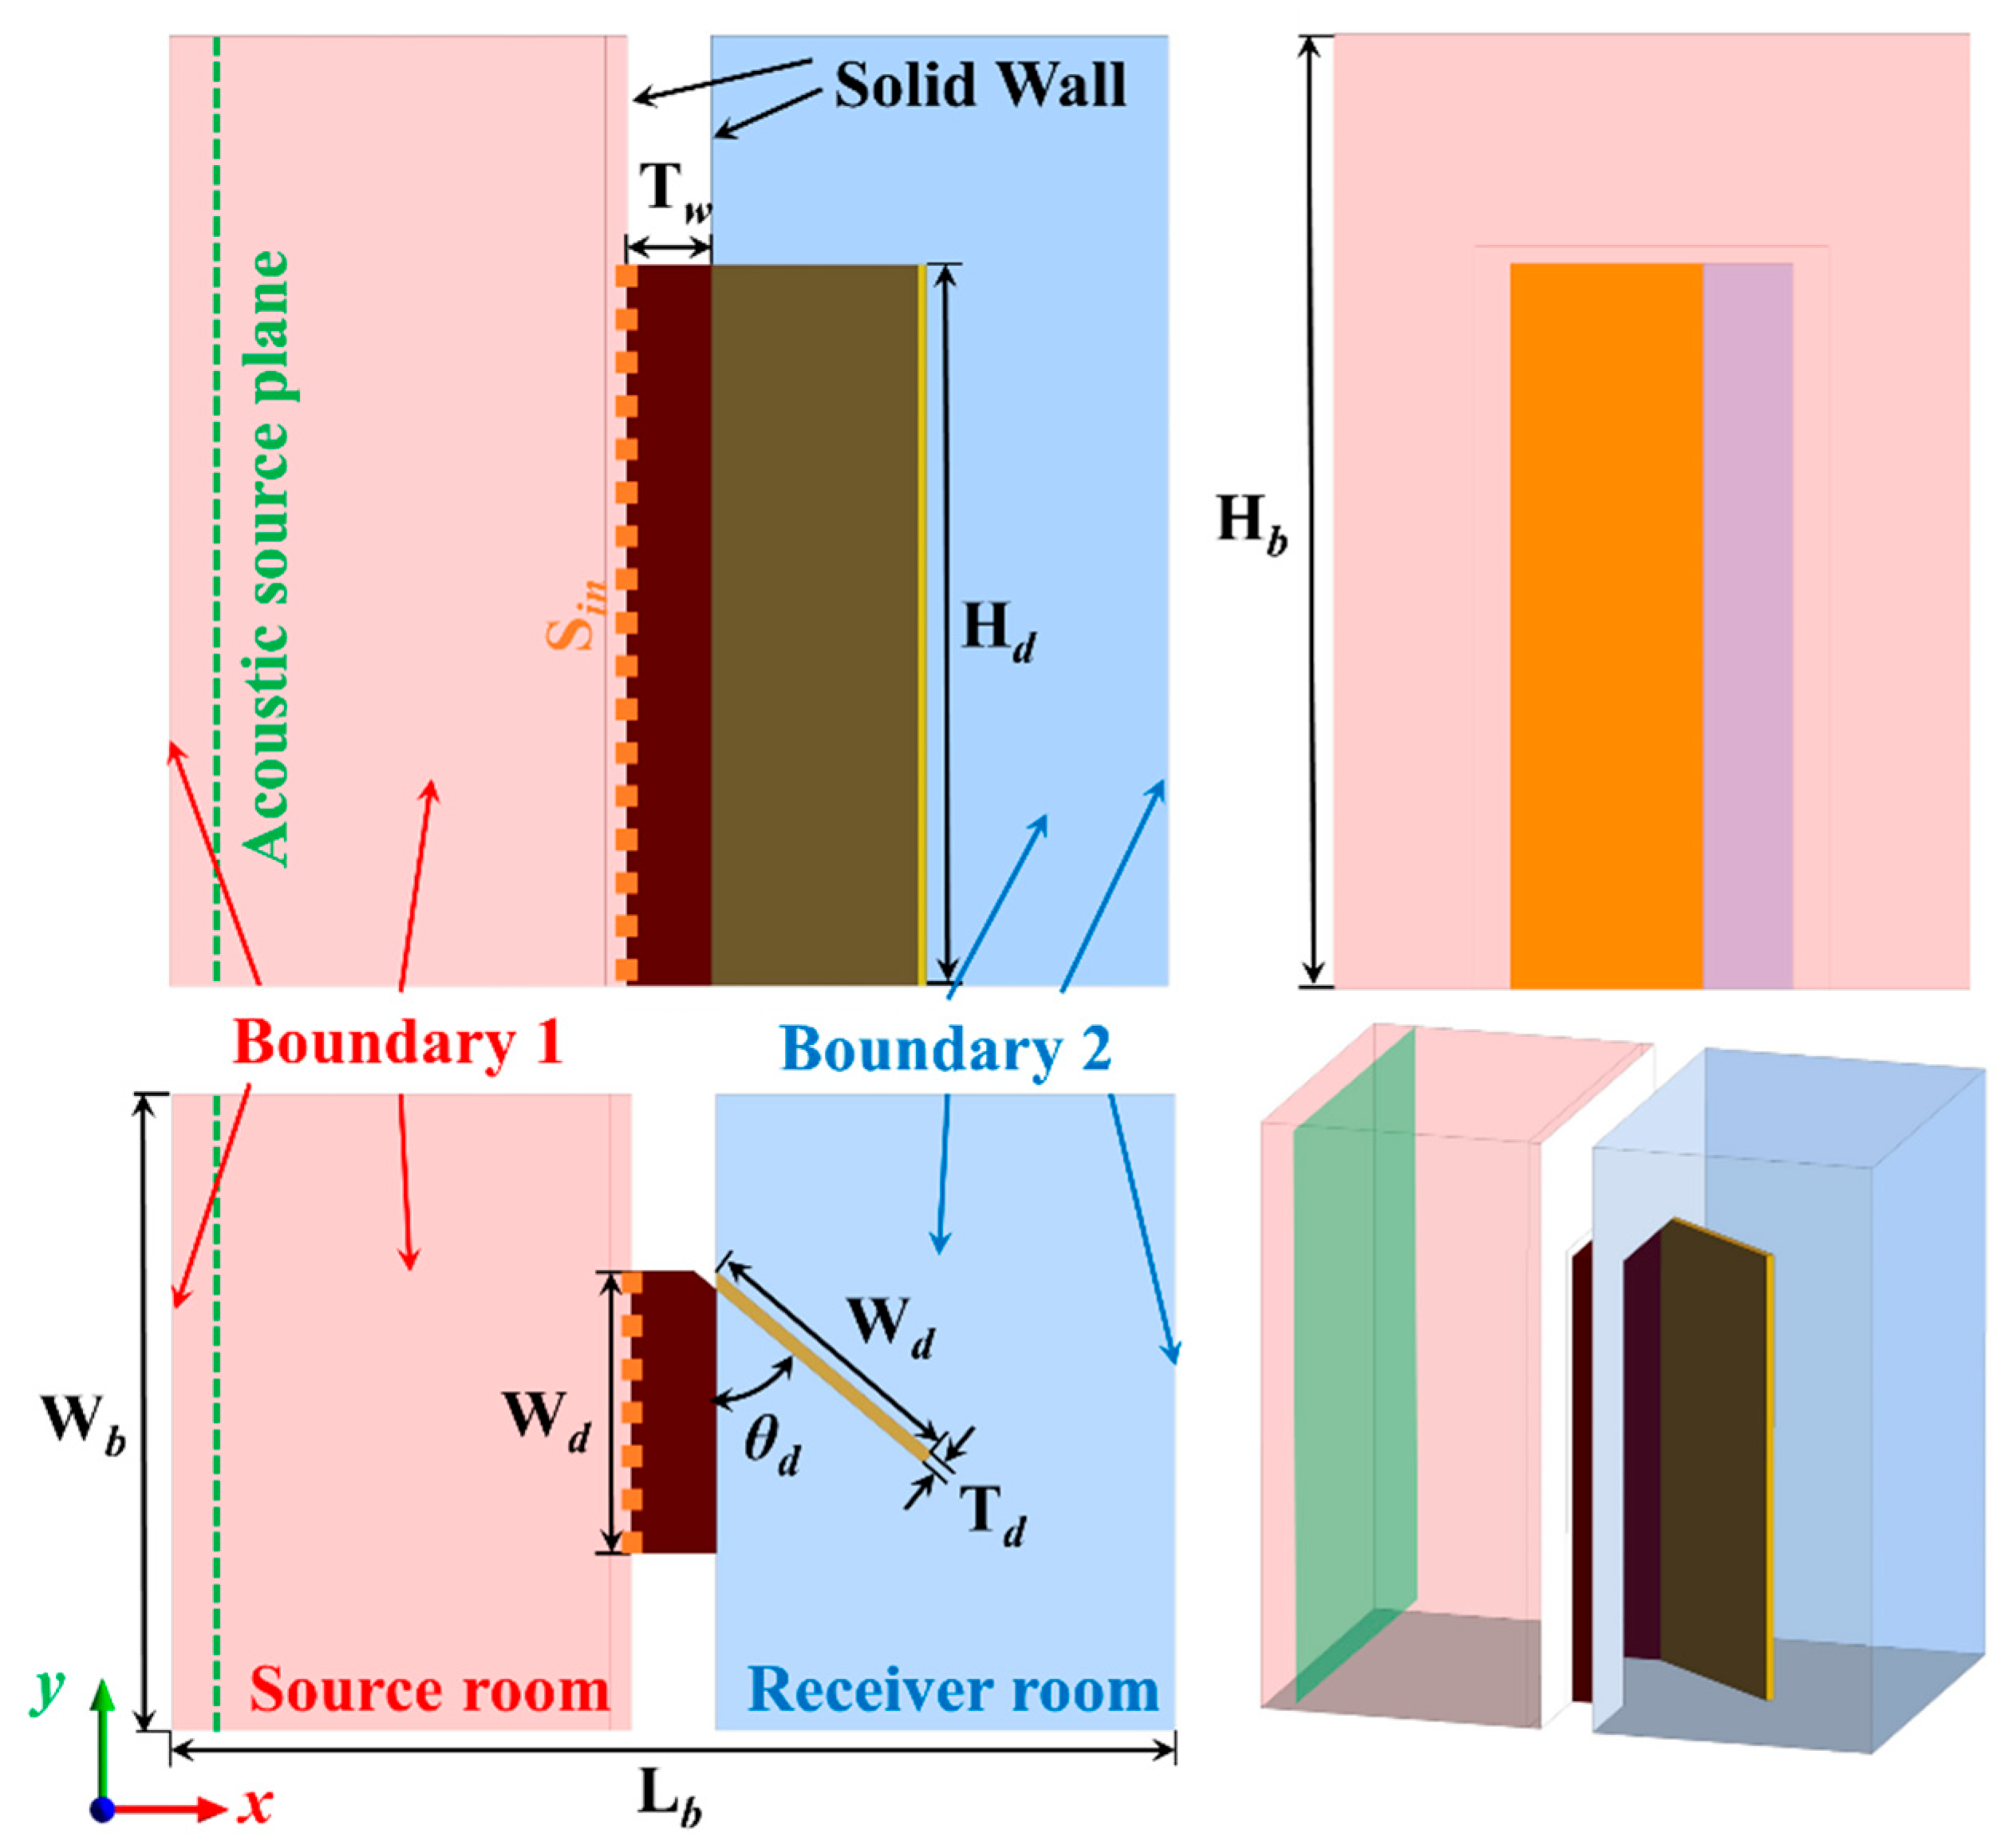
The numerical model investigated in this paper concerns two rooms separated by one partially open door mounted in a wall as is shown in Figure 2. The door leaf is Hd = 2.05 m in height, Wd = 0.8 m in width, and Td = 0.04 m in thickness. It is assumed that the door is made of Walnut with a density of ρd = 532 kg/m3. The wall has a thickness of Tw = 0.24 m. The domain of simulation has a dimension of Hb = 2.7 m, Wb = 2.2 m, and Lb = 3.4 m, which is limited by the boundary surfaces. For acoustic–structural simulations, a reverberant–anechoic configuration is employed according to ISO 10140-3 [30]. In particular, the acoustic boundary conditions of the simulation domain follow the standardized laboratory test setup described in ISO 10140-3, where the source side is modeled as a reverberant room and the receiving side as an anechoic room. This approach ensures that the numerical results are comparable to standardized sound insulation measurements of building elements. For flow simulations, the outer boundaries are treated as pressure inlets/outlets. Detailed geometric parameters are listed in Table 1.

2.2. Numerical Methodologies

2.2.1. Acoustic–Structural Solver and Settings

The simulation of sound insulation by doors is conducted by an acoustic–structural solver based on the finite element method (FEM) in the frequency domain. The solver couples the acoustic field and the structural vibration of the door body. The acoustic part of the solver solves the Helmholtz equation, Equation (1), in the air domain Ωa and the structural part solves the fundamental equation of motion, Equation (2), on the door leaf Ωa [31].
p a + k 2 p a = Q m   i n   Ω a
ρ d ω 2 u S = F v e i ϕ     i n   Ω d
where pa denotes the acoustic pressure and k denotes the wavenumber of the sound. The term Qm represents external pressure source. In Equation (2), u is the vibration velocity of the structure. S is the stress tensor of the solid that is expressed as S   =   E d σ . σ is the strain tensor of the solid. In the case of linear isotropic material, it is written as σ   =   λ I : ϵ + 2 μ ϵ where ϵ   =   1 / 2 ( u T + u ) . Fv is the external force exerted at the interface between the air domain and the door leaf.
In the air domain, the sound source is defined as a sum of 2N uncorrelated planewaves moving in the positive x direction and negative x direction with random wavenumbers on the source surface indicated in Figure 2. The acoustic pressure on the source plane is defined as [32,33]:
p s = A 2 N n = 1 N exp ( i k n , x x   +   k n , y y   +   k n , z z ) e i ϕ n + A 2 N n = 1 N exp ( i k n , x x   +   k n , y y   +   k n , z z ) e i ϕ n
where kn,x, kn,y and kn,z are calculated by kn,x = cosθn, kn,y = sinθncosφn, kn,z = sinθnsinφn; A is the amplitude of the planewaves. θn, φn and ϕn are random variables. The surfaces of Boundary 2 indicated in Figure 2 are set to have a perfectly matched layer (PML) attached to them; A is the amplitude of the planewaves. θn, φn and ϕn are random variables. The surfaces of Boundary 2 indicated in Figure 2 are set to have a perfectly matched layer (PML) attached to them. This PML absorbs all the outgoing sound waves without reflection, which creates an anechoic condition in the receiver room. The surfaces of Boundary 1, the floor and the wall are set to be acoustically rigid which creates a diffused condition in the source room.
The body of the door leaf is considered to be made of linear isotropic solid material whose motion is solved with Equation (2). To couple the solution of the acoustic field and the structural vibration, the surfaces of the door are set as interfaces that pass the solutions between the acoustic solver and the structural solver.
The STL, which is used to quantify the insulation of sound by doors, is defined as the ratio of the total incident power Pin relative to the total transmitted power Ptr as shown below:
S T L = 10 log 10 ( P i n / P t r )
P i n / t r = p r m s 2 4 ρ 0 c 0 S i n / t r   w i t h   p r m s 2 = 1 2 p p *
where Pin is incident power. Ptr is transmitted power. The surface for incident power is Sin, as indicated in Figure 2, and that for transmitted power is Boundary 1.

2.2.2. CFD Solver and Settings

The prediction of flow rate across the door opening employs a CFD solver with a standard k- ε turbulence model, which solves the incompressible viscous steady Navier–Stokes equations. To drive the air flow across the door opening, a pressure difference is applied between the source room and the receiver room. In the source room, Boundary 1 in Figure 2 is set as a pressure-inlet with a positive total pressure pin. In the receiver room, Boundary 2 is set as a pressure-outlet with zero total pressure pout = 0 Pa. All the other boundaries in the model are set to no-slip wall condition. The flow rate across the door opening is monitored during the steady-state simulation, and the solution is considered converged when the flow rate changes negligibly with simulation iteration.

2.3. Workplace Environmental Score

To comprehensively evaluate the impact of indoor noise and air quality on worker performance, the Entropy-Weighted TOPSIS method was employed. Through normalization and weighting calculations, multiple influences were normalized to a single WES, and the higher this score, the greater the positive impact of the indoor environment on work efficiency. The Entropy-Weighted TOPSIS method specific calculation Formulas (6)–(12) is as follows: before analyzing the data for matrix construction and assuming that there are m evaluation objects and n evaluation indicators, the evaluation matrix X is:
X = ( x i j ) m × n
The matrix is later normalized to obtain the normalized matrix (dij)m×n:
d i j = x i j i = 1 m x i j 2
The information entropy ej for each indicator is calculated as:
e j = K i = 1 m d i j l n r i j , K = 1 l n m
The weight wj of each indicator is calculated as:
w j = 1 e j j = 1 n 1 e j
The weighting for noise is calculated to be around 0.68, and the weighting for air quality is calculated to be around 0.32, but Deng et al. [34] found that air quality has a greater impact on work efficiency than noise, and set the weights for air quality to be 0.6 and for noise to be 0.4, which were compared with the weights obtained by the Entropy-Weighted TOPSIS method.
The normalized matrix is weighted by the weight values, and the maximum and minimum values of the indicators in each column constitute the positive and negative ideal solutions U+ (U+ = [u1+,u2+,⋯,un+]) and U(U = u1,u2,⋯,un). The Euclidean distance is calculated from the ith evaluation system to the positive ideal scenario and the negative ideal scenario. The Euclidean distance to positive ideal scenario Di+ and Euclidean distance to negative ideal scenario Di are as follows:
D i + = j = 1 n [ u i j u 0 j + ] 2
D i = j = 1 n [ u i j u 0 j ] 2
The WES calculation formula is as follows:
W E S i = D i D i + + D i

2.4. Validation of the Acoustic–Structural Solver

A closed-door configuration is used to explain the validity of applying the acoustic–structural model to solving the phenomenon of sound propagation and transmission across the door. In this closed-door configuration, the sound waves in the source room could only reach the receiver room by traveling through the body of the door leaf. This is a standard configuration to experimentally and numerically test the sound insulation performance of panels [18,35].
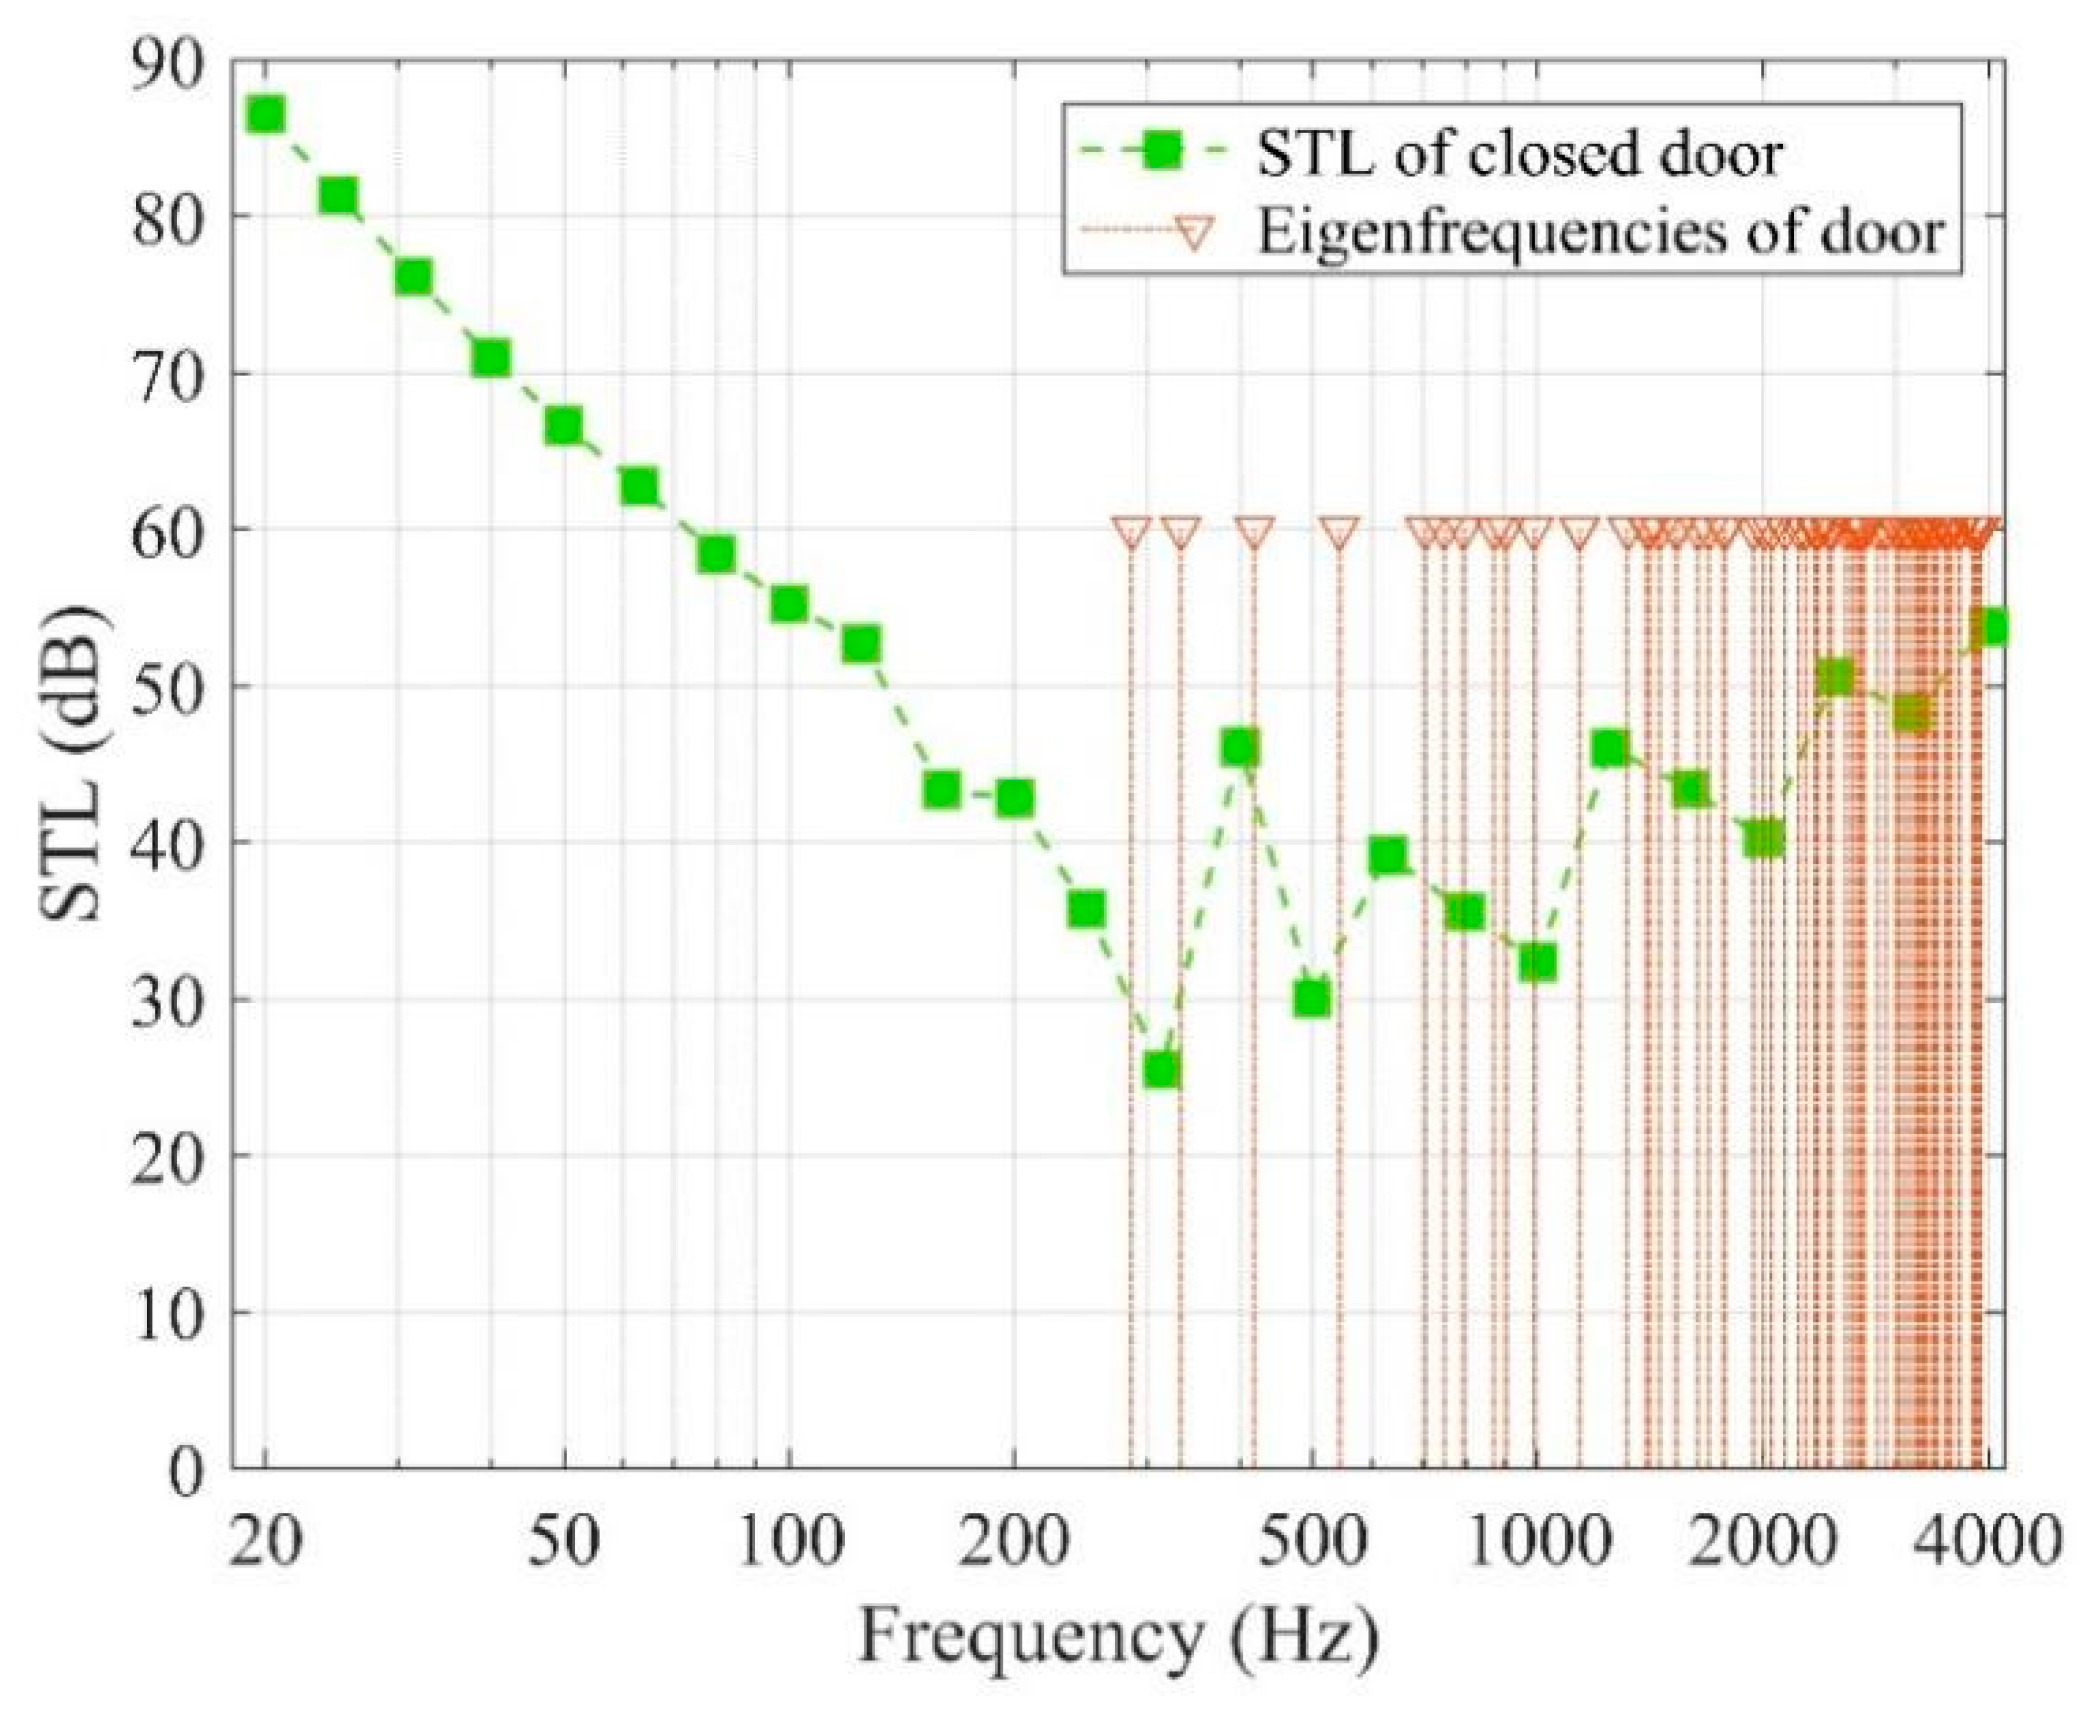
Figure 3 plots the frequency-dependent sound transmission loss simulated with the current model. It could be noted from the figure that the STL decreases from 20 Hz to 315 Hz with a gradient of approximately 4.3 dB per 1/3 octave band. This region is the so-called stiffness-controlled region in the low-frequency range. The STL reaches its minimum value at 315 Hz, which is near the 1st and 2nd eigenfrequencies of the door leaf. This phenomenon corresponds to a resonance behavior of the door where the frequency of the incident sound wave and the eigenfrequencies of the structure coincide. From 315 Hz up to over 4000 Hz, the STL increases 1.7 dB per 1/3 octave band, with some fluctuations in value. The increase in STL with frequency is the so-called mass effect, and the fluctuations in STL are caused by resonance of the door leaf with the incident sound wave.
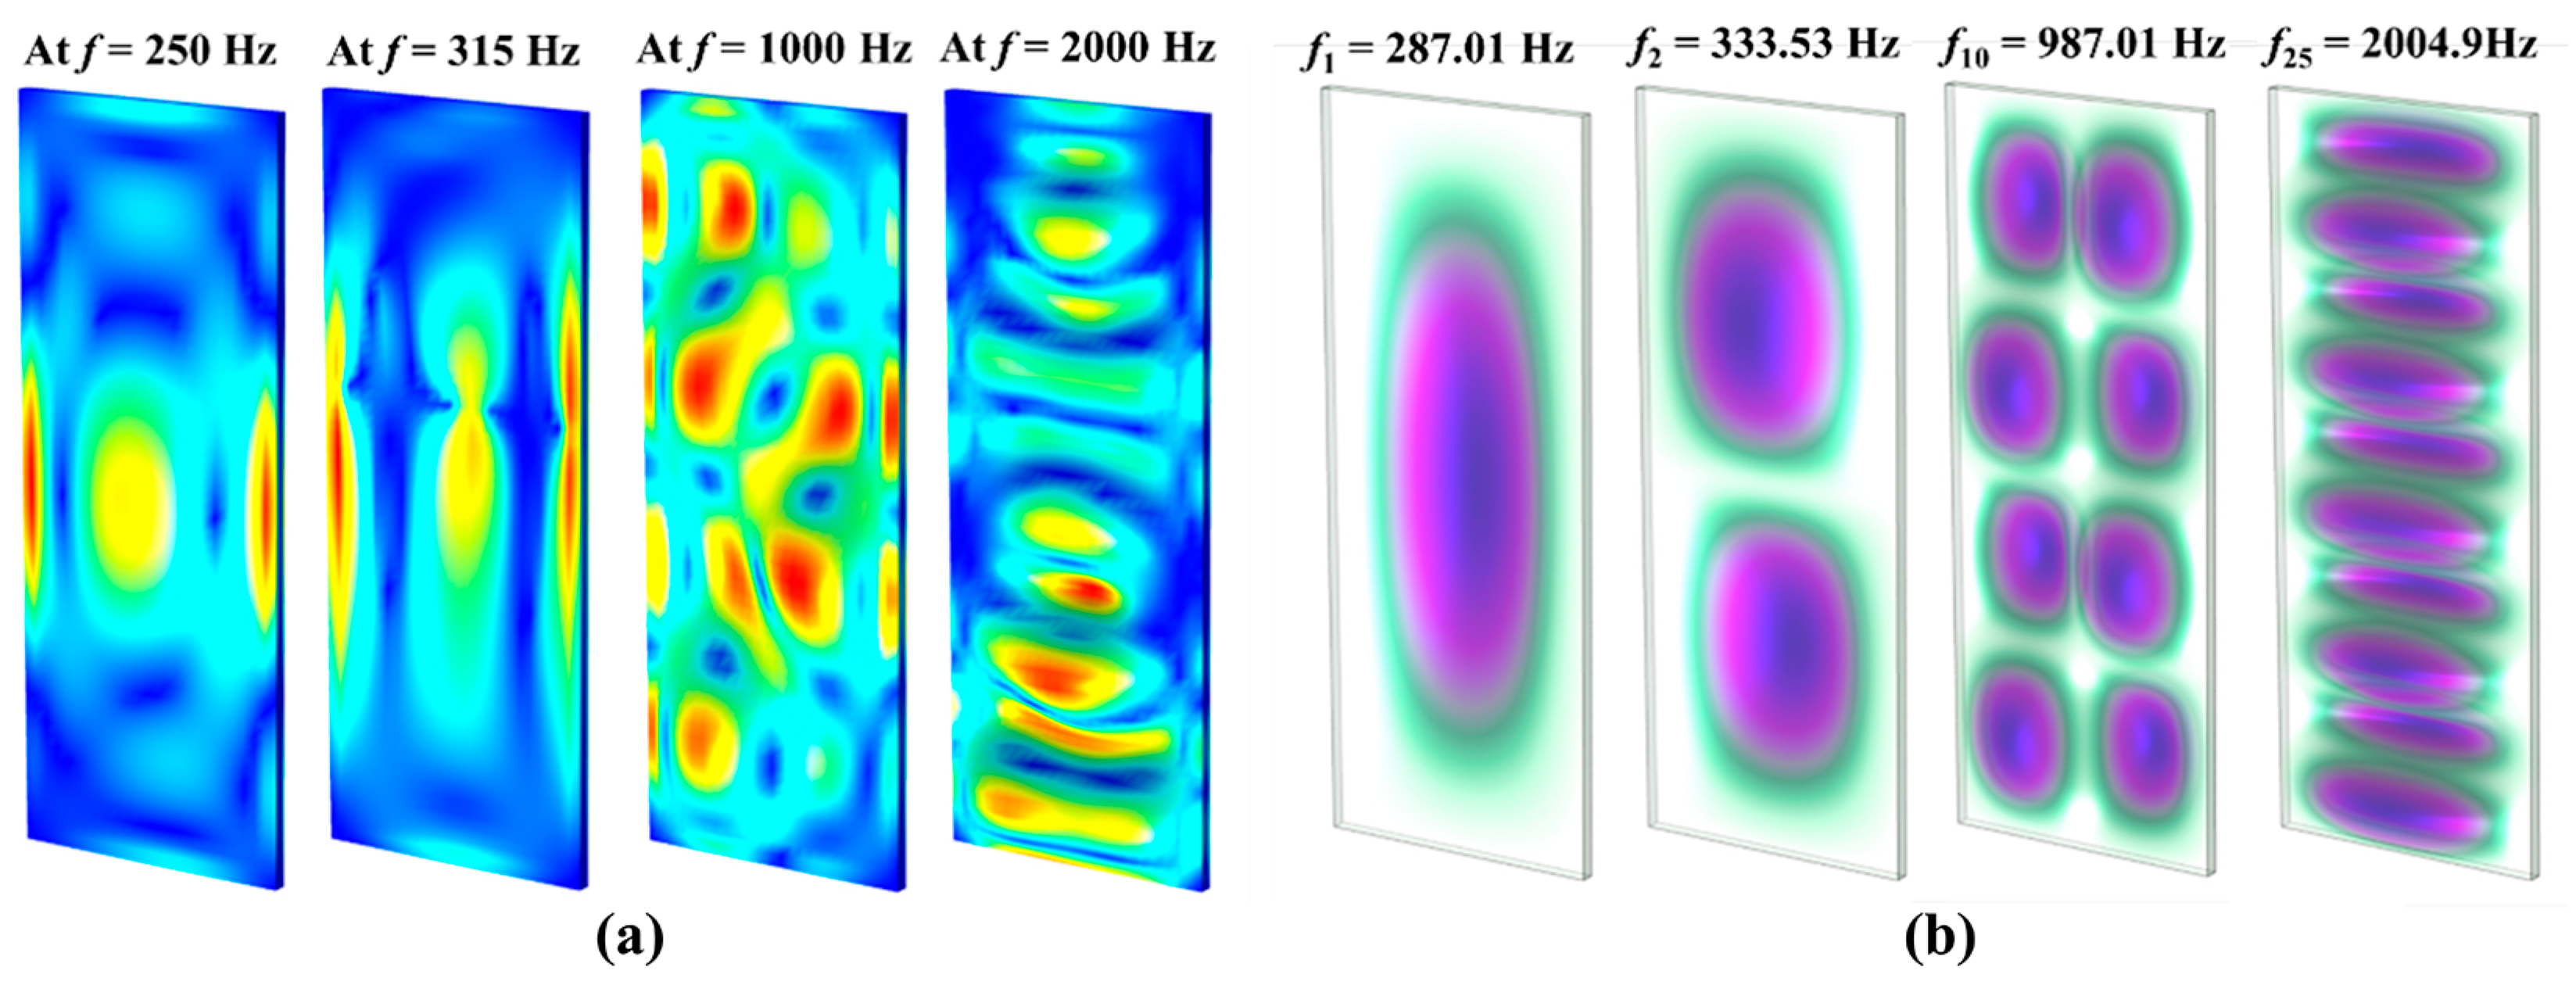
Figure 4 plots the stress contours on the door surface and the eigenforms of the door leaf in the resonance region. At the 1/3 octave band frequencies of 250 Hz, 315 Hz, 1000 Hz and 2000 Hz, it could be observed that the forms of the stress on the door surface are similar to the eigenforms of the door leaf at nearby eigenfrequencies. This coincidence confirms that, at these frequencies, the eigenmodes of the door leaf are excited by the incident sound waves. The excited door leaf becomes a good sound transmitter that transmits the sound from the source room to the receiver room due to resonance.

3. Results

3.1. Sound Transmission Losses with Different Opening Angles

To explore the sound insulation performance of a partially open door, acoustic–structural simulations are conducted with the opening angle of the door θ d ranging from 5° to 90°. The simulated frequencies are from 20 Hz to 4000 Hz at 1/3 octave bands. Since the sound source is defined as 2N uncorrelated planewaves with wavenumbers generated by a random number generator in Equation (3), each single simulation is performed three times with different seeds, and the averaged values are used to eliminate the influence of the random number generator on the source term.
The simulated sound transmission losses are shown in Figure 5. Compared with the STLs of a closed door in Figure 3, the STLs of partially open doors are 30 dB to 50 dB lower, which confirms the sound insulation ability of completely closed doors. For the investigated partially open door, its STL increases with decreasing opening angle. The case with opening angle θ d = 90 ° is taken as a reference for comparison because we consider that the existence of a door with an opening angle of θ d = 90 ° could barely influence the STL in the tested configuration. The differences in STL based on the reference case are calculated and listed in Table 2. To estimate the loudness of the sound, the rule of thumb in comparing decibels is used: +/−3 dB for just perceptible, +/−5 dB for noticeable and +/−10 dB for apparent. If we apply the above rule of thumb to the total STL across 1/3 octave band frequencies, the door should be closed to a little bit less than θ d = 30 ° for the effect of door closure to be perceptible. If we want to have a noticeable reduction in sound, the opening angle of door should be kept around θ d = 10 ° . If we need a significant sound reduction from the door, its opening angle should be kept less than 5 ° .
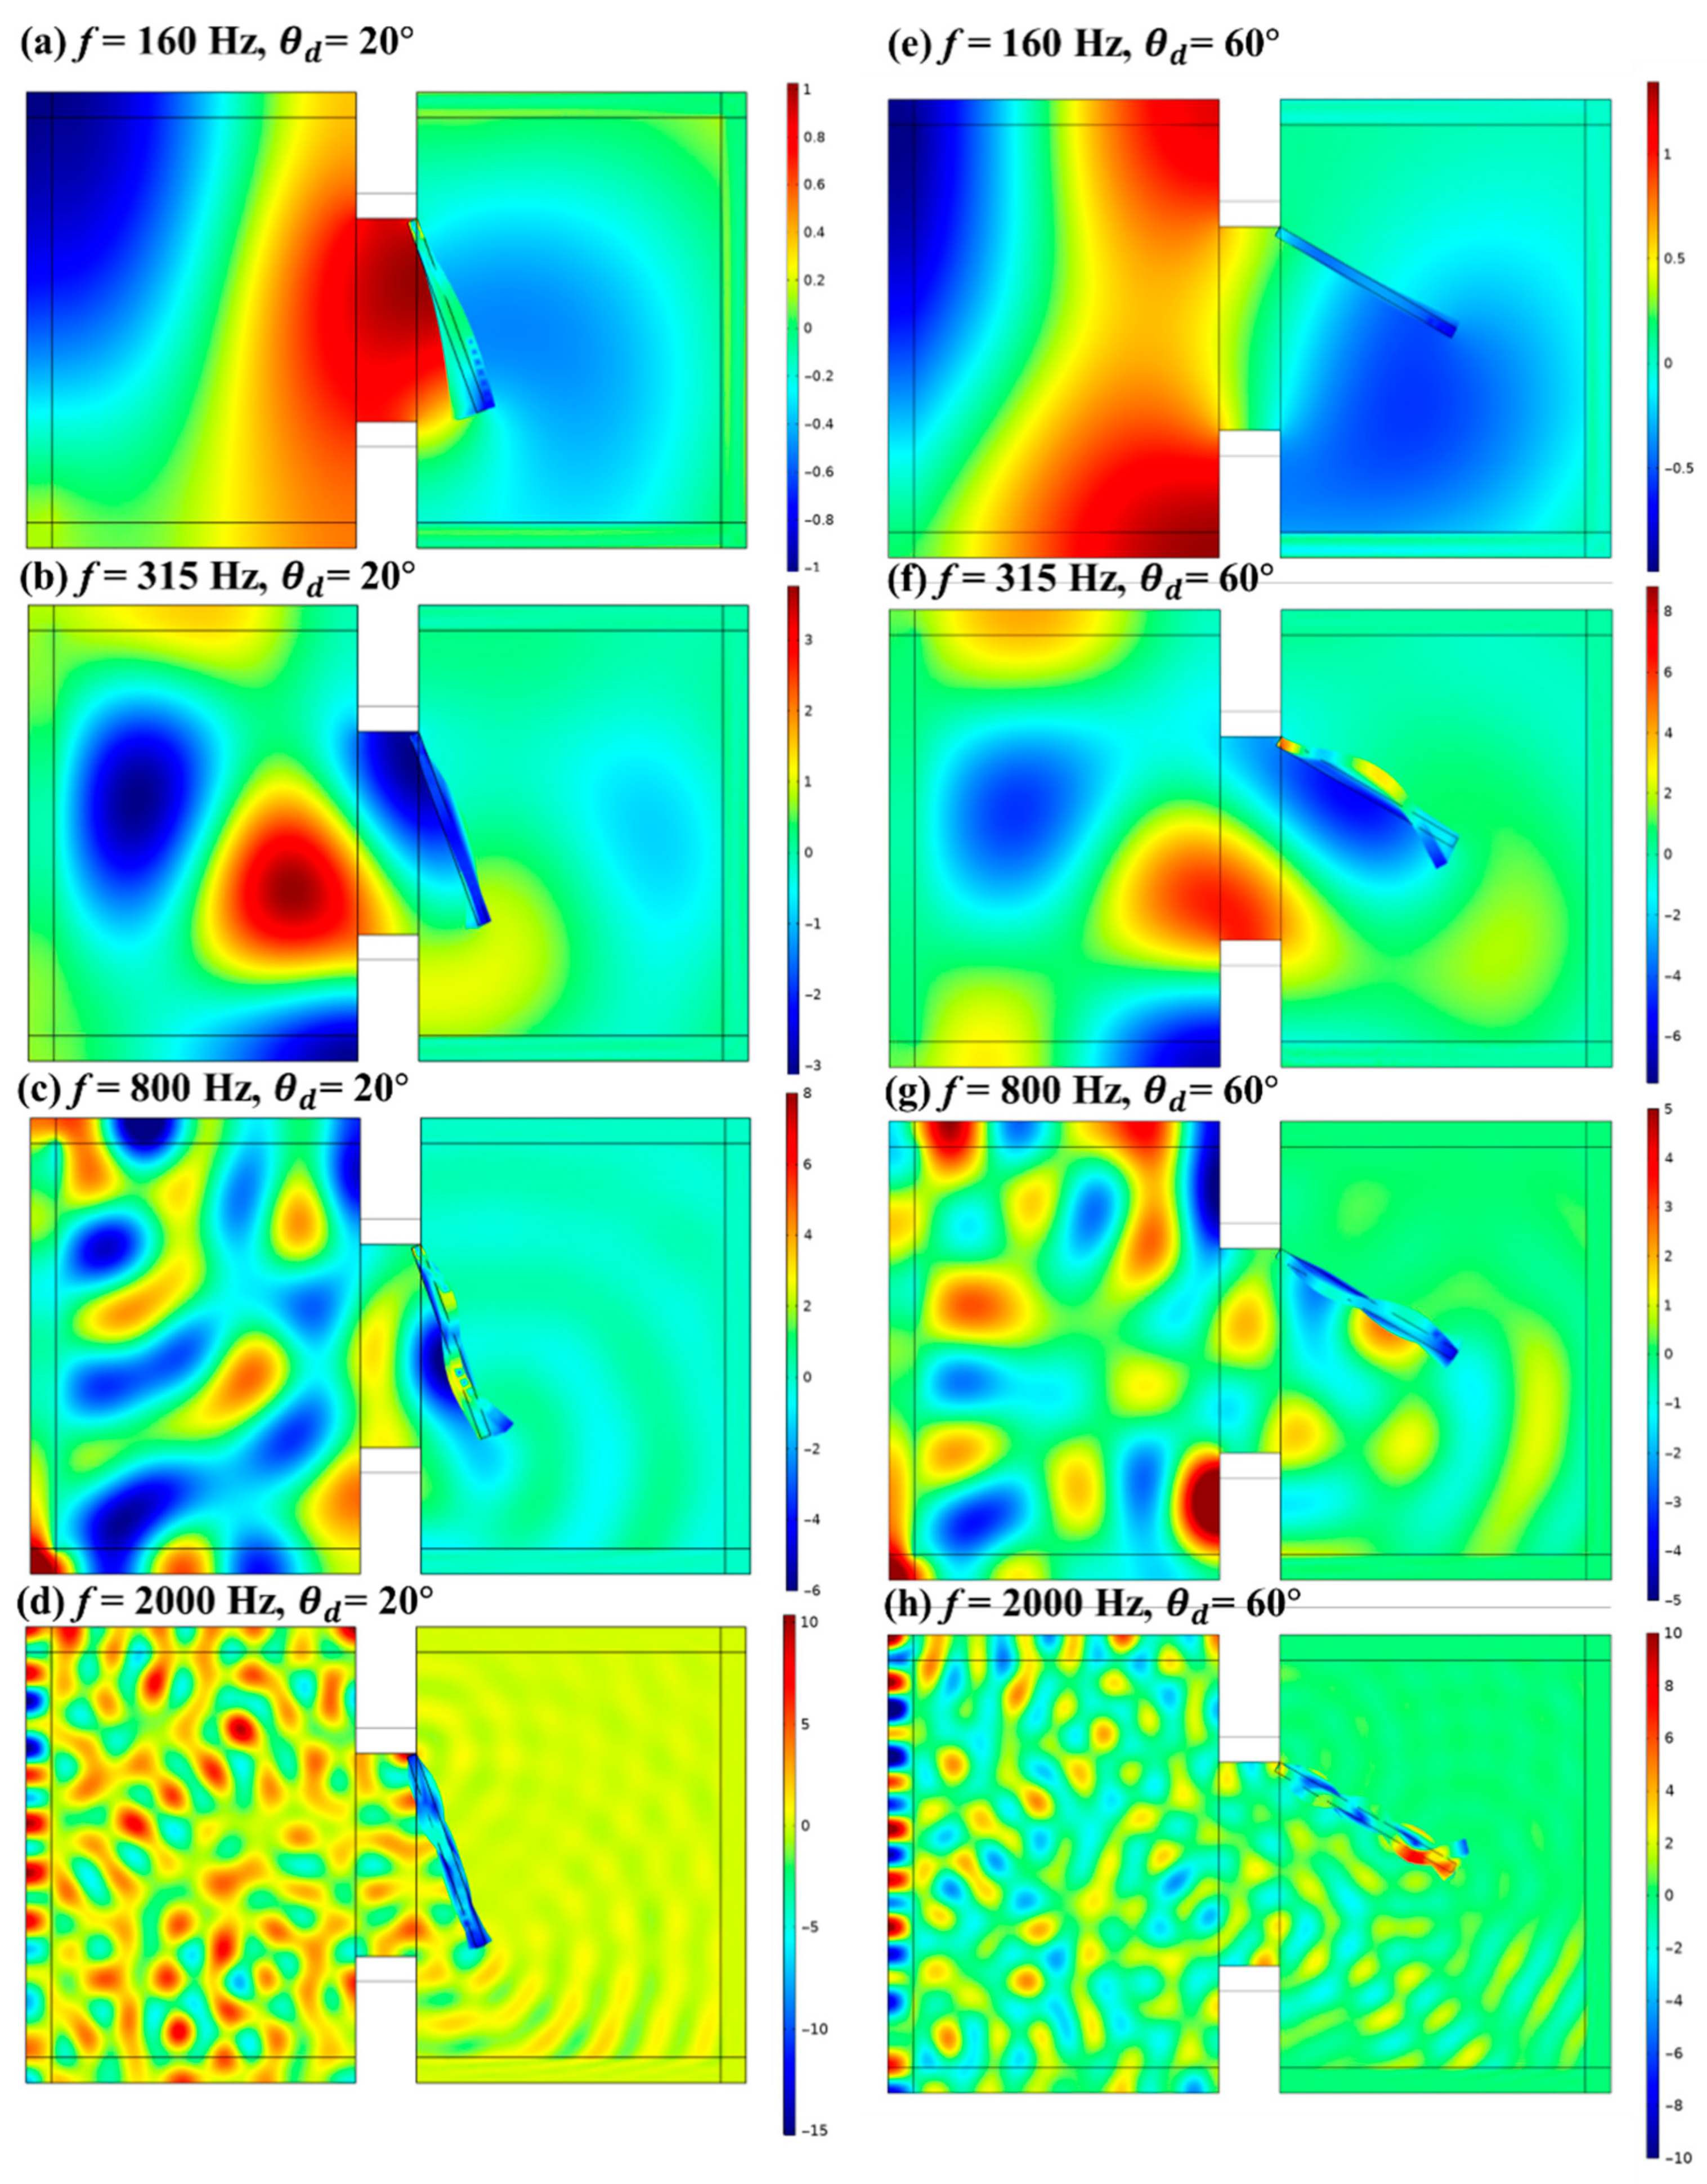
In terms of spectral characteristics, the sound insulation performance by door decreases with frequency to around 200 Hz as is shown in Figure 5. Then, the curves increase slowly and steadily up to 4000 Hz. Different from the closed-door configuration, the STL for a partially open door does not have a clear resonance region where the coincidence of the incident sound frequency and the door’s eigenfrequencies results in a low STL. Figure 6 plots the pressure distributions in a sliced plane for two opening angles of the door at 160 Hz, 315 Hz, 800 Hz and 2000 Hz. The insulation of sound at different door opening angles is shown at different frequencies.

3.2. Sound Insulation and Ventilation Performances with Different Opening Angles

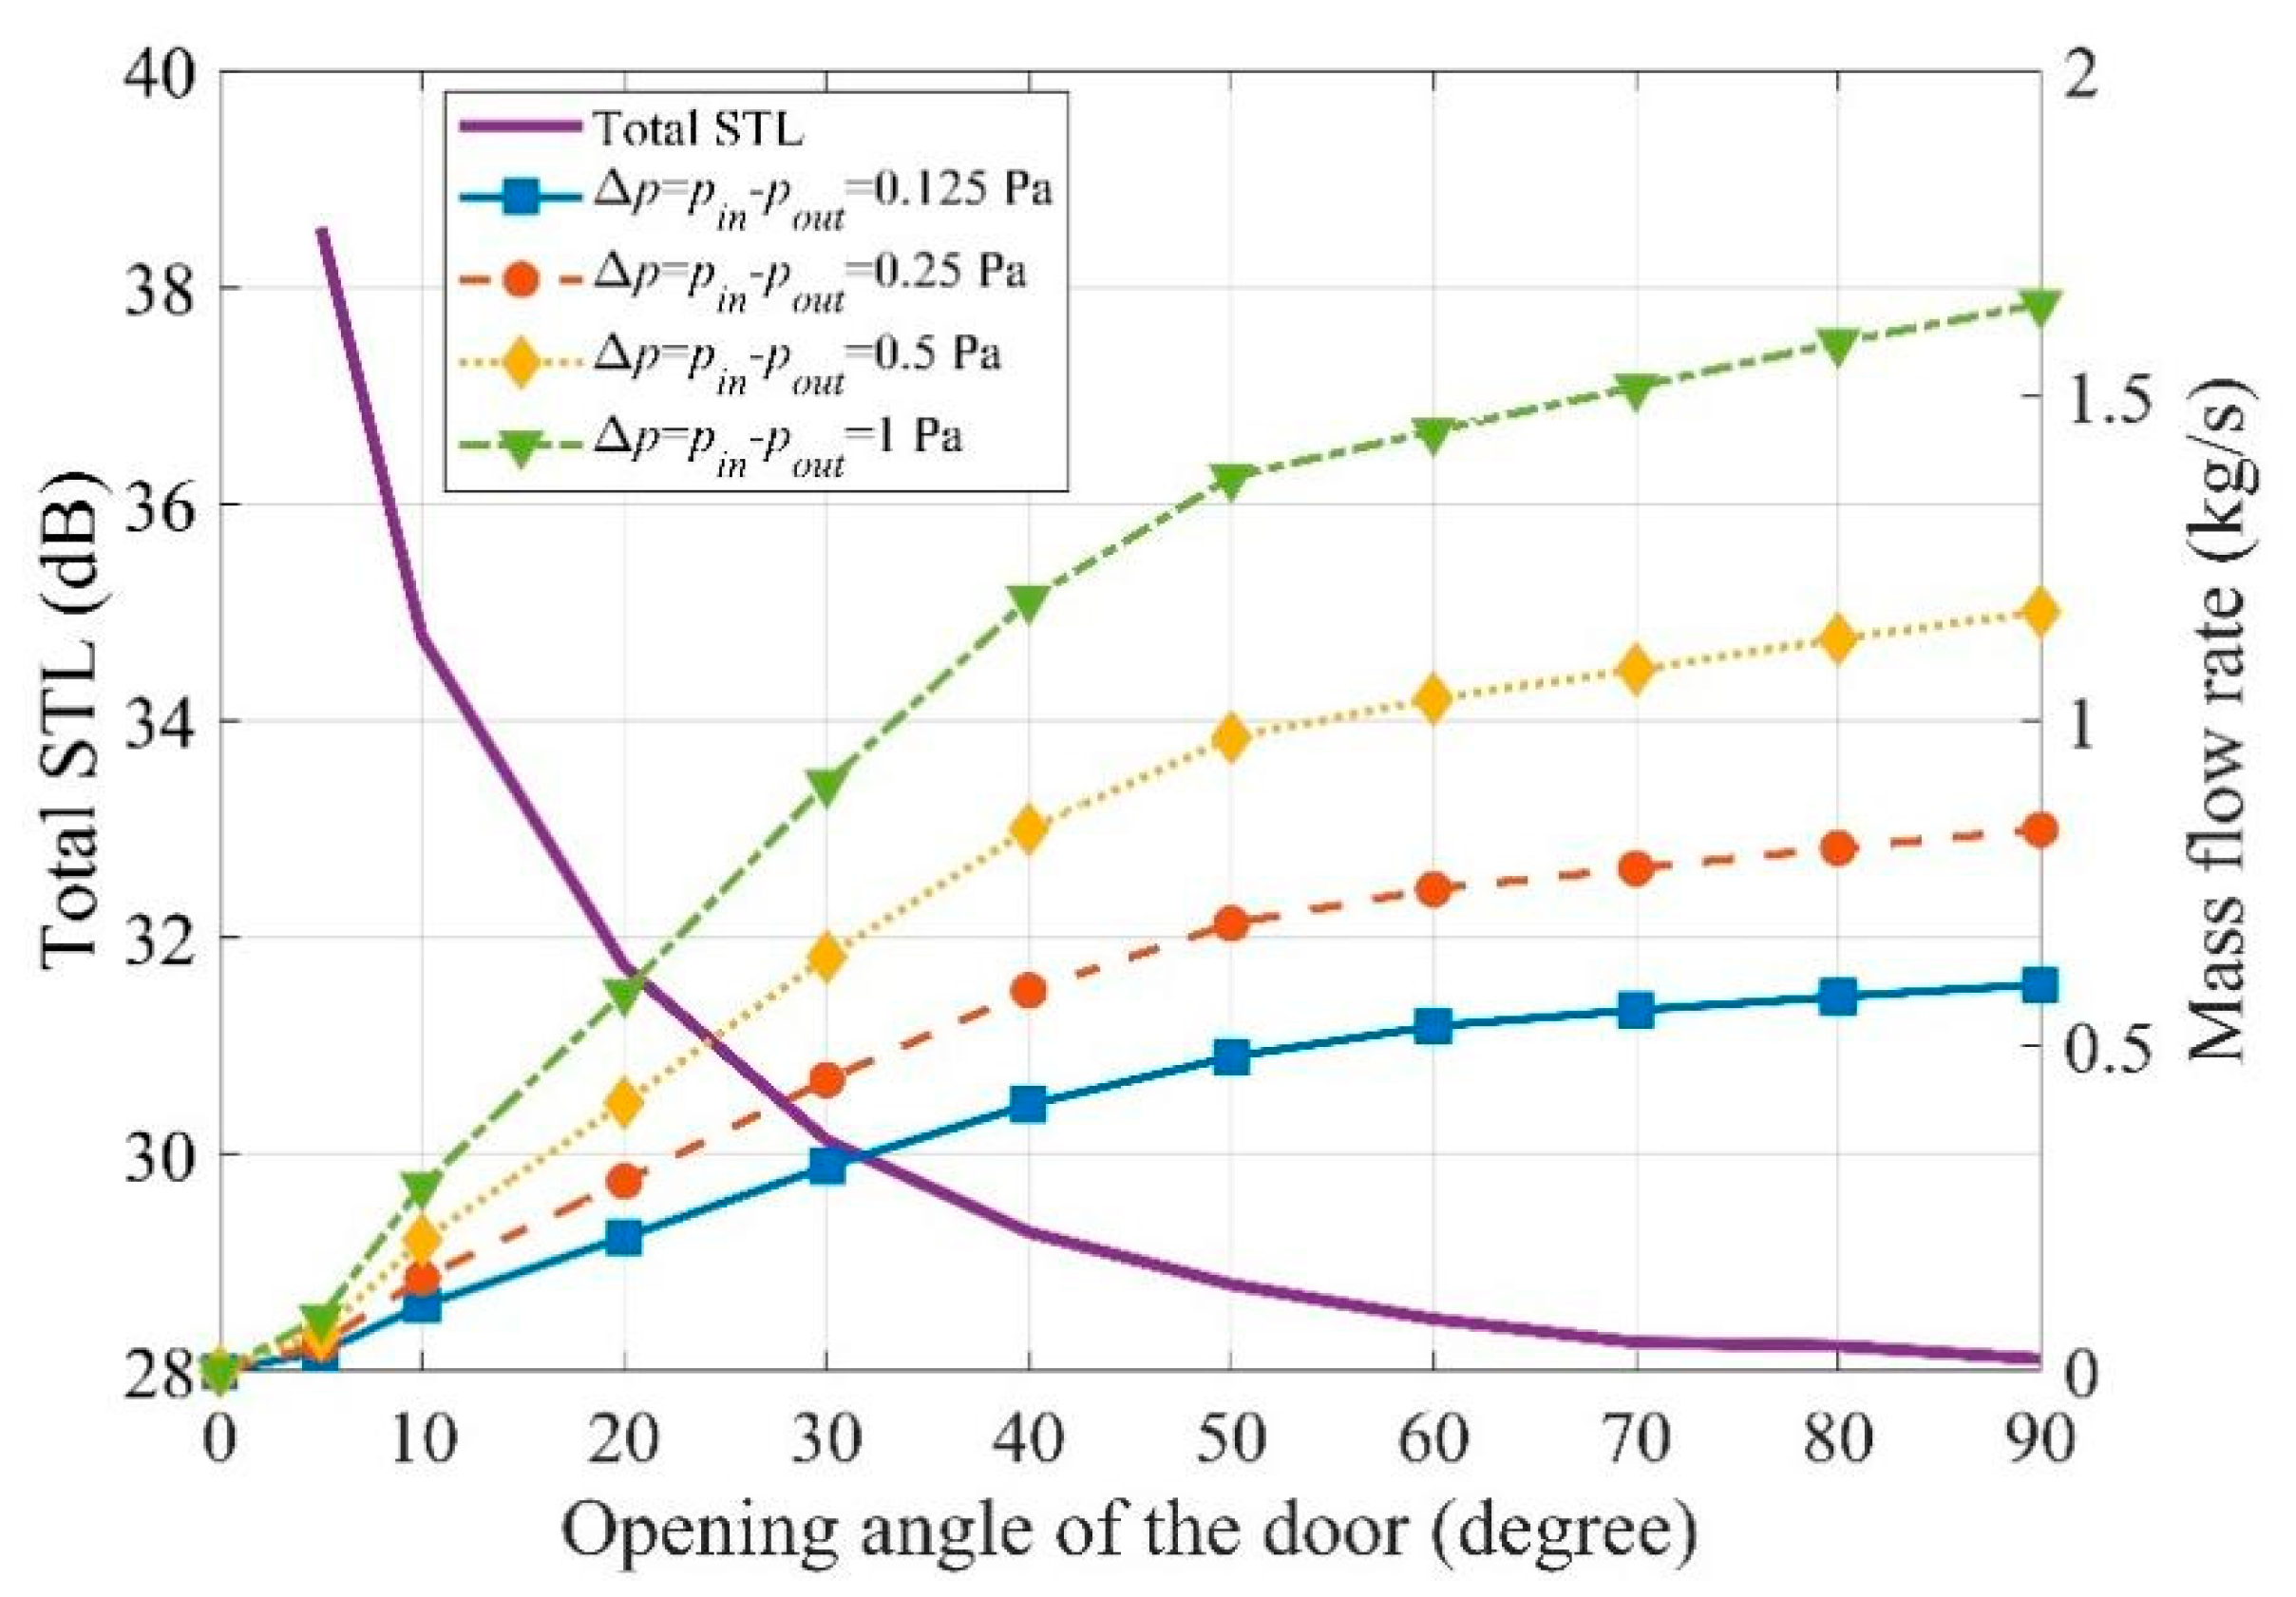
Figure 7 plots the mass flow rates across the door opening with different opening angles on its right y axis. From the figure, it could be observed that the mass flow rate has a piece-wise linear form. From θ d = 0 ° to θ d = 50 ° , the mass flow rate increases linearly with the opening angle at a relatively high rate. From θ d = 50 ° to θ d = 90 ° , the ratio between the increase in mass flow rate and the opening angle becomes smaller but still keeps a constant value. The simulation results indicate that there is a turning point at θ d = 50 ° . For an opening angle larger than θ d = 50 ° , the benefit of enlarging the door opening on the increase in flow rate decelerates. The turning point does not change with the pressure differences in the source and receiver rooms for the values tested in this paper.
The left y axis of Figure 7 plots the total STL of the partially open door. It is obvious that the variation in total STL with opening angle has a trade-off relation with the ventilation performance. Therefore, in real practice, a compromise should be made. If a clear sound insulation effect is preferred ( STLTotal > 5 dB), the opening angle should be kept less than 15 ° . However, the ventilation performance in this case is minimum. If good ventilation performance is targeted, the opening angle should be larger than 45 ° . According to Figure 6, the difference in STL at θ d = 45 ° and θ d = 90 ° is less than 1 dB, which indicates a neglectable difference in the sound insulation effect between these two opening angles. If both sound insulation and ventilation performances are needed, the opening angle should be kept in θ d = 15 ° ~ 25 ° . In this range, the sound insulation effect is perceptible, as the STLTotal is larger than 3 dB. The corresponding mass flow rate is 30~45% of the maximum mass flow rate.

3.3. Evaluation of the Impact on Work Efficiency at Different Opening Angles

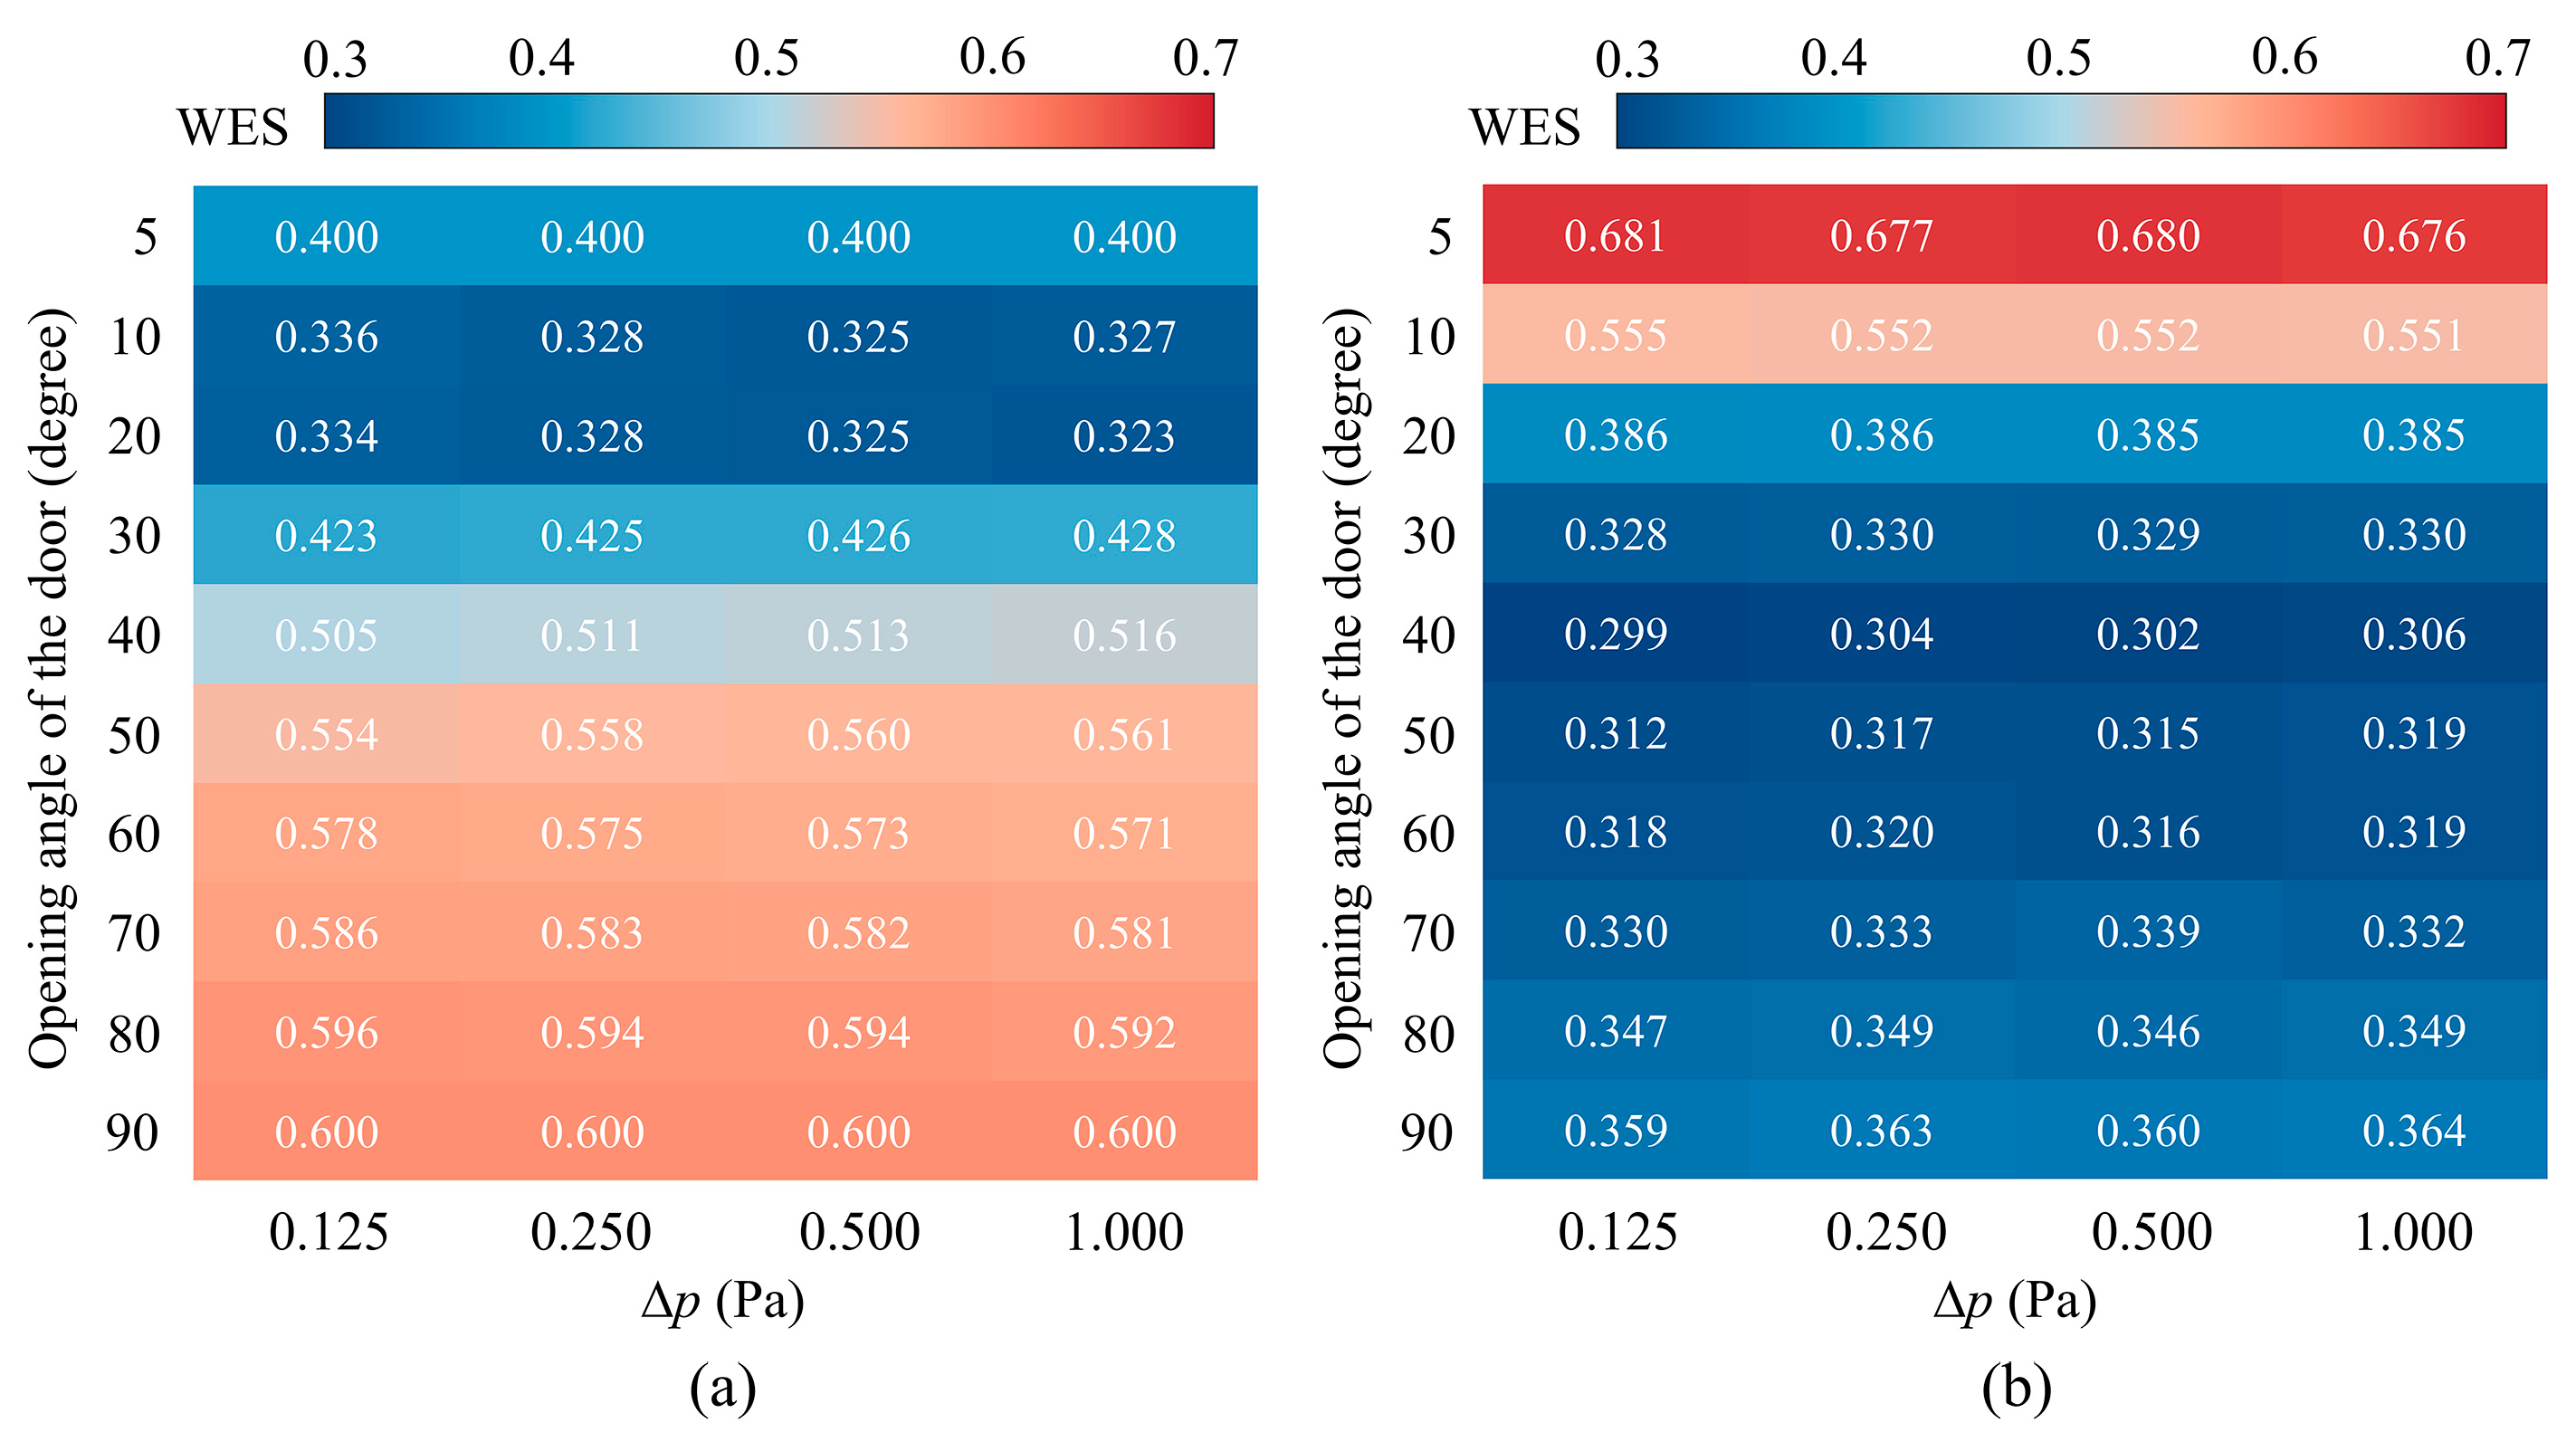
The larger WES represents that the staff can achieve better work efficiency; Figure 8 demonstrates the WES at different opening angles. A key observation from the heatmap in Figure 8 is that the influence of Δp on the final WES is minimal compared to the dominant effect of the door opening angle. This is because while Δp has a negligible impact on the STL, the opening angle alters it dramatically. Conversely, although Δp does affect air ventilation, its influence is considerably smaller than that exerted by the opening angle. Consequently, the opening angle serves as the primary driver of the trade-off, and the results are robust across the range of tested pressure differences. Figure 8a demonstrates the WES when the weight values of the effect of air quality and noise on the work efficiency are 0.6 and 0.4, respectively. Previous studies have found that air quality has a greater impact on work efficiency. In the belief that air quality has a greater impact on work efficiency, WES tended to increase with increasing door opening angle, increasing by 1.7% to 16.2%. Other occupants may have greater sensitivity to noise, like in hospitals. Figure 8b demonstrates the WES when noise is considered to have a greater impact on occupants; the minimum value is obtained at a door opening angle of 40°, and as the door opening angle increases, the ventilation obtained improves the performance and the WES keeps increasing, but for greater sensitivity to noise, the door opening angles of 5° and 10° have a higher WES, and it is recommended to reduce the door opening angle. Mechanical ventilation can be used to assist with air exchange.

4. Conclusions

In order to better understand how to maintain good air circulation while ensuring soundproofing of the room, we investigated the sound transmission loss and air mass flow rate of a partially opened door through numerical simulations. The WES considering the effect of noise and air quality on work efficiency was also calculated by the TOPSIS method. Based on the results of the calculations, the following conclusions were drawn:
(1)
For high sound insulation requirements, it is recommended that the door opening angle is less than 15°, which can increase the WES by 20% to 25%.
(2)
A good compromise between the sound insulation and ventilation performances is in the range of θd = 15°~25°.
(3)
The sound insulation effect is negligible once the opening angle is larger than 45°. In this case, it is suggested that the opening angle of the door to be kept with maximum angle to guarantee a better ventilation performance. And as the door opening angle increases, the WES also increases, increasing worker efficiency.
While the partially open door model is a deliberate simplification rather than a practical design solution, it serves as a critical canonical case. This approach allowed us to quantify the fundamental trade-off between acoustics and airflow and to validate our integrated simulation methodology. The resulting trade-off curves and decision-making logic establish a robust foundation for automated environmental control systems in smart buildings. Future work will extend this framework to more complex architectural elements, such as windows and acoustic vents, and incorporate additional factors like temperature and lighting to create a more holistic evaluation of indoor environmental quality.

Author Contributions

Conceptualization, J.L. (Jizhou Liu) and X.L.; Data curation, X.L.; Formal analysis, X.L. and J.L. (Jiying Liu); Funding acquisition, J.L. (Jizhou Liu) and J.L. (Jiying Liu); Investigation, J.L. (Jizhou Liu), X.L. and M.L.; Methodology, J.L. (Jizhou Liu), X.L. and J.L. (Jiying Liu); Project administration, J.L. (Jizhou Liu) and J.L. (Jiying Liu); Resources, J.L. (Jizhou Liu) and J.L. (Jiying Liu); Software, J.L. (Jizhou Liu), X.L. and J.L. (Jiying Liu); Supervision, J.L. (Jiying Liu); Writing—original draft, J.L. (Jizhou Liu) and X.L.; Writing—review and editing, J.L. (Jizhou Liu), X.L., M.L. and J.L. (Jiying Liu). All authors have read and agreed to the published version of the manuscript.

Funding

This work was funded by the National Key Research and Development Program of China (2024YFE0106800).

Data Availability Statement

Data is contained within the article.

Acknowledgments

This work acknowledges the Plan of Introduction and Cultivation for Young Innovative Talents in Colleges and Universities of Shandong Province.

Conflicts of Interest

The authors declare no conflicts of interest.

Abbreviations

Nomenclature
Aamplitude of the planewaves, m
cjmass fraction
Edyoung’s modulus of the door, Pa
Fvexternal force, N
Hbheight of the domain, m
Hdheight of the door, m
kwavenumber of the sound
Lblength of the domain, m
paacoustic pressure, Pa
pin, pouttotal pressure at the inlet and outlet, Pa
Ptrtransmitted power, W
Sstress tensor of the solid, Pa
Tdthickness of the door, m
Twthickness of the wall, m
uvibration velocity of the structure, m/s
Wbwidth of the domain, m
Wdwidth of the door, m
Abbreviation
FEMfinite element method
PMLperfectly matched layer
STLsound transmission loss, dB
WESworkplace environmental score
Greek Symbols
θdopening angle of the door, °
ρddensity of the door, kg/m3
σstrain tensor of the solid
νdPoisson’s ratio of the door
θn, φn, ϕnrandom variables

References

  1. Chen, S.; He, P.; Yu, B.; Wei, D.; Chen, Y. The challenge of noise pollution in high-density urban areas: Relationship between 2D/3D urban morphology and noise perception. Build. Environ. 2024, 253, 111313. [Google Scholar] [CrossRef]
  2. Chen, J.; He, L.; Li, X.; Zheng, B.; Wang, T.; Wang, D.; Zou, C. Experimental Investigation on Building Sound Environment: Traffic-Induced Air Noise and Structure-Borne Noise. Buildings 2024, 14, 2380. [Google Scholar] [CrossRef]
  3. Wang, P.; Xiang, H.; Guo, M.; Shi, Y.; Chong, K.C.; Huang, J.; Ho, H.C. Indoor and roadside exposures to traffic noise and cardiovascular mortality and the role of urban environmental stressors across a high-rise, high-density environment: A case study in Hong Kong. Build. Environ. 2023, 229, 109945. [Google Scholar] [CrossRef]
  4. Fusaro, G.; Barbaresi, L.; Guidorzi, P.; Garai, M. Investigation of the sound insulation and natural ventilation performance of a metamaterial-based open window. Build. Environ. 2024, 266, 112140. [Google Scholar] [CrossRef]
  5. Zhang, J.; Pang, L.; Yang, C.; Fan, Y.; Zhao, B.; Cao, X. Experimental Evaluation of Noise Exposure Effects on Subjective Perceptions and Cognitive Performance. Buildings 2024, 14, 1100. [Google Scholar] [CrossRef]
  6. Santana, E.G.F.; Suzuki, E.H.; Prado, R.T.A.; Kurokawa, F.A. Thermal comfort and indoor air quality in hospitals in the subtropics: Analysis of operating rooms and waiting rooms conditions. Indoor Built Environ. 2024, 33, 916–928. [Google Scholar] [CrossRef]
  7. Zhang, J.; Li, Y.; Yin, H.; Liang, L.; Zu, S.; Gao, L.; Zhang, Y.; Li, A. Experimental study on the CO2 concentration and age of air distribution inside tiny sleeping spaces. Build. Simul. 2024, 17, 591–605. [Google Scholar] [CrossRef]
  8. Ren, L.; An, F.; Su, M.; Liu, J. Exposure Assessment of Traffic-Related Air Pollution Based on CFD and BP Neural Network and Artificial Intelligence Prediction of Optimal Route in an Urban Area. Buildings 2022, 12, 1227. [Google Scholar] [CrossRef]
  9. Bader Eddin, M.; Ménard, S.; Laratte, B.; Wu, T.V. A Design Methodology Incorporating a Sound Insulation Prediction Model, Life Cycle Assessment (LCA), and Thermal Insulation: A Comparative Study of Various Cross-Laminated Timber (CLT) and Ribbed CLT-Based Floor Assemblies. Acoustics 2024, 6, 1021–1046. [Google Scholar] [CrossRef]
  10. Arjunan, A.; Baroutaji, A.; Robinson, J.; Vance, A.; Arafat, A. Acoustic metamaterials for sound absorption and insulation in buildings. Build. Environ. 2024, 251, 111250. [Google Scholar] [CrossRef]
  11. Sharp, B.H. A Study of Techniques to Increase the Sound Insulation of Building Elements; Wyle Laboratories: Lexington Park, MD, USA, 1973. [Google Scholar]
  12. Hongisto, V. Sound insulation of doors-part 1: Prediction models for structural and leak transmission. J. Sound Vib. 2000, 230, 133–148. [Google Scholar] [CrossRef]
  13. Hongisto, V.; KerÄNen, J.; Lindgren, M. SOUND INSULATION OF DOORS—PART 2: COMPARISON BETWEEN MEASUREMENT RESULTS AND PREDICTIONS. J. Sound Vib. 2000, 230, 149–170. [Google Scholar] [CrossRef]
  14. Soni, K.; Singh, M.; Yadav, Y.K. Sound Transmission Characteristics Through Multi-panel Structures of Wooden Doors and Uncertainty Components in the Measurements. In Recent Developments in Acoustics. Lecture Notes in Mechanical Engineering; Springer: Singapore, 2021. [Google Scholar]
  15. Gompeters, M.C. The “sound insulation” of circular and slit-shaped apertures. Acta Acust. United Acustica 1964, 14, 1–16. [Google Scholar]
  16. Gompeters, M.C. The influence of viscosity on sound transmission through small circular apertures in walls of finite thickness. Acta Acust. United Acust. 1964, 15, 191–198. [Google Scholar]
  17. Wilson, G.P.; Soroka, W.W. Approximation to the Diffraction of Sound by a Circular Aperture in a Rigid Wall of Finite Thickness. J. Acoust. Soc. Am. 1964, 36, 1023. [Google Scholar] [CrossRef]
  18. Asakura, T.; Sakamoto, S. Improvement of sound insulation of doors or windows by absorption treatment inside the peripheral gaps. Acoust. Sci. Technol. 2013, 34, 241–252. [Google Scholar] [CrossRef]
  19. Shimizu, T.; Kawai, Y.; Takahashi, D. Numerical analyses and experimental evaluation of reduction technique for sound transmission through gaps. Appl. Acoust. 2015, 99, 97–109. [Google Scholar] [CrossRef]
  20. Shimizu, T.; Koizumi, S. Study of the compatibility between sound insulation performance and ventilation performance in gaps by installing nonwoven fabrics. Build. Environ. 2015, 94, 335–343. [Google Scholar] [CrossRef]
  21. Sakamoto, S.; Koseki, S.; Chinda, M.; Abe, S. A silencer incorporated within the thickness of the edge of the door for increasing sound transmission lossa. J. Acoust. Soc. Am. 2018, 144, 3303–3312. [Google Scholar] [CrossRef]
  22. Zhang, H.; Ding, X.; Zhang, W.; Zhang, W.; Xuan, Y. Optimising multi-vent module-based adaptive ventilation using a novel parameter for improved indoor air quality and health protection. Build. Simul. 2024, 17, 113–130. [Google Scholar] [CrossRef]
  23. Vilén, L.; Atosuo, J.; Putus, T. The association of voice problems with exposure to indoor air contaminants in health care centres—The effect of remediation on symptom prevalence: A follow-up study. Indoor Built Environ. 2023, 33, 314–324. [Google Scholar] [CrossRef]
  24. Chen, H.; Ding, X.; Li, R.; Gong, S.; Liu, B.; Li, Q.; Gao, W. An experimental case study of natural ventilation effects on the residential thermal environment and predicted thermal comfort in Kunming. Case Stud. Therm. Eng. 2024, 56, 104198. [Google Scholar] [CrossRef]
  25. Rocha, L.A.; Gomez, R.S.; Delgado, J.M.P.Q.; Vieira, A.N.O.; Santos, I.B.; Luiz, M.R.; Oliveira, V.A.B.; Oliveira Neto, G.L.; Vasconcelos, D.B.T.; Silva, M.J.V.; et al. Natural Ventilation in Low-Cost Housing: An Evaluation by CFD. Buildings 2023, 13, 1408. [Google Scholar] [CrossRef]
  26. Furdas, Y.; Yurkevych, Y.; Zhelykh, V.; Ulewicz, M. The Impact of Wind Flow on Multi-storey Buildings: Experimental Studies. In International Scientific Conference EcoComfort and Current Issues of Civil Engineering; Springer International Publishing: Cham, Switzerland, 2023; pp. 83–93. [Google Scholar]
  27. Myroniuk, K.; Furdas, Y.; Zhelykh, V.; Adamski, M.; Gumen, O.; Savin, V.; Mitoulis, S.-A. Passive Ventilation of Residential Buildings Using the Trombe Wall. Buildings 2024, 14, 3154. [Google Scholar] [CrossRef]
  28. Rubino, C.; Liuzzi, S.; Fusaro, G.; Martellotta, F.; Scrosati, C.; Garai, M. Balancing ventilation and sound insulation in windows by means of metamaterials: A review of the state of the art. Build. Environ. 2025, 275, 112780. [Google Scholar] [CrossRef]
  29. Yan, Y.; Kang, M.; Zhang, H.; Lian, Z.; Fan, X.; Sekhar, C.; Wargocki, P.; Lan, L. Does window/door opening behaviour during summer affect the bedroom environment and sleep quality in a high-density sub-tropical city. Build. Environ. 2024, 247, 111024. [Google Scholar] [CrossRef]
  30. ISO 10140-3:2021; Acoustics—Laboratory measurement of sound insulation of building elements—Part 3: Measurement of impact sound insulation. ISO: Geneva, Switzerland, 2021.
  31. COMSOL Documentation. User’s Guide on Structural Mechanics Theory. 1998. Available online: https://doc.comsol.com/6.2/docserver/#!/com.comsol.help.sme/sme_ug_theory.06.024.html%233439873 (accessed on 1 October 2024).
  32. COMSOL Documentation. Sound Transmission Loss Through a Concrete Wall. 2020. Available online: https://cn.comsol.com/model/sound-transmission-loss-through-a-concrete-wall-73371 (accessed on 1 October 2024).
  33. Zhu, X.; Wang, L.J.; Wang, X.L.; Zheng, Y.D.; Luo, L. Sound insulation performance and modal analysis of asymmetrical insulating laminated glass. J. Low Freq. Noise Vib. Act. Control 2024, 43, 846–862. [Google Scholar] [CrossRef]
  34. Deng, Z.; Dong, B.; Guo, X.; Wang, X.; Zhang, J. Assessing multi-domain impact of IAQ and noise on productivity with portable air cleaners through physiological signals. Build. Environ. 2024, 254, 111375. [Google Scholar] [CrossRef]
  35. Du, L.; Lau, S.-K.; Lee, S.E. Experimental study on sound transmission loss of plenum windows. J. Acoust. Soc. Am. 2019, 146, EL489–EL495. [Google Scholar] [CrossRef]
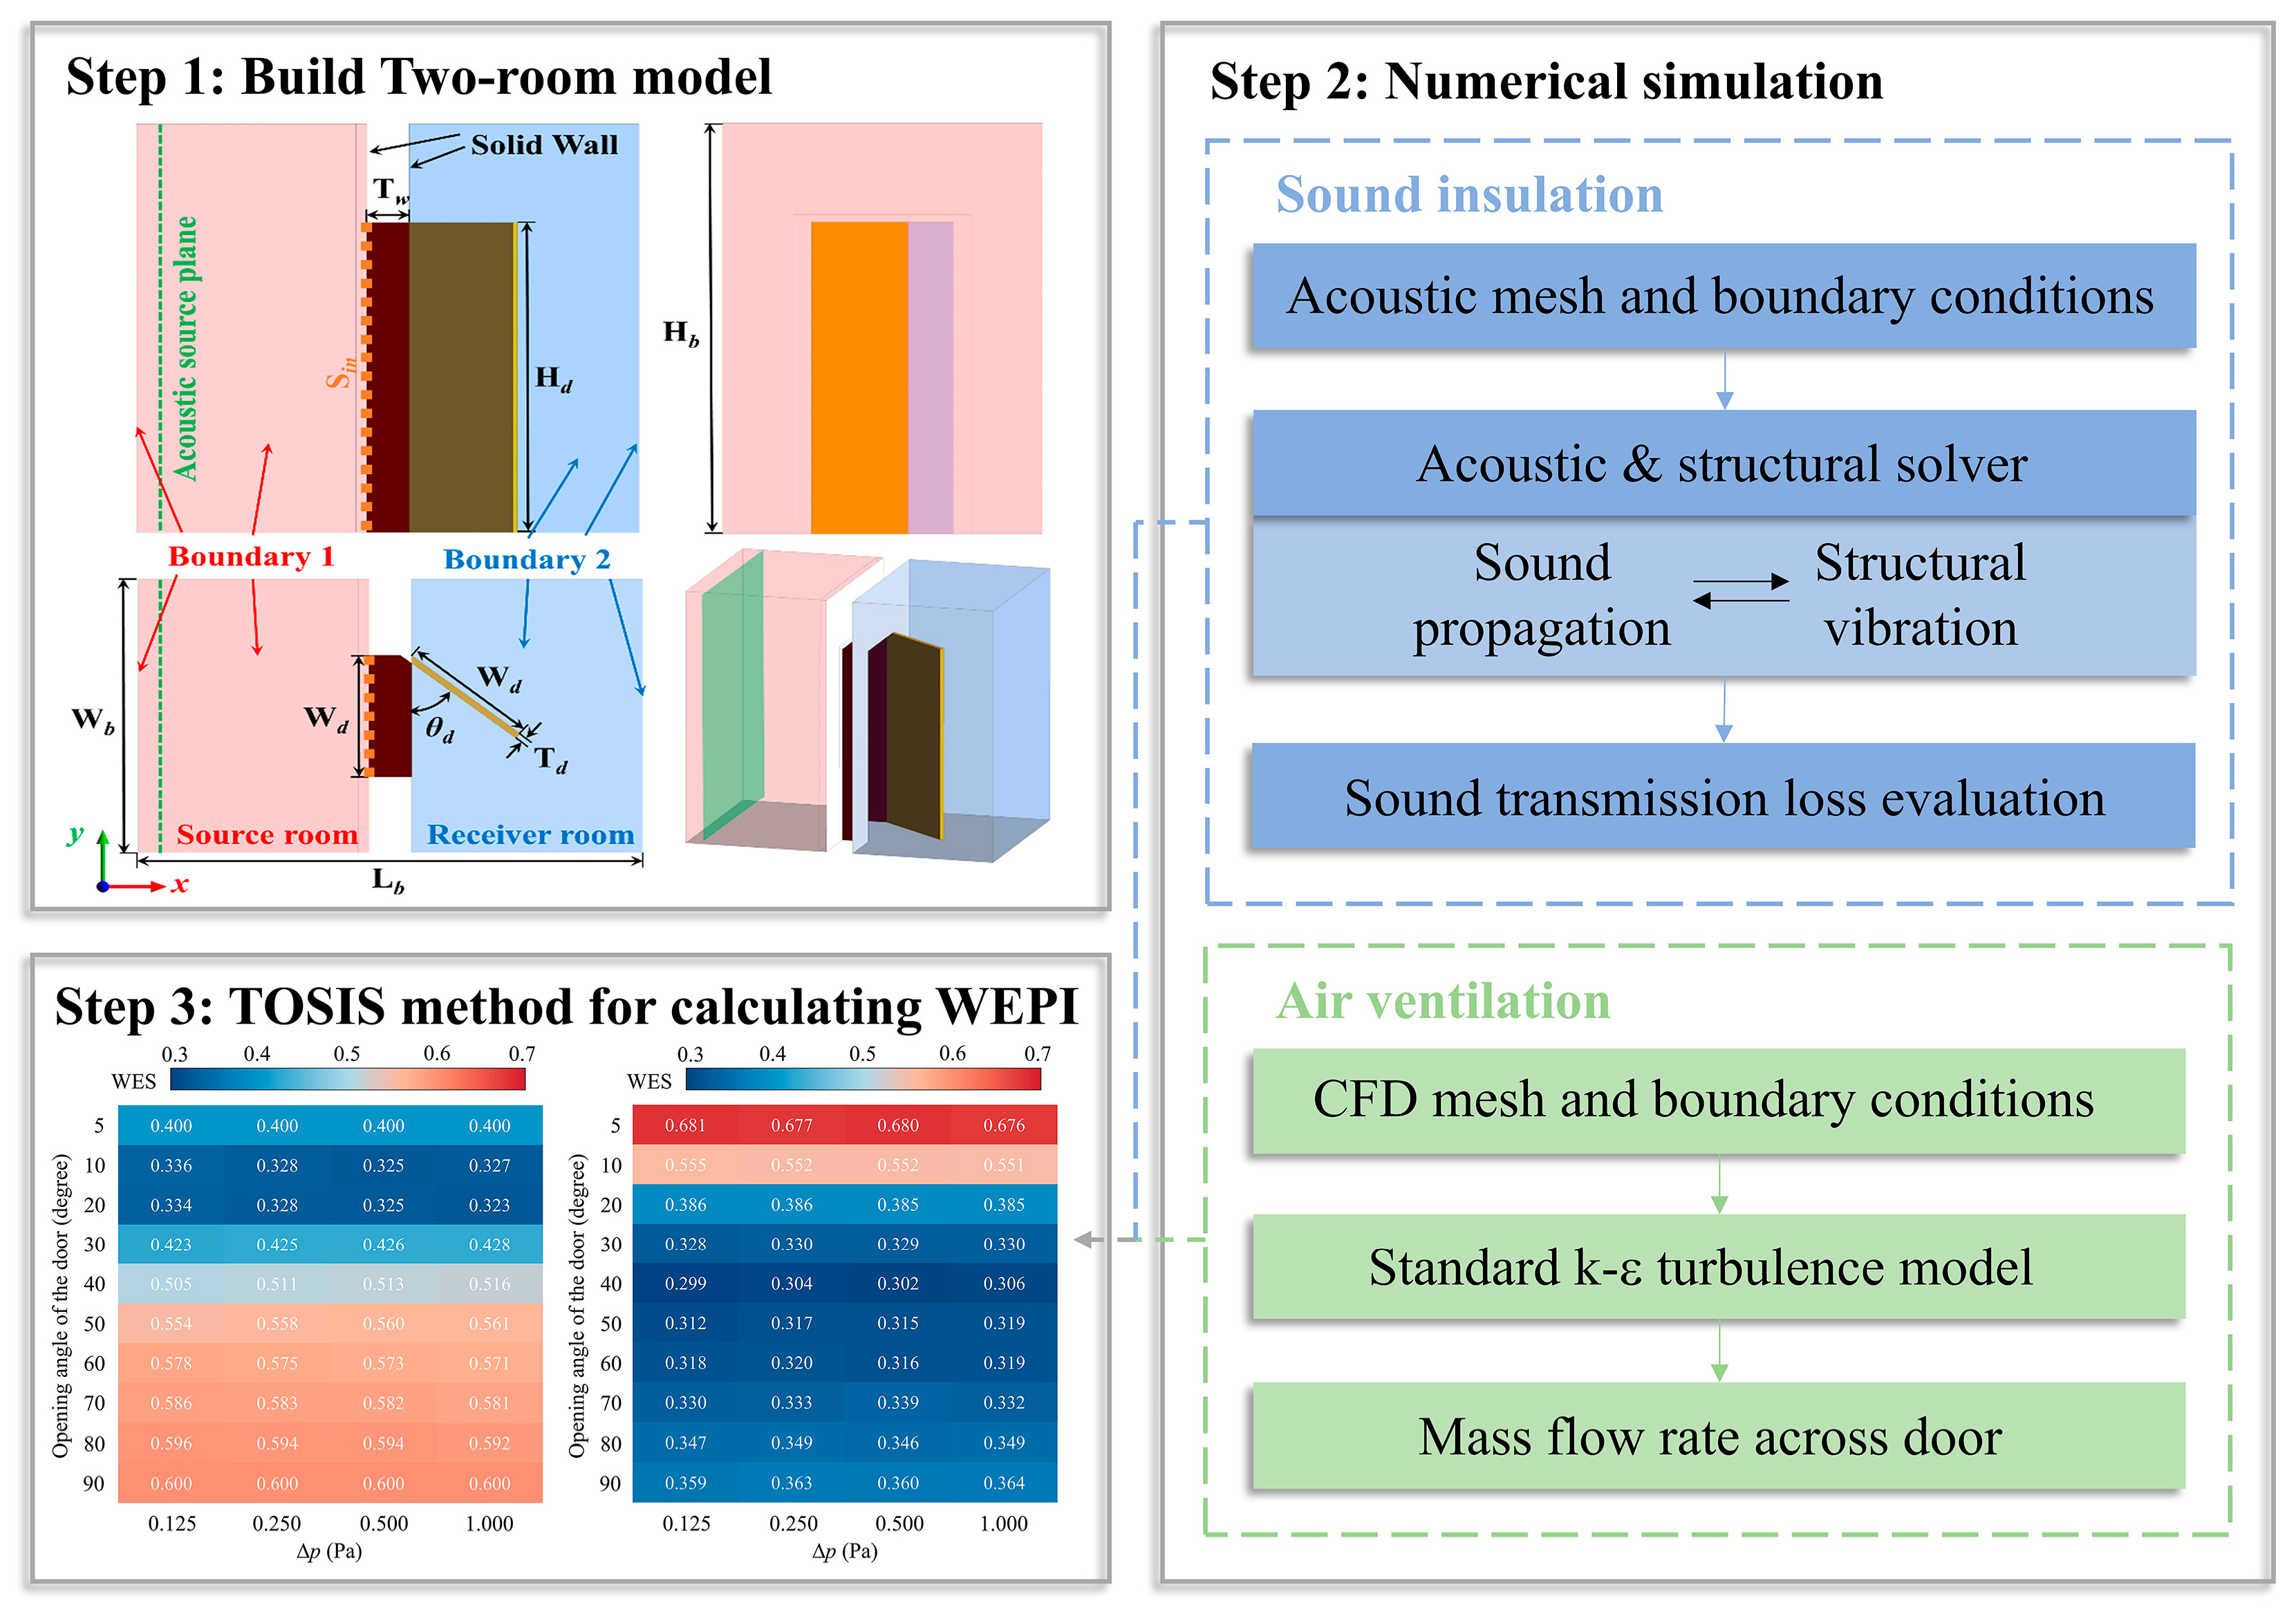
Figure 1. Working flowchart of this study.
Eng 06 00223 g001
Figure 2. Sketch of the model geometry.
Eng 06 00223 g002
Figure 3. Sound transmission loss at 1/3 octave bands and the first 60 eigenfrequencies of the door.
Eng 06 00223 g003
Figure 4. Simulation results for the closed-door case, (a) stress on the door surface generated by incident sound waves, (b) eigenforms of the body of the door leaf.
Eng 06 00223 g004
Figure 5. Sound transmission loss of partially open door with different opening angles.
Eng 06 00223 g005
Figure 6. Pressure patterns in sliced plane at z = 1.35 m and deformation of door leaf, (a) f = 160 Hz, θd = 20°, (b) f = 315 Hz, θd = 20°, (c) f = 800 Hz, θd = 20°, (d) f = 2000 Hz, θd = 20°, (e) f = 160 Hz, θd = 50°, (f) f = 315 Hz, θd = 50°, (g) f = 800 Hz, θd = 50°, (h) f = 2000 Hz, θd = 50°.
Eng 06 00223 g006
Figure 7. Total STL (left) and mass flow rate (right) as a function of opening angle of the door.
Eng 06 00223 g007
Figure 8. (a) WES for different door opening angles with air quality weighting value of 0.60 and noise weighting value of 0.40; (b) WES values at different door opening angles, with weight values calculated using the entropy weight method.
Eng 06 00223 g008
Table 1. List of geometric parameters.
ParameterValue
Hb (m)2.7
Lb (m)3.4
Wb (m)2.2
Hd (m)2.7
Wd (m)0.8
Td (m)0.04
Tw (m)0.24
θd0~90°
ρd (kg/m3)532
Ed (Pa)8.2 × 10⁹
νd0.4
Table 2. STL differences between different opening angles, reference STL at θd = 90°.
Opening Angle (θd)STLTotal *1 (dB)STLTotal *2 (dB)Change in Loudness
38.5510.44Apparent
10°34.776.66Noticeable
20°31.743.63Perceptible
30°30.132.02Barely perceptible
40°29.281.17Not perceptible
50°28.800.69Not perceptible
60°28.480.37Not perceptible
70°28.260.15Not perceptible
80°28.230.12Not perceptible
90°28.110.00Not perceptible
*1  S T L T o t a l = 10 log 10 ( f = 20 f = 4000 10 S T L f / 10 ) . *2  S T L T o t a l = S T L T o t a l θ d S T L T o t a l θ d = 90 ° .
Disclaimer/Publisher’s Note: The statements, opinions and data contained in all publications are solely those of the individual author(s) and contributor(s) and not of MDPI and/or the editor(s). MDPI and/or the editor(s) disclaim responsibility for any injury to people or property resulting from any ideas, methods, instructions or products referred to in the content.