Abstract
Wear particle analysis, which identifies failure modes caused by the wear of various machine components, is an essential technique for monitoring machinery conditions. This analysis plays a vital role in predictive maintenance by revealing component degradation in machinery. This study proposes an automated framework to classify four standard wear particle textures—rough, striated, pitted, and fatigued—using artificial neural networks (ANNs) combined with advanced image processing techniques. Images acquired via Charged-Coupled Device (CCD) microscopy were preprocessed using sharpening, histogram stretching, and four edge detection algorithms: Sobel, Laplacian, Boie–Cox, and Canny. The Laplacian and Canny methods yielded the highest classification accuracies of 97.9% and 98.9%, respectively. By minimizing human subjectivity, this automated approach enhances diagnostic consistency and represents a scalable solution for industrial condition monitoring.
1. Introduction
A machine’s lubricating fluid contains wear particles that inform its operational state. These particles, produced by material interaction and friction between moving parts, contain intricate indications of the machine’s wear processes. To find and diagnose abnormalities in machinery, tribologists—specialists in the study of wear, lubrication, and friction—analyze these particles. Wear particle identification, however, is often based on human perception, which adds subjectivity and diagnostic variability.
Conventional manual analysis techniques, including visual inspection under a microscope, are frequently time-consuming and prone to inter-operator inconsistencies, especially in intricate industrial settings where accurate diagnosis is essential. These subjective mistakes can directly reduce the accuracy of problem predictions and postpone maintenance responses, which could result in unscheduled downtime or catastrophic failures.
The diagnostic discrepancies among industries are made worse by the absence of standardization. Conversely, this study promotes an automated system based on machine learning that overcomes these drawbacks by providing objective, scalable, and repeatable wear particle texture classification. The suggested method significantly advances the subject of predictive maintenance in industrial automation and improves diagnostic reliability by eliminating human bias [,].
Wear occurs when two or more objects come into contact and experience relative motion, resulting in material loss from one or both surfaces. A popular method for tracking the condition of machines is the study of wear particles, especially in costly and crucial machinery such as major industrial production equipment, helicopter gearboxes, and airplane engines. Early wear particle monitoring allows for identifying and remedying possible problems before they develop into major, expensive breakdowns. For example, an aviation engine’s anomalous wear particles can trigger maintenance procedures that avert a catastrophic breakdown while in flight.
This proactive strategy improves safety and increases machine operation economy and efficiency. Traditional wear particle analysis techniques, such as Ferrography and spectroscopy, are limited in accessibility and scalability because they frequently require specialized tools and knowledge [,].
Automating wear particle analysis relies heavily on image processing, a large scientific field related to computer vision and artificial intelligence. Segmentation, which is the process of splitting an image into discrete areas or segments according to specific characteristics like texture, color, or intensity, is one of the main tasks of image processing. Segmentation is one of the most critical steps in recognizing and categorizing items in an image. Segmentation, for instance, can separate individual particles from a background in particle analysis, allowing for a thorough analysis of their morphological characteristics. This ability is crucial for creating automated systems that precisely categorize wear particles according to their surface properties [,].
This paper uses image segmentation and Artificial Neural Networks (ANNs) to identify wear particles based on their surface features. However, the work aims to compare image processing methods for determining the surface texture of wear particles. Machine-learning models known as artificial neural networks (ANNs) are modeled after the composition and operations of the human brain. They are ideal for jobs like texture classification because they are exceedingly competent at identifying intricate patterns in data.
This study visually compares four distinct texture classes—pitted, fatigued, striated, and rough—representing some of the most prevalent particle textures in practice. Based on these comparisons, a feed-forward neural network classifier is trained using matrices to differentiate between the four texture classes.
Fatigue, roughness, pitting, striation, cracking, holes, and serration are the seven acknowledged texture patterns for particle identification; however, because of their widespread use in industrial settings, this study concentrates on the first four.
This work uses four segmentation techniques: Sobel, Laplacian, Boie–Cox, and Canny. A histogram specification technique is also used to create histogram images based on the RGB bands formulas to help with texture categorization. The proposed system demonstrates the potential of combining machine learning and image processing for wear particle identification, with an impressive classification accuracy rate of approximately 97.9% to 98.9%.
2. Background
The two most promising detection systems for wear monitoring are optical/imaging and magnetic debris detectors. The main research areas in this area include improving magnetic sensitivity and detection capabilities, and optimizing optical/imaging detectors using quick extraction algorithms and 3D reconstruction techniques for worn debris. Additionally, future research is anticipated to focus on intelligent detectors that incorporate wear evaluation, real-time monitoring, fault prediction features, and integrated wear monitoring systems that can gather multiple in-situ wear data [].
One of the methods and strategies used in recent years to achieve this goal is using a high-performance machine vision sensor that can detect and track worn metal particles larger than four μm in lubricating fluid that is both magnetic and nonmagnetic in color. Following detection, the watershed algorithm and the U-Net network are designed to gather and categorize particulate matter into different-size fractions and extract image features. This method was used in an online oil monitoring program for wind turbine gear [].
Another technique employed in this industry is developing a sensor array based on a neural network that can monitor multiple crucial lubricant properties. Among the many advantages of utilizing the Generalized Regression Neural Network (GRNN) in the sensor array is its capacity to decrease the quantity of training samples needed, facilitating quicker training. Furthermore, the GRNN provides versatility, enabling us to detect other oil qualities by adding more oil property sensors [].
Research is also being done to create a magnetic plug sensor for oil debris monitoring to boost sensitivity and accuracy using the same technology as the sensors. The sensitivity is maintained over the entire scale range by constructing a bridge nonlinear correction circuit, which can facilitate calibration and data processing.
Finite element analysis reduces the absolute deviation and attains precision by optimizing the sensor structure. The sensor’s connection between voltage and particle mass is linear with a bridge nonlinear correction circuit. The results indicate a minimum of 0.033 mg of iron detritus and a signal-to-noise ratio of 1.647. It is also an excellent instrument for early defect discovery because it can detect and trap particles as small as 47 μm and has a debris capture rate of over 90% [].
The identification of wear conditions requires wear particle analysis, which is frequently a linear process that includes image pre-processing → segmentation → feature extraction → identification → condition detection. However, this method has shortcomings such as inaccurate segmentation, error accumulation, and optimization difficulties. To address these problems, a convolutional neural network (CNN) is employed in a unique paradigm for intelligent Ferrography analysis.
CNN recognizes seven categories of Ferrography images to directly determine wear conditions, such as initial, normal, abnormal, and severe wear. Unlike earlier methods, CNN automatically extracts features layer by layer to accomplish accurate end-to-end classification with an average accuracy of 90% on the test set. This approach offers a valuable means of automating the detection of wear situations [].
A key component of this study is the classification of worn debris using visual similarity and supervised machine learning. Visual similarity compares wear particles based on their morphological characteristics, such as size, shape, and texture. On the other hand, supervised machine learning trains a model that recognizes and classifies particles based on these characteristics using labeled data. This approach performs remarkably well when combined with analytical Ferrography, which detects and stops issues with engineering equipment early on. Analytical Ferrography provides vital information on the condition of the machinery by separating and analyzing wear particles from lubricating fluid [].
Han et al. reviewed online oil wear debris particle detection sensors, dividing them into electrical (inductive, capacitive, and resistive) and non-electrical (optical, ultrasonic, and image processing) types. They emphasized contemporary issues such as signal-to-noise ratio, anti-corrosion performance, sensor integration, and miniaturization requirements. Their study highlights the significance of creating sensors that can detect wear particles at the micro-nano scale to improve fault diagnosis in applications related to marine engineering [].
Yang et al. emphasized inductive techniques for measuring wear debris in lubricating oil. Their review covers the basics of inductive sensors, improvements in sensor sensitivity, and difficulties such as detecting trash smaller than 100 µm and signal aliasing. To increase real-time monitoring capabilities, the authors recommend that future research focus on improving sensor sensitivity, increasing throughput, and resolving signal processing issues [].
Wu et al. presented a new multichannel inductive wear debris sensor based on time division multiplexing. This architecture increases throughput and real-time monitoring efficiency, enabling simultaneous wear debris detection across many channels without requiring additional data gathering equipment. Their study shows how these sensors can be used in real-time, high-throughput lubricating oil detection applications [].
The principal author has worked on several particle texture analysis experiments. The histogram of gradient magnitude, local binary pattern, Tamura features, image moments, a deep learning algorithm, and numerous image processing segmentation techniques have all been developed, including a gray-level cooccurrence matrix approach to prepare reduced-size data for ANNs [,,,].
3. Wear Particles
Examining wear particles is a crucial feature of predictive maintenance programs and condition monitoring. By reviewing these particles’ size, shape, quantity, and makeup, tribologists can ascertain the machine’s type and degree of wear. For instance, a rise in wear particles may indicate accelerated wear rates. On the other hand, variations in particle form or content can be used to identify specific components or materials that are wearing down. This information allows quick modifications to prevent catastrophic failures when diagnosed with misalignment, poor lubrication, contamination, or material fatigue [].
This study used traditional methods, such as filtration, Ferrography, and magnetic plug separation, to pre-extract wear particles from lubricating oil. These techniques, which are frequently used in tribological diagnostics, made it possible to separate ferrous and non-ferrous waste without the need for automation. The morphological examination of previously isolated particles using image processing and machine learning categorization is the primary focus of this work, rather than the collecting techniques themselves. For conciseness, thorough procedural explanations are not included; interested readers can see [,,,] for in-depth discussion.
After separation, wear particles display various morphological traits associated with particular wear mechanisms. Particle types, including rubbing, cutting, rolling fatigue, and severe sliding wear, can be accurately identified to provide important information about the machine’s state. This section describes the main physical characteristics of each type of particle, serving as the foundation for further automated texture classification.
Machine wear particles, particularly those composed of steel or steel-based alloys, provide crucial information on the wear processes occurring within the system. These particles are separated into several types based on their size, shape, and the wear processes that produce them. Understanding this information is essential to assessing machine conditions and foreseeing any failures.
Normal wear, known as rubbing wear particles, is caused by regular sliding contact between machine parts. The particles created by this method are typically platelet-shaped and have a size range of 0.5 to 15 µm. These particles have flat surfaces and are relatively thin, with thicknesses ranging from 0.15 to 1 µm. The rubbing wear particle is a regular and anticipated occurrence in equipment, but it can be further accelerated by contaminants like dust or sand in the lubrication system. These contaminants accelerate wear and create more rubbing particles due to their abrasive qualities. Contamination issues can be identified by monitoring the size and quantity of these particles, and excessive wear can be prevented [].
Cutting wear particles are produced when one surface punctures another, usually due to impurities or strong asperities. These particles, such as long bent wires, loops, or spirals, resemble the swarf created during machining operations. Usually ranging in size from 25 to 100 µm in length and 2 to 5 µm in width, they are large and gritty. Significant wear and potential component failure are indicated by cutting wear particles, especially those more substantial than 50 µm. For example, these particles might signal misalignment or foreign debris in gear systems, which calls for immediate maintenance to avoid catastrophic failure [].
Rolling Fatigue particles are formed in components subjected to cyclic loading, such as bearings and gears. There are three basic types of rolling fatigue particles, as follows:
- Particles of Fatigue Spalling: These flat platelets have a primary dimension-to-thickness ratio of roughly 10:1. Because the material is removed as a pit opens, they feature smooth surfaces and unevenly shaped circumferences.
- Spherical Particles: An early indicator of imminent failure, these particles are created within fatigue cracks. Their existence signals the beginning of subsurface fissures, which have the potential to spread and cause spalling.
- Laminar Particles: When wear particles move across a rolling contact, they generate laminar particles, which are fragile, free metal particles. Their major dimensions usually range from 20 to 50 µm, and their thickness ratio is approximately 30:1. Significant wear is indicated by laminar particles, which are frequently linked to advanced stages of rolling fatigue [].
A kind of wear called combined rolling and sliding wear particles can affect gears and other components that experience both rolling and sliding actions. The final particles often have irregular forms and smooth surfaces. However, the particles usually have rough surfaces and jagged edges when gear scuffing, a severe form of wear caused by either too much load or inadequate lubrication, occurs. These particles depend on identifying gear wear and preventing transmission system failures.
Severe sliding wear particles are created when the contact tension between sliding surfaces exceeds what the material can withstand. These particles are characterized by surface striations, microscopic scratches, or grooves caused by the sliding motion. As the wear increases, the straight edges and striations of the particles become more apparent. High loads, high speeds, or insufficient lubrication can cause rapid component degradation and are often associated with severe sliding wear particles.
According to the literature, twenty-nine types of wear particles are the primary types discussed above. These particles have distinct morphological traits resulting from fretting wear, corrosion, and erosion. For example, corrosion wear particles are often delicate and powdery, while fretting wear particles are typically tiny and irregularly shaped. Recognizing and classifying these particles is essential for efficient machine maintenance and comprehensive wear analysis [].
4. Surface Texture Identification System
Texture classification problems aim to assign a specific texture sample to one of several predefined classes. The foundation of this process is a classifier, which bases its decision on measurements taken from the sample. To distinguish between distinct wear particle patterns, the methodology used in this work captures important texture attributes such as coarseness, homogeneity, and periodicity. The classifier can accurately classify texture samples because these characteristics are quantified and utilized as input features [].
The classifier employed in this study is a feed-forward neural network (FFNN) with a single hidden layer. When the purpose of supervised learning tasks is to translate input data to output classes, this kind of neural network works wonderfully. By iteratively modifying the network’s weights, the backpropagation technique reduces the error between the expected and actual outputs throughout the training phase.
The input database contains vectors representing a texture sample and the associated classifications. The number of target texture classes and features used to describe the texture determines the number of components in each input vector. To identify fresh, unseen vectors after training, the network allocates them to one of the pre-established texture classes.
The input, hidden, and output layers comprise an artificial neural network (ANN). The input layer has as many nodes as items in the input vector. The network’s performance can be optimized by adjusting the number of nodes in the hidden layer. The output layer contains four nodes, each representing one of the four wear particle texture classes under investigation: pitted, fatigue, striation, and rough.
During training, the weights of the connections between nodes in nearby layers are altered to improve the network’s accuracy. Following training, the network can classify new texture samples [].
It is rare for an engine to produce all seven types of particle surface texture simultaneously, even though they have been identified in the literature. The number of texture classes shown depends on the engine type and running conditions. Fatigue (smooth) or rough textures comprise about 60% to 70% of all wear particles, with pitted and striated textures accounting for over 90% of the total. This study focuses on the four most common texture types because they are the most relevant for practical applications.
To ensure experimental repeatability, a uniform imaging technique was employed to build the dataset for training and testing the artificial neural network (ANN) classifier. Wear particle samples were taken with a Leica wear-particle analysis workstation powered by flexible Windows software, which combines powerful image capture and processing technology with high-performance optical inspection.
A Leica M28 zoom stereo microscope offers clear, three-dimensional views of deposited particles with both transmitted and incident illumination. The field of view was transmitted from a Charged-Coupled Device (CCD) color camera to an IBM-compatible PC, where each particle is captured, measured, and processed by the Leica Quantimet Q500MC image-analysis unit. QWIN is a modular toolset that handles measurement and control, providing everything from completely automated particle sizing to semi-manual planimetry [].
To standardize size and scale across all texture categories, each image was converted to 8-bit grayscale and its dimensions set to 512 × 512 pixels. The contrast levels and lighting intensity were adjusted to avoid saturation or shadowing during acquisition. The microscope was used in a vibration-isolated enclosure to lessen motion artifacts.
The 192 images in the collection are evenly split into four texture classes: pitted, striated, rough, and fatigued. Each texture class has 48 unique images. To improve rotational invariance and classifier resilience, 12 distinct particles were imaged for each class. Each particle was then rotated at 45-degree intervals to produce four augmented images. The training and testing sets were constructed using a 75:25 stratified split to ensure an equal representation of each class. Each texture class contributed 24 vectors per subset, 96 in the training and 96 in the testing sets.
This organized acquisition and preprocessing pipeline allowed reliable neural network training and reproducibility in subsequent comparative investigations, ensuring consistency in imaging settings, statistical distribution, and class balance.
Image Processing Techniques
The image processing pipeline, as shown in Figure 1, begins with sharpening algorithms to enhance the quality of the particle images. A spatial domain-sharpening technique uses a Laplacian mask with the Sobel operator (kernel size 3). The Laplacian mask is a second-order derivative operator that highlights regions of rapid intensity change, such as edges and fine texture details. The Laplacian edge detection algorithm used a low and high clip percentage of 0.010, respectively. The following kernel defines it:
| −1 | −1 | −1 |
| −1 | 8 | −1 |
| −1 | −1 | −1 |
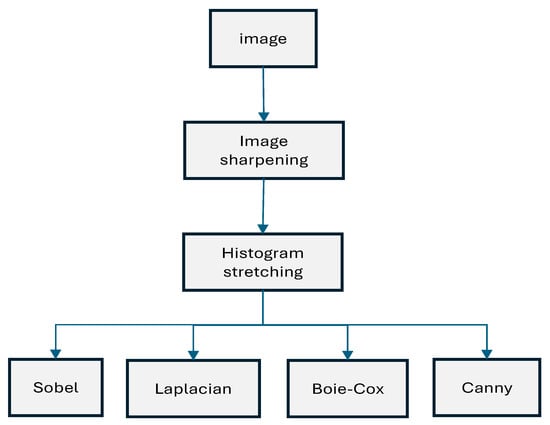
Figure 1.
The procedures used for image processing techniques for wear particle texture classification.
Convolving this kernel with the image creates the image’s Laplacian, which suppresses uniform areas and highlights edges and tiny details. When enhanced by the Laplacian operator, textural cues like striations and pitting marks help categorize wear particles.
Next, histogram stretching entails altering the brightness values of the image’s pixels by using a mapping function that defines an output pixel brightness value for each input pixel brightness value. Stretching on images is performed with low and high limit values set to 0–255, respectively.
The process of extracting a certain percentage of data from the tail ends of the input image histogram is commonly known as percentage stretching. The specified percent clip minimum and maximum pixel values are stretched linearly by the percent clip stretches type. If values in the histogram fall outside the specified range, using one of these stretch types pushes them to the ends.
Symmetric clipping was used for the histogram stretching operation, with low and high clip percentages set at 0.025. In order to improve image contrast while maintaining the core dynamic range, the lowest 2.5% and highest 2.5% of pixel intensity values were linearly stretched. Without causing distortions, this consistent cutting improves the visibility of surface characteristics in all image samples.
On the other hand, the gradient-based edge detection technique known as the Sobel operator determines the gradient of image intensity at every pixel. It uses two 3 × 3 convolution kernels, one for horizontal edge detection and one for vertical edge detection. The definition of the horizontal kernel is as follows:
| −1 | 0 | 1 |
| −2 | 0 | 2 |
| −1 | 0 | 1 |
The vertical kernel is as follows:
| −1 | −2 | −1 |
| 0 | 0 | 0 |
| 1 | 2 | 1 |
These kernels are convolved with the image to produce gradient approximations in the horizontal (Gx) and vertical (Gy) directions. The edge magnitude is then calculated as follows:
The edge direction is
The Sobel operator can be utilized in particle analysis, where noise from imaging devices or the lubrication system may obscure essential features, because it excels at detecting edges in noisy images [].
The Laplacian mask and Sobel operator produce a dependable pre-processing approach for wearing particle images. While the Laplacian mask draws attention to fine texture details, the Sobel operator detects edges and gradients, essential for identifying particle boundaries and texture patterns. These pretreatment procedures are necessary to improve the performance of the following ANN-based texture categorization.
Two more edge detection techniques, essential for spotting texture patterns, are the last stage in the image processing pipeline. Boie–Cox and Canny, two sophisticated edge detection methods, are assessed. These algorithms are regarded as advanced because they take several steps to reduce noise impacts and increase edge detection accuracy. Hysteresis thresholding, for instance, is used by the Canny algorithm to differentiate between strong and weak edges. The Canny edge detector is recommended for this investigation since it yields the most pronounced and trustworthy results among these algorithms.
The Canny edge detection algorithm was developed by John Canny in 1986 and is based on the mathematical idea of edges as step changes in intensity contaminated by Gaussian noise. The algorithm consists of four steps, as follows:
Gaussian Smoothing: A Gaussian filter is applied to the image to reduce noise and smooth out unnecessary details.
Gradient Calculation: The vertical and horizontal edge masks determine the gradient’s direction and magnitude. The gradient magnitude is determined by taking the square root of the sum of the squared vertical and horizontal gradients. In contrast, the gradient direction is determined by the arctangent of the vertical to horizontal gradient ratio.
Non-Maxima Suppression: The edges of the gradient magnitude image are thinned by retaining only the local maxima.
Hysteresis Thresholding: Two thresholds distinguish strong and weak edges. Firm edges are retained, while weak edges are discarded unless connected to firm edges. This procedure helps remove misleading edges while preserving actual edges.
Canny’s method for detecting edges is like the Boie–Cox algorithm. In this multi-step process, the image is blurred using a Gaussian kernel, and a matching filter is applied. Using the matching filter, edges in an image can be found and identified with subpixel precision. After that, the image is subjected to a Wiener filter, which boosts the signal amplitude and reduces any possible noise. A matching filter is utilized in the predicted direction, while the Wiener filter is applied along the edge contour.
5. Work Overview and Algorithm Justification
A high-level flowchart showing the entire process, from picture acquisition to texture classification, is shown in Figure 2. To improve contrast and visibility, the procedure starts with particle imaging using a CCD microscope and then moves on to successive pre-processing steps, including sharpening and histogram stretching. Salient textural boundaries are then extracted using edge detection algorithms, namely the Laplacian and Canny approaches. An Artificial Neural Network (ANN) is then used to classify the processed images into four predetermined texture classes: pitted, fatigued, striated, and rough.
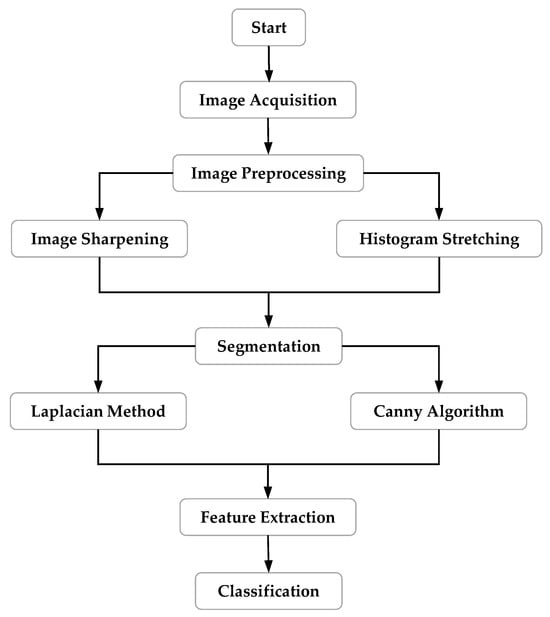
Figure 2.
Summary of the procedures used for wear particle texture classification.
The Canny and Laplacian algorithms were chosen because of their complementary abilities to identify fine-grained textures and edge structures. The Laplacian technique, a second-order derivative operator, is essential for isolating micro-textures like pitting and fatigue striations because it intensifies areas of fast intensity change. In contrast, the Canny detector can extract smooth, high-contrast boundaries by providing hysteresis thresholding, gradient-based detection, and substantial noise reduction.
The obtained accuracy of 97.9% and 98.9%, respectively, during ANN-based testing validated that both approaches empirically performed better in maintaining morphological features pertinent to texture classification. These outcomes support their use as the best pre-processing techniques in the suggested automated diagnostic framework.
5.1. Experimentation
As seen in Figure 3, 12 images—three for each of the four texture types—are used to test the image segmentation approaches. Images of pitted particles are shown in the first row, followed by striation, roughness, and fatigue.
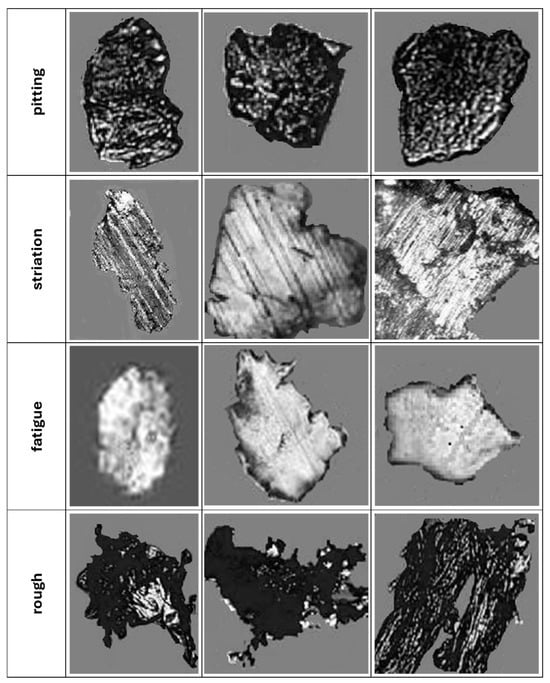
Figure 3.
Images of the four particle types are in groups of three.
Figure 4 considers the results of the three fatigue particles that follow the first three block diagram rows of Figure 1. In this Figure, one image from each particle type (row 1) is preprocessed with a sharpening effect (row 2), and the histogram is stretched in row 3. Preprocessing reduces noise and enhances the quality of the particle image.
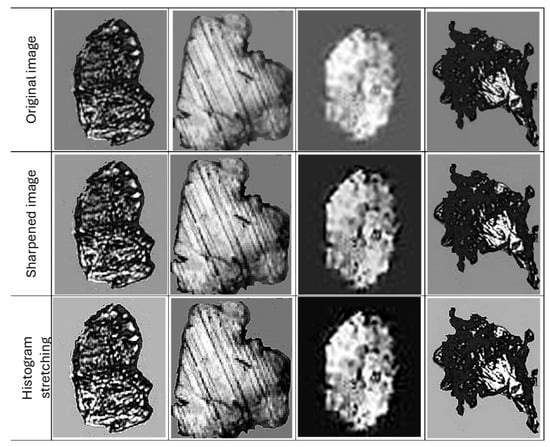
Figure 4.
Example of images after image sharpening and histogram stretching.
Four edge detection techniques are used on the particles in Figure 5. The Sobel edge detector produced the first row. The Laplacian edge detection algorithm’s output follows. The Boie–Cox and Canny algorithms produced the final two rows. The four texture classes are easily distinguished in these resulting photos from the four types: fatigue particles have smooth surfaces with few features, pitted particles have minor curves and holes, striated particles have straight lines, and rough particles have a coarse pattern.
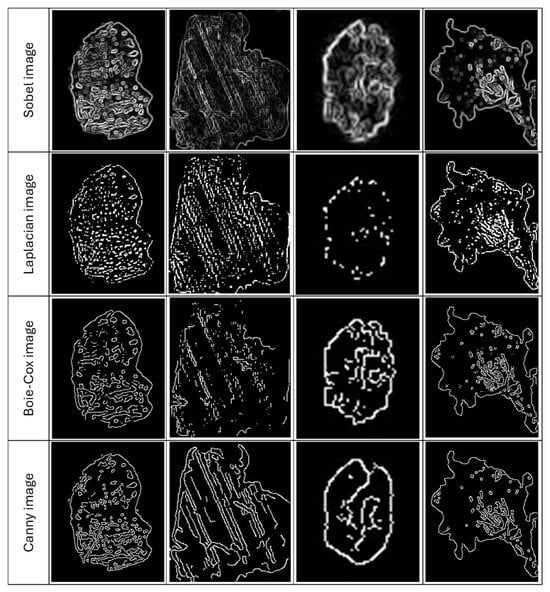
Figure 5.
A collection of images after applying image processing algorithms.
Our results show that the outputs of Canny and Laplacian images are subjected to two sets of training and testing algorithms. The results of the other two edge detectors are encouraging, although they are not as straightforward as those shown.
Pitting particles exhibit significantly more dot activity than fatigue particles, striated particles display line patterns, and rough particles show mixed activity patterns. The Laplacian edge detection algorithm is applied to all examined particles in Figure 6.
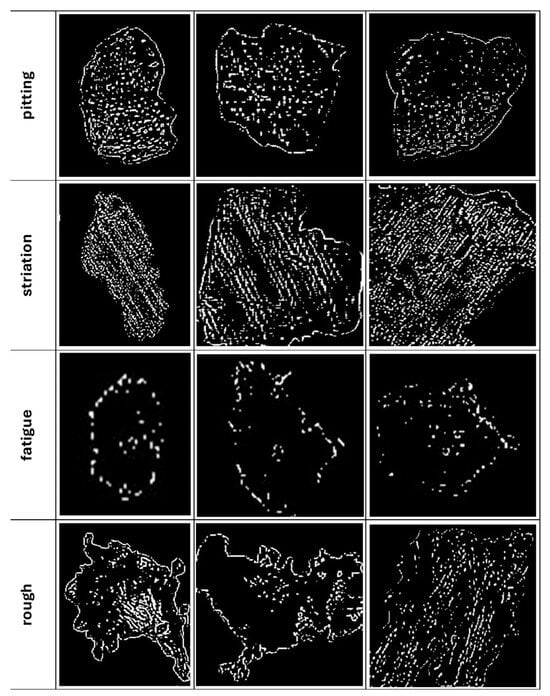
Figure 6.
Particle texture images after applying the Laplacian edge detection algorithm.
Similar differences between the Canny algorithm and the Laplacian are shown in Figure 7.
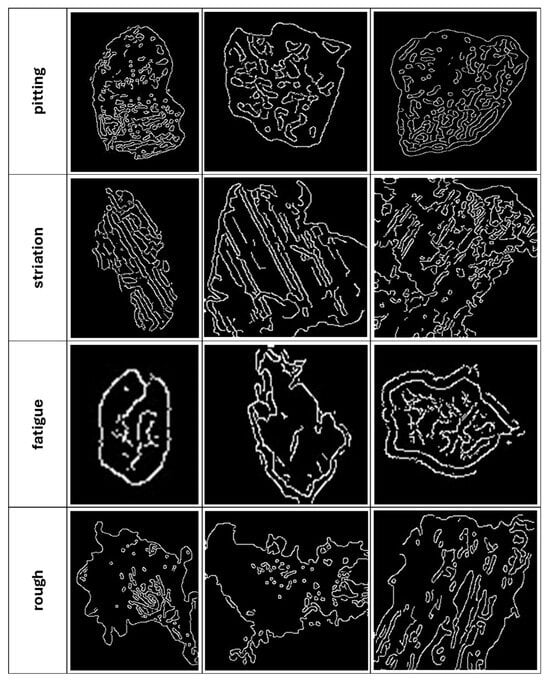
Figure 7.
Particle texture images after applying the Canny edge detection algorithm.
The last step in the analytical process is training and testing an artificial neural network (ANN) to categorize the texture patterns.
Dataset Creation:
Texture Classes:
- Each texture class has eight particles.
- Each class has 48 images.
- Rotation: Every image is rotated at 45-degree intervals to ensure rotation invariance.
Data Split:
- The training set comprises 96 vectors (24 for each texture class).
- The testing set comprises 96 vectors (24 for each texture class).
- Networks with 4, 8, and 12 nodes are examples of hidden layers in ANN training.
- Evaluation: Every 500 iterations, performance is assessed.
During the training phase of both algorithms, 8000 iterations are allowed for each of the four networks. The maximum performance achieved throughout those iterations is recorded, and the network performance is checked every 6.25 percent of the total iterations.
Performance:
- With four hidden nodes, the minimum accuracy from the Laplacian images of particles was 95.8%, accurately categorizing 92 out of 96 test samples.
- With 8 and 12 concealed nodes, the maximum accuracy from the Laplacian images of particles was 97.9%.
- With four hidden nodes, the minimum accuracy from Canny images of particles was 96.8%, accurately categorizing 93 out of 96 test samples.
- With 8 and 12 concealed nodes, the maximum accuracy from Canny images of particles was 98.9%.
This approach shows that the suggested methods for classifying the textures of wear particles are reliable. The high accuracy rates, notably the 97.9% and 98.9% attained with 8 and 12 hidden nodes, respectively, show how effective the ANN model is for both techniques.
5.2. Histogram Specification
Histogram specification, sometimes referred to as histogram matching, is an image processing technique that modifies an image’s intensity distribution so that its histogram corresponds to a predetermined histogram. This procedure aids in improving contrast between images, adjusting lighting, or coordinating how different images are viewed.
It develops a mapping function that adjusts the intensity values of the input image to correspond with the intensity values of the reference histogram. By modifying the input image’s intensity values, this mapping function produces an output image whose histogram closely resembles the reference histogram. This method is frequently used to enhance images’ visual clarity and consistency in various applications, including computer vision, remote sensing, and medical imaging.
The sin(0.025ox) RGB formula is used to apply this approach to each of the 12 images. Figure 8a displays histogram mapping for pitting, Figure 8b displays for striation, Figure 8c is for rough, and Figure 8d is mapping for fatigue particles. The analysis findings show different histogram patterns utilized to categorize the various textures.
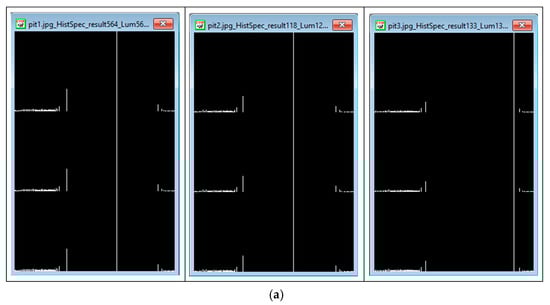
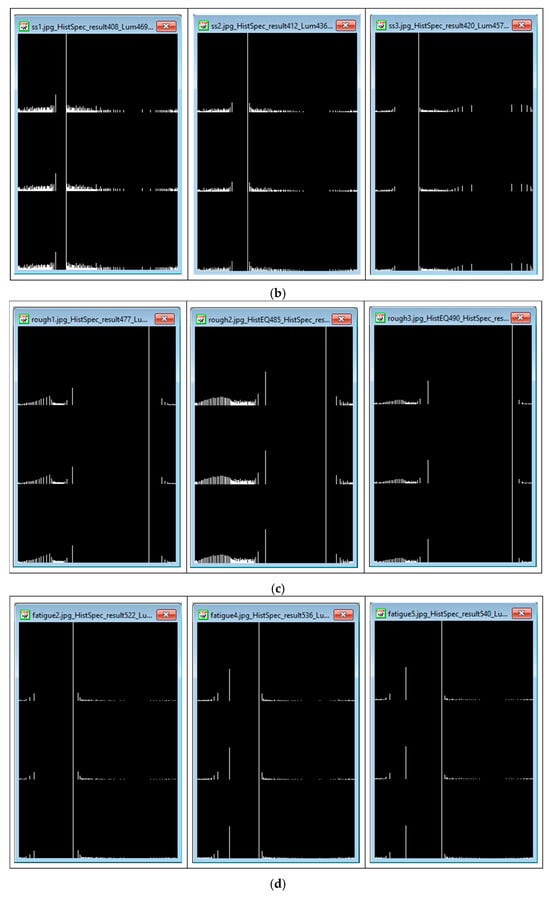
Figure 8.
(a). Histogram specification for the pitting particle textures. (b). Histogram specification for the striation particle textures. (c). Histogram specification for the rough particle textures. (d). Histogram specification for the fatigue particle texture.
6. Conclusions
The edge detection methods, Sobel, Laplacian, Boie–Cox, and Canny, are compared in this paper for automatically classifying wear particle textures using artificial neural networks (ANNs). With the most significant classification accuracies of 98.9% and 97.9%, respectively, the Canny and Laplacian algorithms outperformed the others in extracting high-fidelity texture boundaries. Their sophisticated noise suppression, gradient sensitivity, and fine-detail enhancement capabilities—crucial for differentiating between wear particles with comparable morphological features—are responsible for this performance difference.
Based on the comparison analysis, our study suggests the Canny algorithm as the best approach for situations needing high edge accuracy and resilience to image noise. The Laplacian operator is both practical and computationally economical, which makes it appropriate for embedded and resource-constrained systems due to its robust reaction to sudden intensity changes. Boie–Cox or Sobel may be lightweight substitutes for applications where a lower level of computational complexity is acceptable, but they are less dependable on complicated textures.
This work has significant practical ramifications. The suggested automated texture categorization system can be included in current condition monitoring platforms in industrial settings, including manufacturing, energy, and aerospace, to facilitate quicker, more accurate diagnostics with less reliance on human experience. This reduces operational hazards related to undetected component degradation and improves maintenance scheduling.
Future studies will investigate using hybrid deep learning models to improve diagnostic granularity and integrating this technology into edge computing systems for real-time analysis. Because of its adaptability and versatility, the suggested framework is a solid contender for implementation in Industry 4.0 ecosystems’ next-generation innovative maintenance systems.
Author Contributions
Conceptualization, M.L.; Methodology, M.L.; Software, M.T.; Validation, M.H.; Formal analysis, M.H.; Investigation, A.H.; Resources, A.W.; Data curation, A.E.; Writing—original draft, M.L.; Writing—review & editing, M.T. and A.E.; Visualization, A.W.; Funding acquisition, A.H. All authors have read and agreed to the published version of the manuscript.
Funding
This research received no external funding.
Data Availability Statement
The raw data supporting the conclusions of this article will be made available by the authors on request.
Conflicts of Interest
The authors declare no conflict of interest.
References
- Williams, J.A.; Hyncica, A.M. Tribology: Friction, Wear, and Lubrication; Cambridge University Press: Cambridge, UK, 2019. [Google Scholar]
- Raadnui, S. Wear Particle Analysis: A Review. Tribol. Int. 2005, 38, 985–1007. [Google Scholar] [CrossRef]
- Heng, A.; Zhang, S.; Tan, A.C.; Mathew, J. Intelligent Condition Monitoring and Diagnosis of Petroleum Engines Using Ferrography. Mech. Syst. Signal Process. 2009, 23, 748–769. [Google Scholar]
- Hsu, S.M.; Li, S. Spectrometric Oil Analysis: Early Detection of Failures in Oil-Lubricated Machinery. Tribol. Trans. 2004, 47, 469–475. [Google Scholar]
- Laghari, M.S.; Memon, Q.A.; Khuwaja, G.A. Knowledge Based Wear Particle Analysis. Int. J. Inf. Tech. 2007, 12, 965–969. [Google Scholar]
- Khuwaja, G.A.; Laghari, M.S. Computer Vision for Wear Debris Analysis. Int. J. Comp. Appl. Tech. 2002, 15, 70–78. [Google Scholar] [CrossRef]
- Jia, R.; Wang, L.; Zheng, C.; Chen, T. Online Wear Particle Detection Sensors for Wear Monitoring of Mechanical Equipment—A Review. IEEE Sens. J. 2022, 22, 2930–2947. [Google Scholar] [CrossRef]
- Tao, H.; Feng, W.; Yang, G.; Du, R.; Zhong, Y. A Wear Condition Warning Method for Wind Turbine Gearbox Based on Oil Online Monitoring Using Learnable Multiscale Convolutional Neural Network. IEEE Sens. J. 2024, 24, 35709–35721. [Google Scholar] [CrossRef]
- Jiao, D.; Urban, A.; Zhu, X.; Zhe, J. Oil Property Sensing Array Based on a General Regression Neural Network. Tribol. Int. 2021, 164, 107221. [Google Scholar] [CrossRef]
- Zhang, Y.; Hong, J.; Shi, H.; Xie, Y.; Zhang, H.; Zhang, S.; Li, W.; Chen, H. Magnetic Plug Sensor with Bridge Nonlinear Correction Circuit for Oil Condition Monitoring of Marine Machinery. J. Mar. Sci. Eng. 2022, 10, 1883. [Google Scholar] [CrossRef]
- Wang, J.; Liu, X.; Wu, M.; Wang, X. Direct Detection of Wear Conditions by Classification of Ferrograph Images. J. Braz. Soc. Mech. Sci. Eng. 2020, 42, 152. [Google Scholar] [CrossRef]
- Peng, Z.; Kirk, T.B.; Xu, Y. Machine Learning in Wear Particle Analysis: A Review. Tribol. Int. 2020, 147, 106276. [Google Scholar]
- Han, W.; Mu, X.; Liu, Y.; Wang, X.; Li, W.; Bai, C.; Zhang, H. A Critical Review of On-Line Oil Wear Debris Particle Detection Sensors. J. Mar. Sci. Eng. 2023, 11, 2363. [Google Scholar] [CrossRef]
- Yang, S.; Cao, N.; Yu, B. Wear debris measurement in lubricating oil based on inductive method: A review. Meas. Control 2023, 56, 1422–1435. [Google Scholar] [CrossRef]
- Zhang, M.; El Ghannudi, H.; Marcaccioli, L.; Montori, S.; Bao, X.; Markovic, T. High-Sensitivity Large-Throughput Broadband Tunable Microwave Wear Debris Sensing System. IEEE Sens. 2022, 22, 304–314. [Google Scholar] [CrossRef]
- Laghari, M.S. Recognition of Texture Types of Wear Particles. Neural Comp. Appl. 2003, 12, 18–25. [Google Scholar] [CrossRef]
- Laghari, M.S.; Boujarwah, A. Wear Particle Texture Classification using Artificial Neural Networks. IJPRAI 1999, 13, 415–428. [Google Scholar] [CrossRef]
- Laghari, M.S.; Hassan, A. Wear Particle Texture Analysis. In Proceedings of the 3rd IEEE International Conference on Imaging, Signal Processing and Communication, Singapore, 27–29 July 2019. [Google Scholar]
- Laghari, M.S.; Hassan, A.; Noman, M. Classifying Wear Particles Based on Texture Analysis. Smart Inno. Sys. Tech. 2023, 351, 163–175. [Google Scholar]
- Roylance, B.J. Wear Debris Analysis for Condition Monitoring. In Proceedings of the 32nd Annual British Conference on Non-Destructive Testing, Cardiff, UK, 14 September 1993. [Google Scholar]
- Laghari, M.S.; Alneyadi, A.M.S.; Alawlaqi, A.Y.; Maraqa, A. Identifying Wear Particles with their Shape Attribute. In Proceedings of the 16th Int. Conf. on Computer Graphics, Visualization, Computer Vision and Image Processing, Lisbon, Portugal, 19–22 July 2022. [Google Scholar]
- Wu, T.; Wu, H.; Du, Y.; Kwok, N.; Peng, Z. Imaged Wear Debris Separation for On-Line Monitoring Using Gray Level and Integrated Morphological Features. Wear 2014, 316, 19–29. [Google Scholar] [CrossRef]
- Roylance, B.J.; Albidewi, I.A.; Laghari, M.S.; Luxmoore, A.R.; Deravi, F. Computer Aided Vision Engineering (CAVE)—Quantification of Wear Particle Morphology. J. Soc. Tribol. Lubr. Eng. 1994, 50, 111–116. [Google Scholar]
- Laghari, M.S. Shape and Edge Detail Analysis for Wear Debris Identification. Int. J. Comp. Appl. 2003, 10, 271–279. [Google Scholar]
- Anderson, D.P. Wear Particle Atlas. (Revised); Noria Corporation: Tulsa, OK, USA, 2012. [Google Scholar]
- Roylance, B.J.; Hunt, T.M. Wear Debris Analysis; Coxmoor Publishing: Oxford, UK, 1999. [Google Scholar]
- Stachowiak, G.W.; Batchelor, A.W. Engineering Tribology, 4th ed.; Butterworth-Heinemann: Oxford, UK, 2013. [Google Scholar]
- Umbaugh, S.E. Digital Image Processing and Analysis, Digital Image Enhancement, Restoration and Compression, 4th ed.; CRC Press: Boca Raton, FL, USA, 2022. [Google Scholar]
- Leica Microsystems. Available online: https://www.leica-microsystems.com/products/microscope-cameras/?utm_source=chatgpt.com (accessed on 8 May 2025).
- Canny, J. A Computational Approach to Edge Detection. IEEE Trans. Pattern Anal. Mach. Intell. 1986, 8, 679–698. [Google Scholar] [CrossRef]
Disclaimer/Publisher’s Note: The statements, opinions and data contained in all publications are solely those of the individual author(s) and contributor(s) and not of MDPI and/or the editor(s). MDPI and/or the editor(s) disclaim responsibility for any injury to people or property resulting from any ideas, methods, instructions or products referred to in the content. |
© 2025 by the authors. Licensee MDPI, Basel, Switzerland. This article is an open access article distributed under the terms and conditions of the Creative Commons Attribution (CC BY) license (https://creativecommons.org/licenses/by/4.0/).