
Aqueous Cymbopogon citratus Extract Mediated Silver Nanoparticles: Part II. Dye Degradation Studies


 , and
, and
Abstract
1. Introduction
2. Materials and Methods
2.1. Materials
2.2. Stock Solutions
2.3. Catalytic Studies
2.3.1. Dye Degradation
2.3.2. Role of Scavengers
2.3.3. Influence of Parameters
2.3.4. Reusability
2.3.5. Pseudo-First-Order Kinetics
2.4. Statistical Analysis
3. Results and Discussion
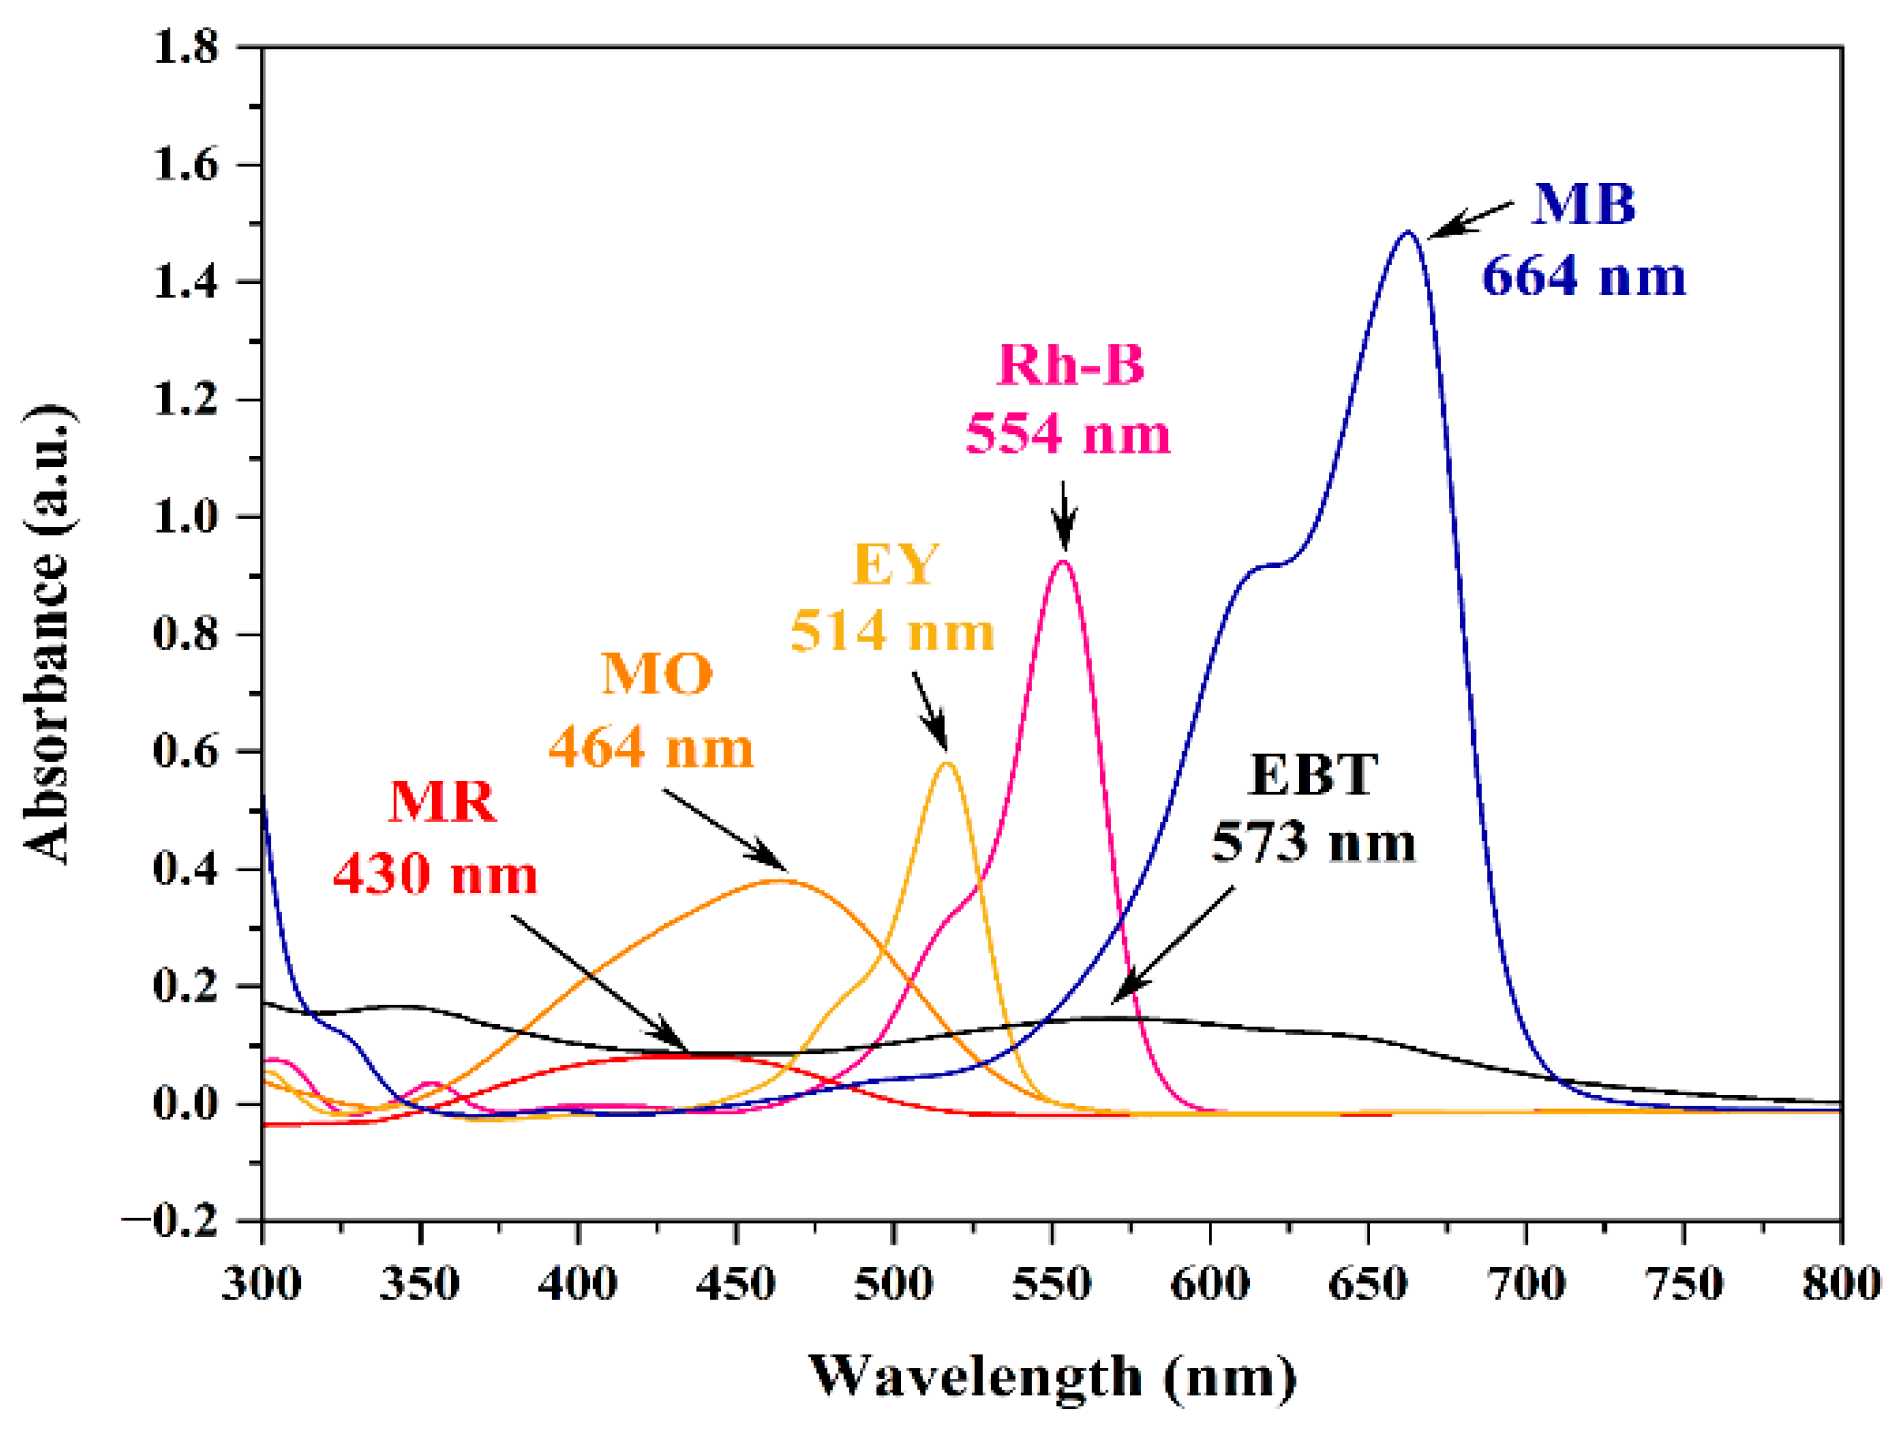
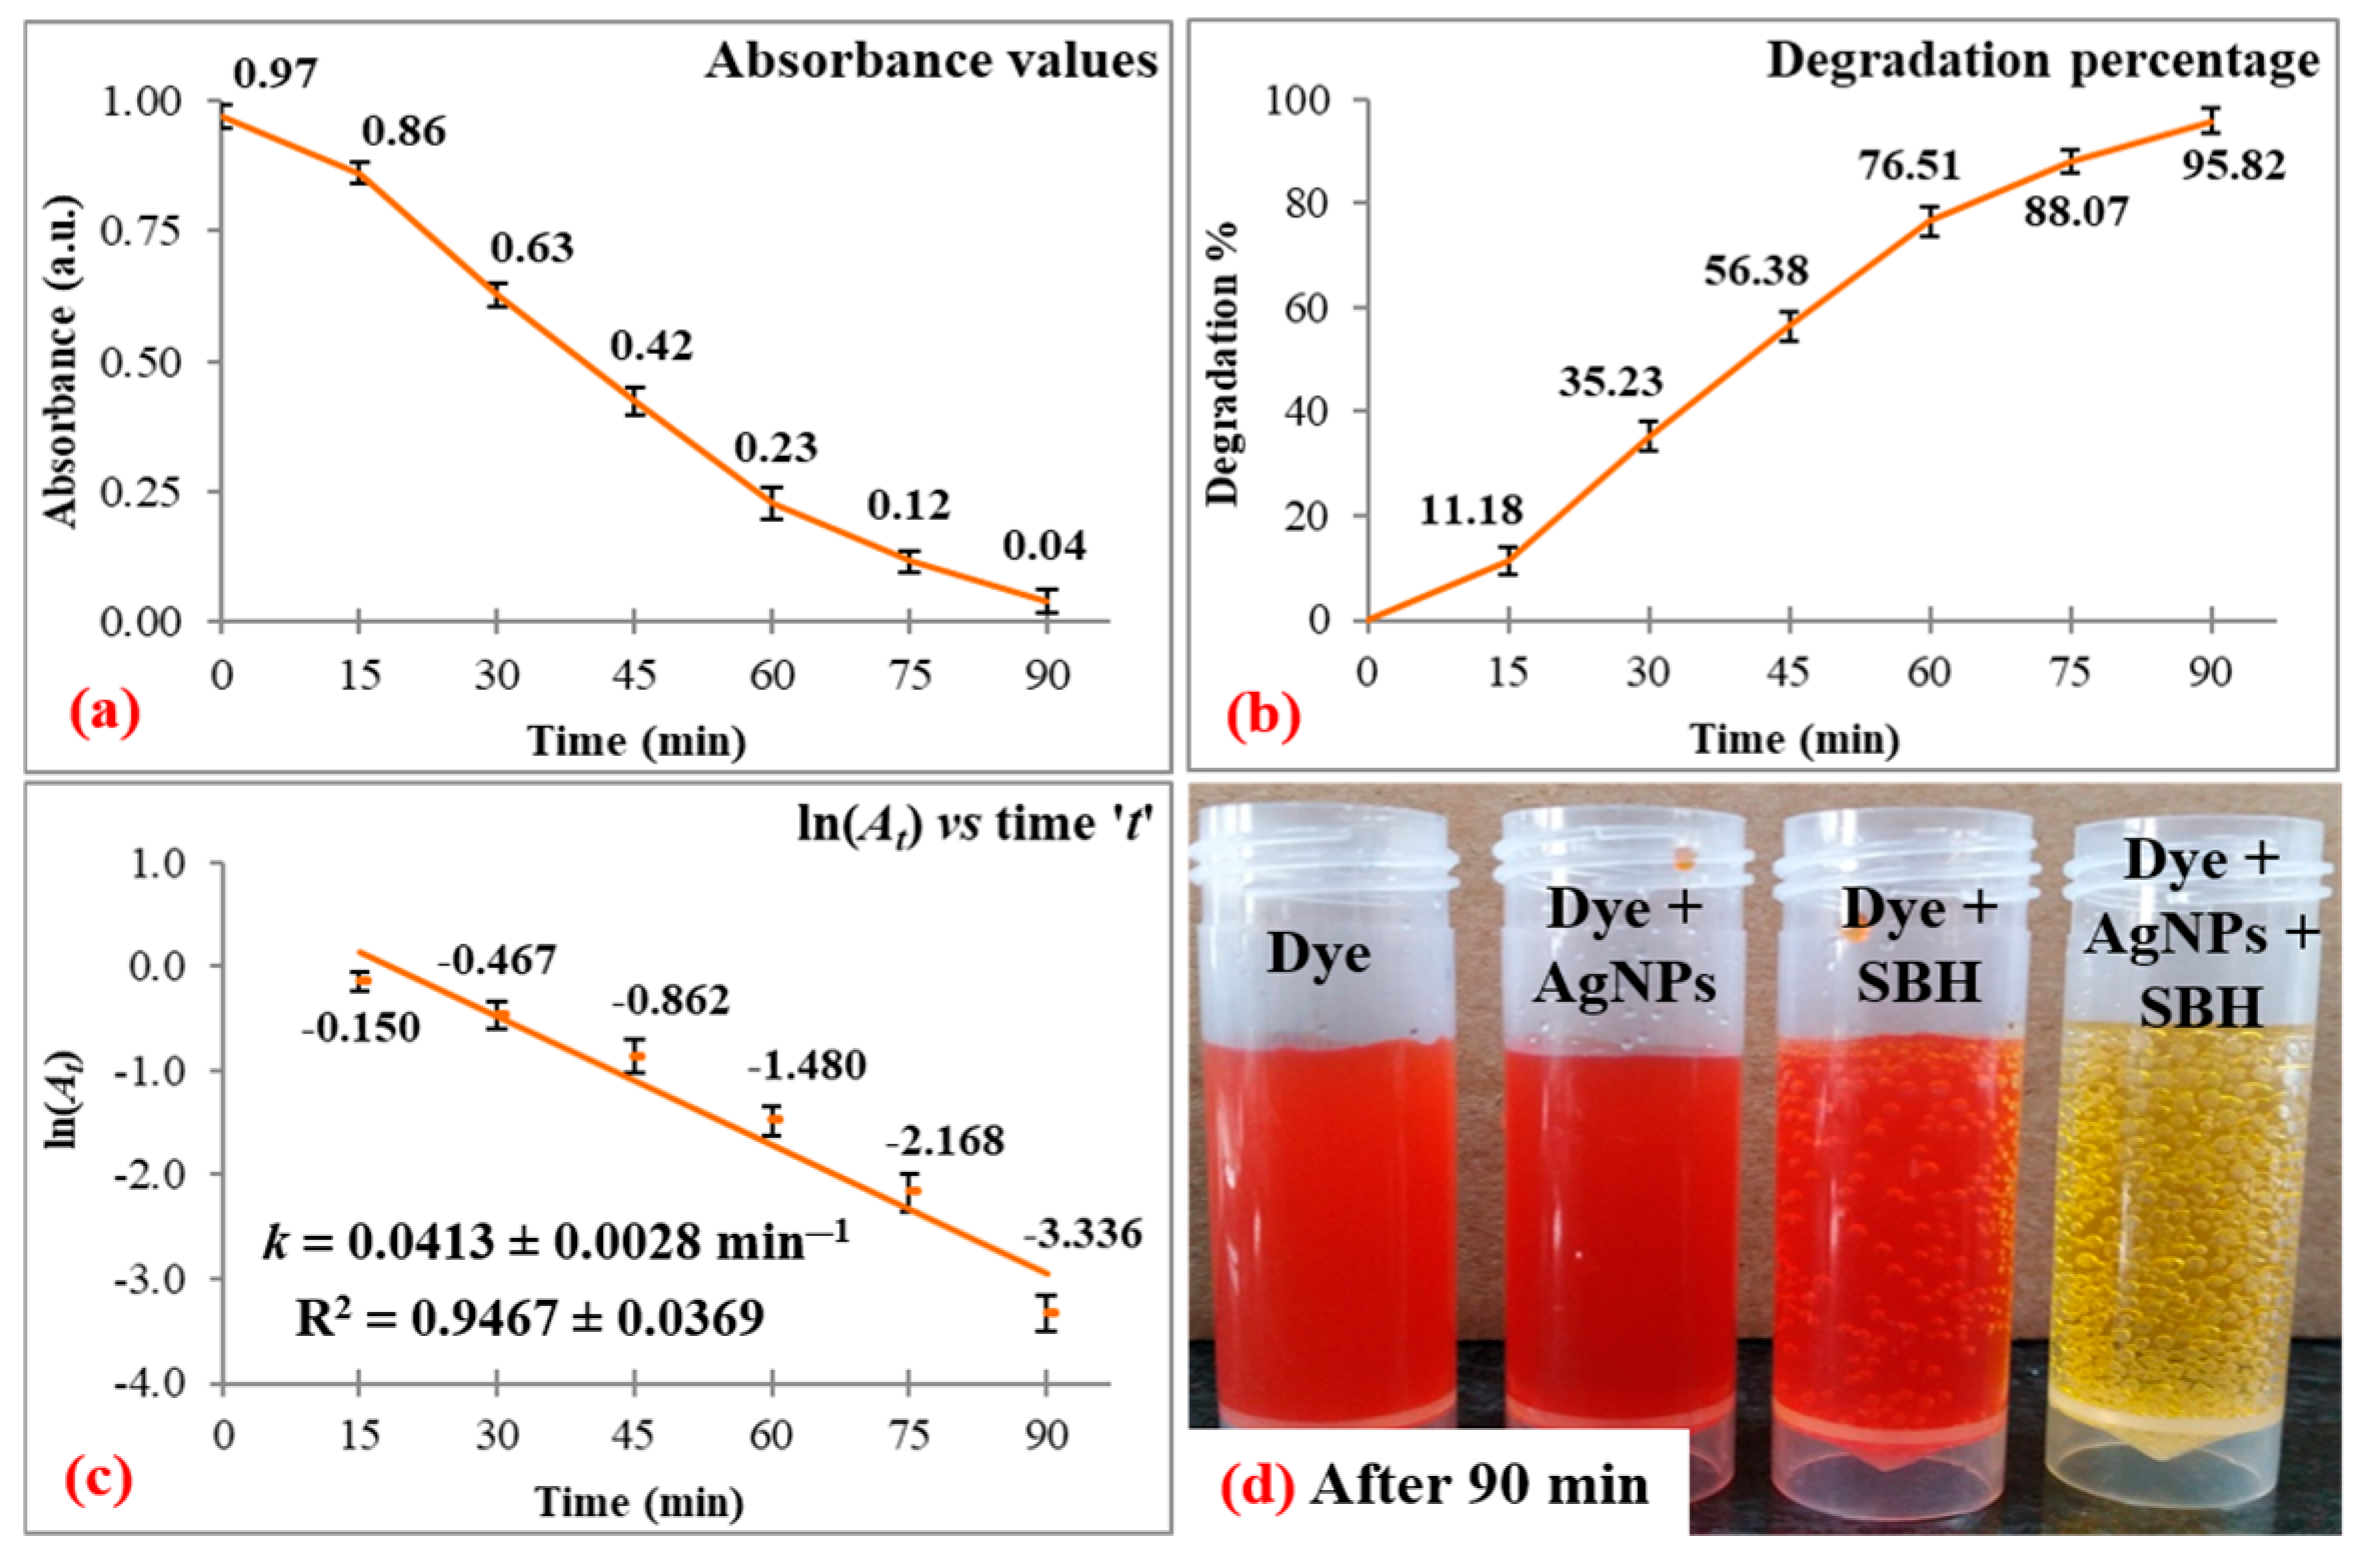
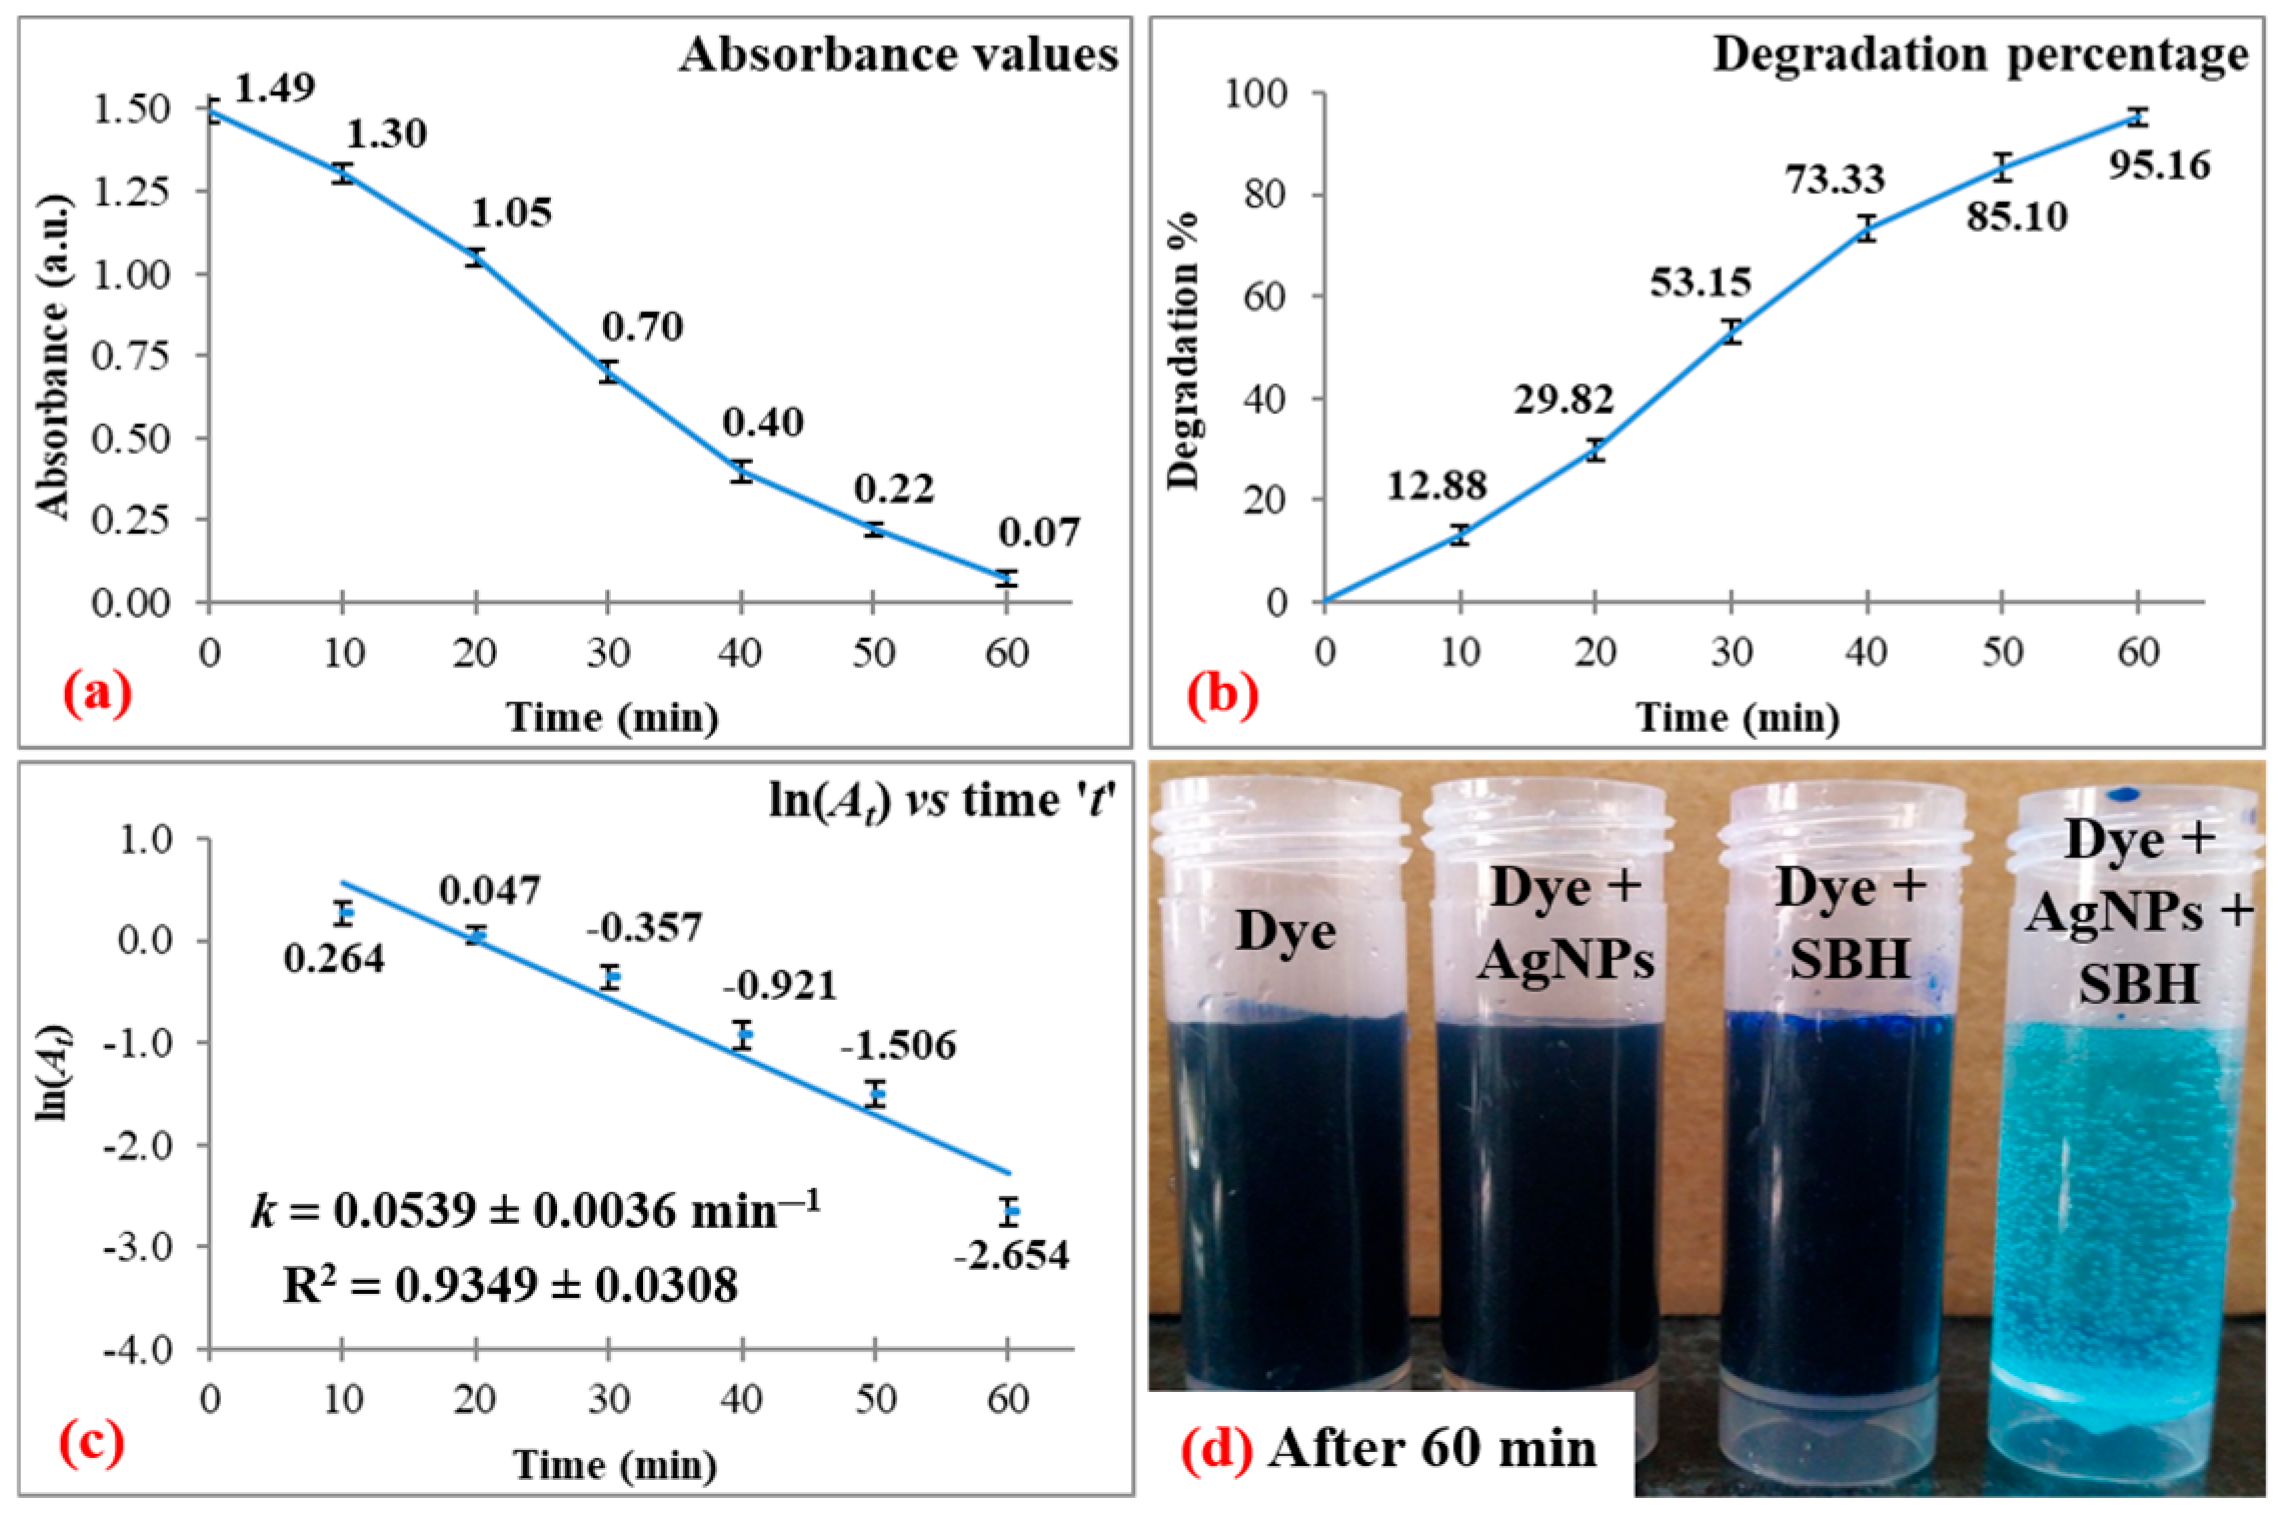
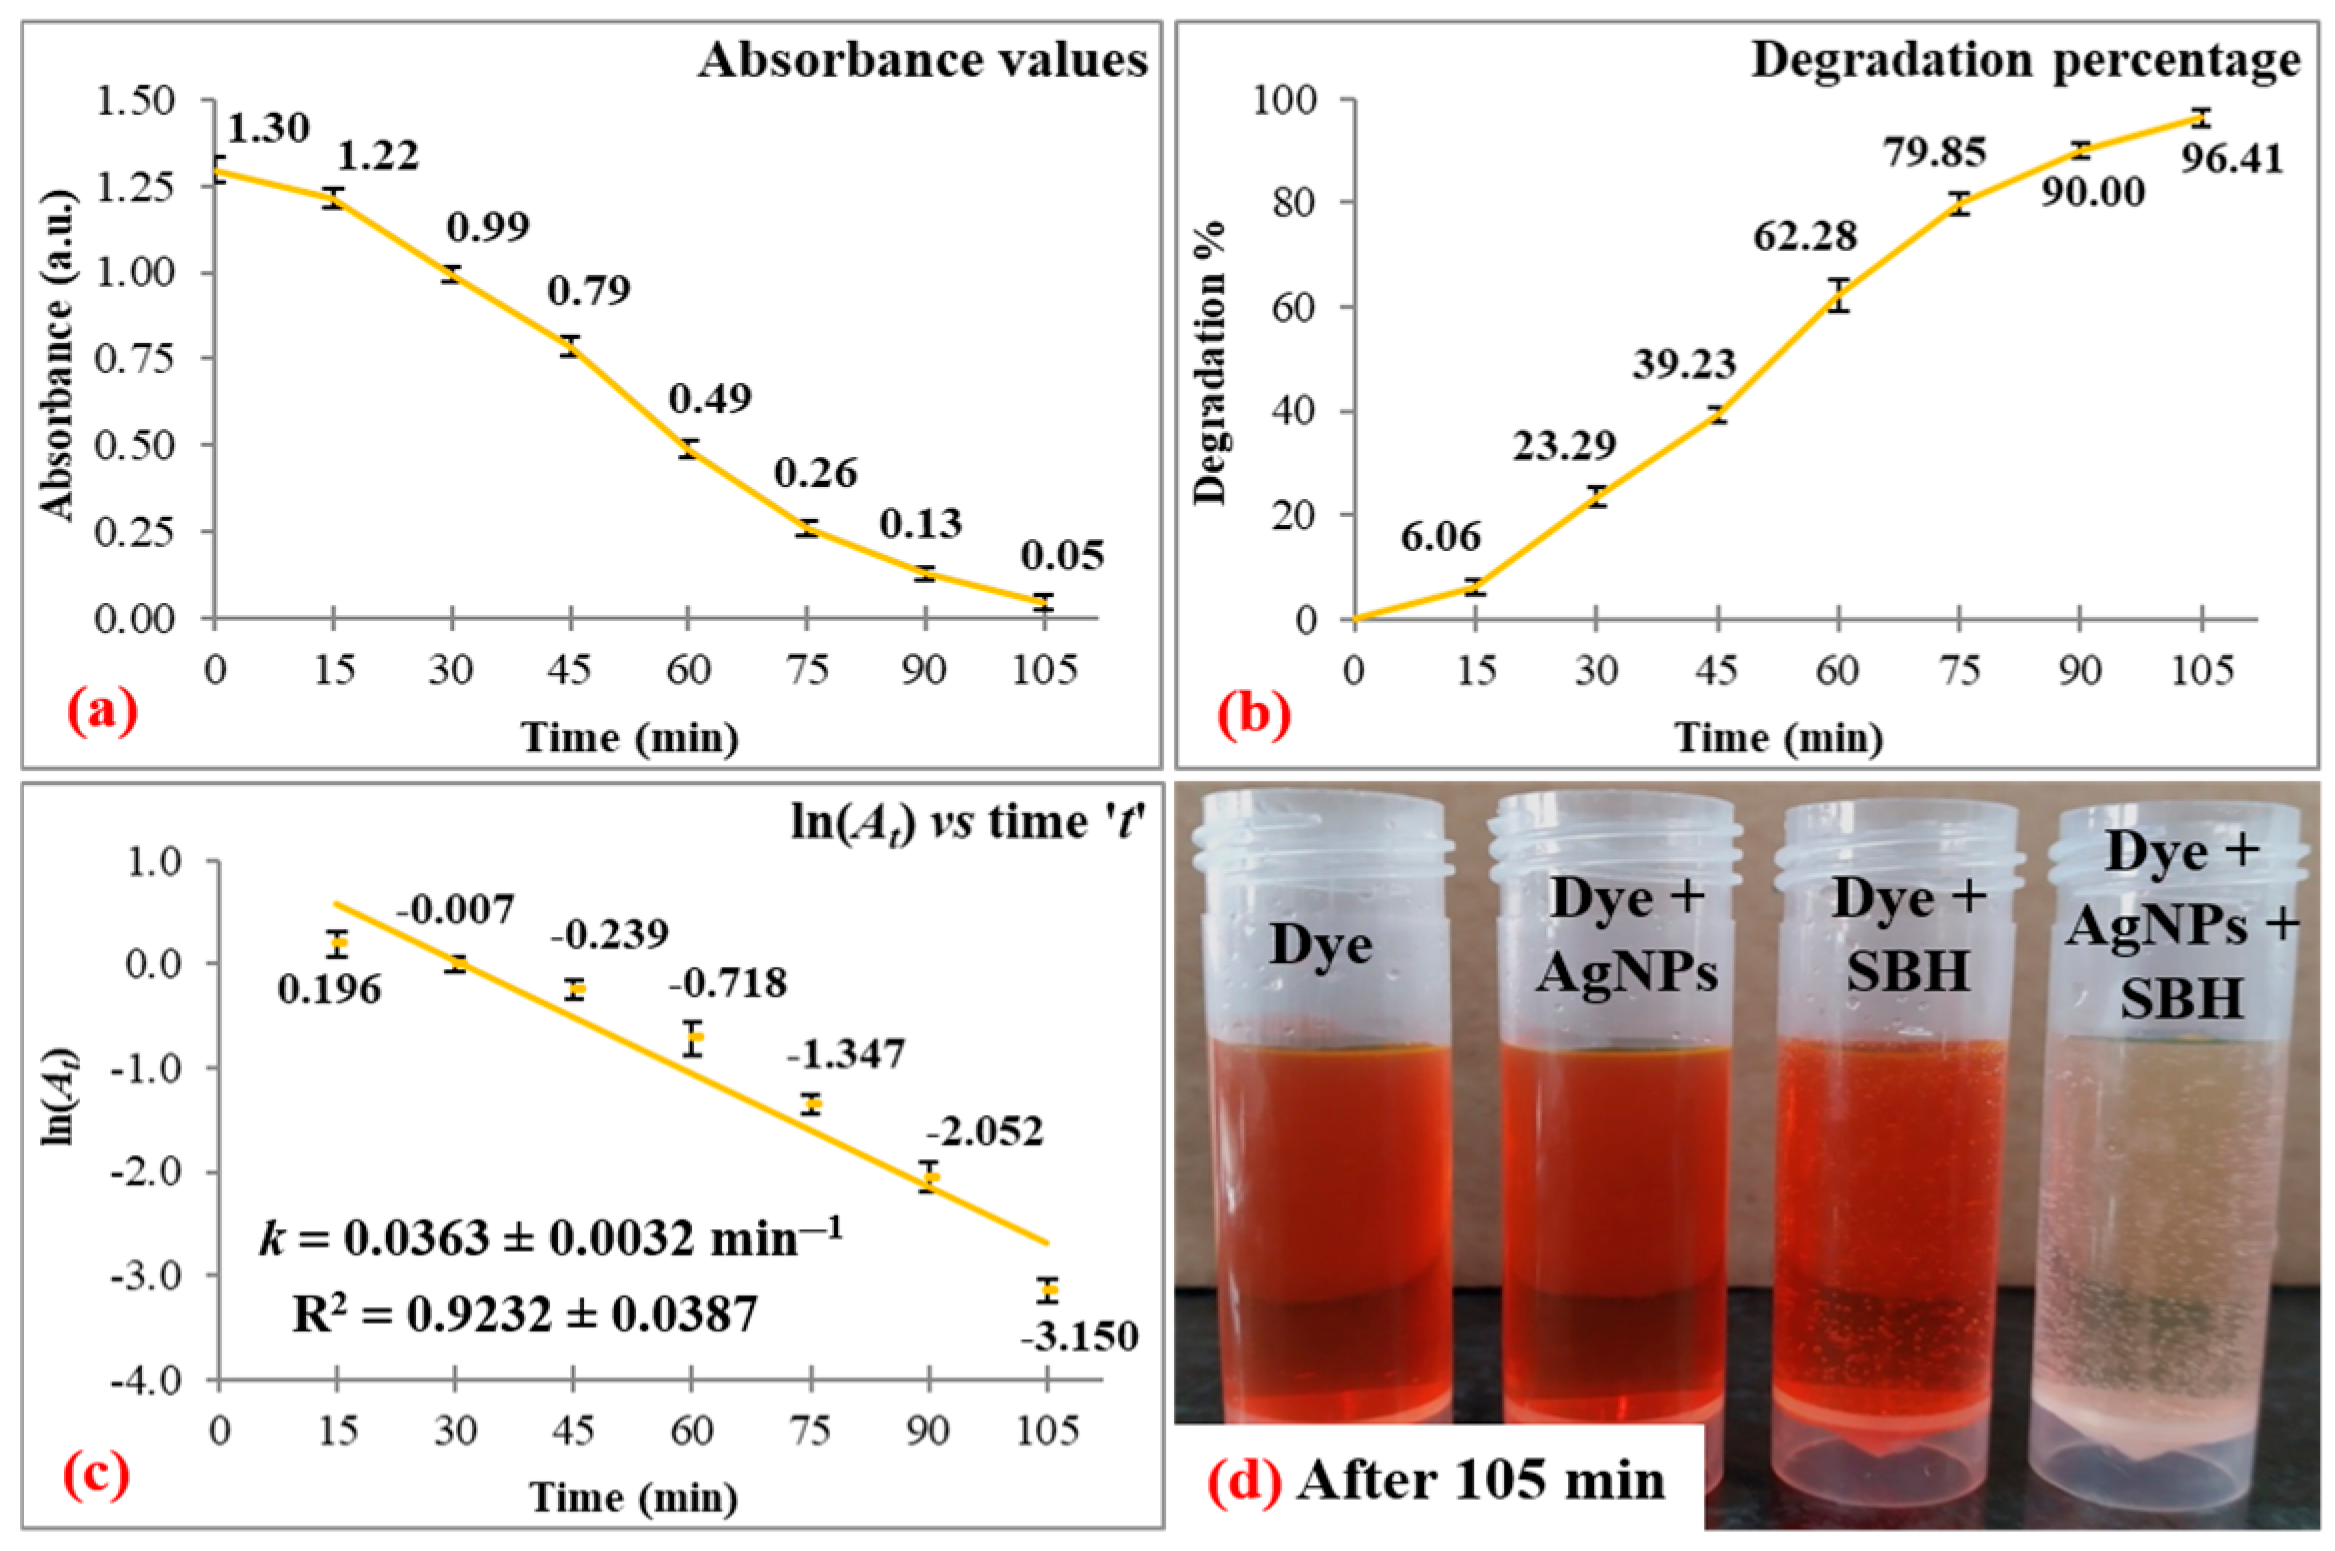
3.1. Dye Degradation Studies
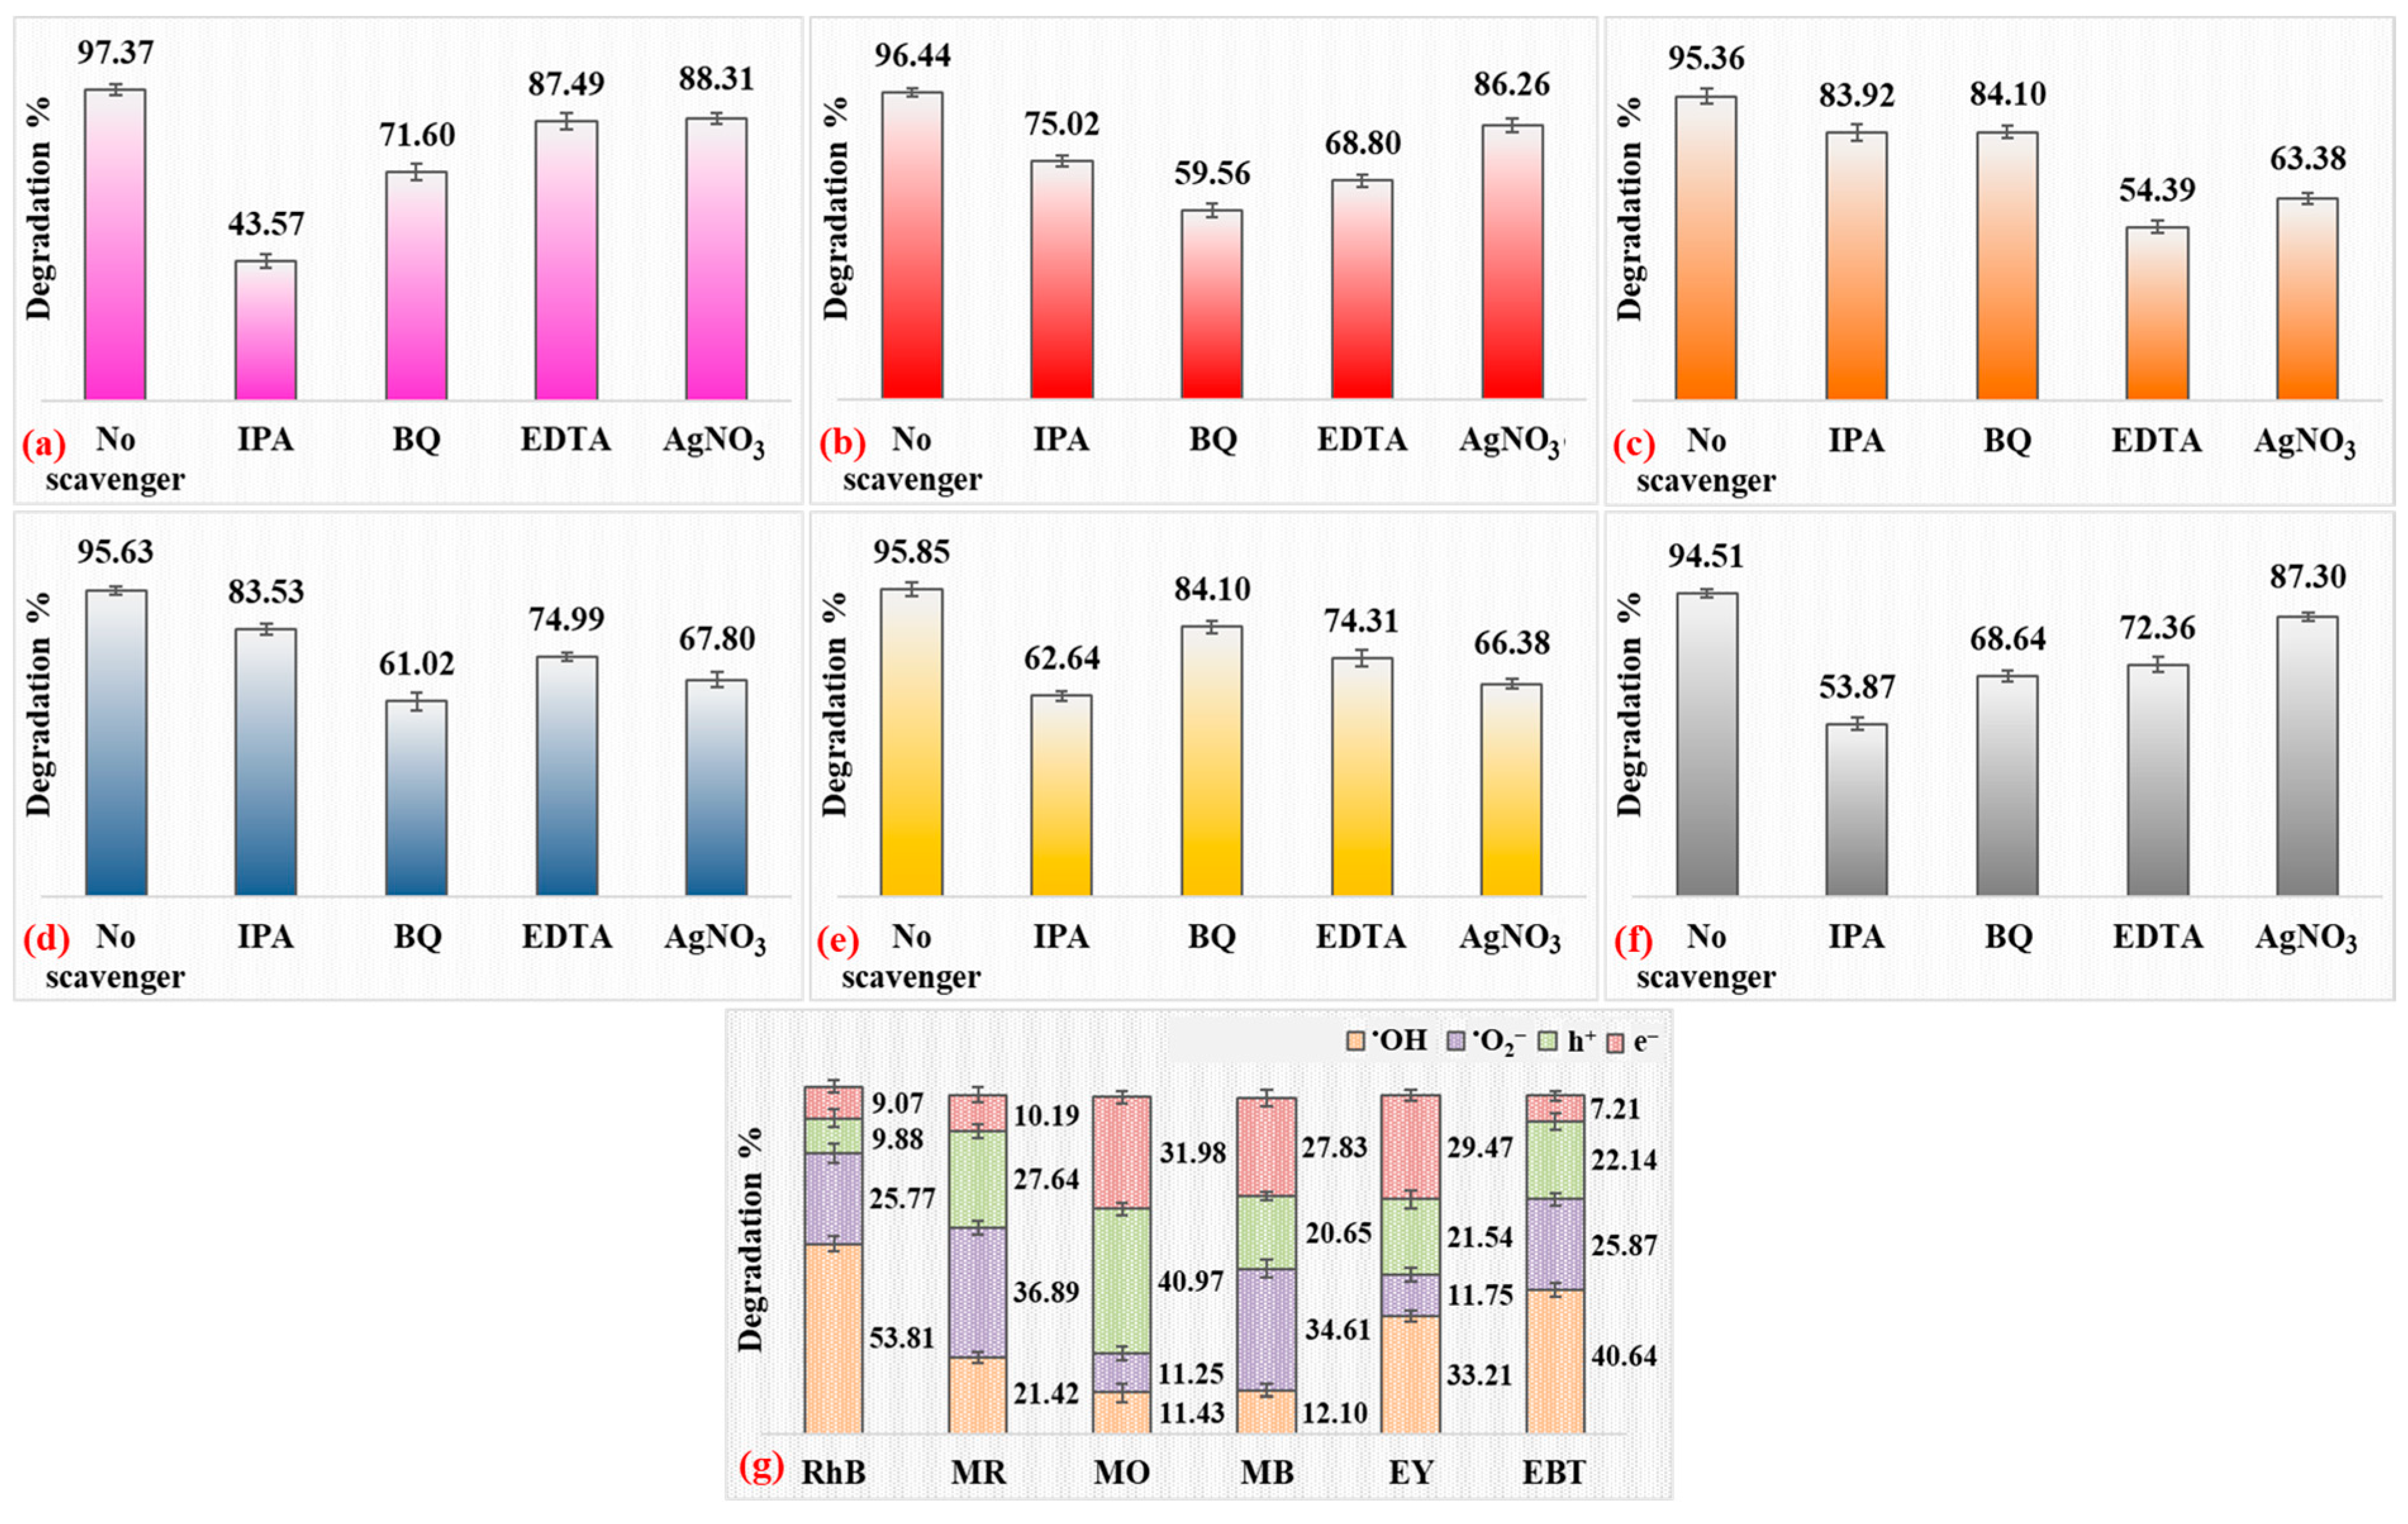
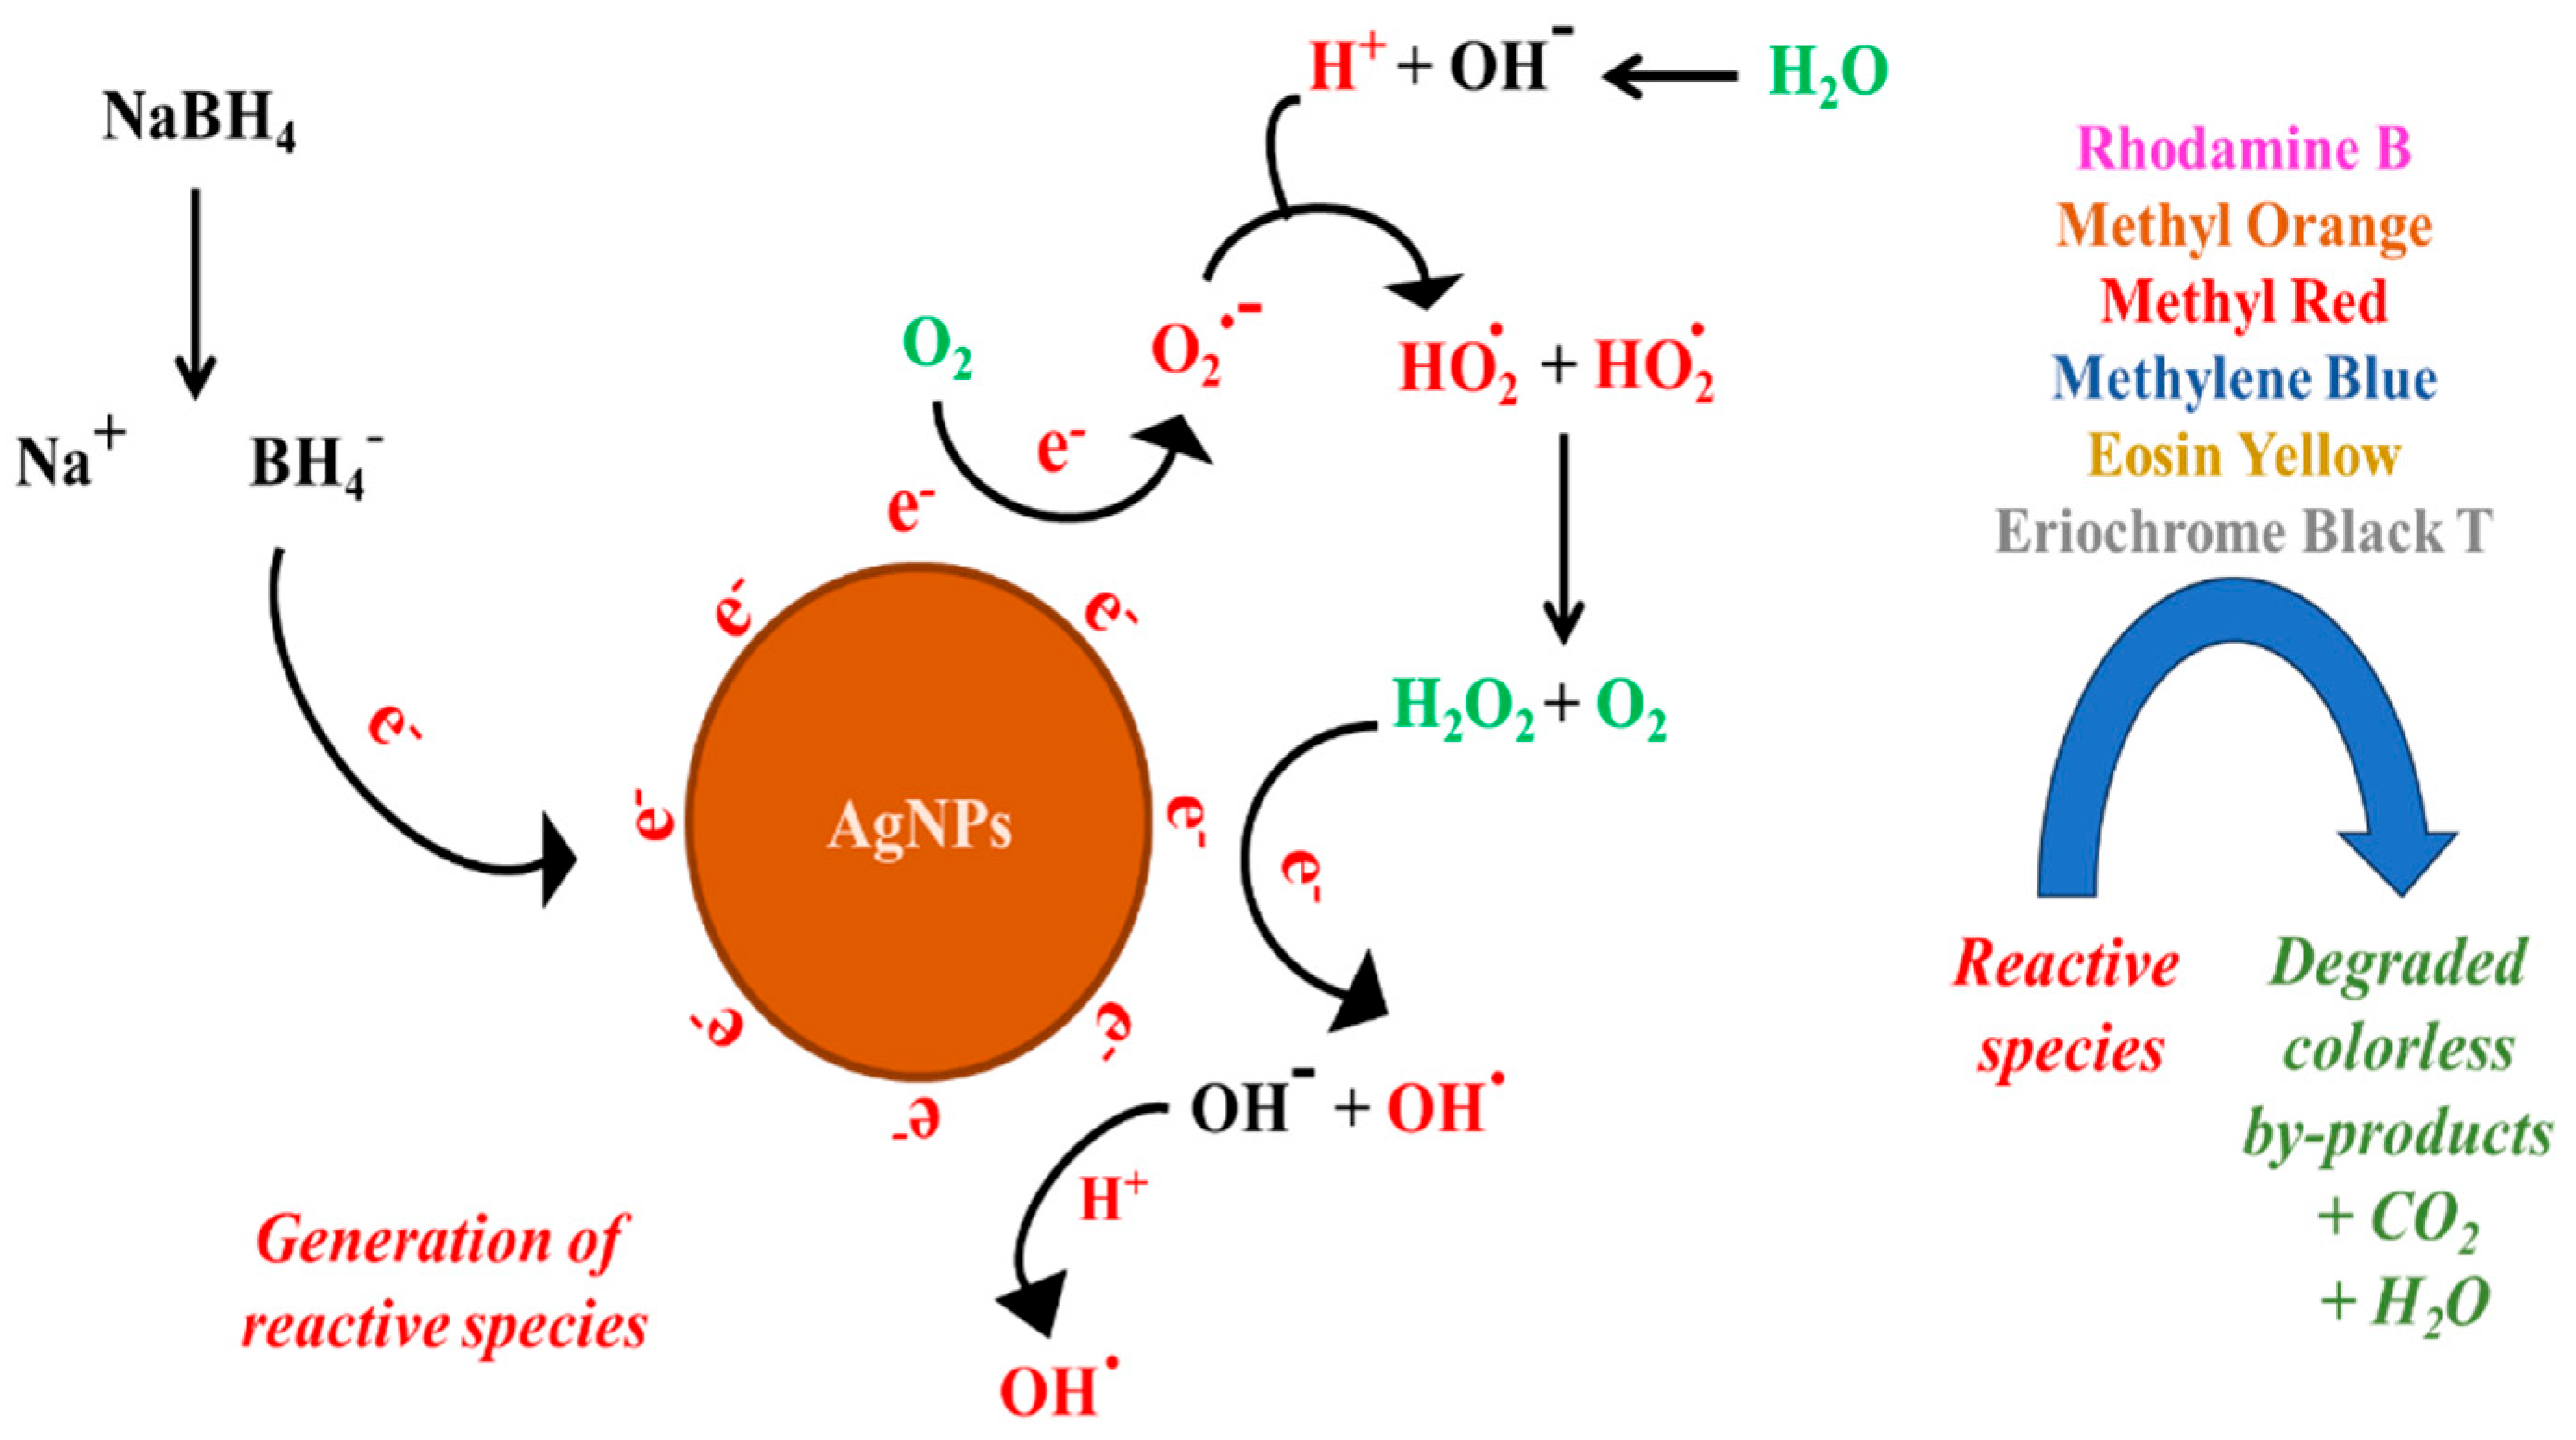
3.2. Role of Scavengers
3.3. Influence of Parameters
3.3.1. Nano-Catalyst (AgNP) Concentration
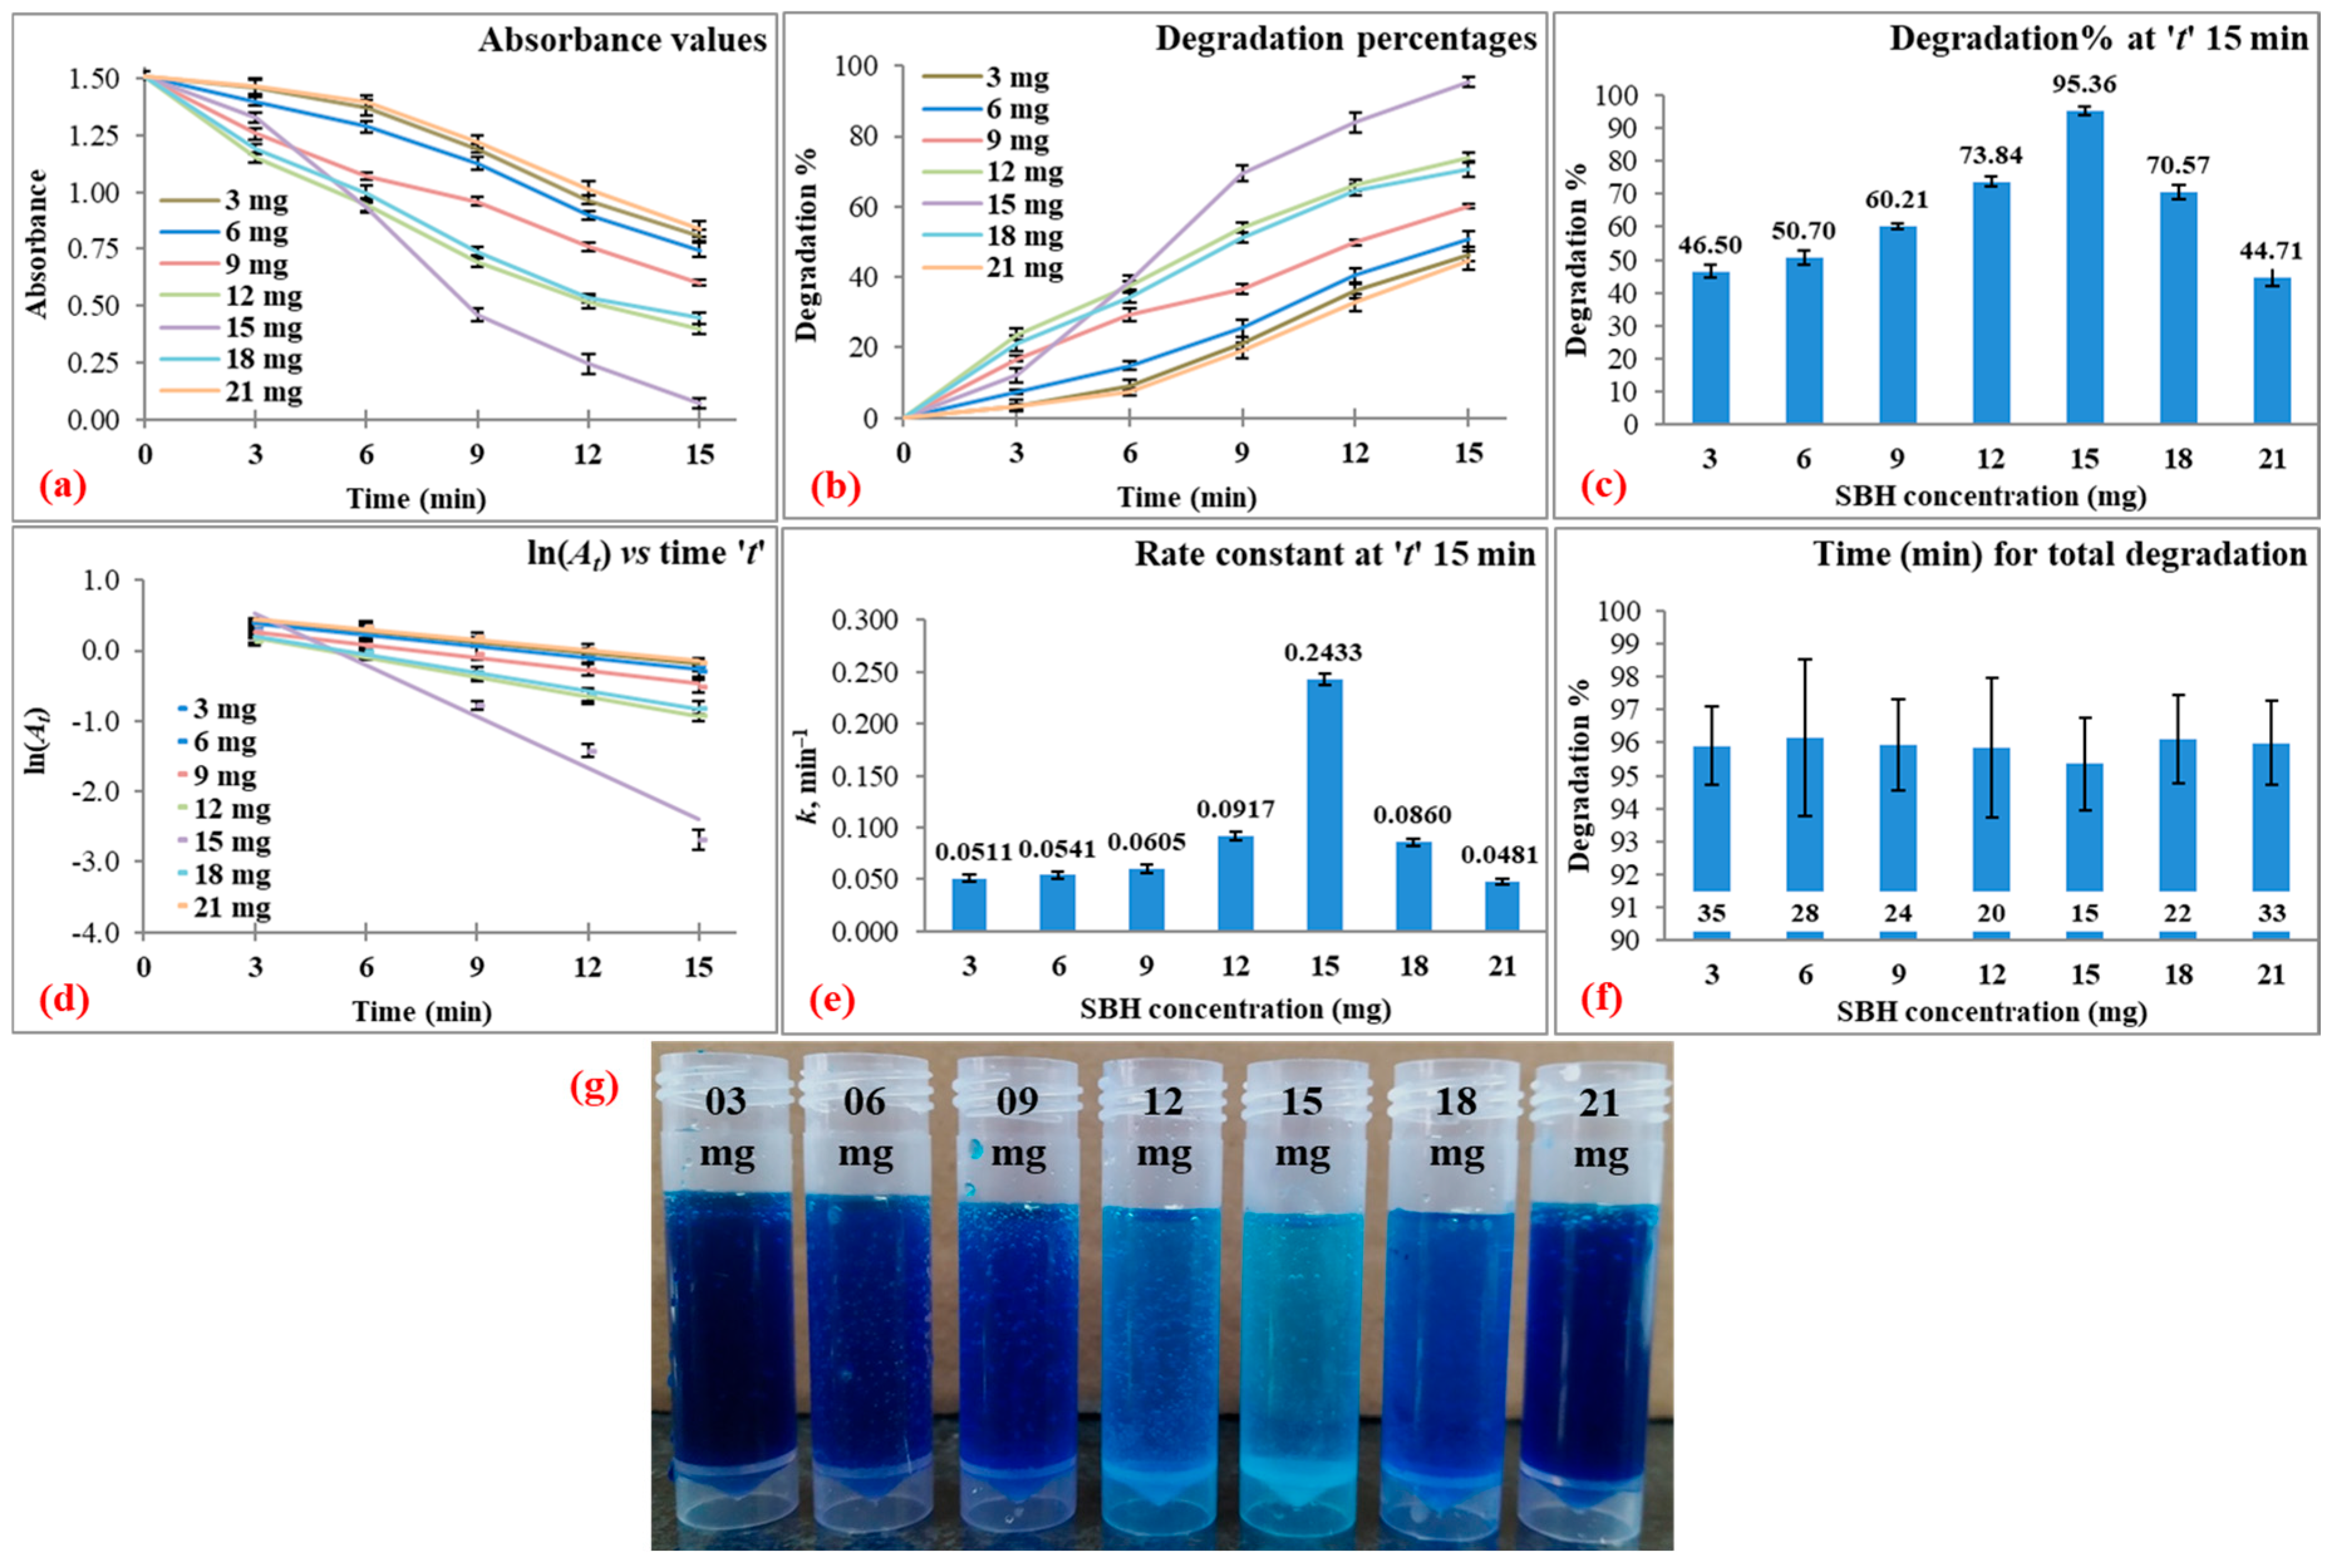
3.3.2. Reducing Agent (SBH) Concentration
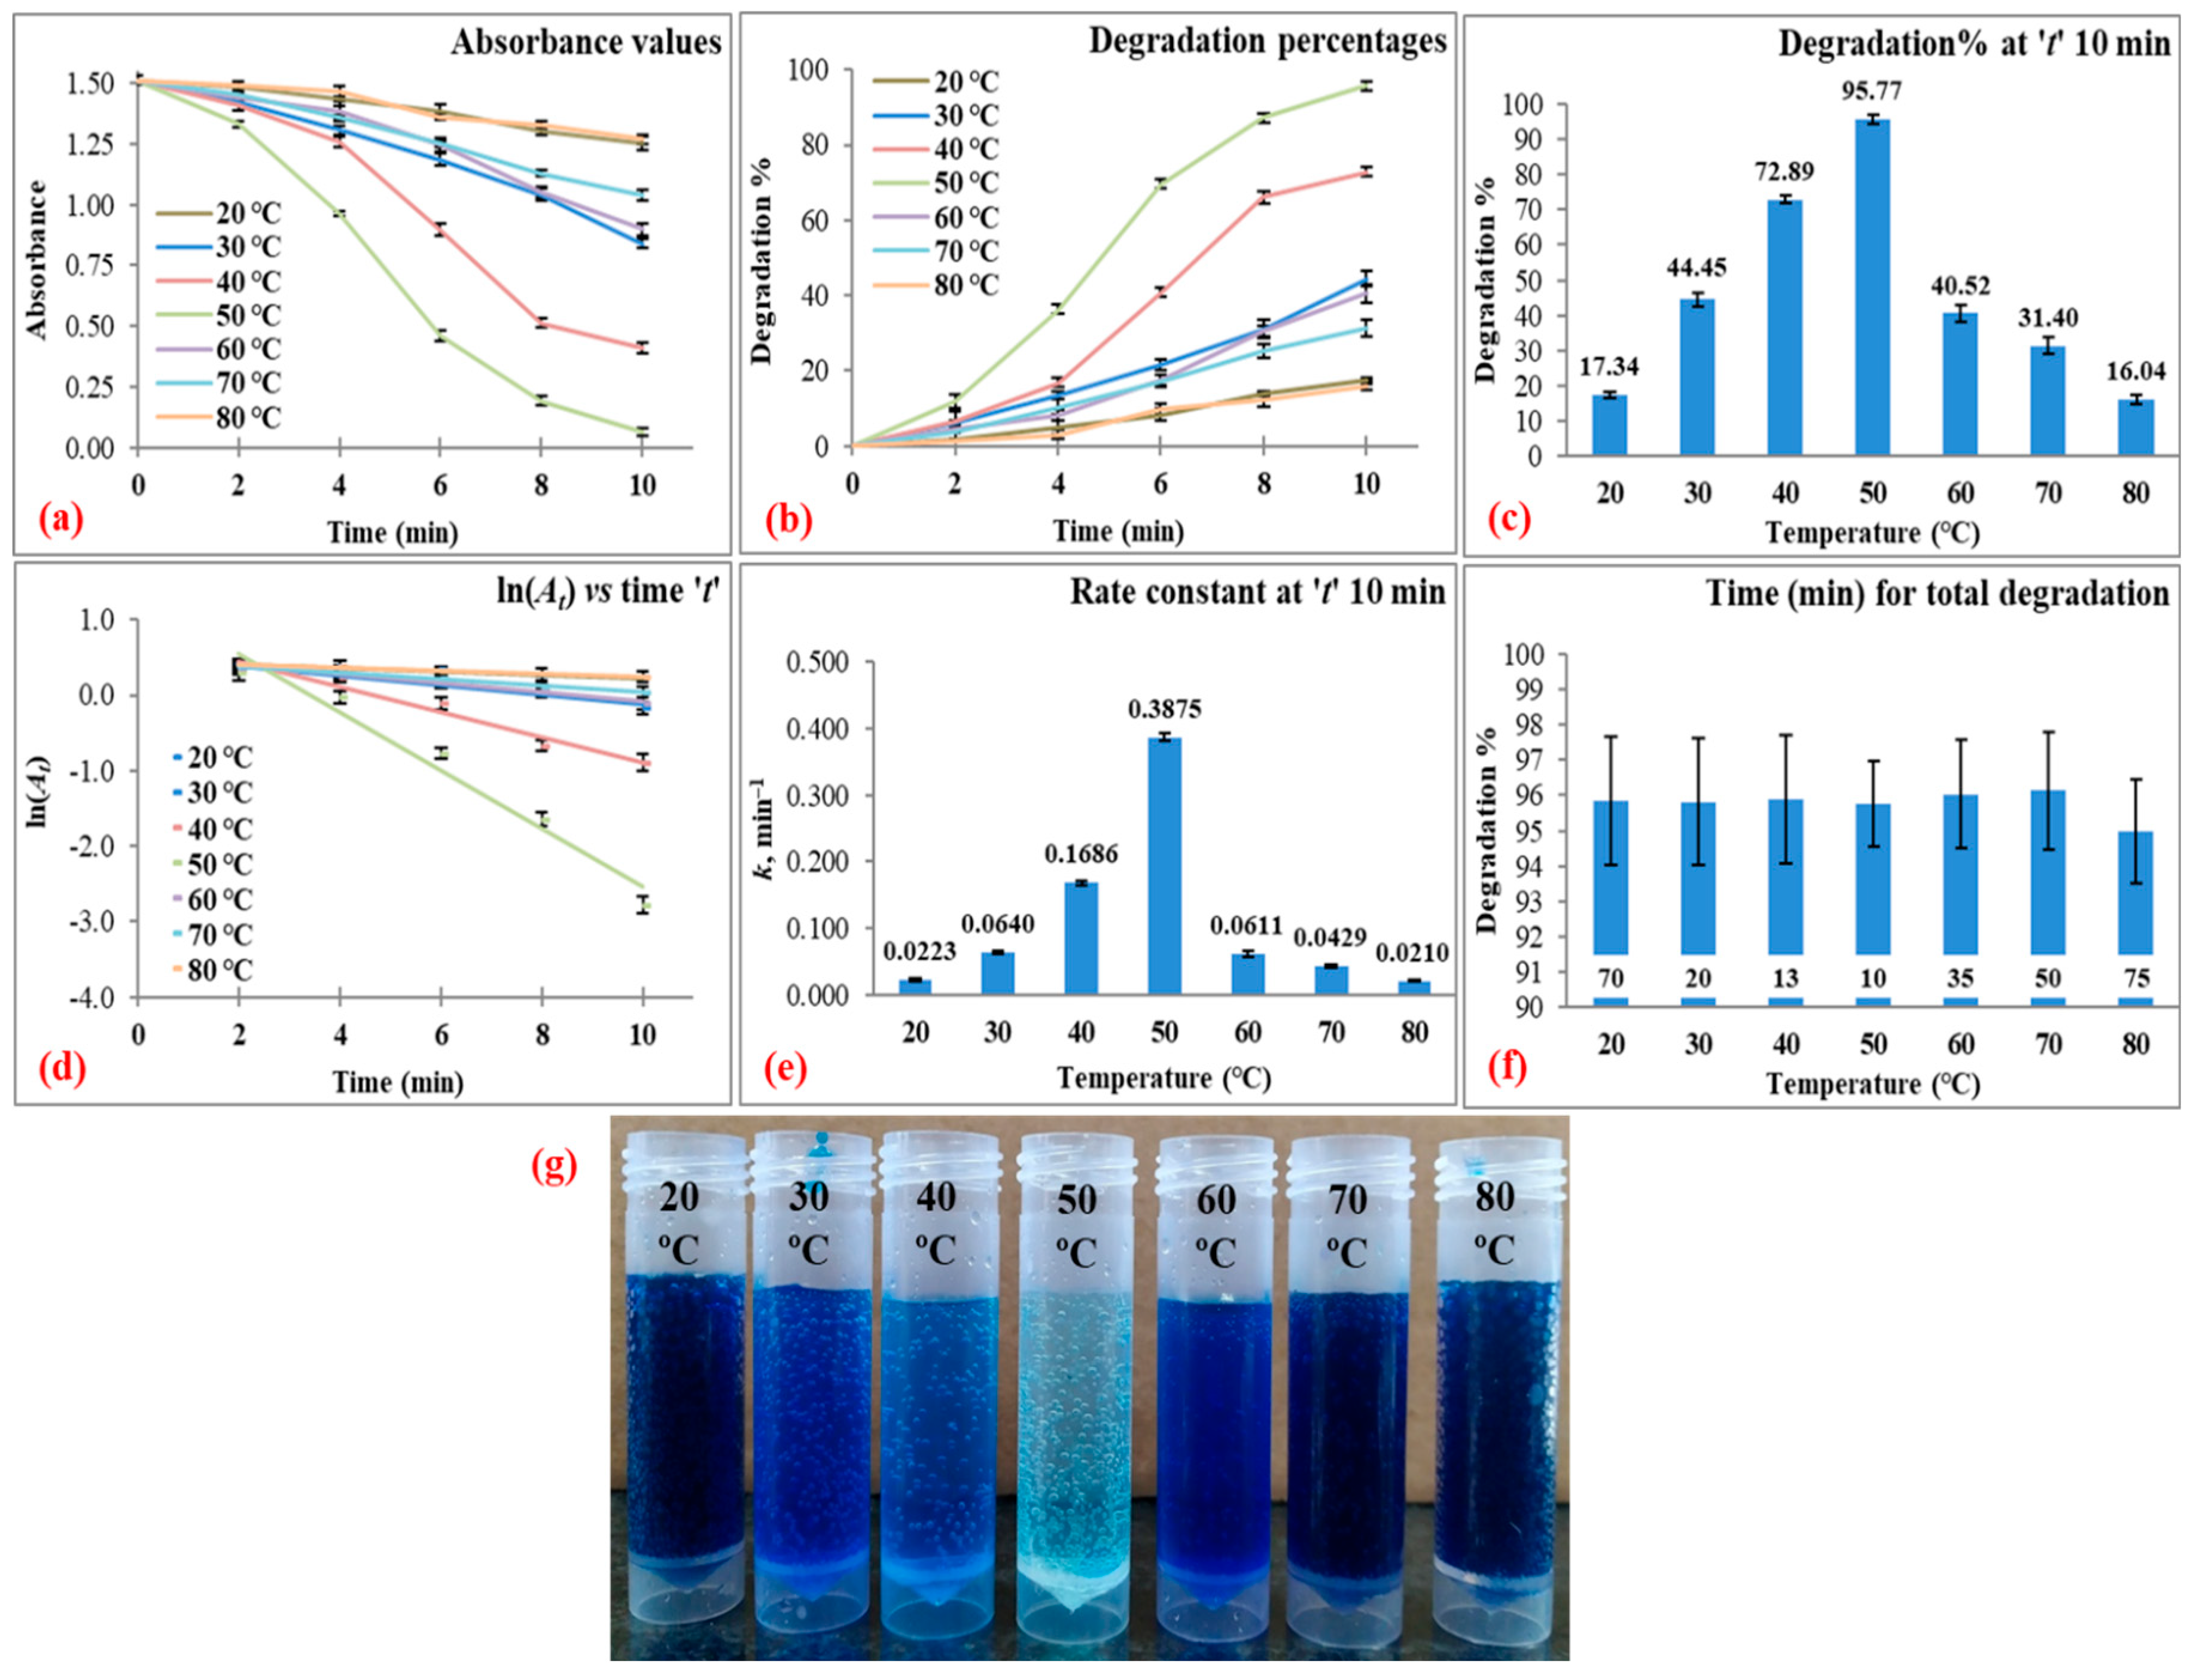
3.3.3. Reaction Temperature
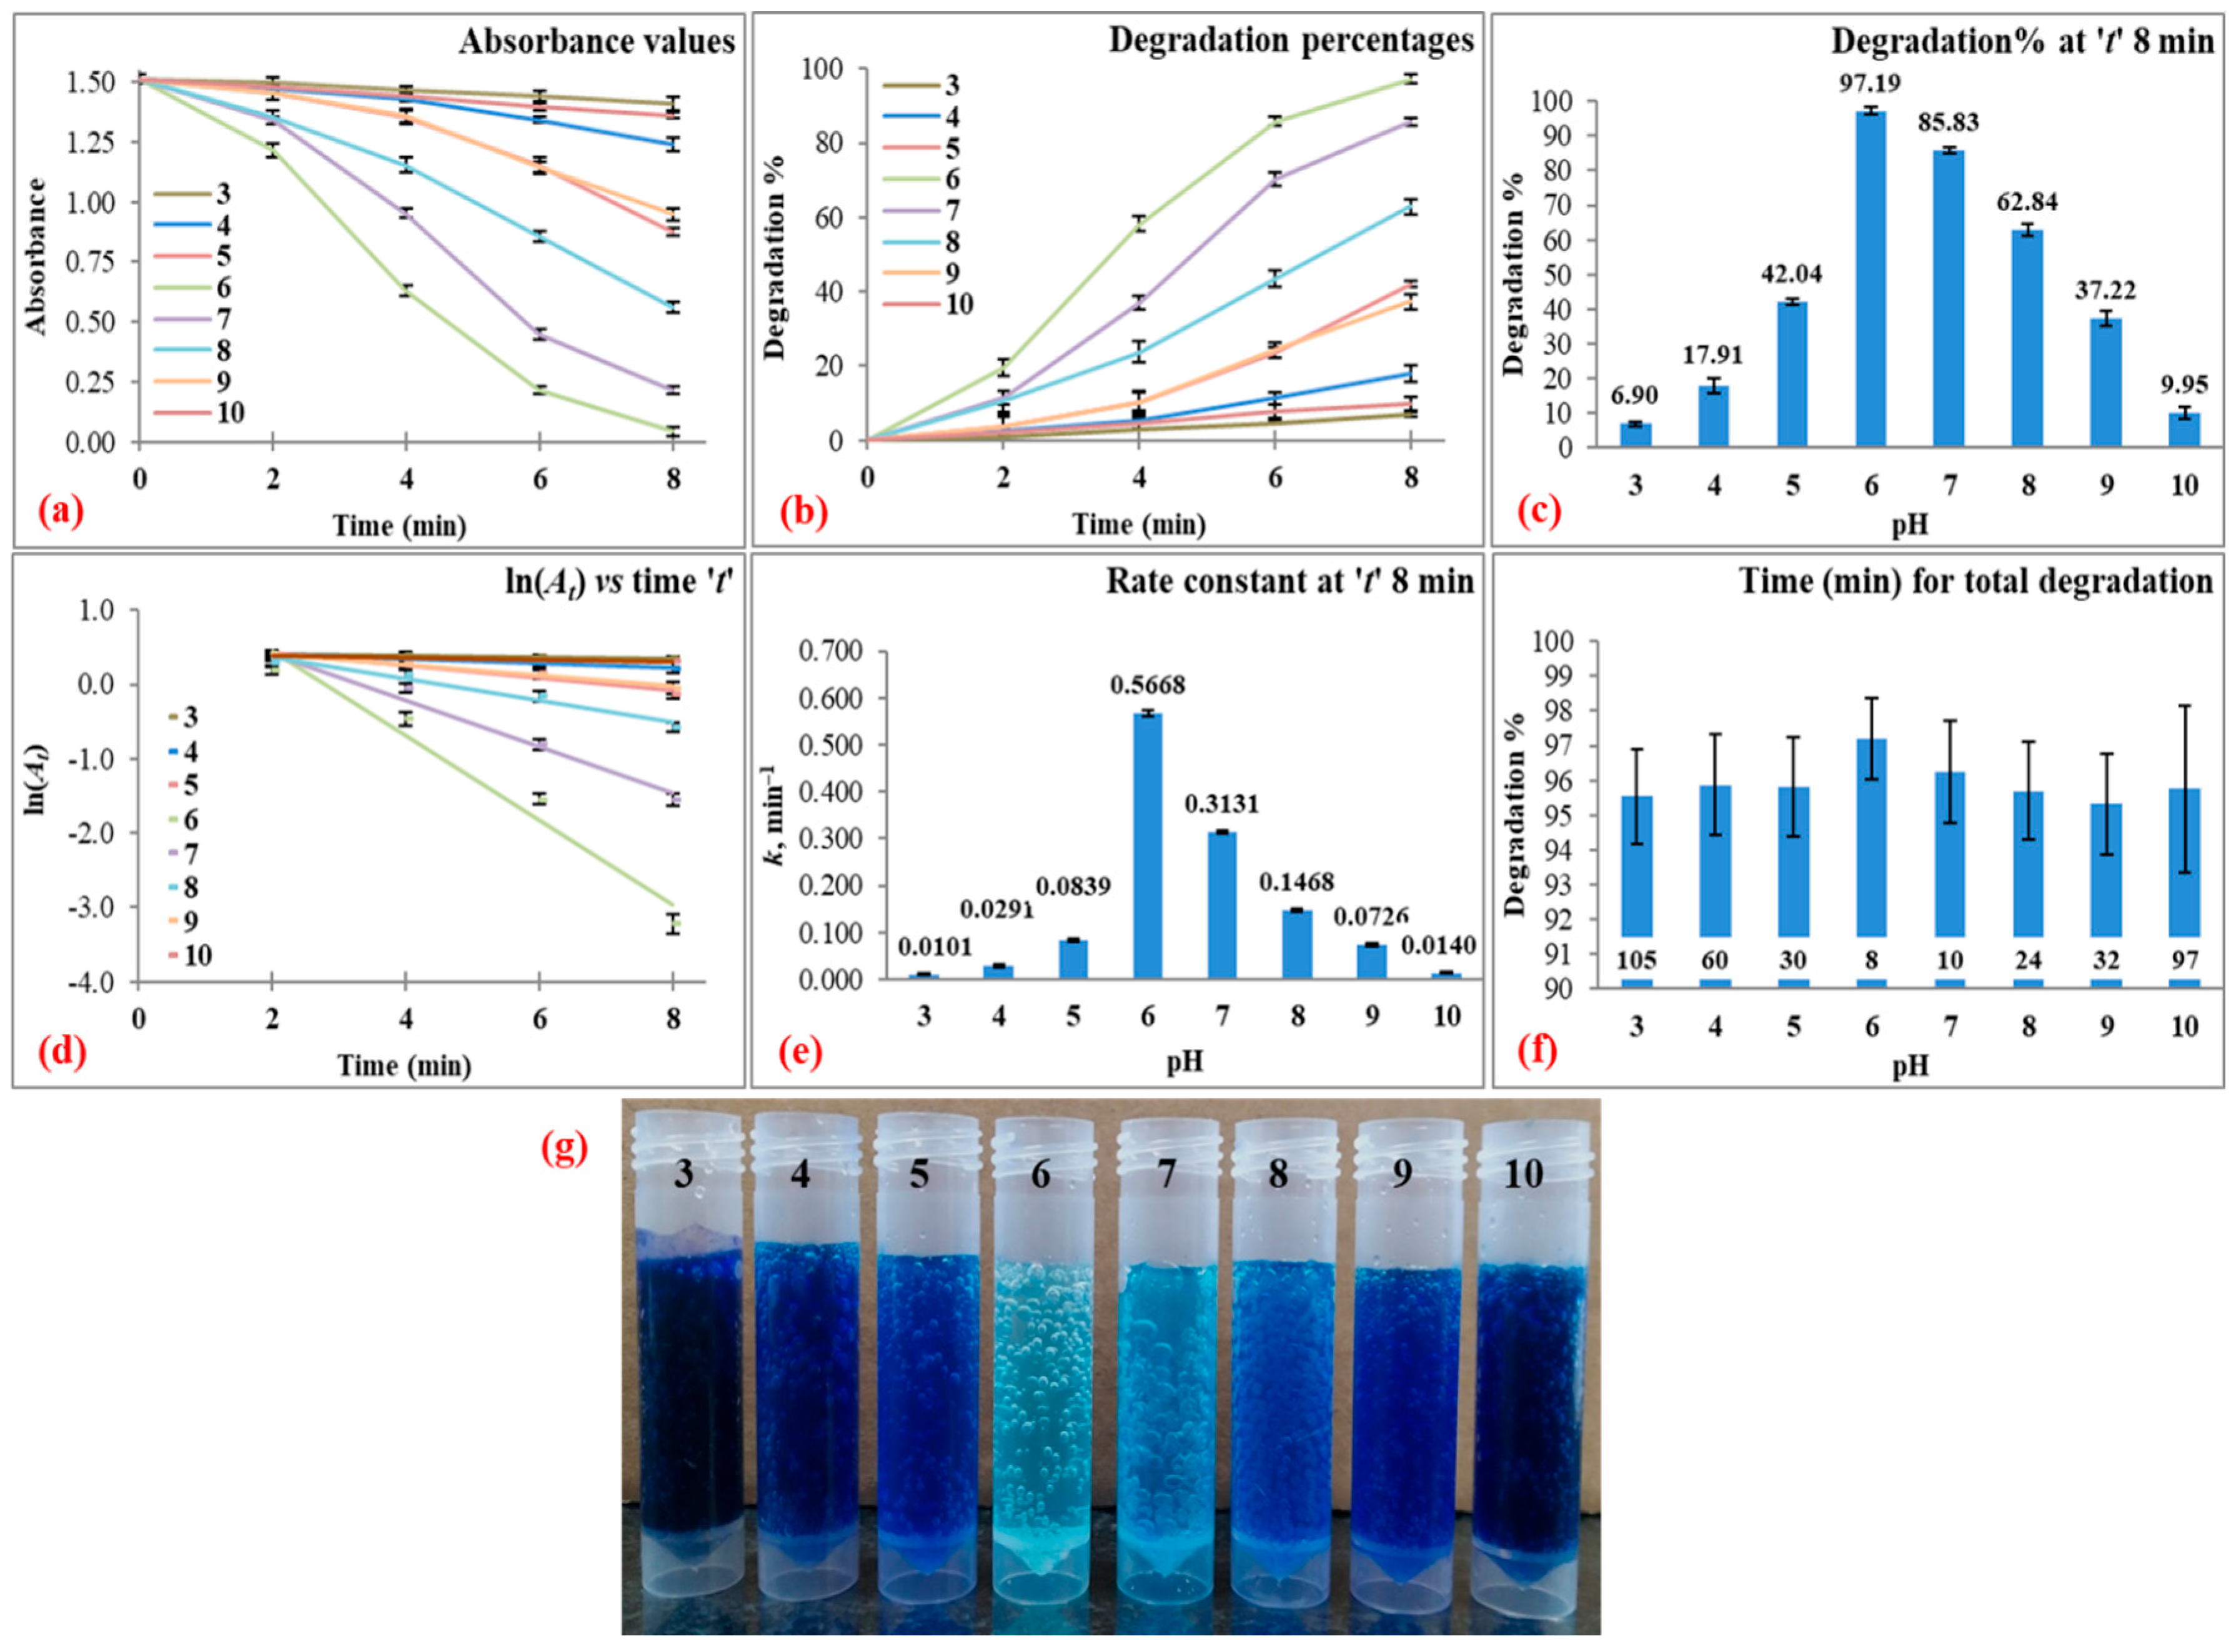
3.3.4. Reaction pH
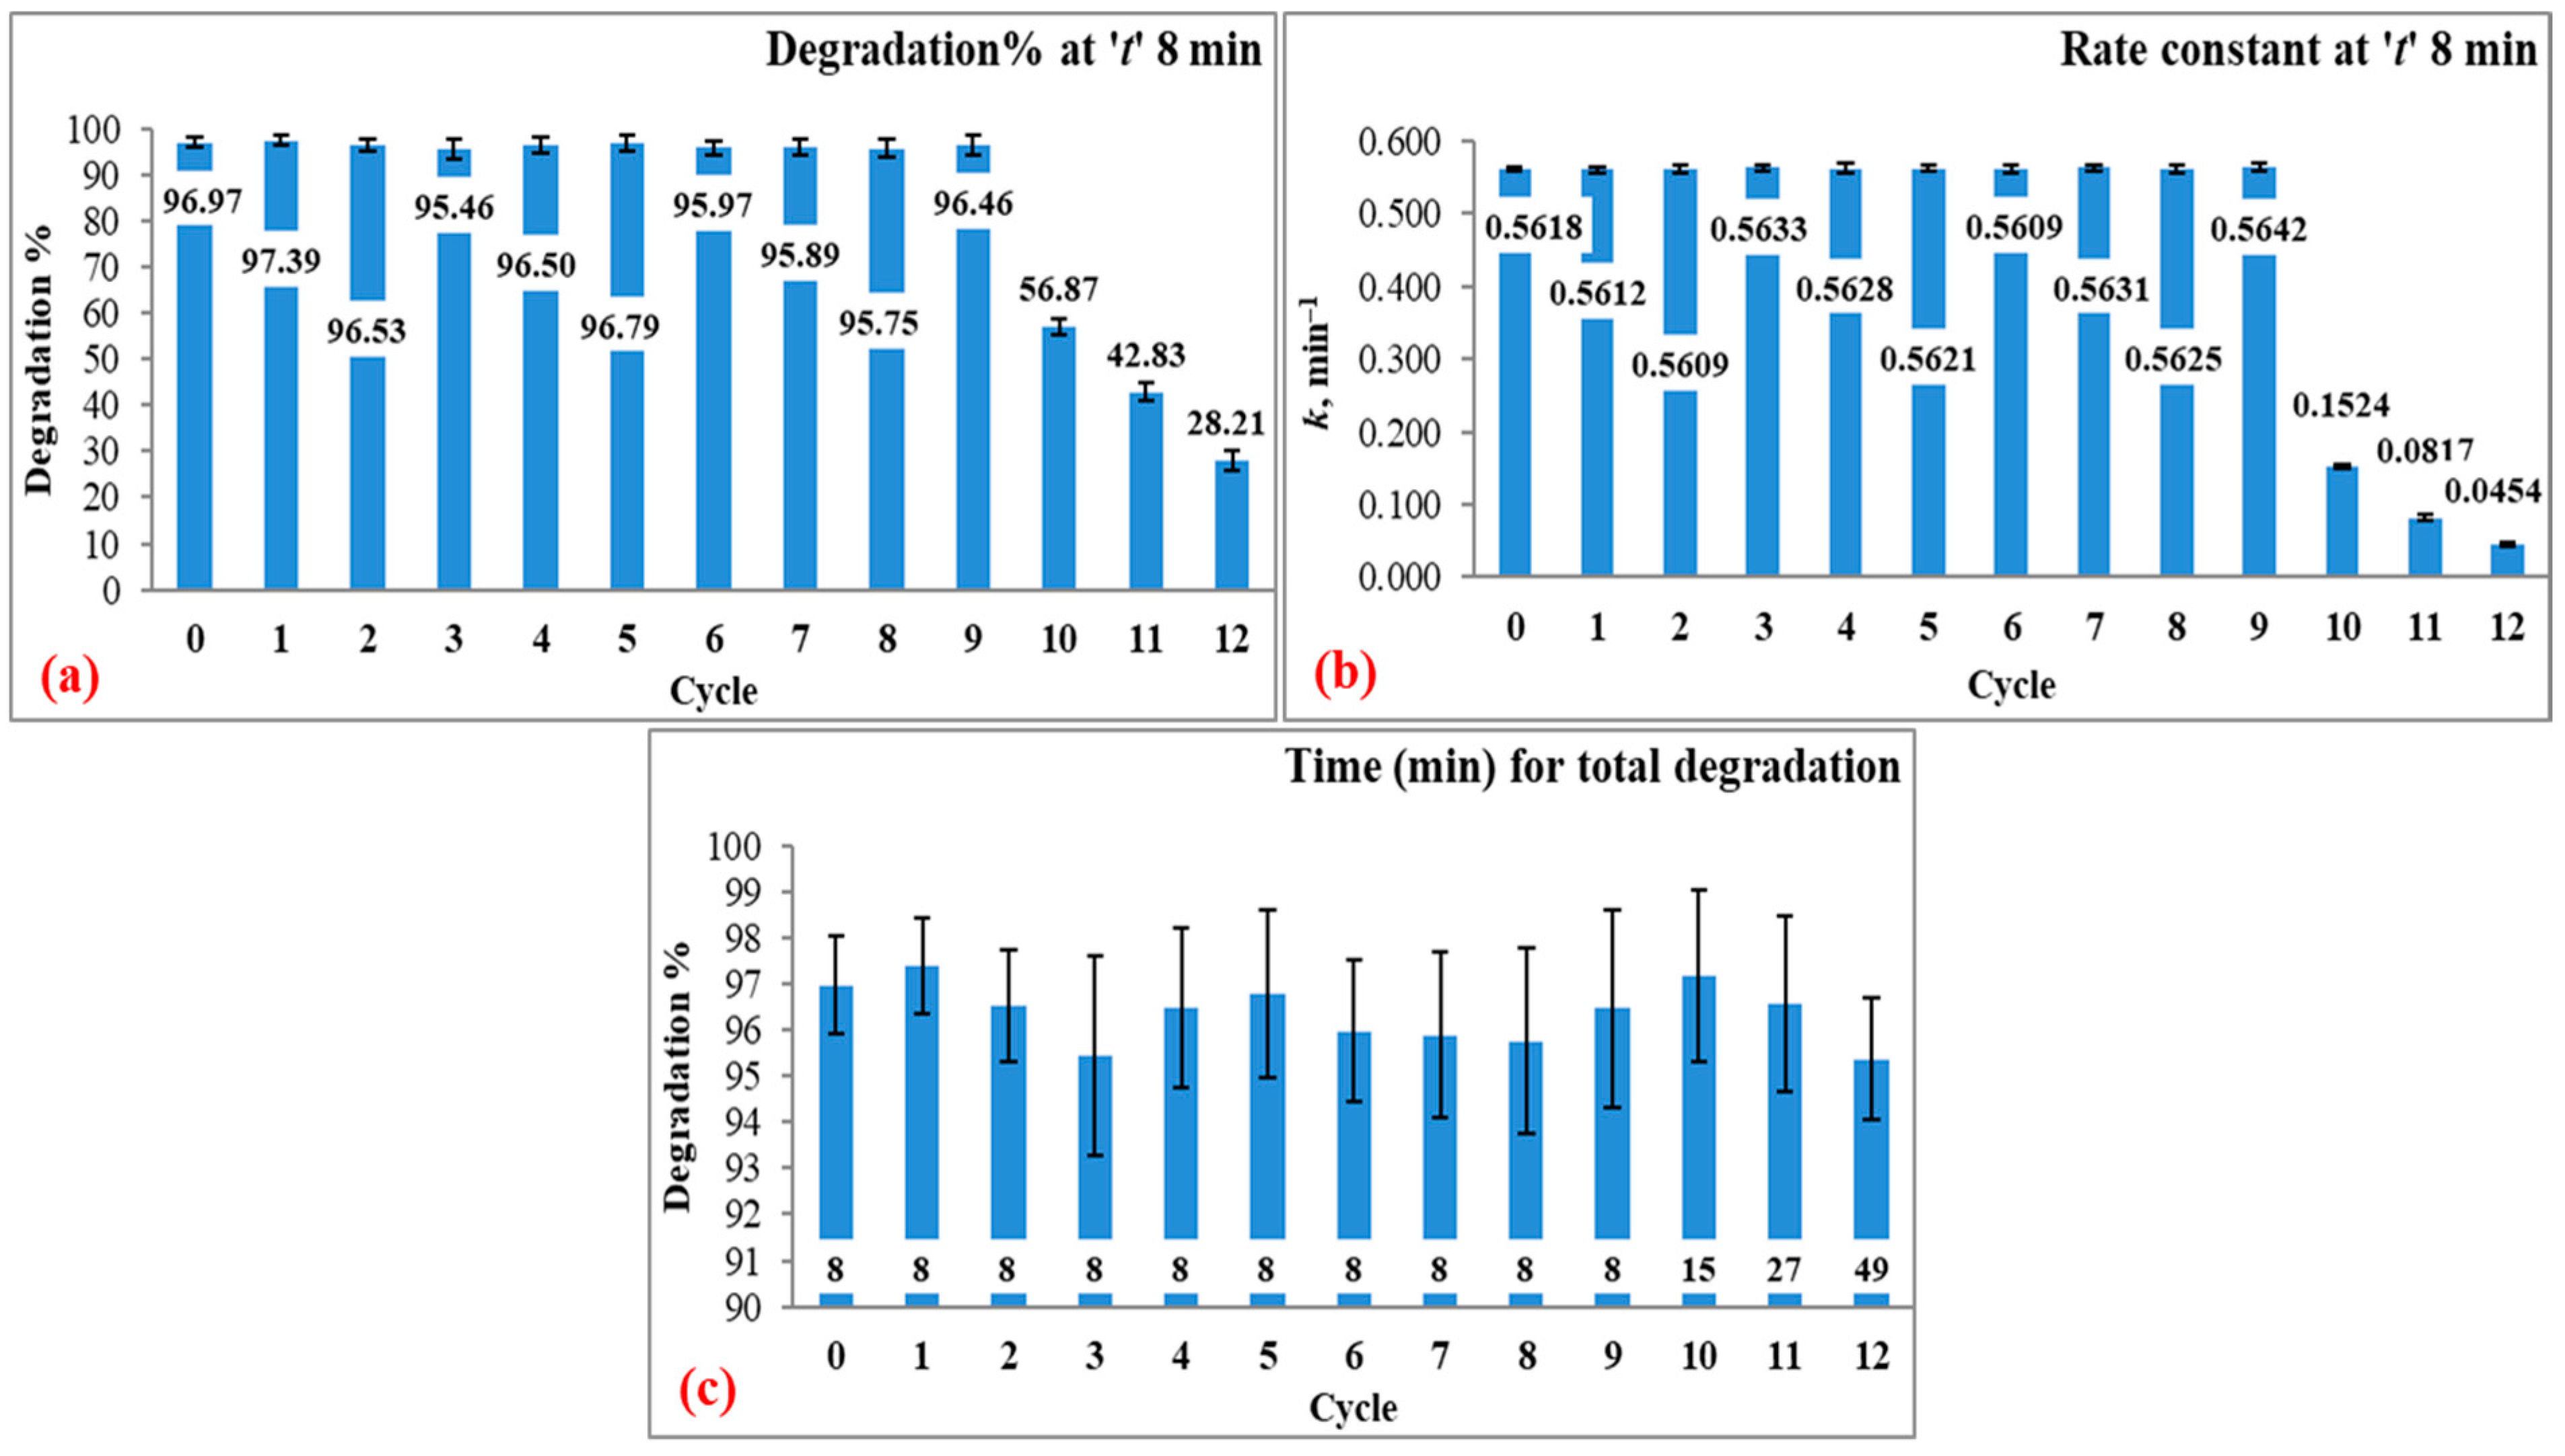
3.4. Reusability
4. Conclusions
Author Contributions
Funding
Institutional Review Board Statement
Informed Consent Statement
Data Availability Statement
Acknowledgments
Conflicts of Interest
Abbreviations
| Ag | Silver |
| AgNO3 | Silver nitrate |
| AgNPs | Silver nanoparticles |
| BQ | Benzoquinone |
| DW | Sterile double-distilled water |
| e– | Electrons |
| EBT | Eriochrome Black T |
| EDTA | Ethylenediaminetetraacetic acid |
| EY | Eosin yellow |
| h+ | Holes |
| IPA | Isopropyl alcohol |
| k | Pseudo-first-order rate constant |
| MO | Methyl orange |
| MR | Methyl red |
| NPs | Nanoparticles |
| R2 | Correlation coefficient |
| OFAT | One-factor-at-a-time |
| •OH | Hydroxyl radicals |
| •O2– | Superoxide anions |
| RhB | Rhodamine B |
| RT | Room temperature |
| SBH | Sodium borohydride |
| UV-Vis spec | Ultraviolet–visible spectrophotometer |
References
- Basalius, H.; Mani, A.; Michael, A.; Mary, S.M.; Lenin, M.; Chelliah, P.; Siddiqui, M.R.; Wabaidur, S.M.; Islam, M.A. Green synthesis of nano-silver using Syzygium samarangense flower extract for multifaceted applications in biomedical and photocatalytic degradation of methylene blue. Appl. Nanosci. 2023, 13, 3735–3747. [Google Scholar] [CrossRef]
- Varol, M.; Tokatlı, C. Evaluation of the water quality of a highly polluted stream with water quality indices and health risk assessment methods. Chemosphere 2023, 311, 137096. [Google Scholar] [CrossRef] [PubMed]
- Aravind, M.; Ahmad, A.; Ahmad, I.; Amalanathan, M.; Naseem, K.; Mary, S.M.M.; Parvathiraja, C.; Hussain, S.; Algarni, T.S.; Pervaiz, M.; et al. Critical green routing synthesis of silver NPs using jasmine flower extract for biological activities and photocatalytical degradation of methylene blue. J. Environ. Chem. Eng. 2021, 9, 104877. [Google Scholar] [CrossRef]
- Joseph, T.M.; Al-Hazmi, H.E.; Śniatała, B.; Esmaeili, A.; Habibzadeh, S. Nanoparticles and nanofiltration for wastewater treatment: From polluted to fresh water. Environ. Res. 2023, 238, 117114. [Google Scholar] [CrossRef] [PubMed]
- Abdullahi, S.S.; Mohammad, R.E.A.; Jagaba, A.H.; Musa, H.; Birniwa, A.H. Natural, synthetic, and composite materials for industrial effluents treatment: A mini review on current practices, cost-effectiveness, and sustainability. Case Stud. Chem. Environ. Eng. 2024, 9, 100570. [Google Scholar] [CrossRef]
- Islam, T.; Repon, M.R.; Islam, T.; Sarwar, Z.; Rahman, M.M. Impact of textile dyes on health and ecosystem: A review of structure, causes, and potential solutions. Environ. Sci. Pollut. Res. 2022, 30, 9207–9242. [Google Scholar] [CrossRef]
- Bilal, M.; Adeel, M.; Rasheed, T.; Zhao, Y.; Iqbal, H.M.N. Emerging contaminants of high concern and their enzyme-assisted biodegradation—A review. Environ. Int. 2019, 124, 336–353. [Google Scholar] [CrossRef]
- de Jesus, R.A.; de Assis, G.C.; de Oliveira, R.J.; Costa, J.A.S.; da Silva, C.M.P.; Bilal, M.; Iqbal, H.M.N.; Ferreira, L.F.R.; Figueiredo, R.T. Environmental remediation potentialities of metal and metal oxide nanoparticles: Mechanistic biosynthesis, influencing factors, and application standpoint. Environ. Technol. Innov. 2021, 24, 101851. [Google Scholar] [CrossRef]
- Muduli, M.; Choudhary, M.; Sonpal, V.; Ray, S. Recent advancements and approaches towards dye industries effluent treatment. Sustain. Water Resour. Manag. 2023, 9, 186. [Google Scholar] [CrossRef]
- Nachiyar, C.V.; Rakshi, A.D.; Sandhya, S.; Jebasta, N.B.D.; Nellore, J. Developments in treatment technologies of dye-containing effluent: A review. Case Stud. Chem. Environ. Eng. 2023, 7, 100339. [Google Scholar] [CrossRef]
- Solayman, H.M.; Hossen, M.A.; Aziz, A.A.; Yahya, N.Y.; Leong, K.H.; Sim, L.C.; Monir, M.U.; Zoh, K.-D. Performance evaluation of dye wastewater treatment technologies: A review. J. Environ. Chem. Eng. 2023, 11, 109610. [Google Scholar] [CrossRef]
- Jagaba, A.H.; Birniwa, A.H.; Usman, A.K.; Mu’azu, N.D.; Yaro, N.S.A.; Soja, U.B.; Abioye, K.J.; Almahbashi, N.M.Y.; Al-dhawi, B.N.S.; Noor, A.; et al. Trend and current practices of coagulation-based hybrid systems for pulp and paper mill effluent treatment: Mechanisms, optimization techniques and performance evaluation. J. Clean. Prod. 2023, 429, 139543. [Google Scholar] [CrossRef]
- Suhan, M.B.K.; Al-Mamun, M.R.; Farzana, N.; Aishee, S.M.; Islam, M.S.; Marwani, H.M.; Hasan, M.M.; Asiri, A.M.; Rahman, M.M.; Islam, A.; et al. Sustainable pollutant removal and wastewater remediation using TiO2-based nanocomposites: A critical review. Nano-Struct. Nano-Objects 2023, 36, 101050. [Google Scholar] [CrossRef]
- Chandhru, M.; Logesh, R.; Rani, S.K.; Ahmed, N.; Vasimalai, N. Green synthesis of silver nanoparticles from plant latex and their antibacterial and photocatalytic studies. Environ. Technol. 2022, 43, 3064–3074. [Google Scholar] [CrossRef]
- Nguyen Thi Anh Nga, V.B.; Raghavendra, R.; Sindhu, M.; Alshiekheid, A.; Sabour, R.; Krishnan, N.T.; Lan Chi, A. Pugazhendhi, Green fabrication of silver nanoparticles using Chloroxylon swietenia leaves and their application towards dye degradation and food borne pathogens. Food Chem. Toxicol. 2022, 165, 113192. [Google Scholar] [CrossRef]
- Vidyasagar; Patel, R.R.; Singh, S.K.; Singh, M. Green synthesis of silver nanoparticles: Methods, biological applications, delivery and toxicity. Mater. Adv. 2023, 4, 1831–1849. [Google Scholar] [CrossRef]
- Naysmith, A.; Mian, N.S.; Rana, S. Development of conductive textile fabric using Plackett–Burman optimized green synthesized silver nanoparticles and in situ polymerized polypyrrole. Green Chem. Lett. Rev. 2023, 16, 2158690. [Google Scholar] [CrossRef]
- Wasilewska, A.; Klekotka, U.; Zambrzycka, M.; Zambrowski, G.; Święcicka, I.; Kalska-Szostko, B. Physico-chemical properties and antimicrobial activity of silver nanoparticles fabricated by green synthesis. Food Chem. 2023, 400, 133960. [Google Scholar] [CrossRef]
- Amin, H.M.A.; Baltruschat, H.; Wittmaier, D.; Friedrich, K.A. A Highly Efficient Bifunctional Catalyst for Alkaline Air-Electrodes Based on a Ag and Co3O4 Hybrid: RRDE and Online DEMS Insights. Electrochim. Acta 2015, 151, 332–339. [Google Scholar] [CrossRef]
- Wittmaier, D.; Wagner, N.; Friedrich, K.A.; Amin, H.M.A.; Baltruschat, H. Modified carbon-free silver electrodes for the use as cathodes in lithium–air batteries with an aqueous alkaline electrolyte. J. Power Sources 2014, 265, 299–308. [Google Scholar] [CrossRef]
- Jabbar, A.; Abbas, A.; Assad, N.; Naeem-ul-Hassan, M.; Alhazmi, H.A.; Najmi, A.; Zoghebi, K.; Al Bratty, M.; Hanbashi, A.; Amin, H.M.A. A highly selective Hg2+ colorimetric sensor and antimicrobial agent based on green synthesized silver nanoparticles using Equisetum diffusum extract. RSC Adv. 2023, 13, 28666–28675. [Google Scholar] [CrossRef]
- Rizki, I.N.; Klaypradit, W.; Patmawati. Utilization of marine organisms for the green synthesis of silver and gold nanoparticles and their applications: A review. Sustain. Chem. Pharm. 2023, 31, 100888. [Google Scholar] [CrossRef]
- Abed, A.S.; Khalaf, Y.H.; Mohammed, A.M. Green synthesis of gold nanoparticles as an effective opportunity for cancer treatment. Results Chem. 2023, 5, 100848. [Google Scholar] [CrossRef]
- Suherman, A.L.; Zampardi, G.; Amin, H.M.A.; Young, N.P.; Compton, R.G. Tannic acid capped gold nanoparticles: Capping agent chemistry controls the redox activity. Phys. Chem. Chem. Phys. 2019, 21, 4444–4451. [Google Scholar] [CrossRef]
- MuthuKathija, M.; Badhusha, M.S.M.; Rama, V. Green synthesis of zinc oxide nanoparticles using Pisonia Alba leaf extract and its antibacterial activity. Appl. Surf. Sci. Adv. 2023, 15, 100400. [Google Scholar] [CrossRef]
- Alprol, A.E.; Mansour, A.T.; El-Beltagi, H.S.; Ashour, M. Algal Extracts for Green Synthesis of Zinc Oxide Nanoparticles: Promising Approach for Algae Bioremediation. Materials 2023, 16, 2819. [Google Scholar] [CrossRef]
- Alahdal, F.A.M.; Qashqoosh, M.T.A.; Manea, Y.K.; Mohammed, R.K.A.; Naqvi, S. Green synthesis and characterization of copper nanoparticles using Phragmanthera austroarabica extract and their biological/environmental applications. Sustain. Mater. Technol. 2023, 35, e00540. [Google Scholar] [CrossRef]
- Mali, S.C.; Dhaka, A.; Sharma, S.; Trivedi, R. Review on biogenic synthesis of copper nanoparticles and its potential applications. Inorg. Chem. Commun. 2023, 149, 110448. [Google Scholar] [CrossRef]
- Mbachu, C.A.; Babayemi, A.K.; Egbosiuba, T.C.; Ike, J.I.; Ani, I.J.; Mustapha, S. Green synthesis of iron oxide nanoparticles by Taguchi design of experiment method for effective adsorption of methylene blue and methyl orange from textile wastewater. Results Eng. 2023, 19, 101198. [Google Scholar] [CrossRef]
- Suppiah, D.D.; Julkapli, N.M.; Sagadevan, S.; Johan, M.R. Eco-friendly green synthesis approach and evaluation of environmental and biological applications of iron oxide nanoparticles. Inorg. Chem. Commun. 2023, 152, 110700. [Google Scholar] [CrossRef]
- Naveenkumar, S.; Kamaraj, C.; Prem, P.; Raja, R.K.; Priyadharsan, A.; Alrefaei, A.F.; Govindarajan, R.K.; Thamarai, R.; Subramaniyan, V. Eco-friendly synthesis of palladium nanoparticles using Zaleya decandra: Assessing mosquito larvicidal activity, zebrafish embryo developmental toxicity, and impacts on freshwater sludge worm Tubifex tubifex. J. Environ. Chem. Eng. 2024, 12, 111912. [Google Scholar] [CrossRef]
- MubarakAli, D.; Kim, H.; Venkatesh, P.S.; Kim, J.-W.; Lee, S.-Y. A Systemic Review on the Synthesis, Characterization, and Applications of Palladium Nanoparticles in Biomedicine. Appl. Biochem. Biotechnol. 2023, 195, 3699–3718. [Google Scholar] [CrossRef] [PubMed]
- Ishak, N.A.I.M.; Kamarudin, S.K.; Timmiati, S.N.; Sauid, S.M.; Karim, N.A.; Basri, S. Green synthesis of platinum nanoparticles as a robust electrocatalyst for methanol oxidation reaction: Metabolite profiling and antioxidant evaluation. J. Clean. Prod. 2023, 382, 135111. [Google Scholar] [CrossRef]
- Gholami-Shabani, M.; Sotoodehnejadnematalahi, F.; Shams-Ghahfarokhi, M.; Eslamifar, A.; Razzaghi-Abyaneh, M. Platinum Nanoparticles as Potent Anticancer and Antimicrobial Agent: Green Synthesis, Physical Characterization, and In-Vitro Biological Activity. J. Clust. Sci. 2023, 34, 501–516. [Google Scholar] [CrossRef]
- Chelliah, P.; Wabaidur, S.M.; Sharma, H.P.; Jweeg, M.J.; Majdi, H.S.; Kubaisy, M.M.R.A.L.; Iqbal, A.; Lai, W.-C. Green Synthesis and Characterizations of Cobalt Oxide Nanoparticles and Their Coherent Photocatalytic and Antibacterial Investigations. Water 2023, 15, 910. [Google Scholar] [CrossRef]
- Meera, K.; Ramesan, M.T. Tailoring the performance of boehmite nanoparticles reinforced carboxymethyl chitosan/cashew gum blend nanocomposites via green synthesis. Polymer 2023, 268, 125706. [Google Scholar] [CrossRef]
- Jaiswal, M.; Srivastava, G.; Mishra, S.; Singh, P.K.; Dhar, R.; Dabrowski, R. Synthesis and characterization of semiconducting copper oxide nanoparticles and their impact on the physical properties of a nematic liquid crystalline material 4-pentyl-4′-cyanobiphenyl. J. Mol. Liq. 2023, 383, 122032. [Google Scholar] [CrossRef]
- Alzubaidi, A.K.; Al-Kaabi, W.J.; Al Ali, A.; Albukhaty, S.; Al-Karagoly, H.; Sulaiman, G.M.; Asiri, M.; Khane, Y. Green Synthesis and Characterization of Silver Nanoparticles Using Flaxseed Extract and Evaluation of Their Antibacterial and Antioxidant Activities. Appl. Sci. 2023, 13, 2182. [Google Scholar] [CrossRef]
- Baran, M.F.; Keskin, C.; Baran, A.; Hatipoğlu, A.; Yildiztekin, M.; Küçükaydin, S.; Kurt, K.; Hoşgören, H.; Sarker, M.M.R.; Sufianov, A.; et al. Green Synthesis of Silver Nanoparticles from Allium cepa L. Peel Extract, Their Antioxidant, Antipathogenic, and Anticholinesterase Activity. Molecules 2023, 28, 2310. [Google Scholar] [CrossRef]
- Mihailović, V.; Srećković, N.; Nedić, Z.P.; Dimitrijević, S.; Matić, M.; Obradović, A.; Selaković, D.; Rosić, G.; Stanković, J.S.K. Green Synthesis of Silver Nanoparticles Using Salvia verticillata and Filipendula ulmaria Extracts: Optimization of Synthesis, Biological Activities, and Catalytic Properties. Molecules 2023, 28, 808. [Google Scholar] [CrossRef]
- Ibrahim, N.; Zubir, S.A.; Manaf, A.A.; Mustapha, M. Stability and conductivity of water-based colloidal silver nanoparticles conductive inks for sustainable printed electronics. J. Taiwan Inst. Chem. Eng. 2023, 153, 105202. [Google Scholar] [CrossRef]
- Menichetti, A.; Mavridi-Printezi, A.; Mordini, D.; Montalti, M.; Size, E.O. Shape and Surface Functionalization on the Antibacterial Activity of Silver Nanoparticles. J. Funct. Biomater. 2023, 14, 244. [Google Scholar] [CrossRef] [PubMed]
- Meydan, I.; Aygun, A.; Tiri, R.N.E.; Gur, T.; Kocak, Y.; Seckin, H.; Sen, F. Chitosan/PVA-supported silver nanoparticles for azo dyes removal: Fabrication, characterization, and assessment of antioxidant activity. Environ. Sci. Adv. 2024, 3, 28–35. [Google Scholar] [CrossRef]
- Elbadawy, H.A.; Elhusseiny, A.F.; Hussein, S.M.; Sadik, W.A. Sustainable and energy-efficient photocatalytic degradation of textile dye assisted by ecofriendly synthesized silver nanoparticles. Sci. Rep. 2023, 13, 2302. [Google Scholar] [CrossRef]
- Nguyen, N.P.U.; Dang, N.T.; Doan, L.; Nguyen, T.T.H. Synthesis of Silver Nanoparticles: From Conventional to ‘Modern’ Methods—A Review. Processes 2023, 11, 2617. [Google Scholar] [CrossRef]
- Hai, N.D.; Dat, N.M.; Nam, N.T.H.; An, H.; Tai, L.T.; Huong, L.M.; Cong, C.Q.; Giang, N.T.H.; Tinh, N.T.; Hieu, N.H. A review on the chemical and biological synthesis of silver nanoparticles@graphene oxide nanocomposites: A comparison. Mater. Today Sustain. 2023, 24, 100544. [Google Scholar] [CrossRef]
- Luceri, A.; Francese, R.; Lembo, D.; Ferraris, M.; Balagna, C. Silver Nanoparticles: Review of Antiviral Properties, Mechanism of Action and Applications. Microorganisms 2023, 11, 629. [Google Scholar] [CrossRef]
- Alsaiari, N.S.; Alzahrani, F.M.; Amari, A.; Osman, H.; Harharah, H.N.; Elboughdiri, N.; Tahoon, M.A. Plant and Microbial Approaches as Green Methods for the Synthesis of Nanomaterials: Synthesis, Applications, and Future Perspectives. Molecules 2023, 28, 463. [Google Scholar] [CrossRef]
- Hussain, Z.; Raza, M.A.; Jahangeer, M.; Sarwar, A.; Nadeem, A.A.; Naz, S.; Aziz, T.; Alharbi, M.; Alshammari, A.; Alasmari, A.F. Green synthesis of silver nanoparticles prepared by leaves extract of Trigonila foenum-graecum and its antibacterial potential against Escherichia coli and Pseudomonas aeruginosa. Biomass Convers. Biorefinery 2023, 14, 31431–31438. [Google Scholar] [CrossRef]
- Wirwis, A.; Sadowski, Z. Green Synthesis of Silver Nanoparticles: Optimizing Green Tea Leaf Extraction for Enhanced Physicochemical Properties. ACS Omega 2023, 8, 30532–30549. [Google Scholar] [CrossRef]
- Keskin, M.; Kaya, G.; Bayram, S.; Kurek-Górecka, A.; Olczyk, P. Green Synthesis, Characterization, Antioxidant, Antibacterial and Enzyme Inhibition Effects of Chestnut (Castanea sativa) Honey-Mediated Silver Nanoparticles. Molecules 2023, 28, 2762. [Google Scholar] [CrossRef] [PubMed]
- Kumari, M.; Pandey, S.; Giri, V.P.; Nautiyal, C.S.; Mishra, A. A critical review on green approaches in shape and size evolution of metal nanoparticles and their environmental applications. Environ. Nanotechnol. Monit. Manag. 2023, 20, 100895. [Google Scholar] [CrossRef]
- Herrera-Marín, P.; Fernández, L.; Pilaquinga, F.F.; Debut, A.; Rodríguez, A.; Espinoza-Montero, P. Green synthesis of silver nanoparticles using aqueous extract of the leaves of fine aroma cocoa Theobroma cacao linneu (Malvaceae): Optimization by electrochemical techniques. Electrochim. Acta 2023, 447, 142122. [Google Scholar] [CrossRef]
- Wen, J.; Gao, F.; Liu, H.; Wang, J.; Xiong, T.; Yi, H.; Zhou, Y.; Yu, Q.; Zhao, S.; Tang, X. Metallic nanoparticles synthesized by algae: Synthetic route, action mechanism, and the environmental catalytic applications. J. Environ. Chem. Eng. 2023, 12, 111742. [Google Scholar] [CrossRef]
- Ahmad, N.M.; Mohamed, A.H.; Hasan, N.; Abidin, N.Z.; Nawahwi, M.Z.; Azzeme, A.B.M. Effect of optimisation variable and the role of plant extract in the synthesis of nanoparticles using plant-mediated synthesis approaches. Inorg. Chem. Commun. 2023, 161, 111839. [Google Scholar] [CrossRef]
- Velidandi, A.; Pabbathi, N.P.P.; Dahariya, S.; Kagithoju, S.; Baadhe, R.R. Bio-fabrication of silver-silver chloride nanoparticles using Annona muricata leaf extract: Characterization, biological, dye degradation and eco-toxicity studies. Int. J. Environ. Sci. Technol. 2022, 19, 6555–6572. [Google Scholar] [CrossRef]
- Kurra, H.; Velidandi, A.; Sarvepalli, M.; Prem, N.; Pabbathi, P.; Godishala, V. Aqueous Cymbopogon citratus Extract Mediated Silver Nanoparticles: Part I. Influence of Synthesis Parameters, Characterization, and Biomedical Studies. Nanomaterials 2025, 15, 328. [Google Scholar] [CrossRef]
- Mansour, M.S.; Farid, Y.; Nosier, S.A.; Adli, O.; Abdel-Aziz, M.H. Removal of Eosin Yellow dye from industrial wastewater using UV/H2O2 and photoelectro-Fenton techniques. J. Photochem. Photobiol. A Chem. 2023, 436, 114411. [Google Scholar] [CrossRef]
- Shaikh, A.A.; Patil, M.R.; Jagdale, B.S.; Adole, V.A. Synthesis and characterization of Ag doped ZnO nanomaterial as an effective photocatalyst for photocatalytic degradation of Eriochrome Black T dye and antimicrobial agent. Inorg. Chem. Commun. 2023, 151, 110570. [Google Scholar] [CrossRef]
- Vijayan, R.; Joseph, S.; Mathew, B. Eco-friendly synthesis of silver and gold nanoparticles with enhanced antimicrobial, antioxidant, and catalytic activities. IET Nanobiotechnol. 2018, 12, 850–856. [Google Scholar] [CrossRef]
- El-Bindary, A.A.; El-Marsafy, S.M.; El-Maddah, A.A. Enhancement of the photocatalytic activity of ZnO nanoparticles by silver doping for the degradation of AY99 contaminants. J. Mol. Struct. 2019, 1191, 76–84. [Google Scholar] [CrossRef]
- Wahab, O.O.; Olasunkanmi, L.O.; Govender, K.K.; Govender, P.P. Computational Study of the Mechanistic Pathway of Hydroxyl Radical-Initiated Degradation of Disperse Red 73 Dye. Chem. Afr. 2022, 5, 135–148. [Google Scholar] [CrossRef]
- Kumar, J.; Justa, P.; Jaswal, N.; Kumar, H.; Pani, B.; Kumar, P. Peroxidase like activity of Prussian blue nanoparticles and visible light mediated catalytic degradation of methylene blue dye. Chem. Phys. Impact 2024, 8, 100575. [Google Scholar] [CrossRef]
- Kanchana, S.; Vijayalakshmi, R. Photocatalytic degradation of organic dyes by peg and pvp cappcu, ni and ag nanoparticles in the presence of nabh4 in aqueous medium. J. Water Environ. Nanotechnol. 2020, 5, 294–306. [Google Scholar] [CrossRef]
- Oladeji, O.S.; Adelowo, F.E.; Ayodele, D.T.; Odelade, K.A. Phytochemistry and pharmacological activities of Cymbopogon citratus: A review. Sci. Afr. 2019, 6, e00137. [Google Scholar] [CrossRef]
- Kurra, H.; Velidandi, A.; Sarvepalli, M.; Godishala, V. Green-synthesized Silver Nanoparticles from Cymbopogon citratus: Synergistic Antibacterial Effects and Food Safety Potential. J. Food Chem. Nanotechnol. 2025, 11, 15–24. [Google Scholar] [CrossRef]
- Rajasekar, R.; Samuel, M.; Edison, T.N.J.I.; Raman, N. Sustainable synthesis of silver nanoparticles using Alstonia scholaris for enhanced catalytic degradation of methylene blue. J. Mol. Struct. 2021, 1246, 131208. [Google Scholar] [CrossRef]
- Ogundare, S.A.; Adesetan, T.O.; Muungani, G.; Moodley, V.; Amaku, J.F.; Atewolara-Odule, O.C.; Yussuf, S.T.; Sanyaolu, N.O.; Ibikunle, A.A.; Balogun, M.-S.; et al. Catalytic degradation of methylene blue dye and antibacterial activity of biosynthesized silver nanoparticles using Peltophorum pterocarpum (DC.) leaves. Environ. Sci. Adv. 2023, 2, 247–256. [Google Scholar] [CrossRef]
- Varadavenkatesan, T.; Vinayagam, R.; Selvaraj, R. Green synthesis and structural characterization of silver nanoparticles synthesized using the pod extract of Clitoria ternatea and its application towards dye degradation. Mater. Today Proc. 2020, 23, 27–29. [Google Scholar] [CrossRef]
- Kahraman, H.T. Synthesis of silver nanoparticles using Alchemilla vulgaris and Helichrysum arenarium for methylene blue and 4-nitrophenol degradation and antibacterial applications. Biomass Convers. Biorefinery 2024, 14, 13479–13490. [Google Scholar] [CrossRef]
- Erenler, R.; Hosaflioglu, I. Green synthesis of silver nanoparticles using Onobrychis sativa L.: Characterization, catalytic degradation of methylene blue, antioxidant activity, and quantitative analysis of bioactive compounds. Mater. Today Commun. 2023, 35, 105863. [Google Scholar] [CrossRef]
- Konduri, V.V.; Kalagatur, N.K.; Gunti, L.; Mangamuri, U.K.; Kalagadda, V.R.; Poda, S.; Krishna, S.B.N. Green synthesis of silver nanoparticles from Hibiscus tiliaceus L. Leaves and their applications in dye degradation, antioxidant, antimicrobial, and anticancer activities. S. Afr. J. Bot. 2024, 168, 476–487. [Google Scholar] [CrossRef]
- Mahiuddin, M.; Saha, P.; Ochiai, B. Green Synthesis and Catalytic Activity of Silver Nanoparticles Based on Piper chaba Stem Extracts. Nanomaterials 2020, 10, 1777. [Google Scholar] [CrossRef]
- Moond, M.; Singh, S.; Sangwan, S.; Devi, P.; Beniwal, A.; Rani, J.; Kumari, A.; Rani, S. Biosynthesis of Silver Nanoparticles Utilizing Leaf Extract of Trigonella foenum-graecum L. for Catalytic Dyes Degradation and Colorimetric Sensing of Fe3+/Hg2+. Molecules 2023, 28, 951. [Google Scholar] [CrossRef]
- Thangamani, N.; Bhuvaneshwari, N. Synthesis, characterization of Ag nanoparticles using the green approach towards degradation of environmental pollutant. J. Mater. Sci. Mater. Electron. 2022, 33, 9155–9162. [Google Scholar] [CrossRef]
- Anjana, V.N.; Joseph, M.; Francis, S.; Joseph, A.; Koshy, E.P.; Mathew, B. Microwave assisted green synthesis of silver nanoparticles for optical, catalytic, biological and electrochemical applications. Artif. Cells Nanomed. Biotechnol. 2021, 49, 438–449. [Google Scholar] [CrossRef] [PubMed]
- Panneerselvi, V.; Shankar, K.; Muthukrishnan, P.; Prabhu, A. Mangifera indica Resin Assisted Synthesis of Nano Silver: Assessing their Photocatalytic Degradation of Methylene Blue, Anticorrosive and Antioxidant Activity. J. Clust. Sci. 2022, 33, 123–133. [Google Scholar] [CrossRef]
- Veisi, H.; Azizi, S.; Mohammadi, P. Green synthesis of the silver nanoparticles mediated by Thymbra spicata extract and its application as a heterogeneous and recyclable nanocatalyst for catalytic reduction of a variety of dyes in water. J. Clean. Prod. 2018, 170, 1536–1543. [Google Scholar] [CrossRef]
- Gangarapu, M.; Sarangapany, S.; Veerabhali, K.K.; Devipriya, S.P.; Arava, V.B.R. A High-Performance Catalytic and Recyclability of Phyto-Synthesized Silver Nanoparticles Embedded in Natural Polymer. J. Clust. Sci. 2017, 28, 3127–3138. [Google Scholar] [CrossRef]
- Rostami-Vartooni, A.; Nasrollahzadeh, M.; Alizadeh, M. Green synthesis of seashell supported silver nanoparticles using Bunium persicum seeds extract: Application of the particles for catalytic reduction of organic dyes. J. Colloid Interface Sci. 2016, 470, 268–275. [Google Scholar] [CrossRef]
- Siddique, A.B.; Amr, D.; Abbas, A.; Zohra, L.; Irfan, M.I.; Alhoshani, A.; Ashraf, S.; Amin, H.M.A. Synthesis of hydroxyethylcellulose phthalate-modified silver nanoparticles and their multifunctional applications as an efficient antibacterial, photocatalytic and mercury-selective sensing agent. Int. J. Biol. Macromol. 2024, 256, 128009. [Google Scholar] [CrossRef] [PubMed]


| Dye | λmax | Degradation | Correlation Coefficient | ||
|---|---|---|---|---|---|
| Percentage | Time | Rate | |||
| nm | % | min | k, min−1 | R2 | |
| RhB | 554 | 97.34 ± 1.12 | 120 | 0.0355 ± 0.0042 | 0.9366 ± 0.0218 |
| MR | 430 | 96.89 ± 1.28 | 70 | 0.0456 ± 0.0043 | 0.9288 ± 0.0262 |
| MO | 464 | 95.82 ± 2.37 | 90 | 0.0413 ± 0.0028 | 0.9467 ± 0.0369 |
| MB | 664 | 95.16 ± 1.77 | 60 | 0.0539 ± 0.0036 | 0.9349 ± 0.0308 |
| EY | 514 | 96.41 ± 1.57 | 105 | 0.0363 ± 0.0032 | 0.9232 ± 0.0387 |
| EBT | 573 | 94.36 ± 1.73 | 140 | 0.0222 ± 0.0029 | 0.8843 ± 0.0165 |
| Dye(s) | Degradation Percentage Observed in Scavenger(s) | ||||
|---|---|---|---|---|---|
| Control | IPA (•OH) | BQ (–•O2–) | EDTA (h+) | AgNO3 (e−) | |
| RhB | 97.37 ± 1.55 | 43.57 ± 2.27 c | 71.60 ± 2.72 b | 87.49 ± 2.64 a | 88.31 ± 1.82 a |
| MR | 96.44 ± 1.35 | 75.02 ± 1.76 b | 59.56 ± 2.12 c | 68.80 ± 1.95 c | 86.26 ± 2.14 a |
| MO | 95.36 ± 2.34 | 83.92 ± 2.53 a | 84.10 ± 2.04 a | 54.39 ± 1.92 c | 63.38 ± 1.76 c |
| MB | 95.63 ± 1.36 | 83.53 ± 1.73 a | 61.02 ± 2.67 c | 74.99 ± 1.36 b | 67.80 ± 2.33 c |
| EY | 95.85 ± 2.14 | 62.64 ± 1.66 b | 84.10 ± 1.85 a | 74.31 ± 2.61 b | 66.38 ± 1.48 c |
| EBT | 94.51 ± 1.27 | 53.87 ± 1.99 c | 68.64 ± 1.73 c | 72.36 ± 2.45 b | 87.30 ± 1.39 b |
| AgNP Conc. | SBH Conc. | Reaction | Degradation Percentage | Rate Constant | Correlation Coefficient | Time for Maximum Degradation | ||
|---|---|---|---|---|---|---|---|---|
| Temp. | pH | Time | ||||||
| μg | mg | °C | - | min | % | k, min−1 | R2 | ‘%’ at ‘min’ |
| 20 | 3 | 37 | 7 | 35 | 56.55 ± 1.97 | 0.0290 ± 0.0024 | 0.9714 ± 0.0198 | 95.55 ± 1.49 at 60 |
| 40 | 62.71 ± 1.77 | 0.0342 ± 0.0027 | 0.9825 ± 0.0028 | 95.88 ± 1.22 at 52 | ||||
| 60 | 69.69 ± 1.85 | 0.0397 ± 0.0031 | 0.9699 ± 0.0100 | 95.87 ± 1.26 at 46 | ||||
| 80 | 95.69 ± 1.41 | 0.1094 ± 0.0053 | 0.9665 ± 0.0120 | 95.69 ± 1.41 at 35 | ||||
| 100 | 87.18 ± 1.57 | 0.0675 ± 0.0044 | 0.9509 ± 0.0104 | 95.64 ± 1.47 at 40 | ||||
| 120 | 79.46 ± 2.28 | 0.0514 ± 0.0038 | 0.9660 ± 0.0128 | 95.27 ± 1.75 at 42 | ||||
| 140 | 63.67 ± 2.10 | 0.0345 ± 0.0021 | 0.9727 ± 0.0112 | 95.86 ± 1.96 at 48 | ||||
| 80 | 3 | 37 | 7 | 15 | 46.50 ± 2.07 | 0.0511 ± 0.0035 | 0.9647 ± 0.0116 | 95.91 ± 1.18 at 35 |
| 6 | 50.70 ± 2.16 | 0.0541 ± 0.0031 | 0.9686 ± 0.0082 | 96.14 ± 2.38 at 28 | ||||
| 9 | 60.21 ± 0.68 | 0.0605 ± 0.0042 | 0.9772 ± 0.0126 | 95.93 ± 1.38 at 24 | ||||
| 12 | 73.84 ± 1.34 | 0.0917 ± 0.0046 | 0.9933 ± 0.0032 | 95.84 ± 2.13 at 20 | ||||
| 15 | 95.36 ± 1.41 | 0.2433 ± 0.0057 | 0.9732 ± 0.0128 | 95.36 ± 1.41 at 15 | ||||
| 18 | 70.57 ± 2.16 | 0.0860 ± 0.0036 | 0.9872 ± 0.0037 | 96.10 ± 1.34 at 22 | ||||
| 21 | 44.71 ± 2.80 | 0.0481 ± 0.0028 | 0.9546 ± 0.0057 | 95.99 ± 1.27 at 33 | ||||
| 80 | 15 | 20 | 7 | 10 | 17.34 ± 0.84 | 0.0223 ± 0.0018 | 0.9778 ± 0.0108 | 95.86 ± 1.82 at 70 |
| 30 | 44.45 ± 2.02 | 0.0640 ± 0.0029 | 0.9572 ± 0.0142 | 95.82 ± 1.81 at 20 | ||||
| 40 | 72.89 ± 1.08 | 0.1686 ± 0.0032 | 0.9555 ± 0.0127 | 95.90 ± 1.83 at 13 | ||||
| 50 | 95.77 ± 1.21 | 0.3875 ± 0.0048 | 0.9600 ± 0.0119 | 95.77 ± 1.21 at 10 | ||||
| 60 | 40.52 ± 2.36 | 0.0611 ± 0.0038 | 0.9526 ± 0.0122 | 96.04 ± 1.53 at 35 | ||||
| 70 | 31.40 ± 2.27 | 0.0429 ± 0.0027 | 0.9948 ± 0.0116 | 96.14 ± 1.66 at 50 | ||||
| 80 | 16.04 ± 1.18 | 0.0210 ± 0.0015 | 0.9534 ± 0.0160 | 94.98 ± 1.46 at 75 | ||||
| 80 | 15 | 50 | 3 | 8 | 6.90 ± 0.69 | 0.0101 ± 0.0022 | 0.9835 ± 0.0047 | 95.53 ± 1.35 at 105 |
| 4 | 17.91 ± 2.27 | 0.0291 ± 0.0036 | 0.9617 ± 0.0124 | 95.87 ± 1.45 at 60 | ||||
| 5 | 42.04 ± 0.82 | 0.0839 ± 0.0026 | 0.9262 ± 0.0201 | 95.82 ± 1.44 at 30 | ||||
| 6 | 97.19 ± 1.16 | 0.5668 ± 0.0067 | 0.9609 ± 0.0152 | 97.19 ± 1.16 at 8 | ||||
| 7 | 85.83 ± 1.06 | 0.3131 ± 0.0037 | 0.9738 ± 0.0043 | 96.25 ± 1.48 at 10 | ||||
| 8 | 62.84 ± 1.92 | 0.1468 ± 0.0033 | 0.9603 ± 0.0176 | 95.69 ± 1.41 at 24 | ||||
| 9 | 37.22 ± 2.11 | 0.0726 ± 0.0032 | 0.9639 ± 0.0017 | 95.33 ± 1.45 at 32 | ||||
| 10 | 9.95 ± 1.86 | 0.0140 ± 0.0025 | 0.9926 ± 0.0068 | 95.75 ± 2.40 at 97 | ||||
| Plant | Reaction | Degradation | Ref. | |||||
|---|---|---|---|---|---|---|---|---|
| NP | Dye | SBH | Vol. | Percentage | Time | Rate | ||
| Conc. | Conc. | Conc. | mL | % | Min | k, min−1 | ||
| C. citratus | 0.08 mg | 1 mg/mL | 15 mg | 5 | 97.19 | 8 | 0.5668 | Present work |
| Alstonia scholaris | 0.05 mL | 100 µM | 100 mM | 3 | 97 | 27 | 0.7 × 10⁻³ s−1 | [67] |
| Peltophorum pterocarpum | 71 nmol of Ag | 10–4 M | 10–2 M | 3.5 | 82 | 6 | 0.3378 | [68] |
| Clitoria ternatea | 100 µl | 12 ppm | 100 mM | 2.2 | Complete | 18 | 0.1448 | [69] |
| Alchemilla vulgaris | 5 mg | 0.002 M | 0.01 M | 2 | 96 | 7 | - | [70] |
| Onobrychis sativa | 50 ppm | 2 ppm | 600 ppm | 3.6 | 68 | 30 | - | [71] |
| Hibiscus tiliaceus | 1 mg/ml | 1 mM | 10 mM | 12 | ~98 | 35 | 0.101 | [72] |
| Piper chaba | 53.9 mg/L | 2 ppm | 600 ppm | 3.6 | Complete | 8 | - | [73] |
| Trigonella foenum-graecum | 0.5 ml | 4 × 10⁻⁵ M | 0.05 M | 11 | 96.57 | 20 | 0.1665 | [74] |
| Simarouba glauca | 8 | 1 mM | 0.01 mM | 50 | Complete | 80 | 8.5 × 10⁻⁴ s−1 | [75] |
| Cyanthillium cinereum | 0.02 mg/L | 0.08 × 10⁻³ M | 0.06 M | 3 | Complete | 10 | 0.0682 | [76] |
| Cycle | Degradation Percentage | Rate Constant | Correlation Coefficient | Time for Maximum Degradation |
|---|---|---|---|---|
| No. | % | k, min−1 | R2 | ‘%’ at ‘min’ |
| Cycle 0 | 96.97 ± 1.07 | 0.5618 ± 0.0038 | 0.9670 ± 0.0120 | 96.97 ± 1.07 at 8 |
| Cycle 1 | 97.39 ± 1.05 | 0.5612 ± 0.0044 | 0.9567 ± 0.0116 | 97.39 ± 1.05 at 8 |
| Cycle 2 | 96.53 ± 1.21 | 0.5609 ± 0.0053 | 0.9557 ± 0.0095 | 96.53 ± 1.21 at 8 |
| Cycle 3 | 95.46 ± 2.17 | 0.5633 ± 0.0039 | 0.9707 ± 0.0157 | 95.46 ± 2.17 at 8 |
| Cycle 4 | 96.50 ± 1.73 | 0.5628 ± 0.0063 | 0.9649 ± 0.0121 | 96.50 ± 1.73 at 8 |
| Cycle 5 | 96.79 ± 1.82 | 0.5621 ± 0.0046 | 0.9618 ± 0.0091 | 96.79 ± 1.82 at 8 |
| Cycle 6 | 95.97 ± 1.54 | 0.5609 ± 0.0051 | 0.9723 ± 0.0126 | 95.97 ± 1.54 at 8 |
| Cycle 7 | 95.89 ± 1.79 | 0.5631 ± 0.0047 | 0.9629 ± 0.0108 | 95.89 ± 1.79 at 8 |
| Cycle 8 | 95.75 ± 2.02 | 0.5625 ± 0.0052 | 0.9665 ± 0.0133 | 95.75 ± 2.02 at 8 |
| Cycle 9 | 96.46 ± 2.16 | 0.5642 ± 0.0061 | 0.9630 ± 0.0205 | 96.46 ± 2.16 at 8 |
| Cycle 10 | 56.87 ± 1.75 | 0.1524 ± 0.0026 | 0.9778 ± 0.0144 | 97.19 ± 1.86 at 15 |
| Cycle 11 | 42.83 ± 1.86 | 0.0817 ± 0.0038 | 0.9733 ± 0.0112 | 96.57 ± 1.92 at 27 |
| Cycle 12 | 28.21 ± 2.17 | 0.0454 ± 0.0027 | 0.9631 ± 0.0060 | 95.37 ± 1.31 at 49 |
| Plant | Dye Degradation Conditions | Cycle | Outcome(s) | Ref. | ||||||
|---|---|---|---|---|---|---|---|---|---|---|
| NP | Dye | SBH | Vol. | Time | Total | First | Last | |||
| Conc. | Conc. | Conc. | mL | min | No. | D% | D% | |||
| C. citratus | 1.6 mg | 1 mg/mL | 300 mg | 100 | 8 | 12 | 96.97 | 28.21 | Good stability for 9 cycles | Present work |
| A. vulgaris | 5 mg | 0.002 M | 0.01 M | - | 7 | 5 | 96 | 94 | Good stability for 5 cycles | [70] |
| Mangifera indica | 40 mg | 10 mg/L | - | 75 | 75 | 5 | 93 | 89 | No clear decrease in activity after 5 cycles | [77] |
| Thymbra spicata | 2 mg | 3 × 10⁻⁵ M | 4 × 10⁻³ M | 35 | 1 | 8 | ~97 | ~93 | No appreciable activity loss | [78] |
| Aglaia elaeagnoidea | 144.8 mg | 10−4 M | 10−2 M | 2 | 45 s | 10 | ~99 | ~96 | No significant loss of activity | [79] |
| Bunium persicum | 5 mg | 3.1 × 10⁻⁵ M | 5.3 × 10⁻³ M | 50 | 2.5 | 5 | 100 | 100 | No reduction in activity | [80] |
| Hydroxyethylcellulose phthalate | 300 mg | 20 mg/L | - | 20 | 80 | 5 | 79 | 65 | Slight decrease | [81] |
Disclaimer/Publisher’s Note: The statements, opinions and data contained in all publications are solely those of the individual author(s) and contributor(s) and not of MDPI and/or the editor(s). MDPI and/or the editor(s) disclaim responsibility for any injury to people or property resulting from any ideas, methods, instructions or products referred to in the content. |
© 2025 by the authors. Licensee MDPI, Basel, Switzerland. This article is an open access article distributed under the terms and conditions of the Creative Commons Attribution (CC BY) license (https://creativecommons.org/licenses/by/4.0/).
Share and Cite
Kurra, H.; Velidandi, A.; Pabbathi, N.P.P.; Godishala, V. Aqueous Cymbopogon citratus Extract Mediated Silver Nanoparticles: Part II. Dye Degradation Studies. Eng 2025, 6, 102. https://doi.org/10.3390/eng6050102
Kurra H, Velidandi A, Pabbathi NPP, Godishala V. Aqueous Cymbopogon citratus Extract Mediated Silver Nanoparticles: Part II. Dye Degradation Studies. Eng. 2025; 6(5):102. https://doi.org/10.3390/eng6050102
Chicago/Turabian StyleKurra, Himabindu, Aditya Velidandi, Ninian Prem Prashanth Pabbathi, and Vikram Godishala. 2025. "Aqueous Cymbopogon citratus Extract Mediated Silver Nanoparticles: Part II. Dye Degradation Studies" Eng 6, no. 5: 102. https://doi.org/10.3390/eng6050102
APA StyleKurra, H., Velidandi, A., Pabbathi, N. P. P., & Godishala, V. (2025). Aqueous Cymbopogon citratus Extract Mediated Silver Nanoparticles: Part II. Dye Degradation Studies. Eng, 6(5), 102. https://doi.org/10.3390/eng6050102