Abstract
This article presents the development and implementation of an automated digital test bench for fault diagnosis in the caution and warning panels of the UH-60 helicopter, using practices based on NASA’s systems engineering process. The research addresses the critical need to improve efficiency and accuracy in aeronautical maintenance by automating processes traditionally relying on manual techniques. Throughout the study, advanced software engineering methodologies were implemented to develop a system that significantly reduces diagnostic times and enhances the accuracy and reliability of results by integrating digital signal processing. The article highlights the economic benefits, demonstrating a substantial reduction in repair costs, and emphasizes the system’s flexibility to adapt to other aeronautical components, establishing a solid foundation for future technological innovations in aircraft maintenance. The novelty of this paper lies in integrating real-time simulation with a closed-loop diagnostic system designed primarily for the UH-60 avionics panels. This approach has not previously been applied to this series of aircraft or aeronautical components, allowing for adaptive and automated fault detection and significant improvement in diagnostic accuracy and speed in unscheduled aeronautical maintenance environments.
1. Introduction
From a maintenance perspective, aircraft electronic systems are critical elements, as their failure is challenging to predict, and those systems are considered condition monitoring elements in maintenance manuals [1]. Approximately 30% and 50% of Aircraft on Ground (AOG) situations relate to electrical and avionics systems [2]. AOG refers to a situation in which an aircraft is temporarily unable to fly due to technical problems, lack of spare parts, or other related issues. For this reason, Aircraft manufacturers address these issues through Line Replaceable Units (LRUs) and redundant systems, which help maintain operability and reliability [3]. However, troubleshooting remains manual, and it is heavily dependent on technician expertise, resulting in high rates of unnecessary component replacements and increased repair turnaround time and costs [4].
Aircrafts are equipped with warning systems to alert the crew to issues or malfunctions. These systems include visual, auditory, and tactile alerts designed to effectively capture the crew’s attention. The warning systems classify problems based on their urgency into three categories: warnings, cautions, and advisories. Warnings are the most critical problems, indicating operational conditions or issues in aircraft systems that require immediate crew action. Cautions suggest that the crew’s attention is necessary within a specified time but are less urgent than warnings. On the other hand, advisories refer to conditions that need attention only when time permits, facilitating more efficient and appropriate work.
On UH-60 helicopters, the prescribed maintenance tasks for the Caution/Advisory Panel and Master Warning Panel are mainly performed manually. During inspections, technicians use conventional tools such as multimeters, signal generators, and oscilloscopes to assess the component’s condition, leading to excessive diagnostic times, increased human error, and decreased aircraft availability [4]. In addition, with the move towards mass production in the aircraft industry, the volume of parts requiring inspection has increased, requiring more efficient data analysis methods [5].
One of the main challenges in aircraft maintenance is the extended time required for inspection during fault diagnosis processes [6]. This process is highly dependent on the technician’s experience, which increases the risk of inconsistencies and errors. These factors compromise the efficiency and effectiveness of aeronautical maintenance [7]. In the face of these challenges, previous research highlights advancements in test bench automation, with various studies focusing on software application and analog equipment integration for UH-60 helicopter maintenance [8]. Companies such as Aero Train Corp (Flint, MI, USA) have introduced commercial avionics maintenance and personnel training platforms, but with closed-source architectures that limit the possibility of modifying, altering, or adding new tests without incurring significant additional costs [9,10].
Test and diagnostic systems that control variables based on LabVIEW 2017 software, the general purpose interface bus (GPIB) protocol, and data acquisition (DAQ) equipment have also been reported [11], which allow partial automation but present low interoperability and difficult adaptation to different operational environments.
Furthermore, ref. [12] highlights that systems have been designed to monitor the safe operating ranges of the parameters provided by the Caution and Warning Panel and other cockpit instruments of the UH-60 since the beginning of the century. These systems require the pilot to recognize and use the relationships between physical parameters to reason about the causes that generate the alarms.
The development of avionics test benches for helicopters involves creating integrated and dynamic platforms to test and validate avionics systems in controlled laboratory environments [13]. These systems often combine Line Replaceable Modules (LRMs) and are tested using dynamic aircraft simulation models in various hardware and software environments [14].
Although there are advances in this field that include remote operation and integration of avionics test suites [15], robust control systems and flight data analysis for small aircraft [16,17], and generic and adaptable avionics test systems to meet safety and performance standards on various helicopter models [18,19], limitations persist in terms of flexibility, openness, and adaptation to real field conditions. Additionally, no studies have explored the integration of closed-loop control systems for automated fault detection in UH-60 maintenance, a gap this research aims to address.
The main contribution of this article is to aeronautical maintenance by introducing an automated and standardized diagnostic tool that enhances efficiency, accuracy, and cost-effectiveness. The integration of real-time simulation, closed-loop control, and adaptive diagnostic thresholds for the UH-60 fault diagnosis represents a novel approach, reducing human dependency and optimizing operational readiness. These advancements provide a scalable framework for broader applications in avionics maintenance, bridging a critical gap in current methodologies.
The remainder of this paper is structured as follows: Section 2 provides the context and previous work, describing the operational challenges of UH-60 maintenance and the limitations of current diagnostic approaches. Section 3 describes the materials and methods, detailing the system architecture, software development, and validation methodology. Section 4 presents the results of a preliminary study, including performance evaluation and cost analysis, and Section 5 discusses the implications of the findings, comparing them with existing solutions. Finally, Section 6 concludes with key ideas, contributions, and future research directions.
2. Context and Previous Work
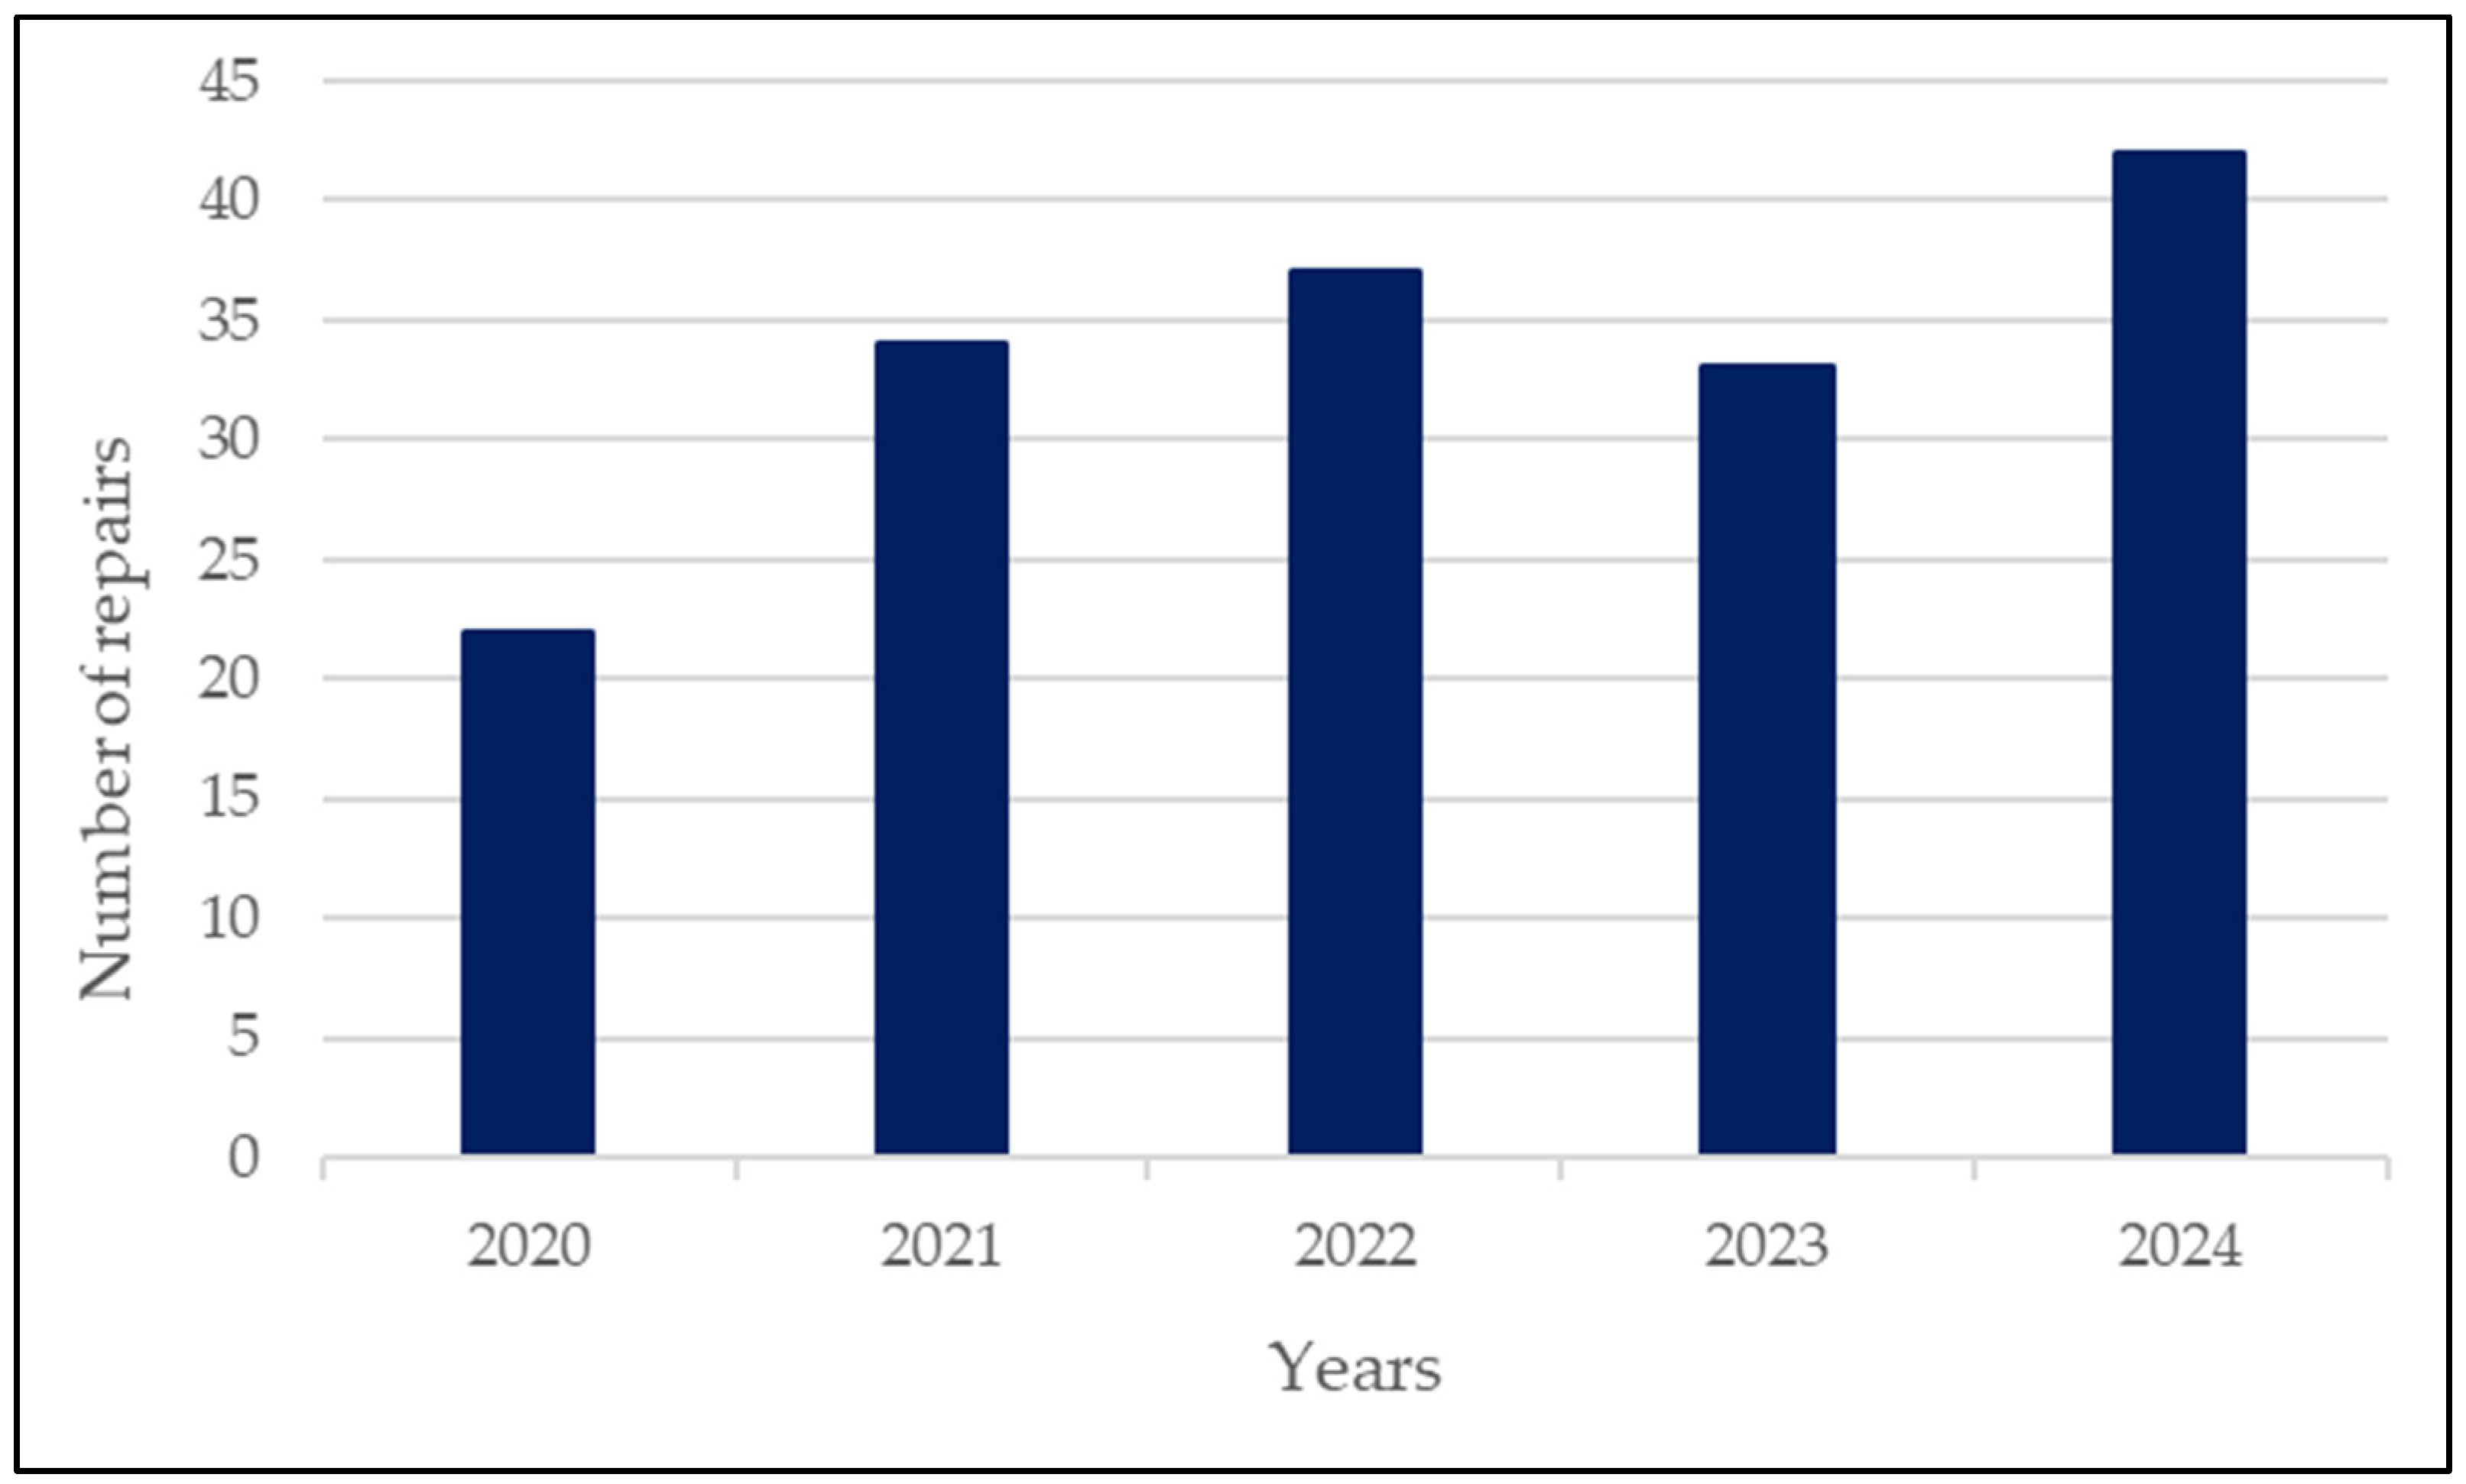
The Colombian Army operates the largest fleet of UH-60 Black Hawk helicopters in Latin America that play a crucial role in national defense, disaster response, and military operations. Within this operational environment, the maintenance of this fleet is a complex task that requires rigorous inspections and accurate fault diagnosis to ensure its operational availability. One of the most critical components in this context is the warning system, which alerts the crew about potential system failures through a series of visual indicators. These alerts are usually color-coded: red lights for warnings, amber lights for cautions, and green lights for advisories [20]. At the same time, it has been a component with a high failure rate in the Colombian Army, as illustrated in Figure 1.

Figure 1.
Repair statistics for the warning system of UH-60 helicopters. Source: Enterprise Resource Planning Systems, Applications, and Products in Data Processing (ERP SAP) for the Colombian Army [21].
Current warning system maintenance procedures are based mostly on manual diagnostic techniques; this is also the case in the Colombian Army. This time- and resource-consuming process results in high repair costs, long turnaround times, and a high dependence on technician expertise. Approximately 80% of warning system repairs are outsourced to external suppliers, resulting in delays of 4 to 6 months per unit and an average repair cost of 61.3% of the new component cost; in addition, the inventory of operational warning system remains below optimal stock, affecting fleet availability and mission readiness as evidenced in Table 1. Therefore, designing test benches to improve the maintenance process is a desired avenue for research.

Table 1.
Maintenance variables for the warning system on the Colombian Army 1.
The development of digital test benches requires a structured methodological framework that ensures compliance with aeronautical regulations and optimizes efficiency and adaptability. Previous studies indicate that the selection of methodologies for developing aviation systems depends on project complexity, the need to comply with specific regulations, the expected frequency of modifications or updates, and the level of collaboration required between development teams and end users. Therefore, the most suitable methodologies balance quality and efficiency in managing complex and regulated projects [22]. Among the most relevant approaches, Systems Engineering has been widely recognized for its ability to ensure the quality of hardware and software systems through meticulous defect logging and inspections. These characteristics are crucial in an aeronautical environment, where failures can have severe consequences [23,24]. As an advantage, it generally delivers high-quality results in eliminating and minimizing high-severity defects, essential for ensuring the reliability and safety of the test benches used in aeronautical maintenance [25]. Given these advantages, we adopted some practices from NASA’s systems engineering process to ensure the proposed test bench’s quality, reliability, and safety.
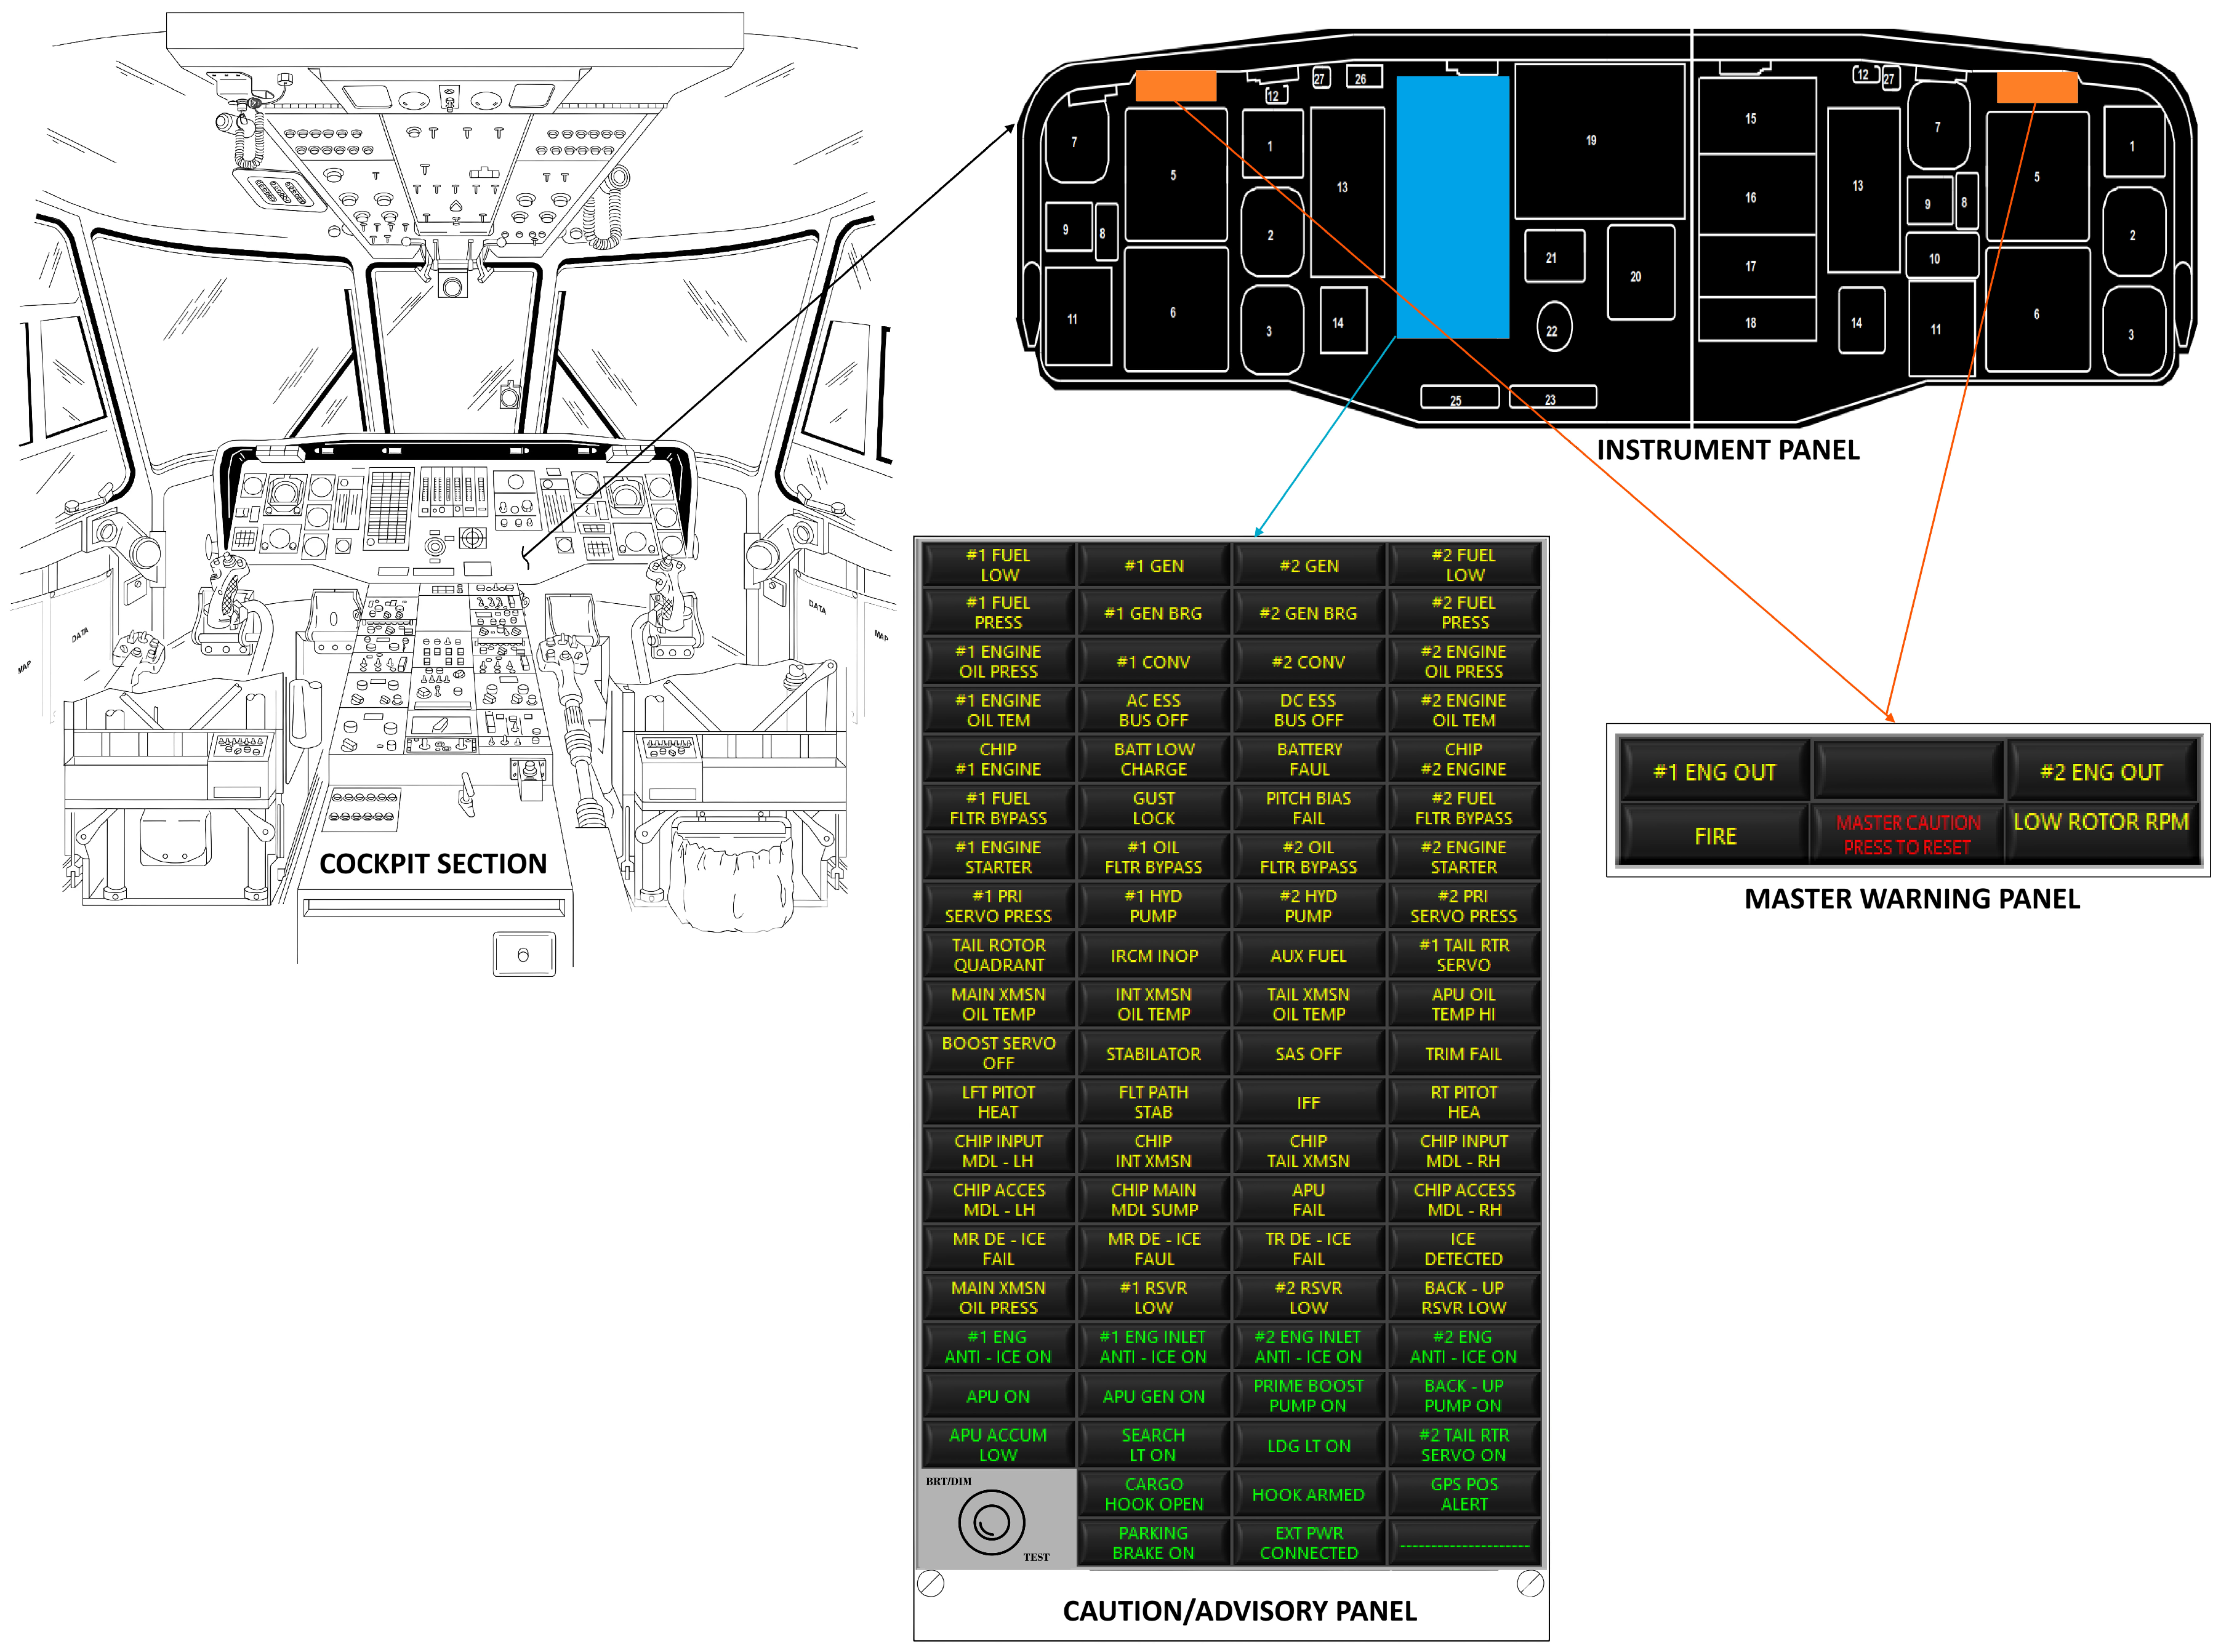
The UH-60’s warning system consists of two main components: the master warning panel and the Caution and Warning Panel. These components in UH-60 helicopters are strategically located in the upper left and right sections of the instrument panel, respectively. At the same time, the Caution/Advisory Panel is centrally positioned, allowing both the pilot and co-pilot optimal visibility. The Caution and Warning Panel monitors critical systems such as fuel, generators, oil pressure and temperature, hydraulic systems, metallic particle detection, ice prevention, and the auxiliary power unit. In contrast, the master warning panel includes essential indicators for emergencies such as engine loss, fire detection, low rotor speed, and a general warning reset button.
The interaction between the master warning panel and the Caution and Warning Panel is crucial for managing operational alerts. When the Caution/Advisory Panel detects a system failure, it sends a signal to the master warning panel. This signal activates the capsule labeled “Master Caution Press to Reset”, turning it ON. This capsule not only alerts system failures detected by the Caution and Warning Panel but can also signal issues in any other helicopter system. Additionally, it incorporates a reset function that allows the pilot or co-pilot to turn off the capsule and deactivate the alert, both in the Caution/Advisory Panel and other aircraft components. This reset capability is vital for efficiently managing and resolving alerts during flight [26]. Figure 2 shows the location of the master warning panel and the Caution/Advisory and warning panels in UH 60 helicopters.

Figure 2.
Caution/Advisory Panel and Master Warning Panel adapted from [26].
Aeronautical maintenance research highlights advances in test bench automation and digital diagnostics. Previous studies have developed software-driven analog test benches integrating virtual instrumentation for avionics evaluation [27]. Furthermore, virtual instrumentation techniques have been applied to launch vehicle avionics, providing cost-effective and user-intuitive interfaces for testing telemetry and navigation systems [28]. This virtual instrumentation has also been applied to engine test benches, allowing the control and acquisition of engine parameters [29]. For ground testing on aircraft, LabVIEW-based systems have been proposed to automate the recording and analysis of signals during ground testing, eliminating manual measurements and enabling the development of software-controlled tests applicable to more complex automated test equipment in aircraft maintenance [30]. However, these systems are limited by their reliance on proprietary software and inflexibility, limiting their adaptability to specific applications and standard military.
This paper addresses these shortcomings by developing a fully automated test bench capable of identifying faults in real time, performing diagnostics based on real-time simulation, and integrating closed-loop feedback. The proposed system standardizes diagnostic procedures, reduces human intervention, and improves operational efficiency. Results are expected to include a significant reduction in repair times, improved maintenance cost-effectiveness, and increased fleet availability through a proactive technological approach to avionics diagnostics.
3. Materials and Methods
This section describes the methodological approach followed for designing, implementing, and validating the proposed digital test bench for UH-60 helicopters. The methodology was structured to ensure compliance with aeronautical standards, integrate automation processes, and validate system performance through iterative testing. In this context, some practices were motivated by NASA’s Systems Engineering process, which is recognized for its rigorous approach to defect management and systematic inspection, which enhances reliability and safety in aeronautical maintenance environments. To this end, system design processes were employed that included the definition of stakeholder expectations, technical requirements, and software requirements, as well as the logical decomposition of the system. Likewise, technical management practices and the final product’s implementation and validation were integrated. All these activities were based on the NASA Systems Engineering manual [31]. Systems engineering at NASA is defined as a methodical and multidisciplinary approach to the design, realization, technical management, operations, and retirement of a system, where a system is considered as the combination of elements that work together to produce the capability required to meet a need. In project management, systems engineering focuses on managing technical decisions, including complex projects’ technical aspects, cost, and schedule considerations. Research has shown that systems engineering activities correlate positively with program success regarding cost, schedule, and perceived success metrics. Optimal systems engineering effort levels can reach 25% of the program cost, which is evidence of its considerable influence on project results [32].
Supplementing this structured framework, the methodology adopted in this study integrates principles of real-time simulation and closed-loop diagnostic control, enabling the replication of failure scenarios and the dynamic evaluation of operational thresholds. Real-time simulation refers to the performance of tests under conditions that reproduce the behavior of the system in operation. At the same time, closed-loop control allows the monitoring and automatic adjustment of system responses based on the perceived signals. Adaptive thresholds are reference values adjusted according to the true statistical behavior of the system, thus optimizing the identification of anomalies. These concepts provide a theoretical foundation for the automation and accuracy needed in unscheduled maintenance contexts of avionics systems.
As the first step, project stakeholders, including the development team, were identified [33]. Next, the requirements definition phase was carried out, working closely with aeronautical maintenance experts to capture and refine the specific software requirements, ensuring that all necessary functionalities are well documented. The functional requirements of the test bench were defined by following the requirements of the engineering framework [34,35]. Then, iterative development cycles were implemented, including design, coding, review, and test phases, emphasizing continuous inspection and detailed logging of identified defects [36]. The review and test phase used a compliance and fault injection technique to evaluate the system’s reliability [37]. Subsequently, a quality assessment was performed, employing predefined quality metrics to evaluate the effectiveness of inspections and testing in defect elimination, focusing on high-severity defects. Finally, effectiveness and performance measures were defined to evaluate quality and compliance with requirements.
3.1. Sistem Design Processes
3.1.1. Definition and Baseline of Stakeholder Expectations
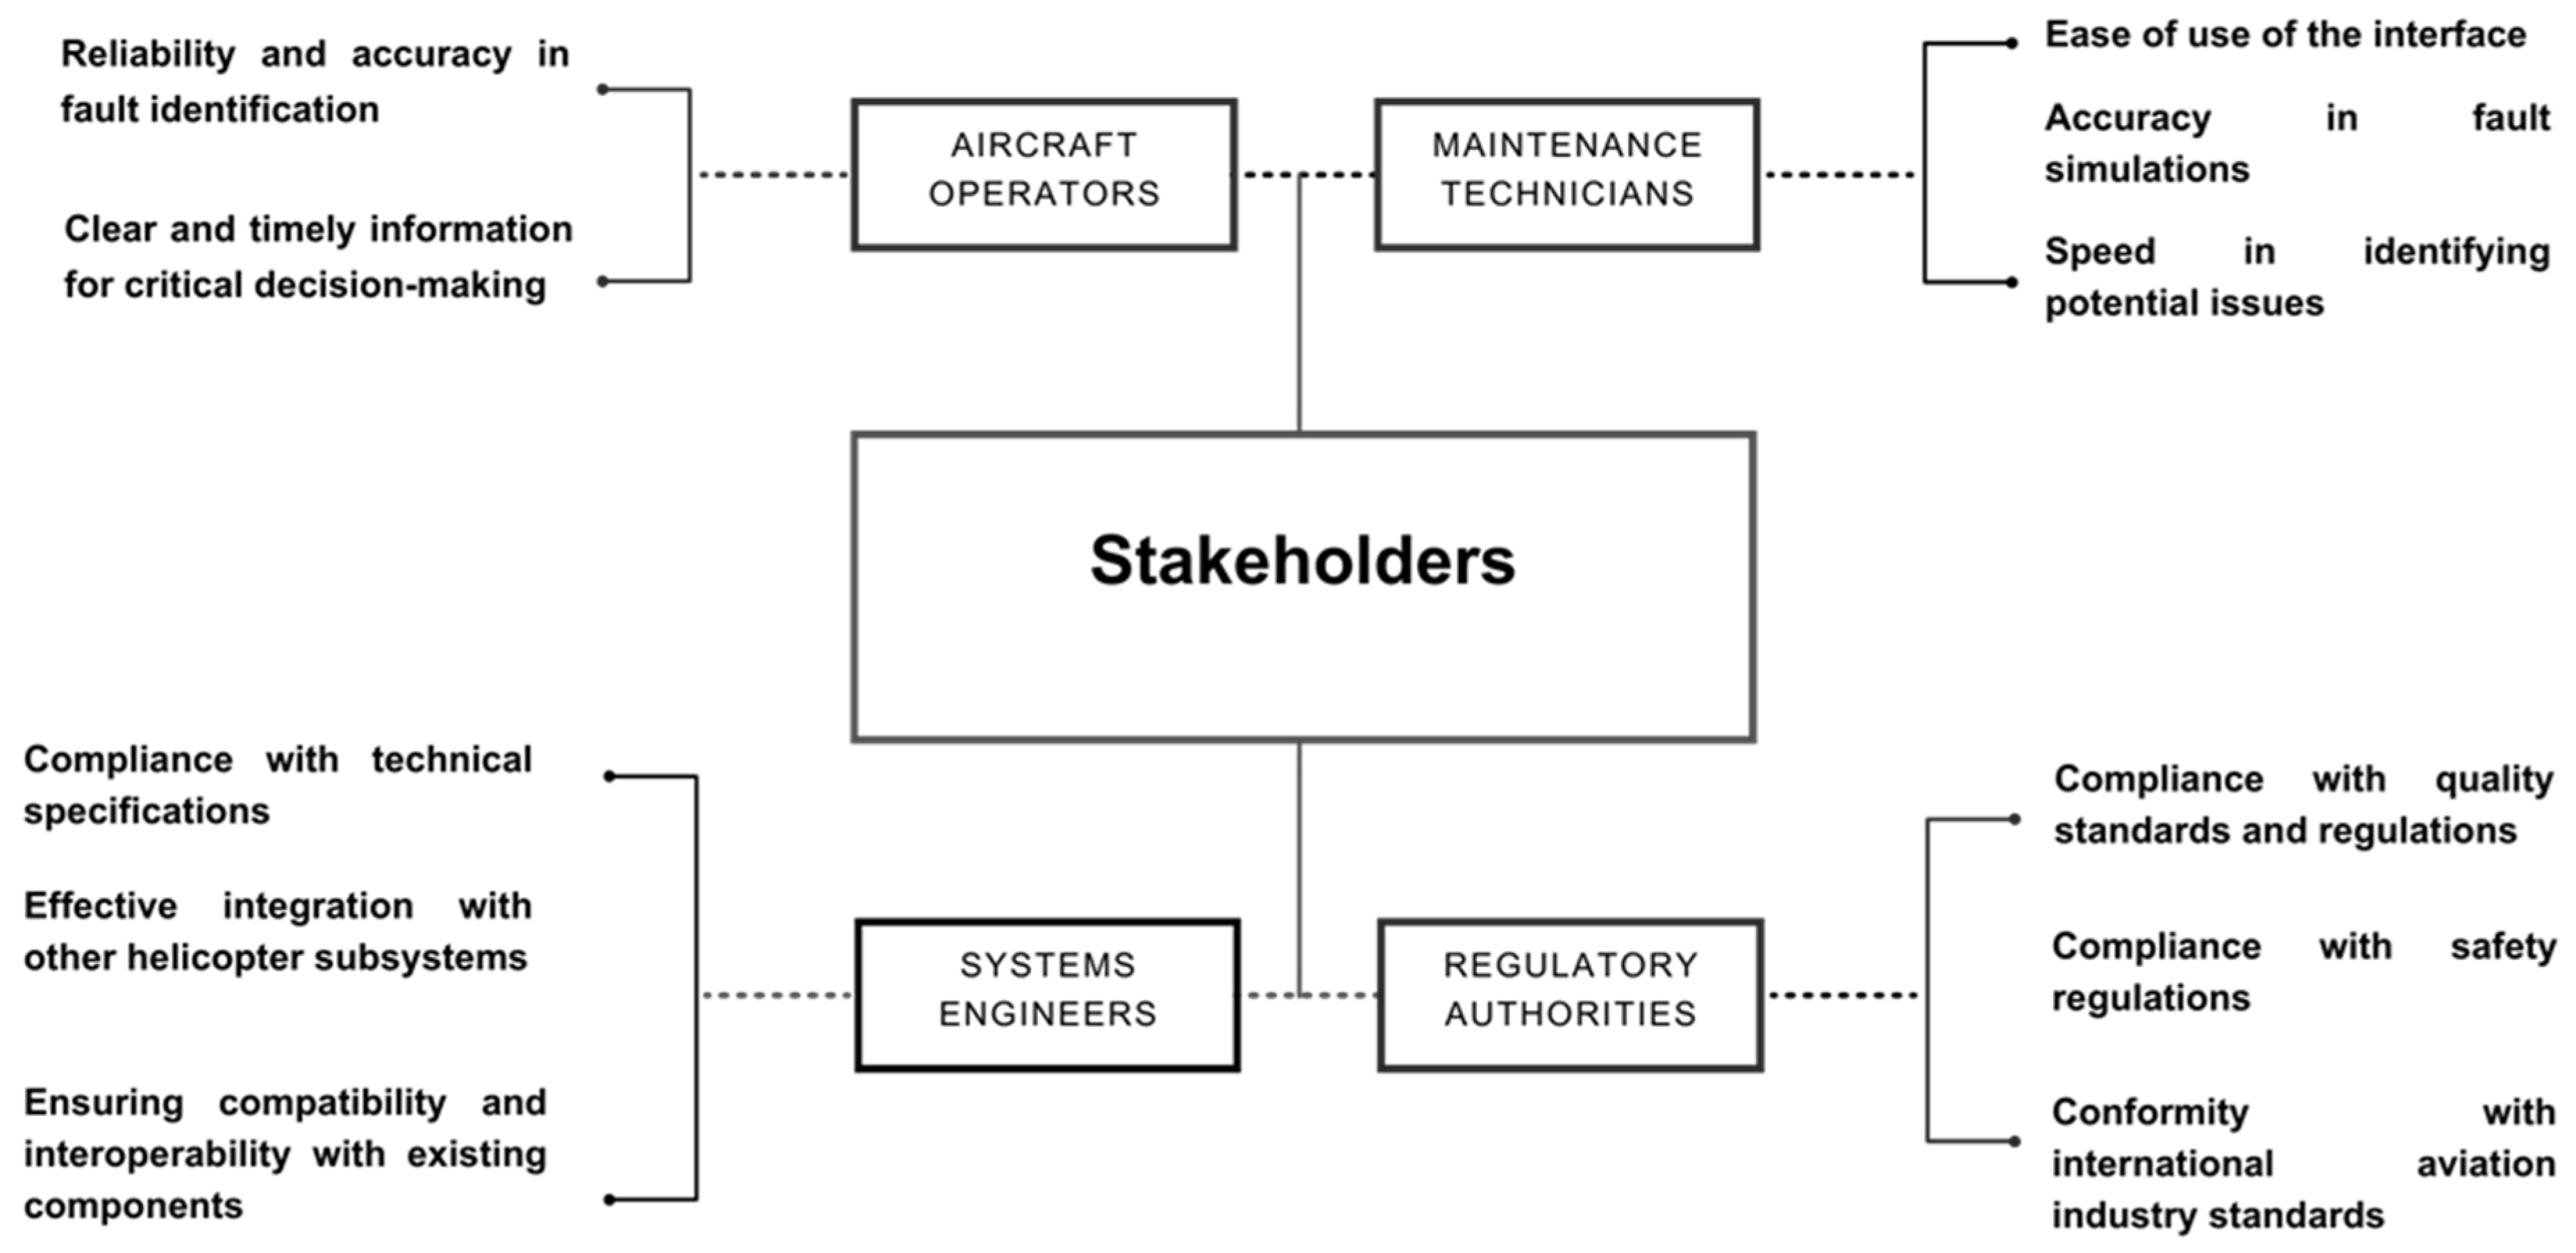
Regarding this, the stakeholders involved in developing and implementing the UH-60 test bench for fault diagnosis include aircraft operators, maintenance technicians, systems engineers, equipment manufacturers, and aviation regulatory authorities. Each of these groups has specific expectations and needs that must be identified and managed appropriately to ensure the system serves its purpose efficiently and safely. The key stakeholders in this project are the UH-60 helicopter operators, who require a reliable system for early fault detection and verification of the operability of the warning systems before each mission. Maintenance technicians are the main users of the diagnostic interface, and their expectations focus on ease of use, accuracy of simulations, and the ability to identify potential problems quickly and effectively. Systems engineers and equipment manufacturers expect the system to meet technical specifications, ensuring effective integration with other helicopter subsystems. Finally, aviation regulatory authorities seek to ensure that the system complies with all safety requirements and international regulations. Figure 3 shows schematically the stakeholders and their expectations.
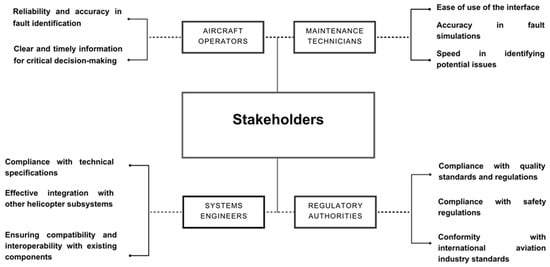
Figure 3.
Systems representation of stakeholders and their expectations. Source: Author.
3.1.2. Generation and Baseline of Technical Requirements
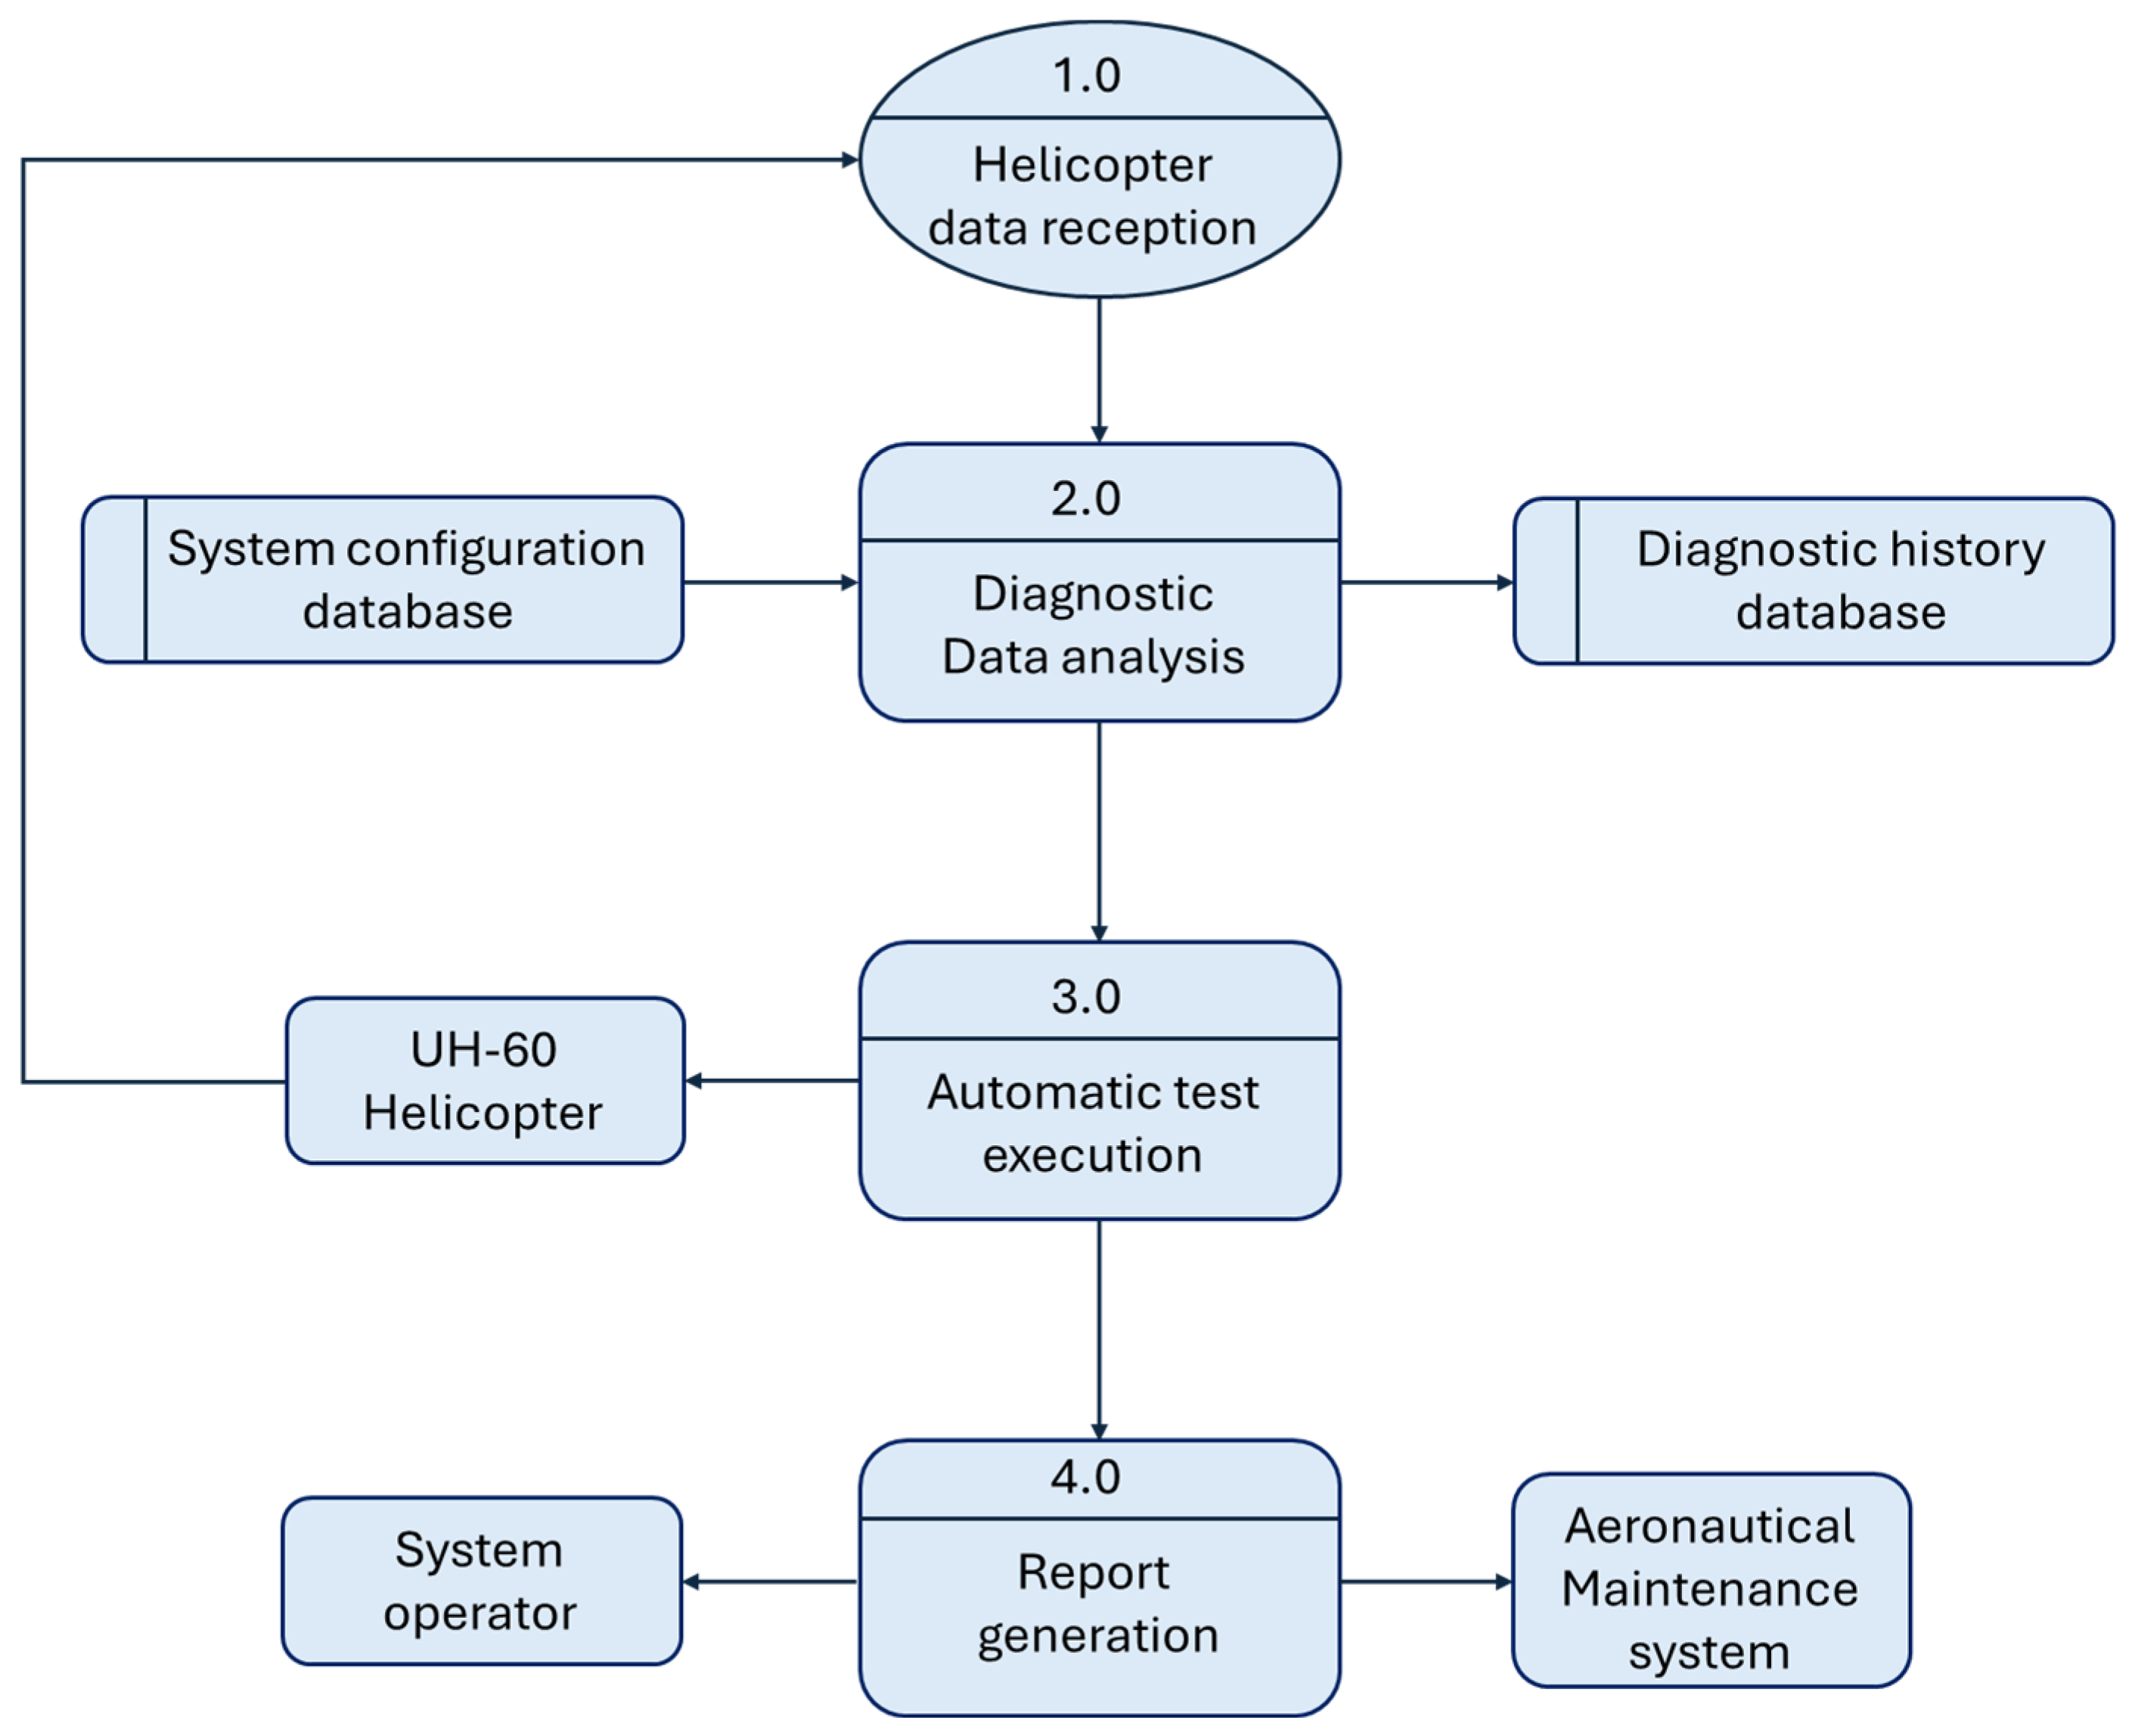
Generating and establishing technical requirements baseline were key steps in ensuring that stakeholder expectations were transformed into clear and detailed technical specifications. This process used modeling and analysis tools to break the expectations into specific technical components. To this end, the Data Flow Diagram (DFD) is an essential tool for modeling data processing in software engineering [38]. As shown in Figure 4, a DFD was developed to model and analyze the requirements. The DFD helped identify and document specific technical requirements, covering critical aspects of the system such as functionality, performance, security, and interoperability with other systems. The DFD provides a clear visualization of how data flows between the various components of the system [39], which was crucial to ensure that all important aspects were considered and properly addressed. For instance, it allowed us to define precisely how the system would capture diagnostic data from the UH-60 helicopter, how it would be processed and analyzed, and how automated tests would be generated based on these analyses. In addition, the diagram facilitated the identification of interaction points with other systems and the need to ensure that these points met the required interoperability standards.

Figure 4.
Data Flow Diagram (DFD) for the test bench. Source: Author.
The technical requirements were compiled in a Software Requirements Specification (SRS) document. The SRS included precise descriptions of system functionalities, such as the ability to perform automated tests according to maintenance manuals, including the execution of simulated fault sequences, signal monitoring, threshold evaluation, and generating detailed and customizable reports. Furthermore, users can be managed with specific roles and permissions. Additionally, it covered performance requirements, such as the system’s ability to process and analyze data in real-time and its high reliability under conditions of high operational load. Regarding security, the SRS ensured that the system complied with aeronautical safety standards and had robust measures to protect against unauthorized access and cyberattacks. Some of the most important requirements are illustrated in Table 2.
Table 2.
Software Requirements Specification (SRS).
Specific acceptance criteria, such as seamless integration with existing maintenance management systems, scalability to support future growth in users and data, and ease of software updates and maintenance, were established. This document became a comprehensive guide for the development team. It acted as a contract between the stakeholders and the developers, ensuring that all requirements were clearly understood and agreed upon. In this way, the SRS served as a crucial reference throughout the project’s lifecycle, ensuring that the software development remained aligned with the needs and expectations of the end-users and other key stakeholders [40].
3.1.3. Logical and Behavioral Decomposition
Understanding the logical and behavioral decomposition of the UH-60’s warning systems is essential to structuring the automated test bench. The interaction between these systems determines how failures are detected, categorized, and communicated to the crew. This section describes the functional dependencies between these subsystems and how they influence the diagnostic approach implemented in the test bench.
The UH-60’s electrical infrastructure, including essential direct current (28 VDC) and alternating current buses, ensures continuous system operation, even in emergencies. The panel’s light dimming capability (DIM Control) optimizes visibility under varying lighting conditions, which is crucial for nighttime operations. The Pilot Warning Panel and the co-pilot Circuit Panel integrate fuses and lighting controls that allow direct management of warning signals. These panels are connected to the electrical system and cyclic control, facilitating the pilot’s interaction with real-time warnings. The UH-60’s engine and transmission warning system monitor key parameters such as oil pressure and temperature, and metallic particle detection via chip detectors. These systems are essential for preventing critical failures that could compromise the helicopter’s operability. The Hydraulic System and the Automatic Flight Control System (AFCS) are continuously monitored to ensure the aircraft’s stability and control. Any failure in these systems is instantly reported to the Caution Advisory Panel, enabling immediate responses. Additional systems, such as the External Stores Support System (ESSS) and the Electronic Countermeasures System (ECM), are also integrated, providing extended mission capabilities and protection in hostile environments. Additionally, the de-icing and anti-icing systems ensure operability in extreme conditions. Finally, the navigation and communication systems, including Doppler/GPS and IFF (Identification Friend or Foe), are incorporated into the Caution Advisory System, ensuring that any failure is quickly communicated to maintain accuracy and safety in operations [26].
3.2. Technical Management Processes
The process included identification, documentation, analysis, prioritization, and tracking of system requirements. Requirements management tools, such as JIRA software 9.13.0 and Confluence, were used to document and track each requirement. Every requirement was analyzed in detail to ensure it was understandable, complete, and verifiable. A prioritization process was conducted using the MoSCoW method (Must have, Should have, Could have, and Won’t have), which can be observed in Table 3, ensuring that critical requirements received the appropriate attention in the early stages of development [41].
Table 3.
MoSCoW method for the UH-60 fault detection and diagnosis system.
In particular, for the requirement of integration with existing maintenance management systems, the need for compatibility with the ERP SAP system used by the Colombian Army Aviation was declared during the design phase. This implied defining standardized data structures and reporting formats that could be recognized by application programming interfaces contained in the license of that system to facilitate interoperability, traceability of results, and the reduction in manual tasks by technical personnel.
The requirements table (i.e., Table 3) categorizes the necessary, desirable, and optional functionalities for the UH-60 fault detection and diagnosis system, as well as those that will not be implemented in the project’s current phase. In the “Must have” category, critical requirements such as the need for an intuitive user interface, integration with existing maintenance management systems, the ability to perform automated tests based on maintenance manuals, strict compliance with aeronautical safety regulations, and the generation of detailed and customizable reports are highlighted. These elements ensure the system meets stakeholder expectations and aligns with the industry’s operational and regulatory practices.
Moreover, the “Should have” category includes functionalities that, while not essential, would add significant value, such as multilingual support, a predictive analysis module to enhance preventive maintenance, and accessibility from mobile devices for greater flexibility. These aspects improve the usability and functionality of the system, aligning with operational needs in multinational and high-demand environments. Subsequently, the “Could have” category includes optional features that could further enhance the system, such as integration with augmented reality, real-time chat functionality for technical support, and advanced user interface customization options. While not a priority, these features could be beneficial in future system versions.
Finally, the “Won’t have” category identifies functionalities that will not be implemented in this project phase, such as integration with financial management systems, gamification for training and education, and big data analysis for advanced predictive maintenance. These functionalities are considered non-essential at the current stage and will be evaluated for potential future development.
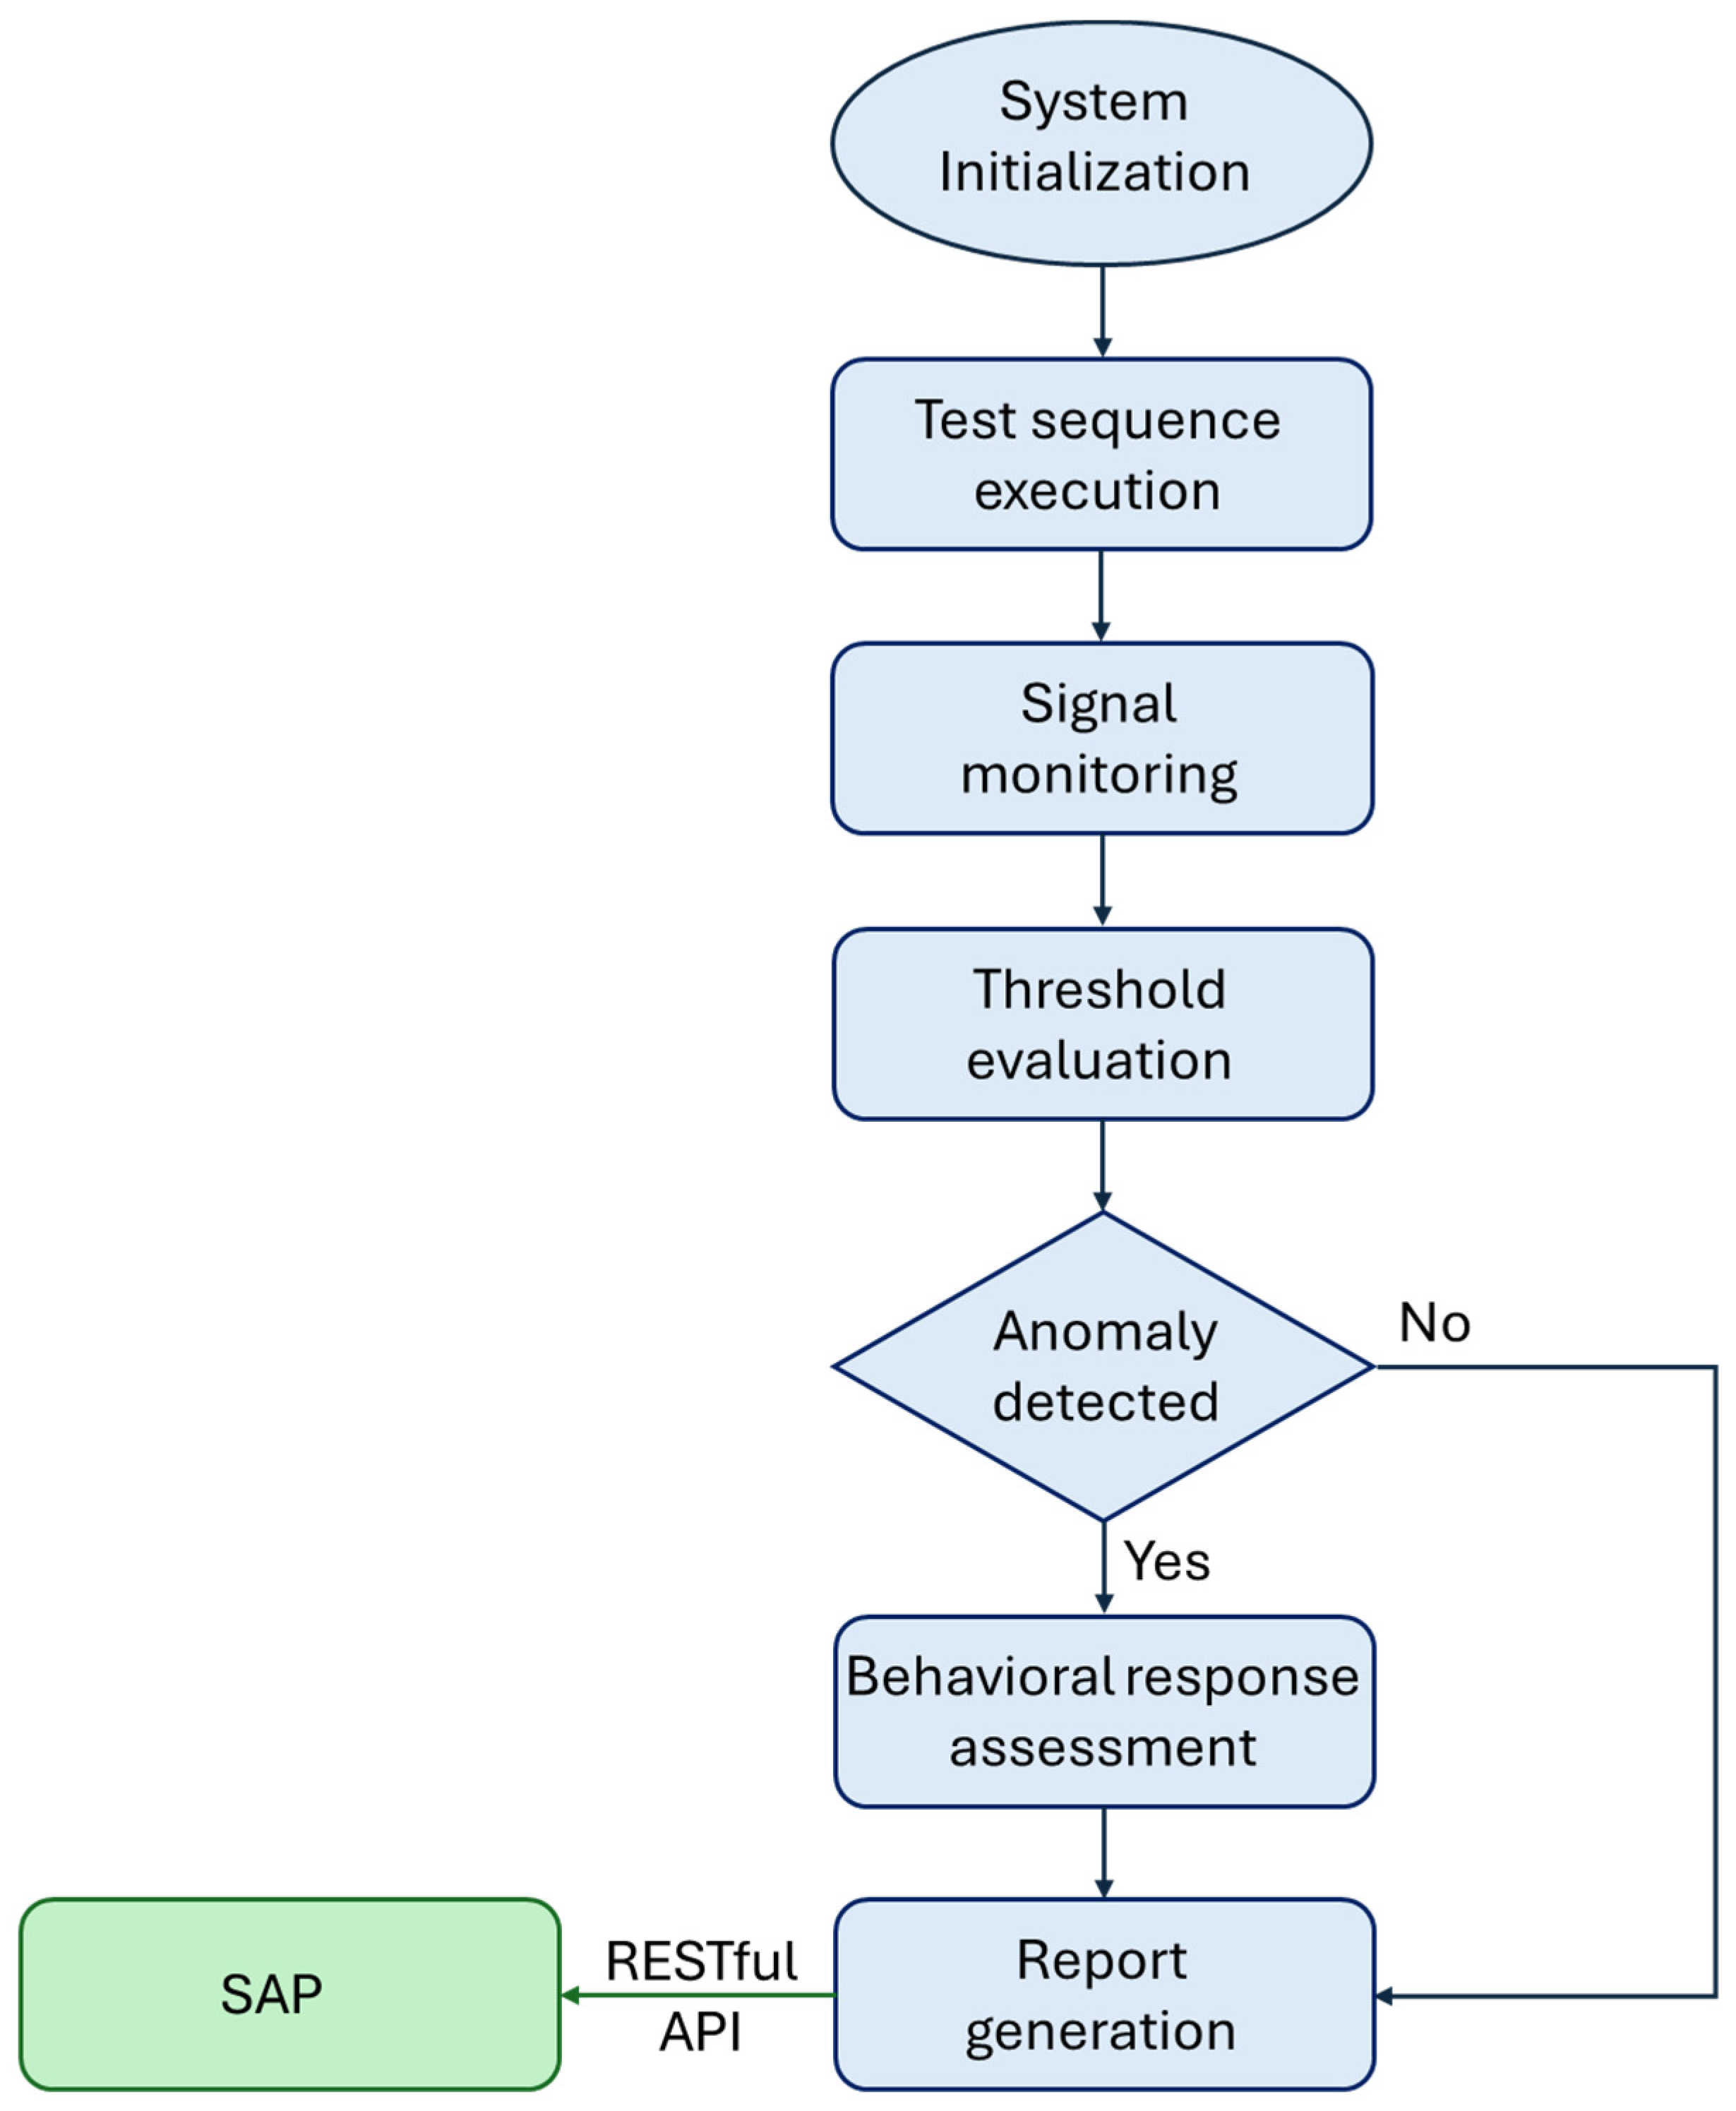
3.3. Description of the Logic Diagnostic
The test bench logic is based on a structured diagnostic sequence built into the software, which works within a closed-loop control framework. This logic facilitates automated fault injections, signal acquisition, threshold comparison, and decision-making processes under pre-set conditions. The sequence is performed with minimal human intervention and has been tuned to ensure repeatability, accuracy, and traceability in aircraft maintenance. The logic diagnostic procedure consists of the following steps:
System initialization: The processor ensures stable power supply conditions (28 VDC, 6A) and arranges the acquisition and control modules. Reference readings from the aircraft technical manual establish the corresponding initial conditions.
Test sequence execution: A pre-established sequence of fault conditions is simulated through the activation of electrical signals. These represent faults identified in the technical manual, such as open circuits, undervoltage, and unexpected logic transitions on the boards.
Signal monitoring: The test bench records voltage and logic signals of the components under test through acquisition hardware based on PCI eXtension for Instrumentation (PXI) technology. The data are subjected to continuous analysis and storage for further processing.
Threshold evaluation and fault detection: Signal values are checked against dynamic thresholds, typically ±0.5 VDC or statistical anomaly > 3σ, resulting from calibration on operating caution and warning panels. Anomalies exceeding these limits trigger anomaly indicators and are documented as possible faults.
Behavioral response assessment: The system checks specific responses, such as capsule brightness, overvoltage, signal loss, or logic errors, to the injected conditions. Unexpected or absent responses are recorded.
Report generation: At the completion of the sequence, a detailed report summarizes signal behavior, detected deviations, and suggested fault isolation paths according to the technical reference documentation provided by the aircraft manual.
Furthermore, the logical architecture of the system is designed to automatically export the reports generated in formats compatible with the SAP ERP system, allowing diagnostic results to be documented in maintenance orders and failure histories to be updated in real time. This interoperability is achieved through the RESTful application programming interface (API) incorporated in the Colombian Army’s SAP license. Figure 5 visually represents this diagnostic logic in a process flow diagram.

Figure 5.
Flowchart for the logic diagnostic procedure. Source: Author.
4. Results
4.1. Product Implementation
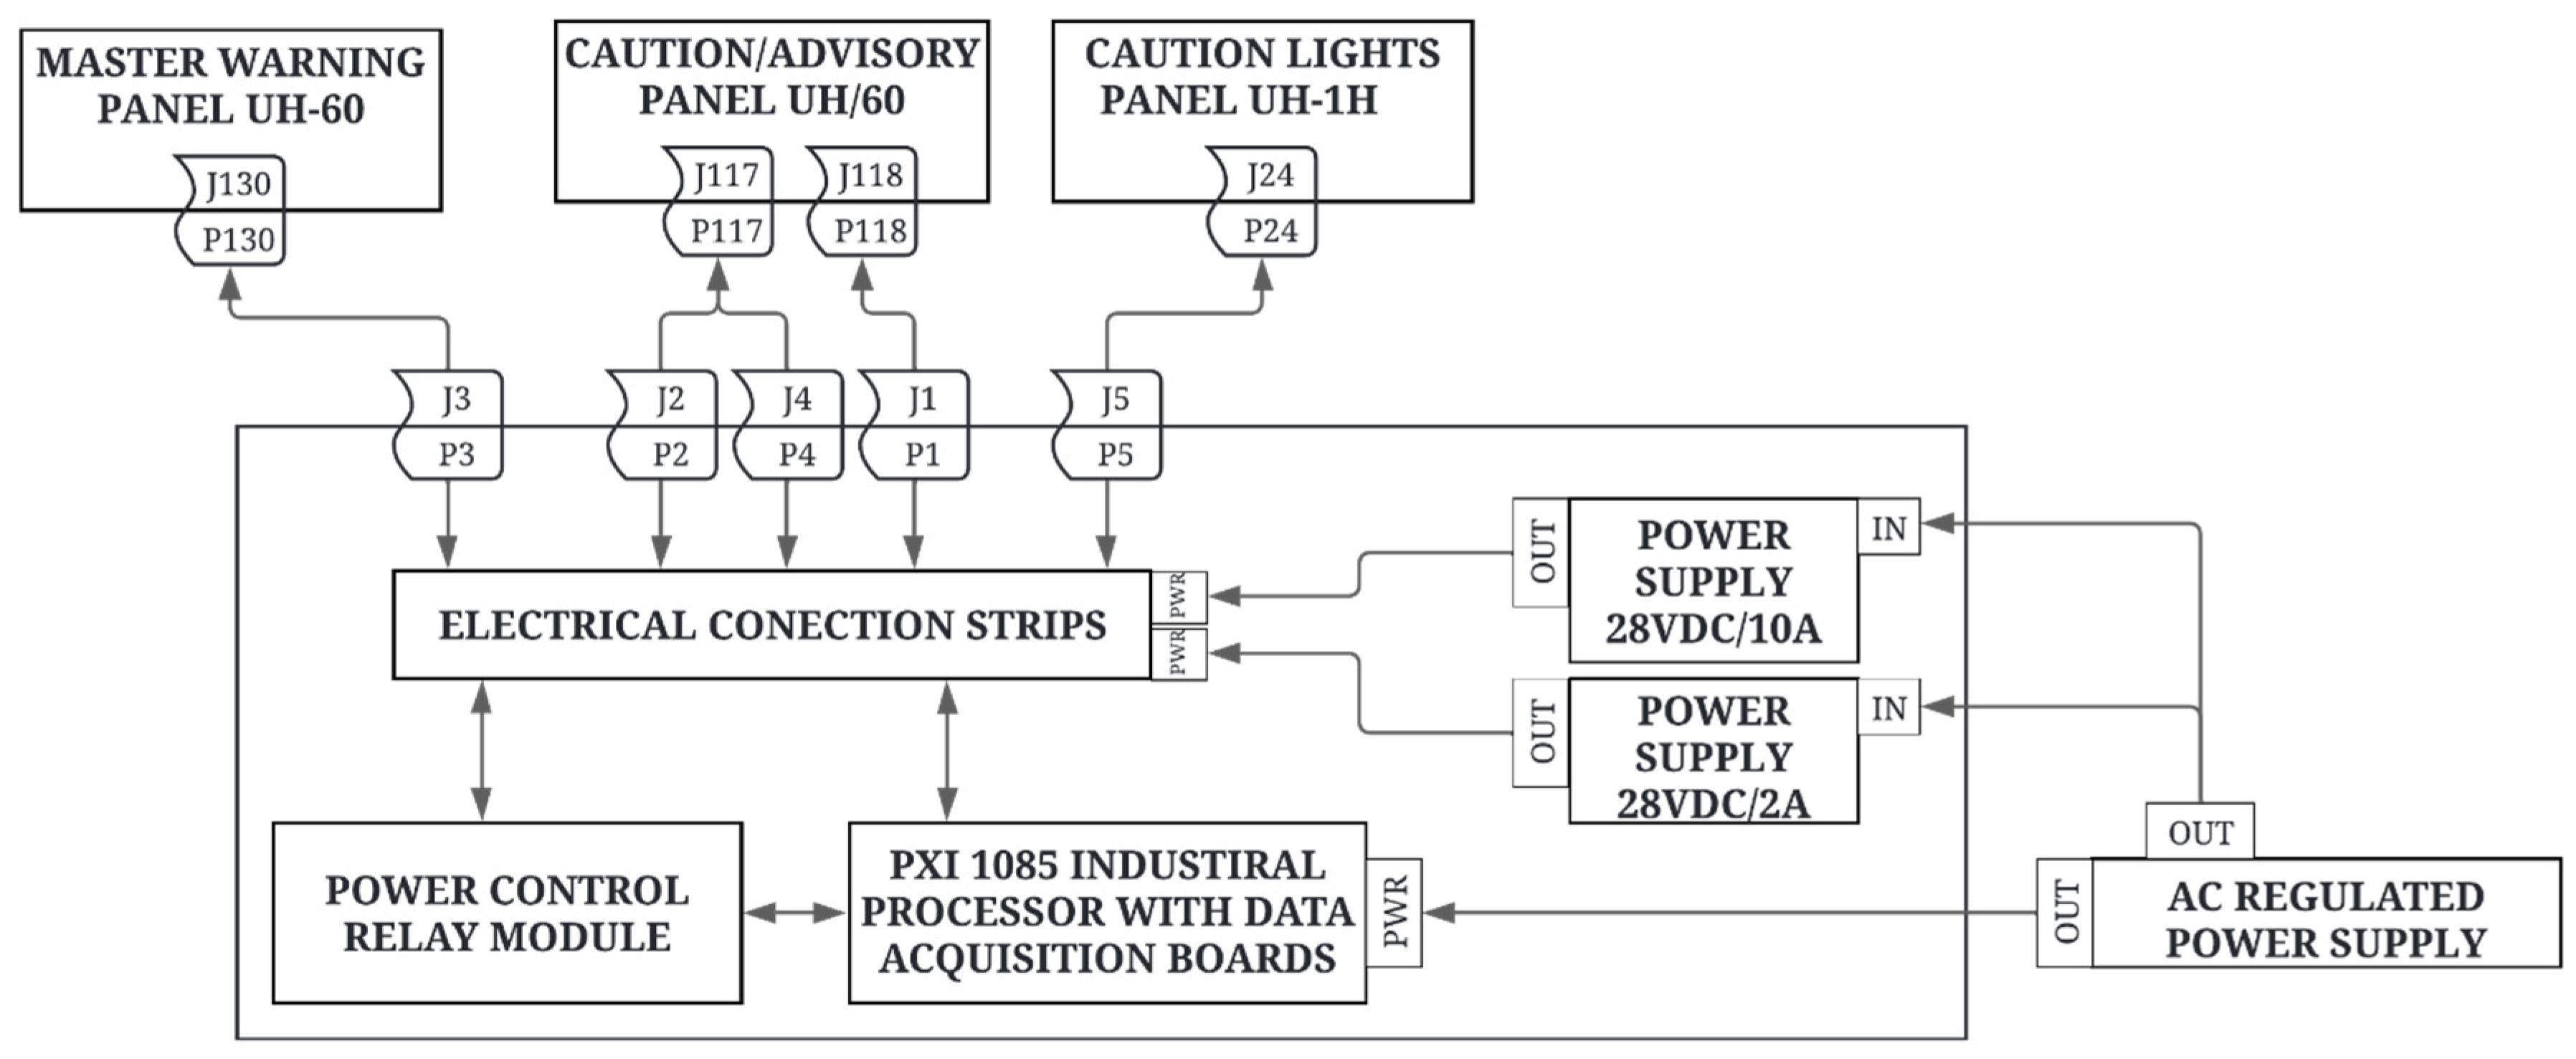
The implementation of the product involved the construction and coding of all system components according to the established technical and design requirements. To begin with, a block diagram was created, shown in Figure 6. The diagram corresponds to a Test and Diagnostic Bench for the UH-60 Warning Panel, specifically designed to evaluate and validate the functionality of the Caution Advisory Panel, the Master Warning Panel, and other associated subsystems on the UH-60 and UH-1H helicopters. The system includes several key components, starting with the main panels: the UH-60 Master Warning Panel, the UH-60 Caution/Advisory Panel, and the UH-1H Caution Light Panel. Each of these panels is connected to the test stand via dedicated connectors, allowing direct and safe integration for testing. The Master Warning Panel is designed to centralize critical warnings that require the pilot’s immediate attention. At the same time, the Caution/Advisory Panel provides information on less urgent but equally important abnormal conditions. The Caution Light Panel on the UH-1H performs similarly on that specific helicopter model.
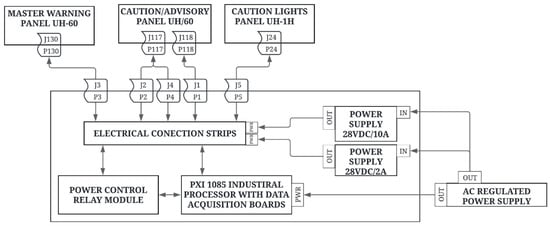
Figure 6.
Block diagram of the UH-60 warning panel test and diagnostic bench. Source: Author.
The electrical connection strips act as the core of the interconnection within the test bench, facilitating the distribution of power and signals between the various modules and panels. These strips ensure that the flow of information and energy is efficient and orderly, guaranteeing that each component receives the correct signals during the testing process. This allows for flexible reconfiguration of electrical architecture in the test bench and evaluation of advanced safety features [42,43].
The test bench also includes a power control relay module, which regulates the power supply to the panels and other components. This module functions as a switch that activates or deactivates power as needed, essential for the safe and controlled execution of tests. Proper power supply management is crucial to prevent damage to sensitive components during testing [44].
At the core of the system is the PXI 1085 Industrial Processor (National Instruments, Austin, TX, USA), integrated with Data Acquisition Boards, which functions as the central processing unit. The PCI eXtension for Instrumentation (PXI) is an extension of the Peripheral Component Interconnect (PCI) specification created to address industry needs for instrumentation and automation, both in terms of performance and reliability. Modularity is a key feature of PXI-based systems, aiming to maximize integrability and ease of use [45]. Beyond its primary function of real-time data acquisition and analysis, this component also plays a critical role in diagnosing potential faults in warning panels. The capability to efficiently acquire and process data is essential for detecting issues that may compromise the helicopter’s operability during actual flight conditions.
The flexibility of the system to adapt to other aeronautical components is obtained through its modular architecture based on a design oriented to independent and scalable components. First of all, the implementation of the PXI platform with configurable acquisition cards allows hardware reconfiguration without affecting the complete system. This modular character favors the interconnection of different aeronautical components (with similar operating principles) by simply adjusting the input/output blocks and signal mapping.
Secondly, at the software level, the interface is developed under modular programming principles in LabVIEW 2017, in which each diagnostic routine is encapsulated as an autonomous module. This feature enables the integration of new test procedures or the adaptation of existing ones through the reuse of control and visualization structures. Likewise, the system makes it possible to load customized test thresholds, defined by the user, and integrate them with other electronic devices of the helicopter without altering the main architecture of the bench.
Lastly, the system design incorporates aeronautical connectors, electrical connection strips, and terminal boards, allowing the scalability of the test bench by adding new physical or logical modules without altering its performance or compromising electrical safety. This expandability has been proven during preliminary tests with UH-1H caution light panels, confirming their flexibility without structural redesign. The block diagram in Figure 6 shows this adaptability feature.
The proposed test bench is equipped with two 28VDC Power Supplies, one with a capacity of 10 amps and another with 2 amps, which provide the necessary power to operate the panels during testing. These power supplies simulate the aircraft’s real operating conditions, allowing for an accurate assessment of the panels’ performance under load. An AC Regulated Power Supply also ensures a stable supply of alternating current, which is then converted to direct current for the required components. This control over the power supply is vital for maintaining system integrity during testing.
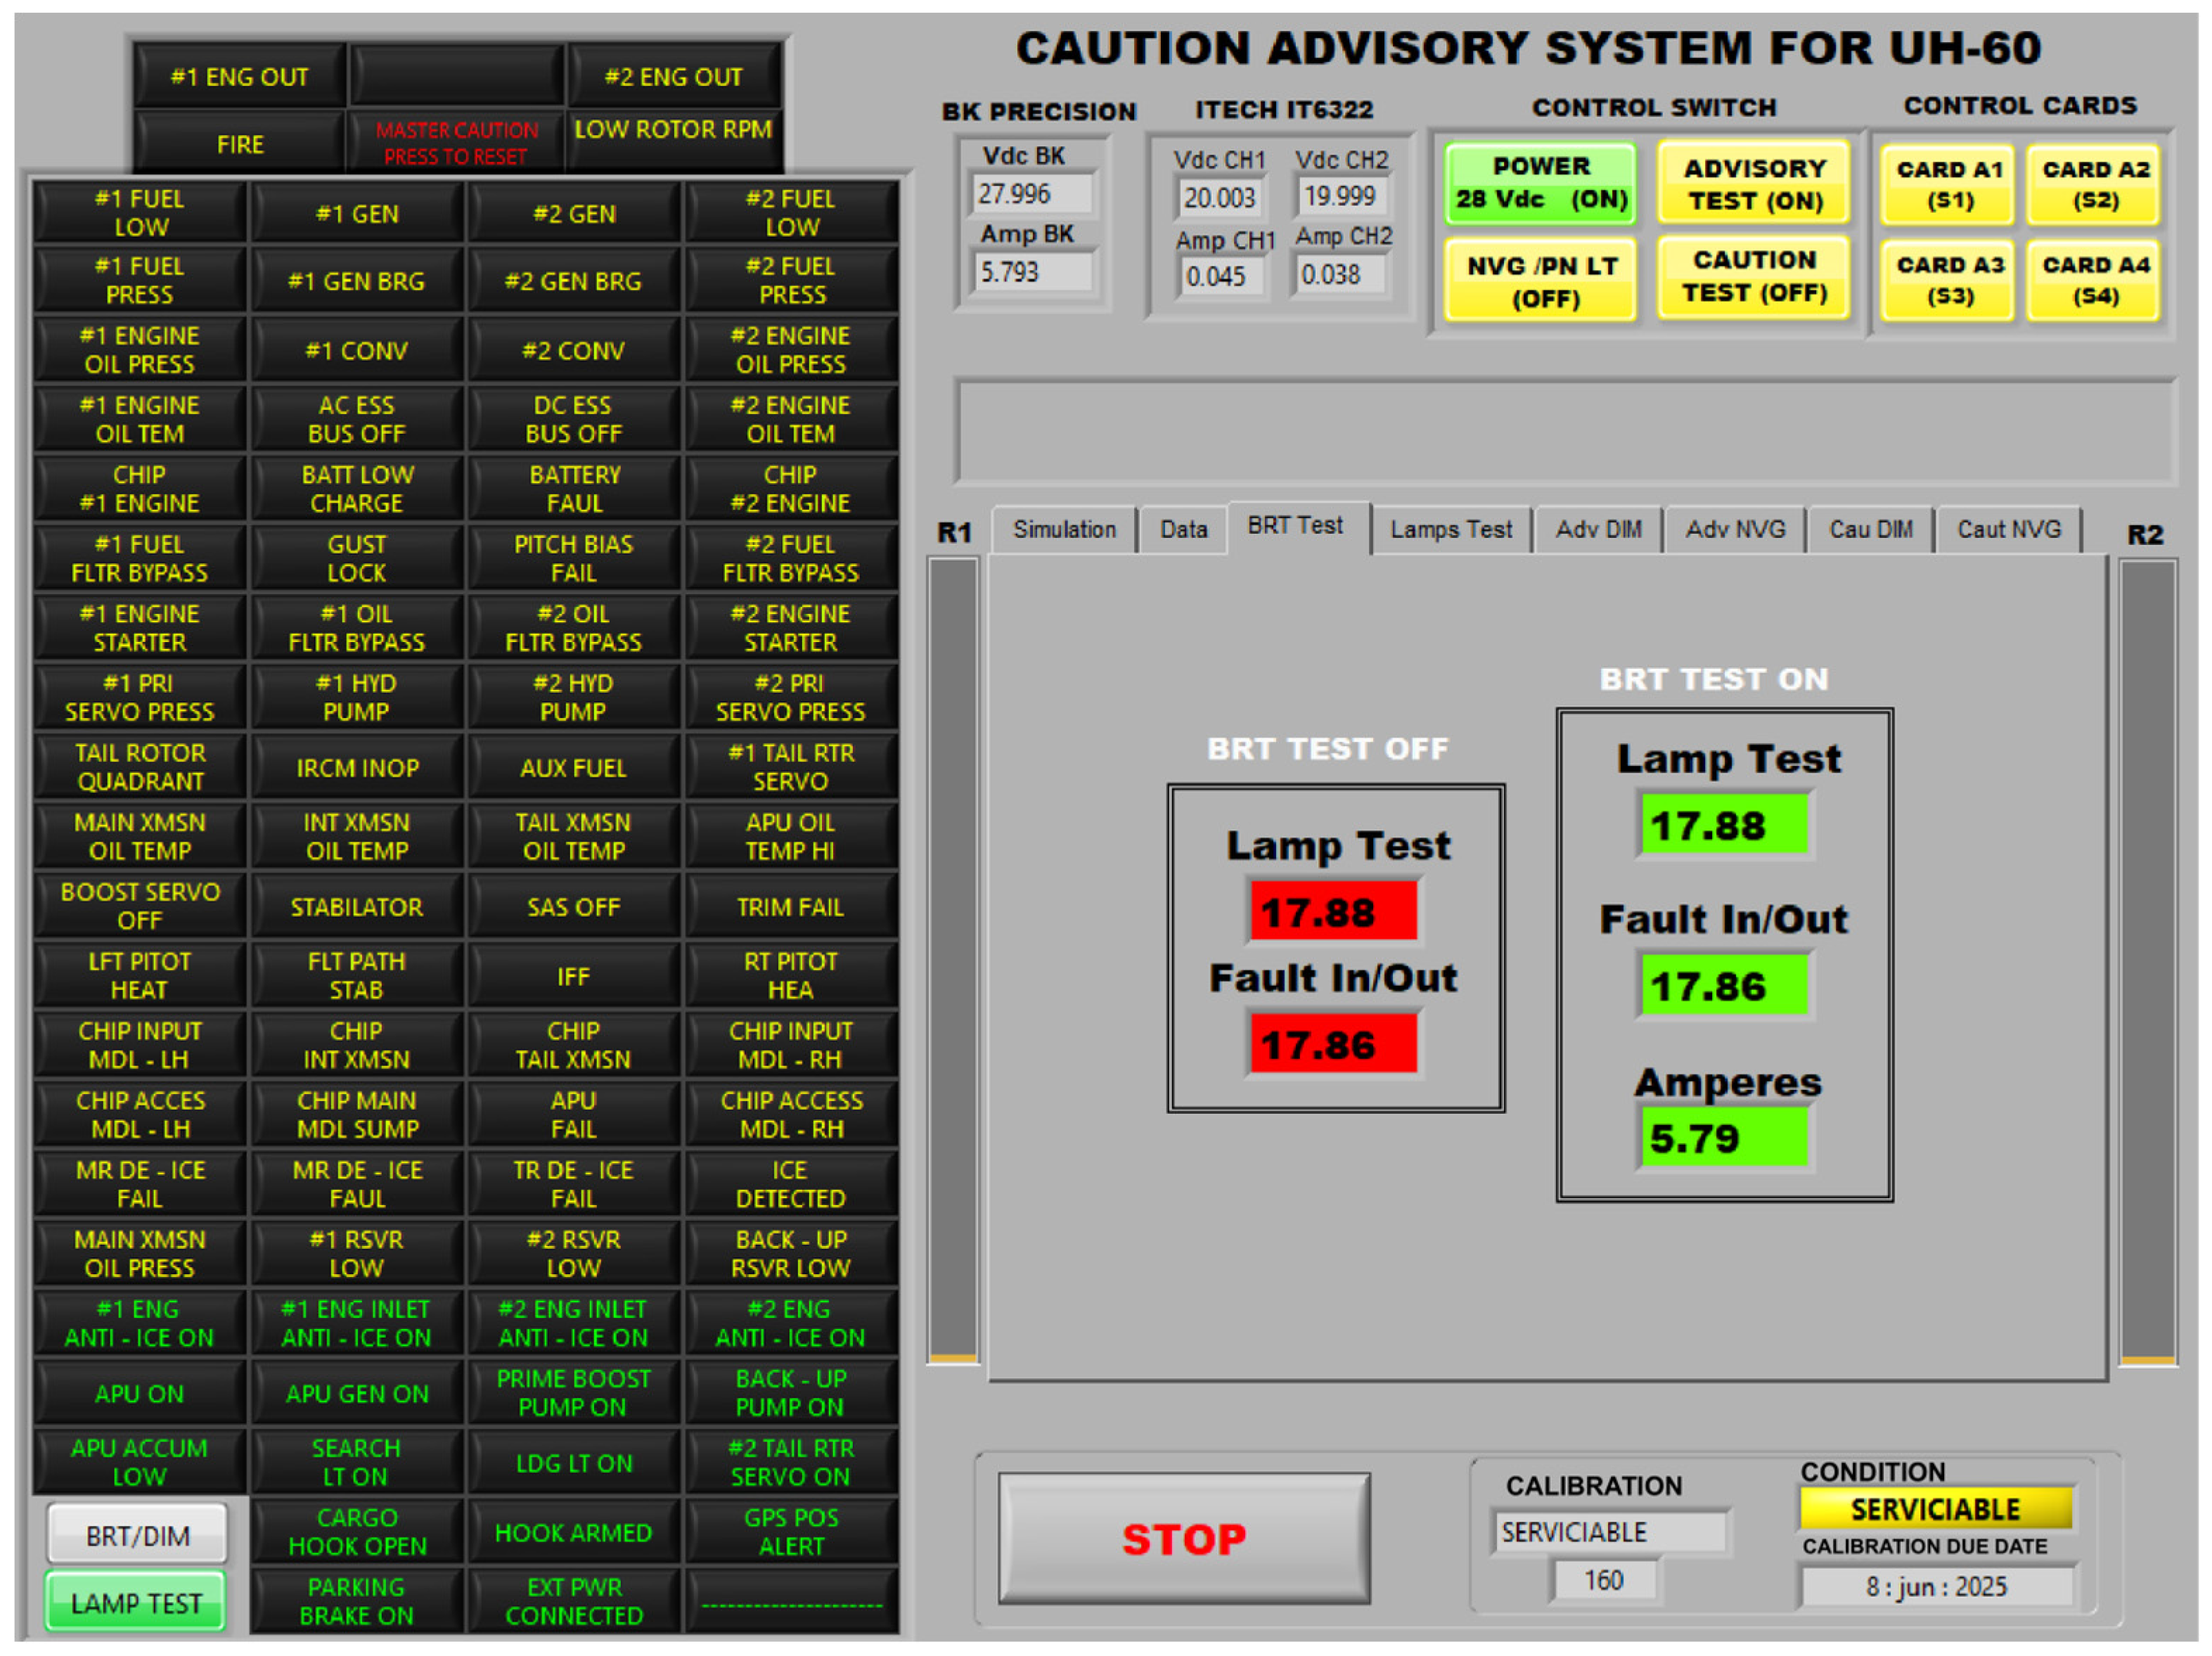
Figure 7 shows the user interface developed in LabVIEW 2017 software for the test bench, which provides programming, monitoring, logging, and a human–machine interface for controlling the process. It is easy to integrate different hardware simultaneously, which exploits LabVIEW’s multitasking and multiprocessing environment to achieve the control objective [46]. The main part of the interface is a panel with a grid of warning lights called capsules. These lights show the status of different systems in the helicopter, like fuel pressure, oil temperature, generator issues, and hydraulic system conditions. Each capsule is clearly labeled with its specific function, making it easy for the operator to quickly identify any abnormal condition being simulated or active during operation. The illumination of these capsules upon activation allows for immediate visualization of potential issues in the system.
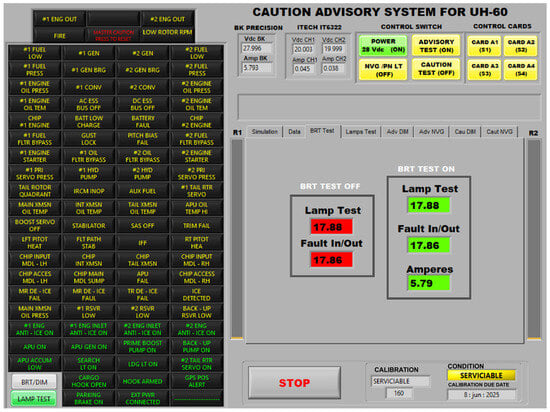
Figure 7.
User interface for the test bench. Source: Author.
In the upper right corner of the interface, a series of control switches allow the operator to turn the power supply on or off and manage the status between real and simulated test modes. The test bench incorporates fault simulation functionality, which allows the injection of predefined fault conditions that replicate actual UH-60 system faults. This feature allows the testing of fault detection mechanisms without needing a direct connection to the aircraft.
The simulation mode is designed to replicate the electrical and logic anomalies found in operating conditions. This is accomplished by monitoring voltage outputs, altering digital logic signals, and simulating command inputs to trigger specific failure modes in the warning system. The system follows predefined test sequences based on failure cases documented in the UH-60 maintenance manuals and real-world failure data collected during aircraft inspections. These predefined tests ensure repeatability and accurate evaluation of failure detection procedures. Consequently, the test bench emulates the behavior of the aircraft warning system using the hardware-in-the-loop approach.
The test bench operates in two main modes:
Stand-alone mode: The system operates independently, emulating the electrical and logic behavior of the UH-60’s Caution and Warning Panels. It generates simulated faults based on stored signal profiles, allowing technicians to analyze system responses under controlled conditions.
Connected Mode: The test bench is linked to the actual UH-60 Caution and Warning Panels components through an electrical connection harness and diagnostic interfaces, capturing real-time component data and validating their functionality in a real environment. This mode ensures seamless integration with aircraft maintenance operations.
Use case scenarios:
Manual test: The operator simulates a fault mode by selecting it through the interface, which causes the system to interrupt the 28 VDC power supply and introduce an out-of-range voltage fluctuation. The caution and warning panel activates a malfunction alert, and the technician verifies the fault diagnosis procedure.
Testing the master caution reset mechanism: A simulated fault is injected into the system, which triggers the master caution reset indicator. The operator resets the warning and confirms whether the system recognizes fault resolution correctly.
Automated Sequential Testing: The automatic test mode executes a predefined sequence of fault injections, evaluates system responses, and records diagnostic data. The software automatically generates a detailed report that informs maintenance personnel about potential fault trends.
Additionally, there are options to activate or deactivate connectors, adjust the interface view, and control audio, adding flexibility in managing the test environment. Next to the warning panel, the interface includes a slider labeled “DIMMER”, which allows the brightness of the warning capsules to be adjusted. This control is particularly useful for simulating variable lighting conditions, such as those encountered during nighttime flights or in low-light environments. The ability to adjust the visibility of the warning lights ensures that technicians can perform accurate tests regardless of the lighting conditions.
In the lower right section of the interface, there is a dedicated area for simulation and data monitoring, where specific technical details about the selected capsule and the condition being tested are presented. This section displays vital information such as the capsule name, the connector used, the operating voltage, and the specific condition of the system under test. These data are crucial for technicians as they allow them to understand in detail the system’s status and the parameters being monitored during the simulation. Finally, the interface includes control buttons that allow technicians to start, stop, or adjust the system’s test status. The ability to control brightness and activate the full system test mode ensures that all warning conditions can be properly simulated and verified. This functionality is essential to ensure that the UH-60 warning system operates correctly and that the aircraft’s operational safety and effectiveness are maintained.
To ensure accessibility for users with different levels of technical skills, the system interface was designed in accordance with the usability principles established by ISO 9241-210 [47], with special attention to operational simplicity and minimization of cognitive load. In addition, an assisted operation mode (wizard mode) was implemented to guide the user during the test procedures, offering contextual guidelines that facilitate its effective application even without previous experience with the system.
The electronic components of the test bench are arranged on a support structure designed to ensure their stability and protection during use. This support structure will feature specific compartments for each component, including slots for data acquisition boards, power supplies, control modules, and other key elements. Additionally, the support structure’s design incorporates modular compartments and quick-release connectors for easy accessibility for maintenance and component replacement, ensuring technicians can quickly remove, inspect, and replace defective components without extensive disassembly, ensuring that the test bench can be operated and upgraded efficiently. The support structure also allows constant ambient airflow to keep overheating the electronic components [48], ensuring optimal performance and extending the equipment’s lifespan. Figure 8 shows the support structure design.
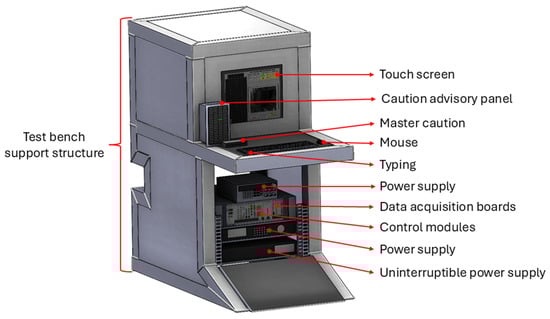
Figure 8.
Support structure for electronic components in the test bench. Source: Author.
4.2. Product Verification and Validation
The validation process of the test bench prototype was provided to the technical operators of the UH-60 maintenance unit, allowing for testing under real operational conditions within the maintenance workshops. The validation process of the UH-60 diagnostic and simulation system was conducted through a comprehensive plan that included field tests, result analysis, and innovation evaluation. Initially, validation tests were performed under real operational conditions at the avionics laboratory of the Army Aviation Brigade N°32, located at the Military Fort of Tolemaida, Colombia. These tests were aimed at evaluating the seamless integration of the system with existing maintenance workflows, correcting possible signal interferences, and verifying the system’s accuracy and efficiency in identifying failures.
The validation process included a population sample of avionics maintenance technicians and maintenance inspectors from Army Aviation. It was conducted over four weeks, with structured test sessions conducted in controlled laboratory environments and simulated real-world maintenance conditions. These allowed the technical staff to make final adjustments and correct signal interferences, ensuring the system’s seamless integration with existing equipment and confirming its accuracy and efficiency in fault identification.
Moreover, based on technical feedback, structured user workshops were conducted to refine the system. These workshops included:
Workshop 1—User interface evaluation: participants interacted with the prototype diagnostic interface, testing different UI layouts and data visualization methods. Feedback was collected to improve usability.
Workshop 2—Fault Injection and Recognition: technicians evaluated the effectiveness of automated fault injection scenarios, ensuring that the system simulated and detected faults correctly according to maintenance manuals.
Workshop 3—Operational testing in maintenance procedures: the system was tested in standard fault diagnosis workflows, comparing automated results with manual diagnostic methods to measure efficiency improvements.
During these sessions, metrics such as time reduction in fault detection, user satisfaction with the system’s usability, and fault identification accuracy were recorded.
Subsequently, a detailed analysis of the results was performed to visualize each warning system’s impedance and voltage values. This was achieved through a systematic experimental procedure involving measuring, comparing, and validating critical parameters under controlled conditions. The verification process was tested under actual operating conditions. The procedure followed the following key steps:
Component selection and configuration: the sample included three Caution and Warning Panels: two in-service conditions and one with known failures. The test bench was preconfigured with signal parameters obtained from technical manuals [26], ensuring the accuracy of the reference measurements.
Measurement of electrical parameters: voltage, resistance, and current values were measured in four operating modes: (i) normal condition (no capsules activated), (ii) maximum brightness mode (all capsules activated), (iii) activation of dimming mode, and (iv) activation of NVG (Night Vision Goggles) mode.
For data acquisition, a measurement system consisting of an NI 5105 data acquisition card (National Instruments, Austin, TX, USA), an 8-channel oscilloscope type, and an NI 4071 card (National Instruments, Austin, TX, USA) configured as a multimeter for voltage measurement. The time measurement was performed using the “Elapse Time” tool of the source code of the developed software, which acts as a stopwatch and starts automatically when the program is executed. This measurement was applied to the automatic test, recording the duration of each test cycle, with results showing an average execution time of 100 to 105 s in automatic mode, compared to 1 to 3 days in manual diagnosis.
Each of these measures was performed following a standardized protocol, ensuring the repeatability of the data and minimizing any possible external interference. Before taking the measurements, a verification and calibration process of the acquisition devices was carried out, guaranteeing the reliability and accuracy of the results obtained. In addition, electrical noise reduction filters were implemented to minimize possible interferences in the recorded signals, and the sampling rate of the NI 5105 card (National Instruments, Austin, TX, USA) was configured to capture high-frequency transient events, which allowed a more detailed analysis of the system response in each of the evaluated conditions.
Table 4 presents the comparative analysis of the electrical parameters measured in different test conditions, highlighting the deviations between good and defective components. Each test scenario was compared with the reference values from the technical manuals. Then, it was identified that, in some of the operational scenarios evaluated, the manufacturer’s technical manual does not provide reference values for certain variables; in these cases, when a preset value was not available, it was documented as “not reference”, since there was no official parameter indicating the expected values under such conditions. This limitation highlights the importance of the present study since it made it possible to generate complementary information to improve the interpretation and validation of the system’s performance in different operational scenarios.
Table 4.
Comparative analysis of signals in the warning system for each operational mode. Source: Author.
Each row in Table 4 corresponds to a specific input and output signal of the caution and warning panel, while the columns represent the following:
- Reference value: nominal voltage values stated in the technical manual of the UH-60 helicopter. When reference value is available;
- Measurements 1–4: experimental data collected from two panels in-service conditions (two measurements each) under a controlled environment;
- Measurement 5: data from a panel with known failure;
- Normal operating means: the arithmetic mean of measurements 1–4, representing the expected average behavior under normal conditions;
- Normal operating range: the difference between the maximum and minimum values recorded between measurements 1–4, indicating signal dispersion;
- Variation vs. reference: the absolute difference between the normal operating mean and the reference value from the technical manual, highlighting possible discrepancies;
- Variation vs. faulty panel: the absolute difference between the normal operating mean and the faulty panel value used to evaluate the sensitivity to faults.
These data facilitate a statistical analysis for accurate interpretation and differentiation between normal and abnormal signal behavior. Based on this analysis, it was necessary to define customized test thresholds, especially when the technical manual does not provide references or discrepancies between theoretical and actual values. The adoption of ±0.5 VDC as an operational tolerance range derives from descriptive statistics applied to in-service components, which guarantee stability and consider variability (standard deviations < 0.05 in most cases). This approach allows for more accurate and repeatable fault identification.
In particular, the faulty panel consistently exhibits voltage deviations outside the ±0.5 VDC range, especially in night vision goggles and dimming mode. For example, the “Master Warning” signal in night vision goggles mode shows an average value of 3.83 VDC under normal conditions. In comparison, the defective panel registers 17.62 VDC, resulting in a +13.79 VDC variation, well above the acceptable range. These statistical deviations indicate critical faults in the circuit, confirming the reliability of the test bench in identifying anomalous behavior. These statistical deviations and significant drops in voltage values indicate critical faults in the system, confirming the reliability of the test bench in identifying failures.
Validation of test customization and operational efficiency: Measured data were compared with the technical manual reference values, allowing the identification of discrepancies where the manufacturer’s documentation lacked real accuracy. Adaptive parameterization [49] was implemented, refining the fault detection criteria based on statistical analysis of signal variations and integrating absolute and relative metrics of dispersion and change [50]. Table 5 presents the detailed statistical analysis for each input and output signal of the caution and warning panels in the system operating modes.
Table 5.
Standard deviation and percentage variation in test conditions. Source: author.
Each row in Table 5 represents a different input and output signal of the caution and warning panel, while the columns are structured as follows:
- Standard deviation normal operation: this value quantifies the dispersion of signal measurements under normal system conditions (measured by measurements 1–4). Low values (<0.02 VDC) confirm high consistency and repeatability;
- Standard deviation vs. reference: measures the deviation of the average signal from the value indicated in the technical manual of the UH-60 helicopter. In several cases, deviations exceeded ±2 VDC, suggesting a possible discrepancy with actual conditions;
- Standard deviation vs. failure condition: evaluate the variability between normal operation and fault condition (Measurement 5). high deviations, up to 5.63 VDC, indicate abnormal signal behavior related to system faults;
- Percent variation vs. reference: This represents the proportional deviation of the observed mean from the UH-60 helicopter technical manual value, providing a normalized perspective of the discrepancy. When the manual lacks a reference value, the variance is recorded as 100%;
- Percentage variation vs. failure condition: Weights the percent change between the normal operating average and the failure condition. Significant deviations (greater than 300% in night vision goggle modes) reflect sensitivity to failure and help identify critical failure indicators.
The detailed analysis of the electrical parameters measured for each warning system demonstrates the stability of normal operation and the drastic variability under fault conditions. This strategy improves the accuracy of fault detection and compensates for the shortcomings of the technical manual.
Finally, using a satisfaction survey, the technicians involved in the population sample evaluated and provided feedback on their experience using the proposed test bench and their perception of its usefulness and effectiveness compared to traditional diagnostic and testing methods. To this end, data were recorded using the metrics listed in Table 6.
Table 6.
Metrics for test bench satisfaction evaluation. Source: Author.
The results obtained throughout the verification and validation process showed that the test bench provides significant advances in key operational areas. These comprise (i) validated automated test sequences in four operating modes; (ii) secure data management through password-protected access and logging; (iii) seamless hardware–software connectivity with acquisition boards and the LabVIEW interface; (iv) demonstrated fault tolerance through consistent detection of deviations greater than ±0.5 VDC; (v) high usability acceptance from an intuitive graphical user interface; and (vi) system adaptability through modular code for use with various configurations of the Caution and Warning Panels.
These findings point to the technological and operational benefits of the developed test bench, especially in improving diagnostic reliability, optimizing procedures, and supporting predictive maintenance strategies.
5. Analysis and Discussion
5.1. Tests
Once the test bench for fault detection and diagnosis of the UH-60 helicopter’s Caution/Advisory Panel and Master Warning Panel was developed, the signal analysis and satisfaction evaluation survey conducted to implement the test bench allowed measuring efficiency, human–system integration, information quality, report satisfaction, and usability.
Respondents were chosen through purposive sampling, focusing on maintenance technicians and inspectors specializing in avionics systems for the UH-60 helicopter in the Army Aviation Brigade N°32. The selection criteria prioritized candidates with (i) certified technical training in UH-60 maintenance, (ii) a minimum of one year of practical experience in avionics troubleshooting, and (iii) operational knowledge of the evaluated caution and warning panels.
To ensure objectivity and reduce bias, participants spanned a wide range of experience levels, from junior technicians to senior inspectors. Selection was conducted without regard to prior experience with the test bench prototype, and participation was voluntary and anonymous in the form of responses. No prior training on expected results was provided, and all tests were conducted under actual avionics laboratory operating conditions without intervention by the researchers.
Regarding efficiency, a significant majority of respondents (60%, n = 22 out of 36) indicated that the use of the test bench significantly reduces the time required for repairs by a “very significant” amount (between 4 and 8 h). This result suggests that the diagnostic system could considerably positively impact reducing repair time, which is a crucial factor for the helicopter’s operability and availability. An additional 40% of respondents (n = 14 out of 36) rated the time reduction as “significant” (between 2 and 4 h), further reinforcing the general perception that the system effectively contributes to optimizing the maintenance process.
In terms of report understandability, the results show a more balanced distribution. Fifty percent of respondents (n = 18 out of 36) found it “easy” to understand the information presented in the diagnostic report delivered by the test bench. In contrast, another 40% (n = 14 out of 36) rated it as “neither easy nor difficult”, indicating that while most did not encounter significant difficulties, there is room for improvement in the clarity or presentation of the information. Only 20% of participants (n = 7 out of 36) rated the comprehension process as “very easy”, suggesting that efforts could be made to make the reports even more accessible to all user levels, possibly through adjustments in the report structure or terminology.
Regarding the quality of information, most of the respondents (80%, n = 29 out of 36) “strongly agree” that the information provided by the report allows them to make effective decisions about repairing the UH-60 caution panel. An additional 20% (n = 7 out of 36) “agree” with this statement, suggesting that the report largely meets expectations regarding the quality and usefulness of the information provided for making critical decisions in the maintenance process.
The results reflect a high level of acceptance regarding satisfaction with the test bench’s digital interface and ergonomic design. Eighty percent of respondents (n = 29 out of 36) reported being “fully satisfied”. In contrast, the remaining 20% (n = 7 out of 36) were “satisfied” with the interface and ergonomic design provided during maintenance work at the test bench. This distribution suggests that the interface and ergonomic design meet user preferences, contributing to a positive operational experience and high acceptance levels.
Concerning usability, the System Usability Scale (SUS) shows an average score of 80.6, which is classified as “acceptable” in usability, with a SUS grade of “A”, according to the interpretation guidelines of [52]. The score reflects positive perceptions of efficiency and user confidence during system operation. No respondents reported an SUS rating below 51 (the threshold for unacceptable usability). These results suggest that, in general, users perceive the test bench design as a system that is easy to adapt to their operating context and intuitive to interact with. The high recognition in all categories indicates that the test bench design meets usability expectations in both technical and ergonomic aspects, with the potential to improve maintenance workflows by reducing user effort and errors.
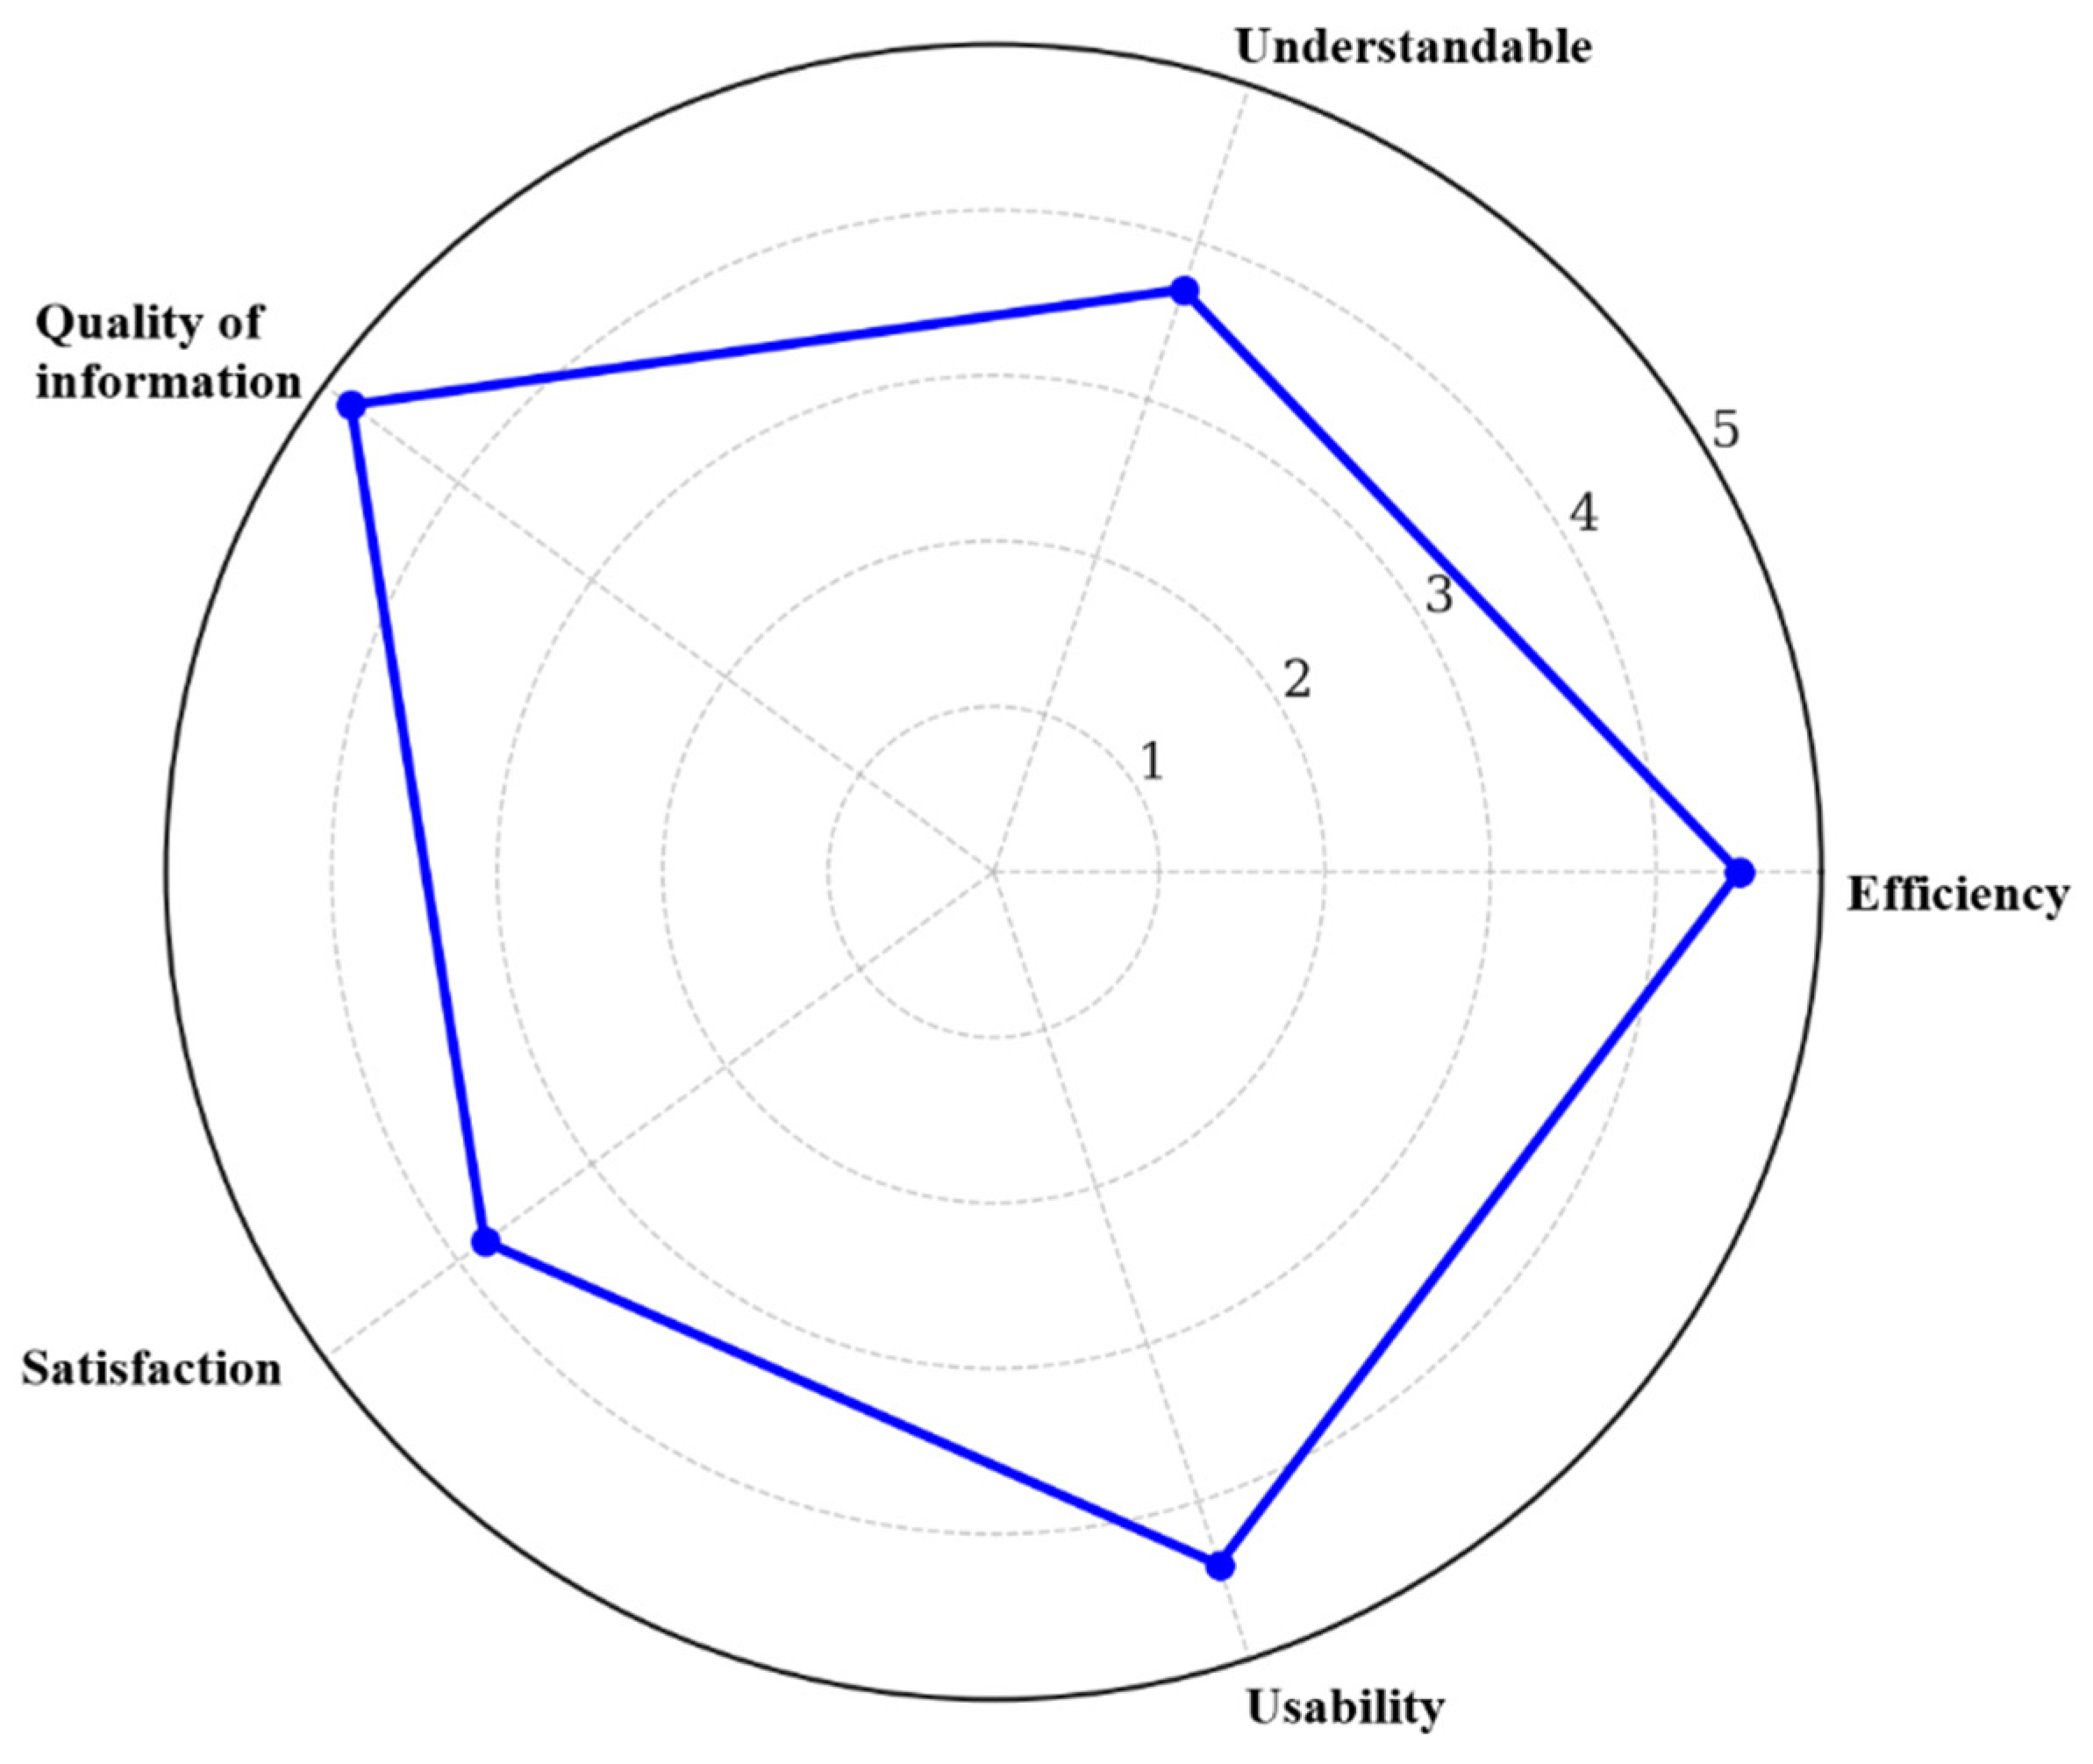
Overall, while the report is generally well-received, there are areas where the user experience could be optimized, and confidence in its regular use increased. Figure 9 graphically represents, on a numerical scale, the perception of the evaluated criteria. It shows that the diagnostic system performs strongly in efficiency, usability, and information quality, with potential improvement areas in satisfaction, particularly in the understandability of the generated reports.
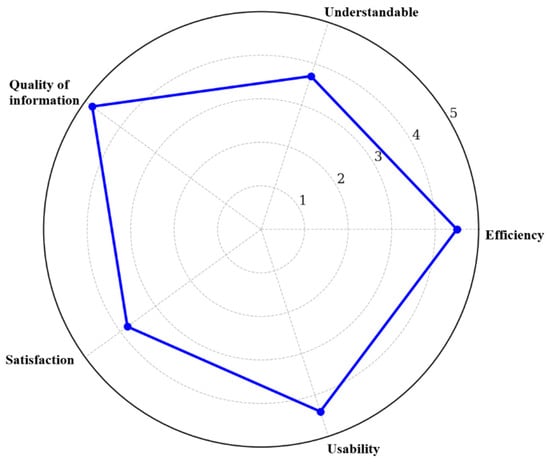
Figure 9.
Graphical Representation of the Evaluated Criteria. The blue line indicates the average user rating on a numerical scale from 1 (lowest perception) to 5 (highest). Source: Prototyping plan [53].
5.2. Cost Analysis
The warning system shows notably high external repair costs, approximately 61.3% of the new component acquisition cost [20]. This substantial increase can be attributed to the need for specialized services, more complex logistics, and prolonged downtime, all of which significantly contribute to the increased cost of repairs outside the usual facilities.
Adopting a new design for the diagnostic process for both panels represent a significant opportunity for cost reduction. This implementation is projected to generate total savings of over 40% compared to current local and external repair costs. These savings are based on the manual diagnostic process that typically requires 1–3 days per unit. In contrast, the automated system completes the same task in approximately 100 to 105 s. This considerable reduction in diagnostic time reduces labor hours. In this sense, these savings not only imply direct economic benefits but also lead to improvements in operational efficiency, reduced downtime, and greater aircraft availability for critical operations.
6. Conclusions
This study presented the design, implementation, and validation of an automated digital test bench for the UH-60 helicopter caution and warning panels. The system was developed using practices based on the NASA systems engineering process, incorporating real-time simulation with closed-loop diagnostics and adaptive threshold detection.
The main findings demonstrate that the automated test bench reduces diagnostic time from 1 to 3 days to an average of 100 s per test cycle. This optimization not only increases aircraft operational availability but also improves maintenance efficiency, reducing aircraft downtime. In addition, 95% accuracy in fault identification was achieved, verified through extensive validation testing. Thus, reliance on technician experience is minimized, and the rate of human errors is reduced.
The system also demonstrated its ability to identify anomalies beyond those documented in the technical manuals and received positive ratings regarding usability, quality of information, and integration with existing maintenance workflows. Its modular architecture favors adaptation to other aircraft systems and facilitates future scalability. The project has also strengthened the maintenance unit’s technological autonomy by reducing dependence on external diagnostic tools. In this way, the development and internal management of the test bench provide the technical staff with specialized knowledge and operational independence in executing advanced maintenance procedures.
On the other hand, this study presents a novel technical reference framework replicable to unscheduled maintenance diagnostics for military and civil aircraft. Specifically, it constitutes the first implementation of a real-time simulated closed-loop test bench adapted to UH-60 avionics panels. Modularity, adaptability, and verified performance in operational contexts highlight its unique contribution to the standardization and rapid response of failure identification activities.
Future research should explore the integration of predictive maintenance modules, artificial intelligence, and augmented reality-based interfaces for technician training. Moreover, experiments are needed to accurately assess the efficiency of the UH-60 helicopter maintenance process and determine the cost reduction following the implementation of the test bench.
In summary, developing and implementing this automated test bench represents an advancement in UH-60 maintenance practices, improving diagnostic accuracy, operational efficiency, and cost-effectiveness. The findings underscore the importance of automation and digitization in aviation maintenance, establishing a scalable and adaptable foundation for future technological innovations in military and civil aviation support operations.
Author Contributions
Conceptualization, C.S.-H.; methodology, C.S.-H., M.L.-V. and Y.D.; software, R.C.; validation, J.R. and E.R.; formal analysis, C.S.-H.; investigation, C.S.-H. and R.C.; resources, J.R. and E.R.; writing—original draft preparation, C.L.; writing—review and editing, C.S.-H., M.L.-V. and Y.D.; visualization, C.S.-H., R.C. and C.L.; supervision, M.L.-V. and Y.D.; project administration, C.S.-H., J.R. and E.R.; funding acquisition, C.S.-H., J.R. and E.R. All authors have read and agreed to the published version of the manuscript.
Funding
This research was funded by the Colombian Army through the internal call for research and scientific development focused on the capabilities required by the force—Agreement 001-2023.
Institutional Review Board Statement
Not applicable.
Informed Consent Statement
Informed consent was obtained from all subjects involved in the study.
Data Availability Statement
The original contributions presented in this study are included in the article. Further inquiries can be directed to the corresponding author.
DURC Statement
Current research is limited to the use of real-time simulation as a cross-cutting approach within applied electronics engineering in aeronautical maintenance, specifically focused on the development of diagnostic and test systems for functional ground verification of caution and warning panels on helicopters. This research benefits both the military and civilian sectors in improving maintenance efficiency, reducing diagnostic time, and increasing aircraft availability. Therefore, it does not pose a threat to public health or national security. Authors acknowledge the dual-use potential of the research involving the airline industry in both military and civilian contexts, including humanitarian disaster missions, aeromedical evacuations, and aircraft operation in austere environments. The authors confirm that all necessary precautions have been taken to prevent potential misuse. As an ethical responsibility, the authors strictly adhere to relevant national and international laws about DURC. Authors advocate for responsible deployment, ethical considerations, regulatory compliance, and transparent reporting to mitigate misuse risks and foster beneficial outcomes.
Acknowledgments
The authors express their gratitude to the Aviation Technology Development Centre—CEDET, the Army Aviation School—ESAVE, the Colombian Army, the Andes University, and the technical and operational team of the Army Aviation Brigade N°32.
Conflicts of Interest
The authors declare no conflicts of interest.
References
- Kinnison, H.A.; Siddiqui, T. Aviation Maintenance Management, 2nd ed.; McGraw-Hill Education: New York, NY, USA, 2013. [Google Scholar]
- Li, R.; Wang, J.; Liao, H.; Huang, N. A new method for reliability allocation of avionics connected via an airborne network. J. Netw. Comput. Appl. 2015, 48, 14–21. [Google Scholar] [CrossRef]
- Raza, A.; Ulansky, V. Through-life maintenance cost of digital avionics. Appl. Sci. 2021, 11, 715. [Google Scholar] [CrossRef]
- Beshears, R. Diagnostics model enhanced maintenance. In Proceedings of the Annual Reliability and Maintainability Symposium (RAMS), Orlando, FL, USA, 28–31 January 2019. [Google Scholar] [CrossRef]
- Barut, S.; Dominguez, N. NDT diagnosis automation: A key to efficient production in the aeronautic industry. In Proceedings of the 19th World Conference on Non-Destructive Testing, Munich, Germany, 13–17 June 2016; Available online: http://ndt.net/?id=19184 (accessed on 18 January 2025).
- Mofokeng, T.; Mativenga, P.T.; Marnewick, A. Analysis of aircraft maintenance processes and cost. Procedia CIRP 2020, 90, 467–472. [Google Scholar] [CrossRef]
- Gunes, T.; Turhan, U.; Acikel, B. An assessment of aircraft maintenance technician competency. Int. J. Aviat. Sci. Technol. 2020, 1, 22–29. [Google Scholar] [CrossRef]
- Gordo, Y.A.M.; Loaiza, C.A.S. Diseño e implementación de un dispositivo para pruebas de un actuador electro hidráulico mecánico del AFCS del helicóptero UH-60. Ing. Reg. 2008, 5, 81–89. [Google Scholar] [CrossRef]
- AeroTrain Corp. AeroTrain Maintenance and Training Solutions. Available online: http://aerotrain.aero/page-products (accessed on 19 January 2025).
- Wang, H.; Durak, U.; Hartmann, S. Design and development of research aviation training device. In Proceedings of the ASIM 2018 Conference, Heilbronn, Germany, 8–9 March 2018; Available online: https://www.researchgate.net/publication/324114955_Design_and_Development_of_Research_Aviation_Training_Device (accessed on 19 January 2025).
- Laguna Benet, G. Test Bench Design for Smart Cooling Device and Implementation in LabVIEW. Bachelor’s Thesis, Universitat de Lleida, Cataluña, Spain, 2017. Available online: https://recercat.cat/handle/10459.1/60167 (accessed on 19 January 2025).
- Patterson-Hine, A.; Hindson, W.; Sanderfer, D.; Deb, S. A model-based health monitoring and diagnostic system for the UH-60 helicopter. In Proceedings of the AHS 57th Annual Forum, Washington, DC, USA, 9–11 May 2001. [Google Scholar]
- Cabrera-Arias, C.A.; Garay-Rairan, F.S.; Contreras-Gutiérrez, D.C.; Gómez-Vargas, O.E. Modelo para el desarrollo de proyetos de innovación en tecnología para la aviación: Caso de estudio banco de pruebas digital para las pruebas caza fallas de la GCU1. Rev. Esc. Adm. Neg. 2021, 89, 235–256. [Google Scholar] [CrossRef]
- Radaei, M. Mathematical Programming for Optimization of Integrated Modular Avionics; SAE Technical Papers Series; SAE International: Warrendale, PA, USA, 2021. [Google Scholar] [CrossRef]
- Madhava, G.; Mohan, T.M.; Chakraborty, S.; Nama, N. An approach to develop a remotely operated integrated avionics test suit. INCOSE Int. Symp. 2016, 26, 264–275. [Google Scholar] [CrossRef]
- He, M.; He, J.; Scherer, S. Model-based real-time robust controller for a small helicopter. Mech. Syst. Signal Process. 2021, 146, 107022. [Google Scholar] [CrossRef]
- Qi, G.; Huang, D. Modeling and dynamical analysis of a small-scale unmanned helicopter. Nonlinear Dyn. 2019, 98, 2131–2145. [Google Scholar] [CrossRef]
- D’Souza, M.; Kashi, R.N. Avionics self-adaptive software: Towards formal verification and validation. In Lecture Notes in Computer Science; Springer: Cham, Switzerland, 2019; Volume 11319, pp. 3–23. [Google Scholar] [CrossRef]
- Annighoefer, B.; Roeseler, C.; Neumann, S.; Garmann, B.; Schaefer, M. The adaptive avionics platform. IEEE Aerosp. Electron. Syst. Mag. 2019, 34, 6–17. [Google Scholar] [CrossRef]
- Mu, X.; Li, G.; Yu, Y. Advanced helicopter cockpit ergonomic design concepts. In Complex Systems Design & Management; Springer: Cham, Switzerland, 2021; pp. 121–131. [Google Scholar] [CrossRef]
- División de Aviación Asalto Aéreo del Ejército Nacional de Colombia. Datos Estadísticos de Reparaciones del Caution Warning Panel Obtenidos del Sistema ERP SAP en el Período Comprendido Entre el 2020–2024; DAVAA: Bogotá, Colombia, 2024. [Google Scholar]
- Gemünden, H.G.; Lehner, P.; Kock, A. The project-oriented organization and its contribution to innovation. Int. J. Proj. Manag. 2018, 36, 147–160. [Google Scholar] [CrossRef]
- Hamid, S.S.; Nasir, M.H.N.M.; Sahibuddin, S.; Nor, M.K.M. Managing software projects with team software process (TSP). In Enterprise Resource Planning: Concepts, Methodologies, Tools, and Applications; IGI Global: Hershey, PA, USA, 2013; Volumes 1–3, pp. 84–117. [Google Scholar] [CrossRef]
- Jones, C. Software Methodologies: A Quantitative Guide, 1st ed.; CRC Press Taylor & Francis Group: Boca Raton, FL, USA, 2017. [Google Scholar] [CrossRef]
- O’Regan, G. Software process improvement. In Concise Guide to Software Engineering; Springer: Cham, Switzerland, 2017; pp. 239–254. [Google Scholar] [CrossRef]
- US Army. TM 1-1520-237-23&P Interactive Electronic Technical Manual for Field Maintenance Manual for Army Model Helicopters UH-60A, UH-60L, EH-60A, HH-60A, and HH-60L, Including Parts Information (EM 0013); Rev. 09; Department of the Army: Washington, DC, USA, 2017. [Google Scholar]
- Karasubasi, M.; Koktas, Y.; Sagirkaya, H. Model-based testing of aircraft interfaces. In Proceedings of the AUTOTESTCON 2022, National Harbor, MD, USA, 29 August 2022. [Google Scholar] [CrossRef]
- Song, Z. The Test and Launch Control Technology for Launch Vehicles, 1st ed.; Springer: Singapore, 2018. [Google Scholar] [CrossRef]
- Mirzaeian, M.; Langridge, S. Creating a virtual test bed using a dynamic engine model with integrated controls to support in-the-loop hardware and software optimization and calibration. Energies 2021, 14, 652. [Google Scholar] [CrossRef]
- Larios, D.F.; Barbancho, J.; Biscarri, F.; Monedero, I. A research study for the design of a portable and configurable ground test system for the A400M aircraft. Int. J. Aerosp. Eng. 2019, 2019, 5167575. [Google Scholar] [CrossRef]
- National Aeronautics and Space Administration (NASA). NASA Systems Engineering Handbook; NASA/SP-2007-6105 Rev1; NASA: Washington, DC, USA, 2016. Available online: https://ntrs.nasa.gov/search.jsp?R=20170001761 (accessed on 22 January 2025).
- Honour, E. Systems engineering return on investment. INCOSE Int. Symp. 2010, 20, 1422–1439. [Google Scholar] [CrossRef]
- International Council on Systems Engineering (INCOSE). Systems Engineering Handbook: A Guide for System Life Cycle Process and Activities, 4th ed.; INCOSE: San Diego, CA, USA, 2015; Available online: https://www.researchgate.net/publication/280570921 (accessed on 22 January 2025).
- Schön, E.M.; Thomaschewski, J.; Escalona, M.J. Agile requirements engineering: A systematic literature review. Comput. Stand. Interfaces 2017, 49, 79–91. [Google Scholar] [CrossRef]
- Dalpiaz, F.; Brinkkemper, S. Agile requirements engineering: From user stories to software architectures. In Proceedings of the IEEE International Conference on Requirements Engineering, Notre Dame, IN, USA, 16–20 August 2021; pp. 504–505. [Google Scholar] [CrossRef]
- Mumtaz, M.; Ahmad, N.; Ashraf, M.U.; Alghamdi, A.M.; Bahaddad, A.A.; Almarhabi, K.A. Iteration causes, impact, and timing in software development lifecycle: An SLR. IEEE Access 2022, 10, 65355–65375. [Google Scholar] [CrossRef]
- Kooli, M.; Kaddachi, F.; Di Natale, G.; Bosio, A.; Benoit, P.; Torres, L. Computing reliability: On the differences between sofware testing and software fault injection techniques. Microprocess. Microsyst. 2017, 50, 102–112. [Google Scholar] [CrossRef]
- Zhang, H.; Liu, W.; Xiong, H.; Dong, X. Analyzing data flow diagrams by combination of formal methods and visualization techniques. J. Vis. Lang. Comput. 2018, 48, 41–51. [Google Scholar] [CrossRef]
- Napolitano, E.V.; Masciari, E.; Ordonez, C. Integrating flow and structure in diagrams for data science. In Proceedings of the 2024 IEEE International Conference on Big Data (BigData), Washington, DC, USA, 15–18 December 2024; pp. 5769–5774. [Google Scholar] [CrossRef]
- Lanzotti, F.G.; Di Gironimo, G.; Korzeniowska, J.; Imbriani, V.; Mazzone, G.; You, J.H.; Marzullo, D. Systems engineering procedure for requirements management of divertor system of tokamak reactors. Fusion Eng. Des. 2023, 194, 113917. [Google Scholar] [CrossRef]
- Smagin, D.I.; Savelev, R.S.; Satin, A.A. Methods for the design of modern on-board systems of advanced aircraft. In Proceedings of the 2019 IEEE 10th International Conference on Mechanical and Aerospace Engineering (ICMAE), Brussels, Belgium, 22–25 July 2019; pp. 97–101. [Google Scholar] [CrossRef]
- Potthoff, N.; Feismann, T.; Denkelmann, R.; Kiffmeier, M.; Ruebartsch, M.; Frei, S. Optimization of power and signal distribu-tion systems for advanced safety features. In Proceedings of the AmE 2020—Automotive meets Electronics, Dortmund, Germany, 10–11 March 2020. [Google Scholar]
- Bester, J.E.; Mpanda, A.; Polfliet, N.; Van Den Keybus, J.; Hazemeyer, G.M. Design of an electrical distribution test rig for validation of equipment for more electrical aircraft. In Proceedings of the 2013 15th European Conference on Power Electronics and Applications (EPE), Lille, France, 2–6 September 2013. [Google Scholar] [CrossRef]
- Al-Roomi, A.R. Fundamentals of power system protection. In Optimal Coordination of Power Protective Devices with Illustrative Examples; Wiley: Hoboken, NJ, USA, 2021; pp. 57–77. [Google Scholar] [CrossRef]
- Dello Sterpaio, L.; Nannipieri, P.; Marino, A.; Fanucci, L. Design of a spacewire/spacefibre EGSE system based on PXI-industry standard. In Proceedings of the 2019 IEEE International Workshop on Metrology for Aerospace (MetroAeroSpace), Turin, Italy, 19–21 June 2019; pp. 22–26. [Google Scholar] [CrossRef]
- Nerkar, S.S. Temperature control using PLC and LabVIEW integration. Int. J. Futur. Revolut. Comput. Sci. Commun. Eng. 2018, 4, 325–330. Available online: http://www.ijfrcsce.org (accessed on 8 February 2025).
- ISO 9241-210:2019; Ergonomics of Human-System Interaction—Part 210: Human-Centred Design for Interactive Systems. International Organization for Standardization: Geneva, Switzerland, 2019.
- Huang, D.; Yang, C.; Li, B. Rack-level cooling and server-level cooling. In Data Center Handbook: Plan, Design, Build, and Opera-tions of a Smart Data Center; Wiley: Hoboken, NJ, USA, 2021; pp. 227–237. [Google Scholar] [CrossRef]
- Santos, A.S.; Madureira, A.M.; Varela, L.R. A self-parametrization framework for meta-heuristics. Mathematics 2022, 10, 475. [Google Scholar] [CrossRef]
- Mayorga-Ponce, R.B.; Reyes-Torres, S.B.; Baltazar-Téllez, R.M.; Martínez-Alamilla, A. Medidas de dispersión. Educ. Y Salud Boletín Científico Inst. De Cienc. De La Salud Univ. Autónoma Del Estado De Hidalgo 2021, 9, 77–79. [Google Scholar] [CrossRef]
- Brooke, J. SUS: A quick and dirty usability scale. In Usability Evaluation in Industry, 1st ed.; Taylor & Francis Group: London, UK, 1996; pp. 207–212. [Google Scholar] [CrossRef]
- Sauro, J. Measuring Usability with the System Usability Scale (SUS)—MeasuringU. Available online: https://measuringu.com/sus/ (accessed on 6 April 2025).
- Brigada de Aviación Ejército No. 32. Plan De Prototipado: Mejoramiento Del Proceso De Mantenimiento Del Panel De Precaución Y Advertencia De Los Helicópteros Uh-60 Series, Por Medio De Una Solución Tecnológica; Ejército Nacional de Colombia: Nilo, Colombia, 2024. [Google Scholar]

Disclaimer/Publisher’s Note: The statements, opinions and data contained in all publications are solely those of the individual author(s) and contributor(s) and not of MDPI and/or the editor(s). MDPI and/or the editor(s) disclaim responsibility for any injury to people or property resulting from any ideas, methods, instructions or products referred to in the content. |
© 2025 by the authors. Licensee MDPI, Basel, Switzerland. This article is an open access article distributed under the terms and conditions of the Creative Commons Attribution (CC BY) license (https://creativecommons.org/licenses/by/4.0/).