
A Quali-Quantitative Analysis Model Integrating Fuzzy Analytical Hierarchy Process and Cost–Benefit Analysis for Optimizing KPI Implementation: Insights from a Practical Case Study Application


Abstract
1. Introduction
- RQ1: How can qualitative and quantitative aspects of KPI selection be integrated through FAHP and CBA in constrained industrial environments?
- RQ2: What benefits does this integrated approach offer over traditional, single-method approaches?
2. Literature Review
The Need for an Integrated Models
3. Methodology
3.1. Cost–Benefit Analysis
- To determine the viability of an investment project, assessing whether it constitutes a sound investment.
- To compare multiple competing investment projects, identifying the most feasible option.
- Scope Definition: Clearly outline the scope, objectives, and time frame of the project or decision to be evaluated. This step sets the foundation for the analysis by establishing what is being assessed and over what period.
- Alternatives Identification: Consider all viable alternatives (including the “do nothing” option) to ensure that the best course of action is chosen. This step involves exploring different approaches or projects that could meet the same objectives.
- Cost and Benefit Identification: List all potential costs (e.g., capital, operational, maintenance) and benefits (e.g., revenue generation, social or environmental improvements) associated with each alternative. Note that in this step it is important to consider both direct and indirect impacts of all alternatives.
- Monetization: Convert all identified costs and benefits into monetary terms, typically using a common unit (e.g., local currency). This often includes discounting future values to present values, to account for the time value of money.
- 5.
- Alternative Comparison: In this step, metrics like Net Present Value (NPV) and Benefit–Cost Ratio (BCR) are used to assess the financial viability of the project. NPV measures the difference between discounted benefits and costs, while BCR compares the benefits to the costs as a ratio.
- 6.
- Sensitivity Analysis: Perform sensitivity analysis to account for uncertainties in the data or assumptions, allowing decision-makers to see how changes in key variables (e.g., discount rates or cost estimates) affect the outcomes.
- •
- Net Present Value (NPV): This metric calculates the difference between the present value of a project’s cash inflows and outflows, using a discount rate to account for the time value of money.
- •
- Benefit–Cost Ratio (BCR): BCR compares the present value of total benefits to total costs.
- •
- BCR < 1.0: In this case, the project’s costs outweigh its benefits, indicating that the project is not economically viable. Consequently, the project should be rejected based on this result.
- •
- BCR = 1.0: Here, the costs and benefits are equal, implying that the alternative is marginally viable. While in this case the alternative may be implemented, one should do so with caution, as the potential for economic success is limited.
- •
- BCR > 1.0: In this case, the benefits exceed the costs, signifying that the alternative is indeed economically favorable and should be allowed to proceed.
- •
- Internal Rate of Return (IRR): IRR calculates the discount rate that brings a project’s NPV to zero, effectively representing the expected rate of return as a percentage. A project is generally considered acceptable if its IRR exceeds the required rate of return or cost of capital.
3.2. Fuzzy Analytic Hierarchy Process
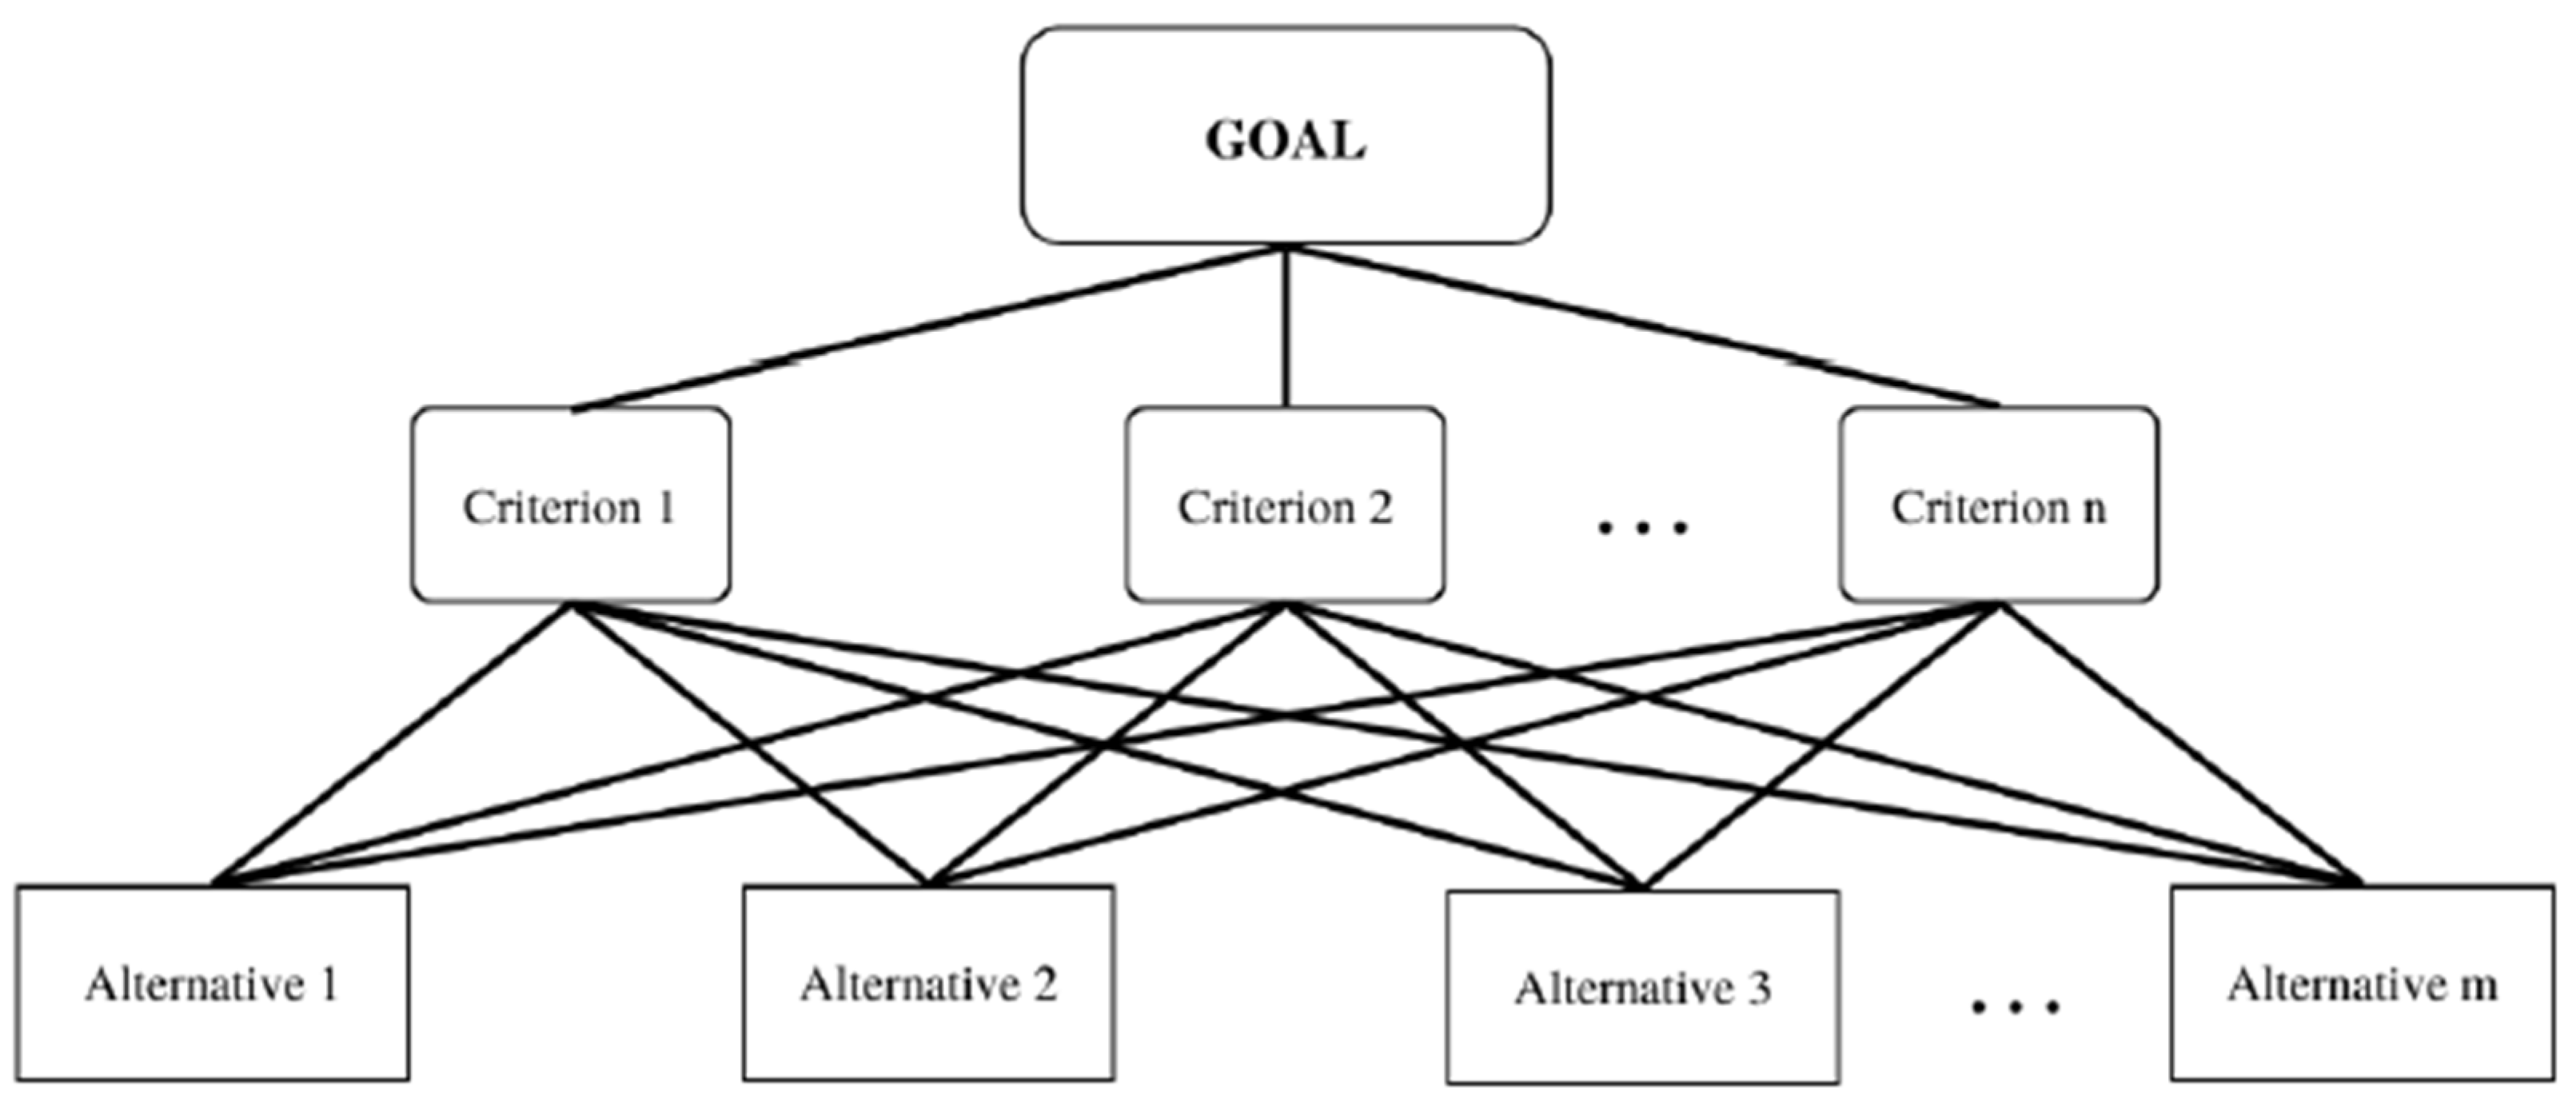
- Goal: The main objective or problem to be solved.
- Criteria: The factors or criteria that will influence the decision.
- Alternatives: The different options or solutions being considered.
- Hierarchical Structuring of the Problem: Like AHP, the first step in FAHP is to structure the decision problem into a hierarchy, such as the one in Figure 1. The top level represents the overall goal, the intermediate levels represent the criteria and sub-criteria, and the bottom level represents the alternatives to be evaluated.
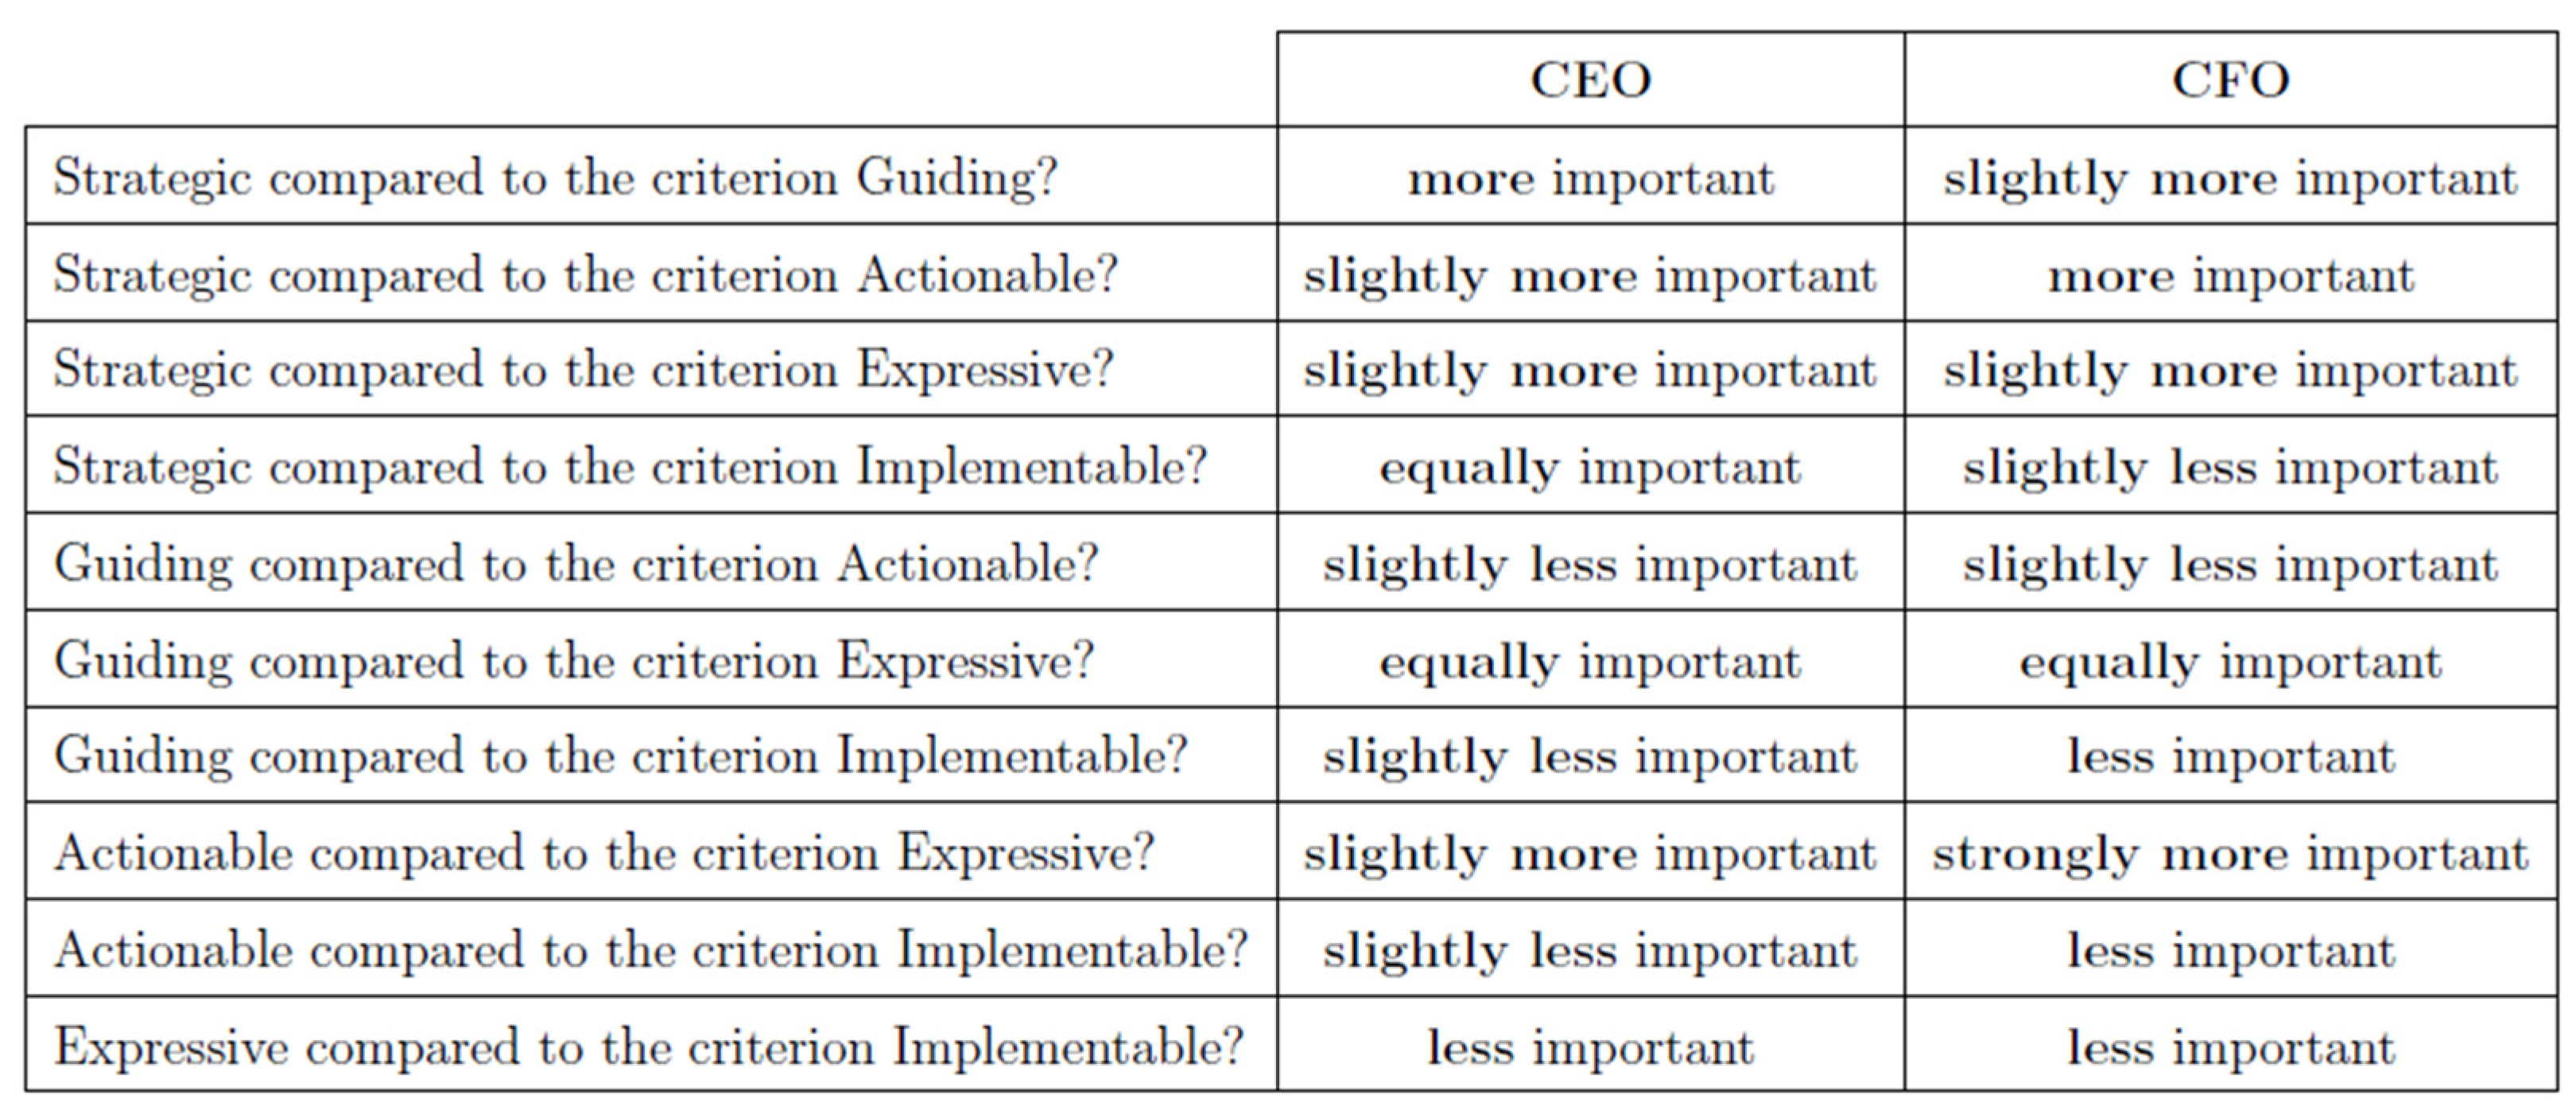
- Fuzzy Pairwise Comparisons: Once the hierarchy is defined, the decision-makers perform pairwise comparisons of the criteria and alternatives in order to evaluate the relative importance of the elements in the hierarchical structure:
- Criteria: “In order to achieve the goal, how important is the criterion i compared to the criterion j?”
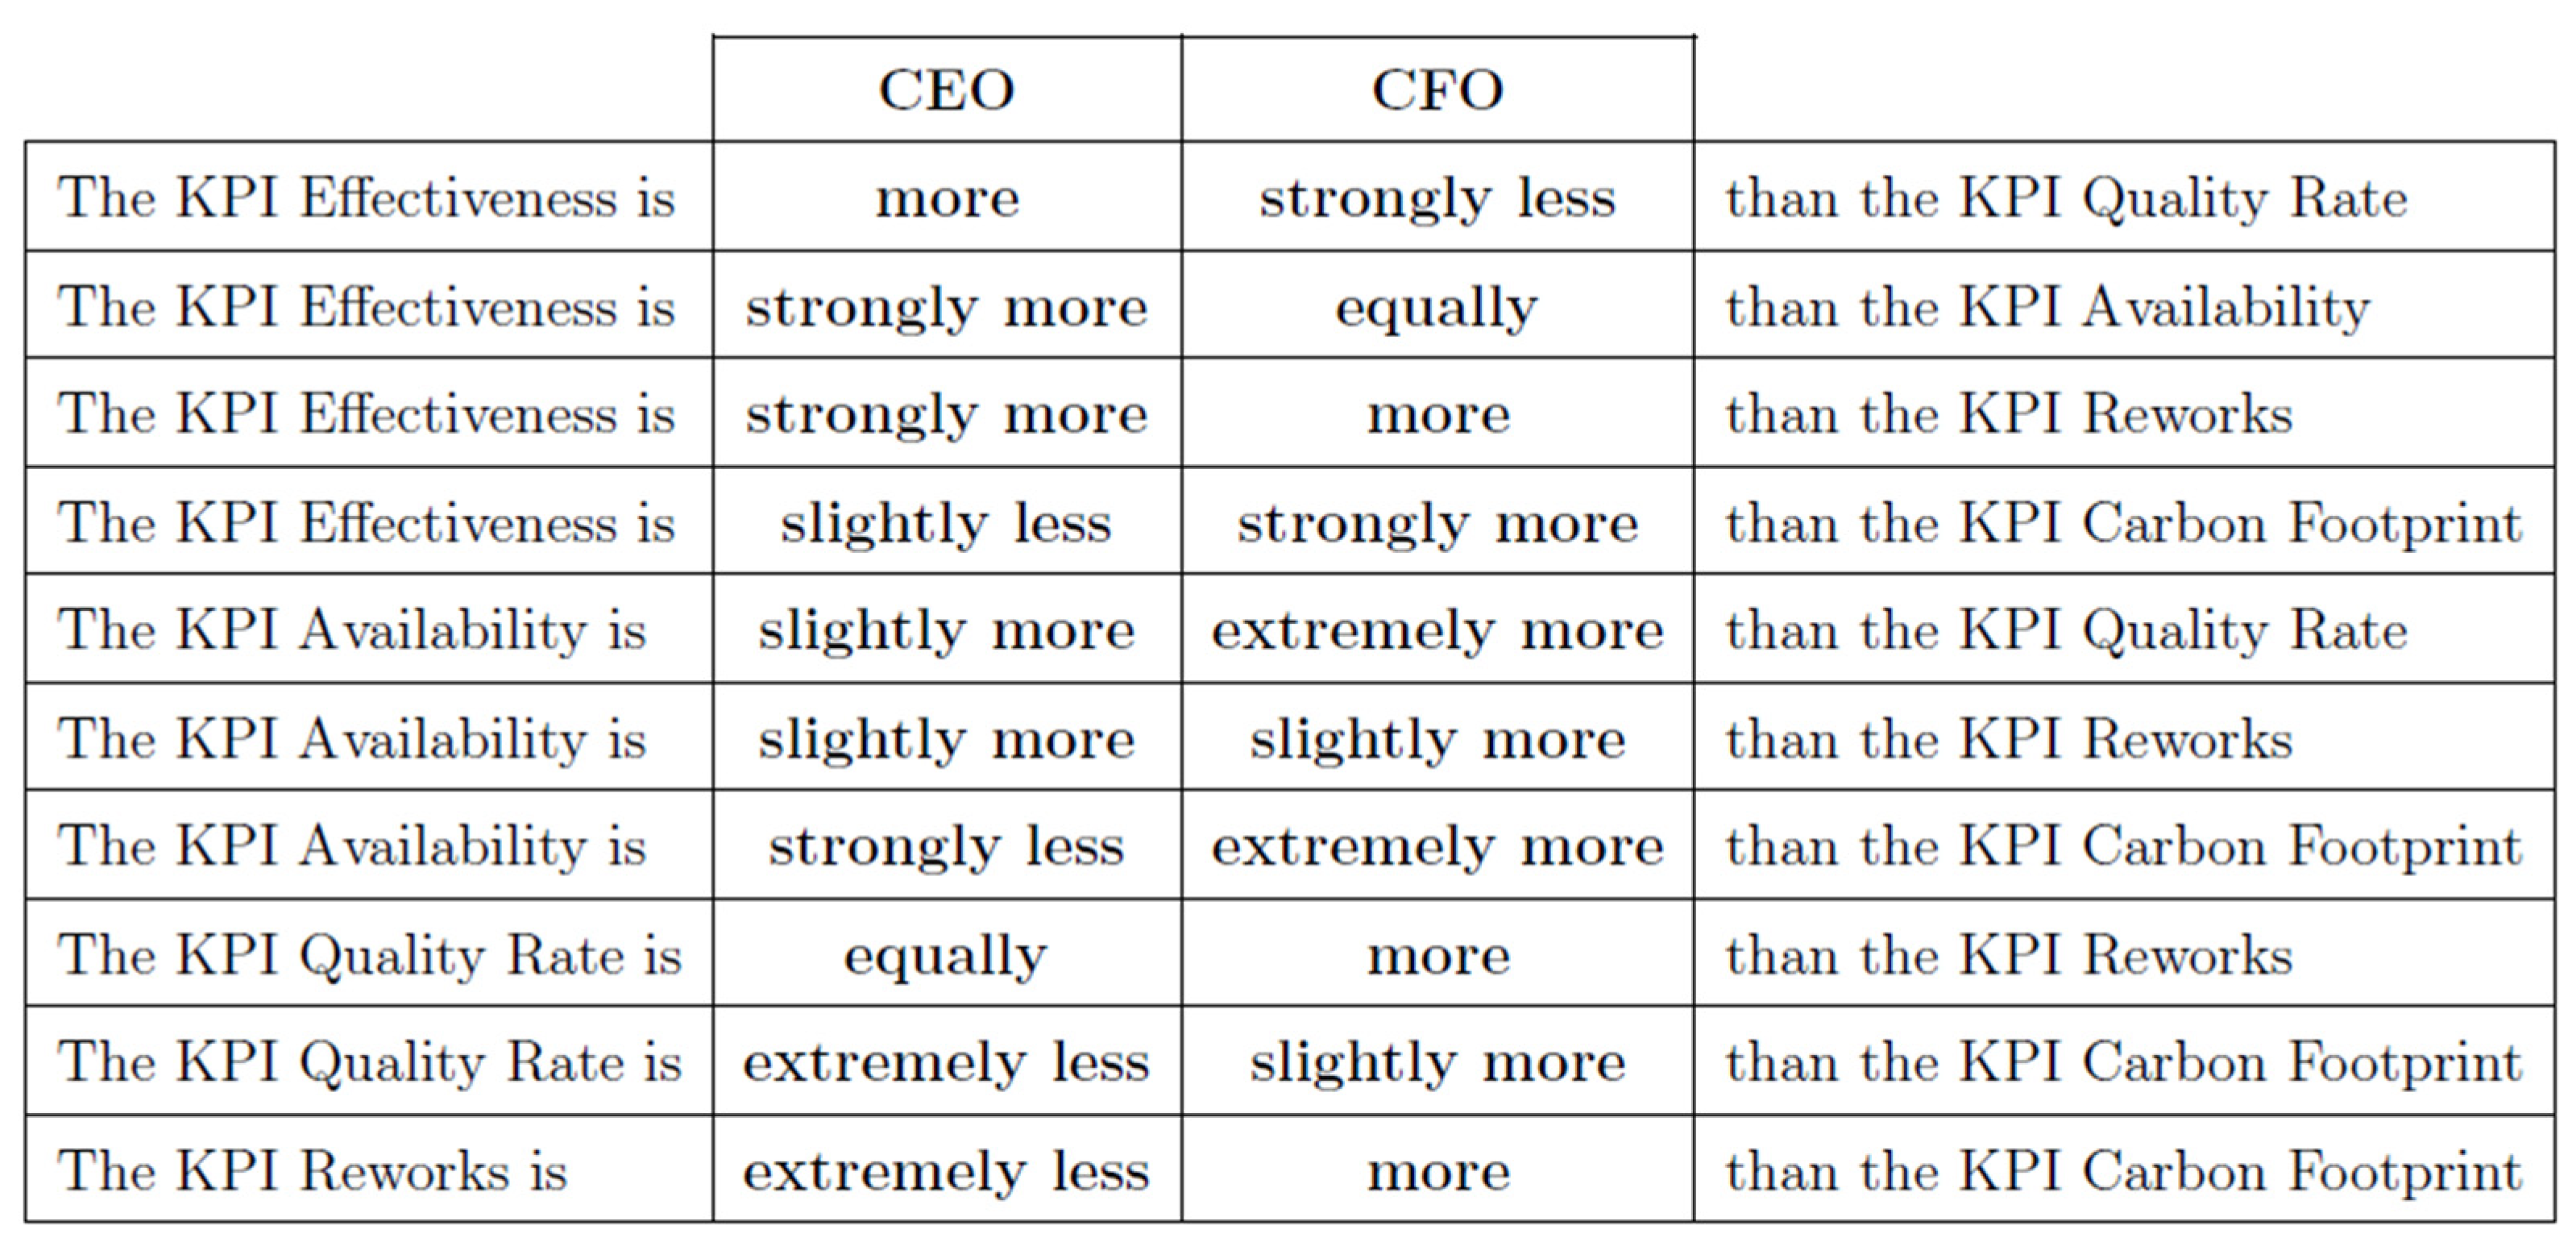
- Alternatives: “How much the alternative x is better than the alternative i in meeting the criterion j?”
- 3.
- Fuzzy Pairwise Comparison Matrix: The pairwise comparisons are compiled into a fuzzy comparison matrix, as illustrated in Table 2, where each element represents the fuzzy number assigned to the comparison between two criteria or alternatives.
- 4.
- Defuzzification: After the fuzzy comparison matrix is constructed, a process called defuzzification is applied to convert the fuzzy numbers into crisp, single values. This is typically performed using methods such as the centroid method, which calculates the center of gravity of the fuzzy number to obtain a single representative value using the following formula [34,35,36]:
- 5.
- Calculating the Consistency Ratio (CR): To ensure that the pairwise comparisons are logically consistent, FAHP—like AHP—checks for consistency using the Consistency Index (CI) and Consistency Ratio (CR) indicators. The Consistency Index helps to determine how consistent the judgments are in a pairwise comparison matrix by comparing the eigenvalue of the matrix with the number of criteria being compared. The formula for the Consistency Index is
- 6.
- Determining Local and Global Weights: Once the defuzzied comparison matrix is obtained, the eigenvector method is used to calculate the local weights for each criterion or alternative. These weights represent the relative importance of each criterion or alternative within its group. The steps in the eigenvector method to calculate local weights are the following:
- Sum the values in each column of the matrix A:where Sj is the sum of the j-th column.
- Normalize the matrix by dividing each element by the sum of its corresponding column:
- Average the rows of the normalized matrix: The average value for each row is the local weight wi for the corresponding criterion or alternative.
- 7.
- Ranking the Alternatives: After determining the global weights for all alternatives, the final step is to rank the alternatives based on their overall scores (Ni). This ranking provides decision-makers with a clear understanding of which alternatives are most aligned with their goals, considering both qualitative and quantitative factors.
3.3. Quali-Quantitative Model Combining CBA and FAHP
4. Case Study Overview
4.1. KPI Selection Process
- Effectiveness;
- Quality Rate;
- Availability;
- Carbon Footprint;
- Reworks.
4.2. Data Collection and Interviews
- Estimating direct and indirect costs associated with the implementation of each KPI, including technical costs, personnel costs (e.g., recruiting, training, overtime), and data collection expenses.
- Determining projected benefits, expressed as potential cost savings, productivity improvements, or waste reduction, quantified based on historical company data and expert judgment.
- Setting key financial assumptions, such as discount rates, expected time horizons for cost–benefit realization, and baseline operational metrics, to evaluate improvements over time.
5. Results
5.1. Results of Cost-Benefit Analysis
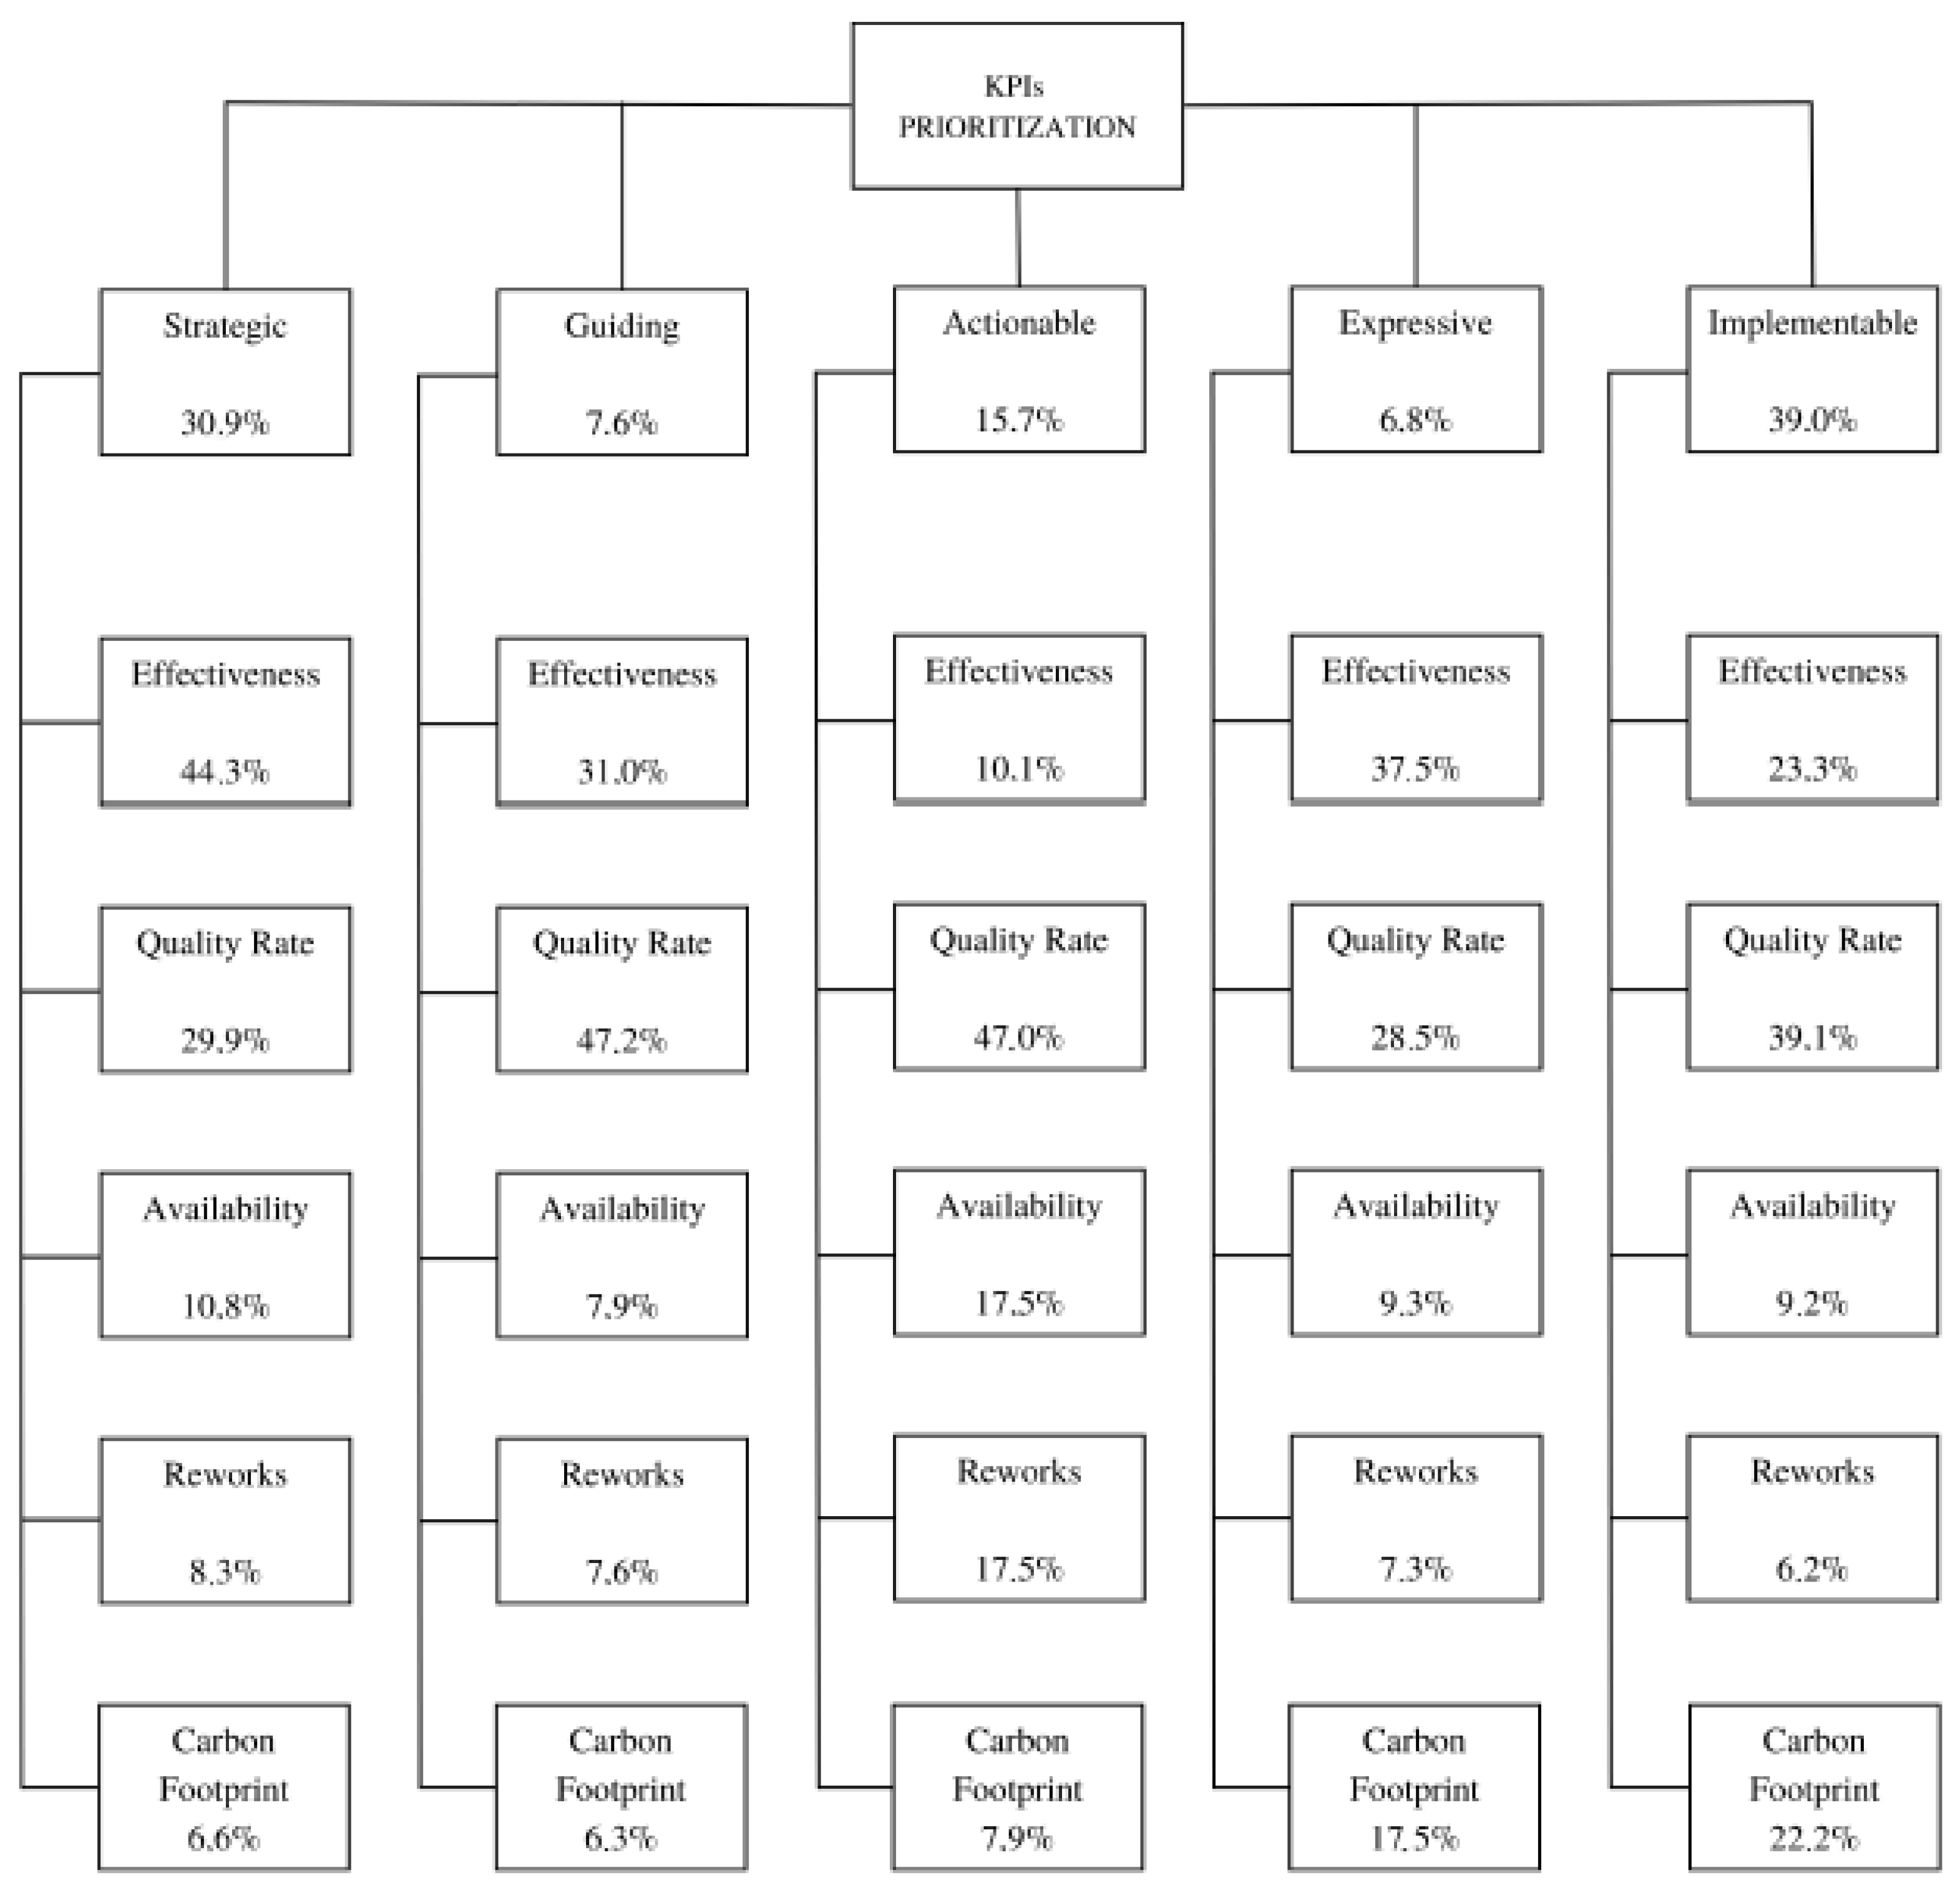
5.2. Fuzzy Analytic Hierarchy Process
- •
- Strategic: How much the KPI is oriented towards the organization’s goals;
- •
- Guiding: How much the KPI supports decision-making;
- •
- Actionable: How much the KPI can be acted on to drive performance improvement;
- •
- Expressive: How much the KPI immediately reveals the performance;
- •
- Implementable: How easily the KPI can be implemented.
6. Discussion of the Results
7. Conclusions
Author Contributions
Funding
Institutional Review Board Statement
Informed Consent Statement
Data Availability Statement
Conflicts of Interest
References
- Villazón, C.C.; Pinilla, L.S.; Olaso, J.R.O.; Gandarias, N.T.; de Lacalle, N.L. Identification of key performance indicators in project-based organisations through the lean approach. Sustainability 2020, 12, 5977. [Google Scholar] [CrossRef]
- Boardman, A.E.; Greenberg, D.H.; Vining, A.R.; Weimer, D.L. Cost-Benefit Analysis, 5th ed.; Cambridge University Press: Cambridge, UK, 2018. [Google Scholar] [CrossRef]
- Purwita, A.W.; Subriadi, A.P. Information technology investment: In search of the closest accurate method. In Procedia Computer Science; Elsevier B.V.: Amsterdam, The Netherlands, 2019; pp. 300–307. [Google Scholar] [CrossRef]
- Mikhailov, L.; Tsvetinov, P. Evaluation of services using a fuzzy analytic hierarchy process. Appl. Soft Comput. J. 2004, 5, 23–33. [Google Scholar] [CrossRef]
- Goti, A.; de la Calle, A.; Gil, M.J.; Errasti, A.; Bom, P.R.D.; García-Bringas, P. Development and application of an assessment complement for production system audits based on data quality, IT infrastructure, and sustainability. Sustainability 2018, 10, 4679. [Google Scholar] [CrossRef]
- Drèze, J.; Stern, N. The Theory of Cost-Benefit Analysis; London School of Economics: London, UK, 1987; Volume 2. [Google Scholar] [CrossRef]
- Syarah, S.A.; Mohammad, I.S. Anticipated ROI Methods for the Quantification of Servicescape Upgrading based on Intangible Values: A Literature Analysis. Int. J. Bus. Technol. Manag. 2023, 5, 171–187. [Google Scholar] [CrossRef]
- Donais, F.M.; Abi-Zeid, I.; Waygood, E.O.D.; Lavoie, R. A review of cost–benefit analysis and multicriteria decision analysis from the perspective of sustainable transport in project evaluation. EURO J. Decis. Process. 2019, 7, 327–358. [Google Scholar] [CrossRef]
- Mohamadian, M.; Noori, S.; Hosseini, S.M.S. An integrated framework for cost- benefit analysis in road safety projects using AHP method. Manag. Sci. Lett. 2011, 1, 551–558. [Google Scholar] [CrossRef]
- Manco, P.; Rinaldi, M.; Caterino, M.; Fera, M.; Macchiaroli, R. Maintenance management for geographically distributed assets: A criticality-based approach. Reliab. Eng. Syst. Saf. 2022, 218, 108148. [Google Scholar] [CrossRef]
- Zhining, Z.; Alli, H.; Ahmadipour, M.; Che me, R. A weighted fuzzy approach for the agility of sustainable product development process assessment: A case study in Chinese medium-sized enterprises. Heliyon 2024, 10, e34138. [Google Scholar] [CrossRef] [PubMed]
- Thengane, S.K.; Hoadley, A.; Bhattacharya, S.; Mitra, S.; Bandyopadhyay, S. Cost-benefit analysis of different hydrogen production technologies using AHP and Fuzzy AHP. Int. J. Hydrog. Energy 2014, 39, 15293–15306. [Google Scholar] [CrossRef]
- Mancusi, F.; Fruggiero, F.; Panagou, S. Mapping Uncertainty Sources Affecting Circularity: A Holonic Approach. In Proceedings of the 9th 2023 International Conference on Control, Decision and Information Technologies, CoDIT 2023, Rome, Italy, 3–6 July 2023; Institute of Electrical and Electronics Engineers Inc.: Piscataway, NJ, USA, 2023; pp. 2713–2720. [Google Scholar] [CrossRef]
- Fantozzi, I.C.; Santolamazza, A.; Loy, G.; Schiraldi, M.M. Digital Twins: Strategic Guide to Utilize Digital Twins to Improve Operational Efficiency in Industry 4.0. Future Internet 2025, 17, 41. [Google Scholar] [CrossRef]
- Shume, H.A.; Mitikie, B.B. An integrated Delphi and Fuzzy AHP model for contractor selection: A case of Addis Ababa Design and Construction Works Bureau. Cogent Eng. 2024, 11, 2357724. [Google Scholar] [CrossRef]
- Mahmoodzadeh, S.; Shahrabi, J.; Pariazar, M.; Zaeri, M.S. Project Selection by Using Fuzzy AHP and TOPSIS Technique. World Acad.Sci. Eng. Technol. 2007, 30, 333–338. [Google Scholar]
- Mangla, S.K.; Kumar, P.; Barua, M.K. Risk analysis in green supply chain using fuzzy AHP approach: A case study. Resour. Conserv. Recycl. 2015, 104, 375–390. [Google Scholar] [CrossRef]
- Valentin, M.; Ioan, P.M.; Andrei, P.; Delia, G. Methodological Approachese in Realizing and Applying Cost-Benefit Analysis for the Investment Projects. Ann. Univ. Oradea Econ. Sci. 2009, 2, 156–162. [Google Scholar]
- Thomas, V.; Chindarkar, N. The Picture from Cost-Benefit Analysis. In Economic Evaluation of Sustainable Development; Springer Singapore eBooks; Springer: Singapore, 2019; pp. 63–94. [Google Scholar] [CrossRef]
- Ortega, B. Cost-Benefit Analysis. In Encyclopedia of Quality of Life and Well-Being Research; Springer International Publishing: Cham, Switzerland, 2021; pp. 1–5. [Google Scholar] [CrossRef]
- Özdağoğlu, A.; Özdağoğlu, G. Comparison of AHP and Fuzzy AHP for the Multi-Criteria Decision Making Process With Linguistic Evaluations. Istanb. Ticaret Univ. Fen Bilim. Derg. 2007, 6, 65–85. [Google Scholar]
- Saaty, R.W. The analytic hierarchy process—What it is and how it is used. Math. Model. 1987, 9, 161–176. [Google Scholar] [CrossRef]
- Saaty, T.L.; Vargas, L.G. Models; Methods, Concepts & Applications of the Analytic Hierarchy Process, 2nd ed.; Springer: Berlin/Heidelberg, Germany, 2012; Volume 175, Available online: http://www.springer.com/series/6161 (accessed on 11 February 2025).
- Emrouznejad, A.; Ho, W. Fuzzy Analytic Hierarchy Process; CRC Press: Boca Raton, FL, USA; Chapman and Hall/CRC: Boca Raton, FL, USA, 2017. [Google Scholar] [CrossRef]
- Xu, S.L.; Yeyao, T.; Shabaz, M. Multi-criteria decision making for determining best teaching method using fuzzy analytical hierarchy process. Soft Comput. 2023, 27, 2795–2807. [Google Scholar] [CrossRef] [PubMed]
- Cantini, A.; Peron, M.; De Carlo, F.; Sgarbossa, F. A data-driven methodology for the periodic review of spare parts supply chain configurations. Int. J. Prod. Res. 2024, 62, 1818–1845. [Google Scholar] [CrossRef]
- Bafail, O.A.; Abdulaal, R.M.S. A Combined BWM-TOPSIS Approach Versus AHP-TOPSIS Approach: An Application to Solid Waste Management. In Proceedings of the 2022 The 3rd International Conference on Industrial Engineering and Industrial Management, Barcelona, Spain, 12–14 January 2022. [Google Scholar] [CrossRef]
- Kustiyahningsih, Y.; Rahmanita, E.; Khotimah, B.K.; Purnama, J. Type-2 Fuzzy ANP and TOPSIS methods based on trapezoid Fuzzy number with a new metric. Int. J. Adv. Intell. Inform. 2024, 10, 239–352. [Google Scholar] [CrossRef]
- Alsanousi, A.T.; Alqahtani, A.Y.; Makki, A.A.; Baghdadi, M.A. A Hybrid MCDM Approach Using the BWM and the TOPSIS for a Financial Performance-Based Evaluation of Saudi Stocks. Information 2024, 15, 258. [Google Scholar] [CrossRef]
- Leoni, L.; De Carlo, F.; Sgarbossa, F.; Paltrinieri, N. Comparison of risk-based maintenance approaches applied to a natural gas regulating and metering station. Chem. Eng. Trans. 2020, 82, 115–120. [Google Scholar] [CrossRef]
- Slamaa, A.A.; El-Ghareeb, H.A.; Aboelfetouh, A. Comparative analysis of AHP, FAHP and Neutrosophic-AHP based on multi-criteria for adopting ERPS. Neutrosophic Sets Syst. 2021, 1, 41. [Google Scholar]
- Zadeh, L.A. Fuzzy Sets; Elsevier: Amsterdam, The Netherlands, 1965; Volume 8. [Google Scholar] [CrossRef]
- Enea, M.; Piazza, T. Project Selection by Constrained Fuzzy AHP. Fuzzy Optim. Decis. Mak. 2004, 3, 39–62. [Google Scholar] [CrossRef]
- Chang, D.-Y. European Journal of Operational Research Applications of the Extent Analysis Method on Fuzzy AHP; Elsevier: Amsterdam, The Netherlands, 1996. [Google Scholar]
- Kwong, C.K.; Bai, H. Determining the importance weights for the customer requirements in QFD using a fuzzy AHF with an extent analysis approach. IIE Trans. Inst. Ind. Eng. 2003, 35, 619–626. [Google Scholar] [CrossRef]
- Kaganski, S.; Majak, J.; Karjust, K. Fuzzy AHP as a tool for prioritization of key performance indicators. In Procedia CIRP; Elsevier B.V.: Amsterdam, The Netherlands, 2018; pp. 1227–1232. [Google Scholar] [CrossRef]
- Liu, F.; Peng, Y.; Zhang, W.; Pedrycz, W. On Consistency in AHP and Fuzzy AHP. J. Syst. Sci. Inf. 2017, 5, 128–147. [Google Scholar] [CrossRef]


| Definition | Triangle Numbers dij | ||
|---|---|---|---|
| i is extremely more important than j | 9 | 9 | 9 |
| i is strongly more important than j | 6 | 7 | 8 |
| i is more important than j | 4 | 5 | 6 |
| i is slightly more important than j | 2 | 3 | 4 |
| i is equally important as j | 1 | 1 | 1 |
| i is slightly less important than j | 1/2 | 1/3 | 1/4 |
| i is less important than j | 1/4 | 1/5 | 1/6 |
| i is strongly less important than j | 1/6 | 1/7 | 1/8 |
| i is extremely less important than j | 1/9 | 1/9 | 1/9 |
| Alternative 1 | Alternative 2 | … | Alternative n | |
|---|---|---|---|---|
| Alternative 1 | 1 | d12 | … | d1n |
| Alternative 2 | 1/d12 | 1 | … | d2n |
| … | … | … | 1 | … |
| Alternative n | 1/d1n | 1/d2n | … | 1 |
| n | 1 | 2 | 3 | 4 | 5 | 6 | 7 | 8 | 9 | 10 | 11 | 12 | 13 |
|---|---|---|---|---|---|---|---|---|---|---|---|---|---|
| RI | 0 | 0 | 0.58 | 0.89 | 1.12 | 1.24 | 1.33 | 1.4 | 1.45 | 1.49 | 1.51 | 1.54 | 1.56 |
| Total Costs | Total Benefits | NPV | BCR | |
|---|---|---|---|---|
| Effectiveness | USD 15,662.60 | USD 68,349.90 | USD 52,687.30 | 4.36 |
| Availability | USD 15,721.70 | USD 13,669.98 | USD −2051.72 | 0.87 |
| Quality Rate | USD 17,307.51 | USD 47,844.93 | USD 30,537.42 | 2.76 |
| Reworks | USD 15,975.59 | USD 20,504.97 | USD 4529,18 | 1.28 |
| Carbon Footprint | USD 2378.72 | USD 13,669.98 | USD 11,291.26 | 5.75 |
| Ranking | KPI | BCR |
|---|---|---|
| 1 | Carbon Footprint | 5.75 |
| 2 | Effectiveness | 4.36 |
| 3 | Quality Rate | 2.76 |
| 4 | Reworks | 1.28 |
| 5 | Availability | 0.87 |
| Criteria | KPIs Strategic | KPIs Guiding | KPIs Actionable | KPIs Expressive | KPIs Implementable | |
|---|---|---|---|---|---|---|
| CEO’s CI | 0.0400 | 0.0398 | 0.0444 | 0.0115 | 0.0364 | 0.0090 |
| CFO’s CI | 0.1721 | 0.2602 | 0.0442 | 0.0344 | 0.0364 | 0.3556 |
| Overall CI | 0.0896 | 0.1317 | 0.0159 | 0.0139 | 0.0220 | 0.0956 |
| Ranking | KPI | FAHP Global Weight |
|---|---|---|
| 1 | Quality Rate | 37.40% |
| 2 | Effectiveness | 29.29% |
| 3 | Carbon Footprint | 13.63% |
| 4 | Availability | 10.88% |
| 5 | Reworks | 8.80% |
| KPI | CBA’s BRCi | FAHP’s Ni | Final Values Vi | |
|---|---|---|---|---|
| 1 | Effectiveness | 2.76 | 0.2929 | 1.15 |
| 2 | Carbon Footprint | 5.75 | 0.1363 | 0.91 |
| 3 | Quality Rate | 1.28 | 0.3740 | 0.77 |
| 4 | Reworks | 4.36 | 0.0880 | 0.42 |
| 5 | Availability | 0.87 | 0.1088 | 0.11 |
Disclaimer/Publisher’s Note: The statements, opinions and data contained in all publications are solely those of the individual author(s) and contributor(s) and not of MDPI and/or the editor(s). MDPI and/or the editor(s) disclaim responsibility for any injury to people or property resulting from any ideas, methods, instructions or products referred to in the content. |
© 2025 by the authors. Licensee MDPI, Basel, Switzerland. This article is an open access article distributed under the terms and conditions of the Creative Commons Attribution (CC BY) license (https://creativecommons.org/licenses/by/4.0/).
Share and Cite
Fantozzi, I.C.; Colleluori, L.; Schiraldi, M.M. A Quali-Quantitative Analysis Model Integrating Fuzzy Analytical Hierarchy Process and Cost–Benefit Analysis for Optimizing KPI Implementation: Insights from a Practical Case Study Application. Eng 2025, 6, 56. https://doi.org/10.3390/eng6030056
Fantozzi IC, Colleluori L, Schiraldi MM. A Quali-Quantitative Analysis Model Integrating Fuzzy Analytical Hierarchy Process and Cost–Benefit Analysis for Optimizing KPI Implementation: Insights from a Practical Case Study Application. Eng. 2025; 6(3):56. https://doi.org/10.3390/eng6030056
Chicago/Turabian StyleFantozzi, Italo Cesidio, Livio Colleluori, and Massimiliano Maria Schiraldi. 2025. "A Quali-Quantitative Analysis Model Integrating Fuzzy Analytical Hierarchy Process and Cost–Benefit Analysis for Optimizing KPI Implementation: Insights from a Practical Case Study Application" Eng 6, no. 3: 56. https://doi.org/10.3390/eng6030056
APA StyleFantozzi, I. C., Colleluori, L., & Schiraldi, M. M. (2025). A Quali-Quantitative Analysis Model Integrating Fuzzy Analytical Hierarchy Process and Cost–Benefit Analysis for Optimizing KPI Implementation: Insights from a Practical Case Study Application. Eng, 6(3), 56. https://doi.org/10.3390/eng6030056