Article

Defect Engineering and Dopant Properties of MgSiO3

by
Kowthaman Pathmanathan
1,
Poobalasuntharam Iyngaran
1,
Poobalasingam Abiman
1 and
Navaratnarajah Kuganathan
2,*
1
Department of Chemistry, University of Jaffna, Sir. Pon Ramanathan Road, Tirunelveli, Jaffna 40000, Sri Lanka
2
Department of Materials, Faculty of Engineering, Imperial College London, London SW7 2AZ, UK
*
Author to whom correspondence should be addressed.
Submission received: 4 February 2025 / Revised: 6 March 2025 / Accepted: 10 March 2025 / Published: 12 March 2025
(This article belongs to the Section Materials Engineering)

Abstract

:
Magnesium silicate (MgSiO3) is widely utilized in glass manufacturing, with its performance influenced by structural modifications. In this study, we employ classical and density functional theory (DFT) simulations to investigate the defect and dopant characteristics of MgSiO3. Our results indicate that a small amount of Mg-Si anti-site defects can exist in the material. Additionally, MgO Schottky defects are viable, requiring only slightly more energy to form than anti-site defects. Regarding the solubility of alkaline earth dopant elements, Ca preferentially incorporates into the Mg site without generating charge-compensating defects, while Zn exhibits a similar behavior among the 3D block elements. Al and Sc are promising dopants for substitution at the Si site, promoting the formation of Mg interstitials or oxygen vacancies, with the latter being the more energetically favorable process. The solution of isovalent dopants at the Si site is preferred by Ge and Ti. Furthermore, we analyze the electronic structures of the most favorable doped configurations.

1. Introduction

Minerals are subject to various external and internal factors that lead to the formation of defects. Geostress, seepage, and weathering act as natural forces that gradually weaken the structural integrity of rocks over time [1,2]. Additionally, artificial disturbances, such as construction, drilling, or mining activities, can exacerbate these processes, creating fractures, voids, or other imperfections within the material. These defects not only alter the physical and mechanical properties of rocks, but can also significantly impact their behavior under load, permeability, and overall stability in engineering and geological contexts [3,4].
MgSiO3 is a major mineral component of the lower mantle of the earth and occurs in several polymorphic forms [5,6]. Among these, the high-pressure perovskite polymorph of MgSiO3 is believed to be the most abundant mineral [7]. Variations in ionic size and slight atomic displacements cause most perovskite-type compounds to adopt a pseudosymmetric version of the ideal structure. These subtle distortions in the unit cell reduce the overall symmetry from cubic. Such structural deviations have a significant impact on the physical and electrical properties in perovskites. Under ambient conditions, the SiO6 octahedra in MgSiO3 perovskite undergo rotation and tilting, leading to an orthorhombically distorted perovskite structure [8,9].
MgSiO3-based glasses are used in various applications due to their optical clarity, thermal stability, and mechanical properties [10,11,12,13]. Several techniques have been utilized to improve the functionality of MgSiO3, such as carbon coating defect generation and atomic doping [14,15,16]. Although doped MgSiO3 minerals can form naturally, laboratory synthesis allows for the tailored modification of properties using specific dopants. In addition, its structural stability, attributed to the strong Si–O bonds in the SiO4 units, makes it a promising candidate for use as an electrode material in magnesium-ion batteries. The robust Si–O framework ensures high structural integrity during charge–discharge cycles, which is essential for long-term battery performance. Furthermore, the presence of Mg facilitates magnesium-ion conduction, making MgSiO3 a potential host material for efficient and durable energy storage applications.
Computational modeling techniques are highly efficient for predicting and understanding defects and dopant properties in solid-state oxide materials. Previous simulation studies have utilized interatomic pair potentials and DFT to comprehensively characterize defect and dopant properties, as well as to identify the required charge compensation mechanisms [17,18,19,20,21,22]. DFT simulation studies on MgSiO3 show that the Schottky formation energy was found to increase by a factor of 2.5 over the studied pressure range (0 to 150 GPa) [23]. The results indicate that these point defects cause significant distortions in the surrounding atomic and electronic structures, which remain largely unaffected by pressure. The activation energies of magnesium, silicon, and oxygen were analyzed under varying pressures up to lower mantle conditions. All migration enthalpies were shown to increase progressively with rising pressure [24]. The impact of Fe dopants on the local microstructure of MgSiO3, as revealed by DFT simulations, along with the observed magnetic and optical properties, was investigated by Stashans et al. [25]. Incorporating an Fe atom induces a magnetic moment in the surrounding region of the impurity. The total magnetic moment is primarily due to the impurity atom, which contributes more than 94% of the overall magnetization. The Al doping in the MgSiO3 mineral led to the intriguing discovery of an Al-bound hole polaron, a quasiparticle that forms when Al substitutes for Si as an acceptor [26]. In this structure, the hole polaron localizes on three oxygen atoms situated near the Al impurity. Previous studies have not conducted a systematic investigation into the formation of various defect processes, including anti-site defects, as well as different dopants with varying charge-compensating mechanisms, in the screening of promising dopants [27,28,29,30].
This study employs classical simulations to investigate defect properties, while DFT simulations are used to predict the behavior of isovalent and aliovalent dopants. Additionally, DFT allows for predicting the electronic properties of doped configurations.

2. Computational Methods

Atomistic simulations using a classical pair potential approach, as implemented in the General Utility Lattice Program (GULP) code [31], were conducted to study intrinsic defect properties. Ionic interactions were modeled with a combination of long-range (Coulomb) forces and short-range forces, which account for electron–electron repulsion and dispersive attraction. The short-range interactions were described using Buckingham potentials, as outlined in Table 1 [32]. Full geometry optimization, encompassing both cell parameters and ionic positions, was performed using the Broyden–Fletcher–Goldfarb–Shanno (BFGS) algorithm [33]. The defects were modeled using the Mott–Littleton method [34].
A DFT code VASP (Vienna Ab initio Simulation Package) [35] was used to model the dopant calculations. The exchange-correlation term was established using the generalized gradient approximation (GGA), as parameterized by Perdew, Burke, and Ernzerhof (PBE) [36]. A plane-wave basis set with a 500 eV cut-off and the standard projected augmented wave (PAW) potentials [37], as implemented in VASP, was employed. A 4 × 4 × 4 Monkhorst-Pack [38] k-point mesh was utilized to model the defect configurations. The dopant structures were optimized using the conjugate gradient algorithm [39], with atomic forces calculated via the Hellmann–Feynman theorem incorporating Pulay corrections. All optimized configurations reduced the atomic forces to below 0.001 eV/Å. Bader charge analysis was performed to analyze the charges on the dopant atoms [40].

3. Results

3.1. Crystal Structure of MgSiO3

MgSiO3 perovskite adopts an orthorhombic structure with space group Pbnm (no. 62) [41]. The tetravalent Si4+ ions are situated in octahedral coordination, forming a network of corner-sharing SiO6 octahedra (see Figure 1a). In contrast, the divalent Mg2+ ions occupy a distorted 12-fold coordinated site. Full geometry optimization was performed to validate the pair potentials used in classical simulations and the pseudopotentials and basis sets employed in DFT simulations. The calculated results from both methods show good agreement, confirming their reliability for further modeling (see Table 2). The total density of states (DOS) plot indicates that MgSiO3 is a wide-gap insulator with a band gap of 5.60 eV, consistent with values reported in previous simulation studies (see Figure 1b) [26].
The Bader charge analysis for bulk MgSiO3 reveals that Mg atoms possess a charge of +2.00e, Si atoms exhibit a charge of +4.00e, and O atoms carry a charge of −2.00e (See Table 3). These values are consistent with the expected formal oxidation states of Mg2+, Si4+, and O2− in the MgSiO3 structure, reflecting the ionic nature of the bonding in this material. The accumulation of electrons on the O atoms is reflected in the charge density plot (see Figure 1c).

3.2. Intrinsic Defect Formation

Defects play a crucial role in shaping the properties of materials [42]. Investigating and simulating point defects such as vacancies, interstitials, and anti-site defects is vital for understanding material behavior. The thermodynamic stability of defects and dopants depends on their formation energy, which is influenced by chemical potentials, charge states, and external conditions like temperature and pressure. At finite temperatures, configurational entropy and vibrational contributions can stabilize certain defects, while high pressures may alter their stability by modifying lattice strain and chemical potential equilibria. The Gibbs free energy, incorporating enthalpic and entropic terms, determines defect prevalence under realistic conditions. Understanding these factors is crucial for tailoring material properties, as defect stability impacts electronic, optical, and mechanical behavior in semiconductors, oxides, and functional materials. To study these effects, isolated point defects (vacancies and interstitials) were generated, and their formation energies were calculated using classical simulation. The formation energies for Frenkel, Schottky, and anti-site defects were subsequently determined by combining the relevant point defect energies. These defect processes directly impact the electrochemical and diffusion properties of materials. Anti-site defects, in particular, have been identified both experimentally and theoretically in various oxides [43,44]. The analysis included anti-site defects in both isolated and cluster forms. For clusters, isolated defects were placed within the same supercell, whereas for the isolated case, defect energies were calculated independently and then combined. Defect reaction equations were formulated using Kröger–Vink notation [45] to provide a structured representation of these processes.
Mg   Frenkel :   M g M g x V M g + M g i
Si   Frenkel :   S i S i x V S i +   S i i
O   Frenkel :   O o x V o   +   O i
MgSiO 3   Schottky : M g M g x + S i S i x + 3   O o x V M g + 3   V O + V S i + MgSiO 3
MgO   Schottky :   M g M g x + O o x V M g +   V O + MgO
SiO 2   Schottky :   S i S i x + O O x V S i   +   2 V O + SiO 2
Mg / Si   anti-site   ( isolated ) :   Mg M g x + Si S i x Si M g + Mg S i
Mg / Si   anti-site   ( cluster ) :   Mg M g x + Si S i x { Si M g : Mg S i } x
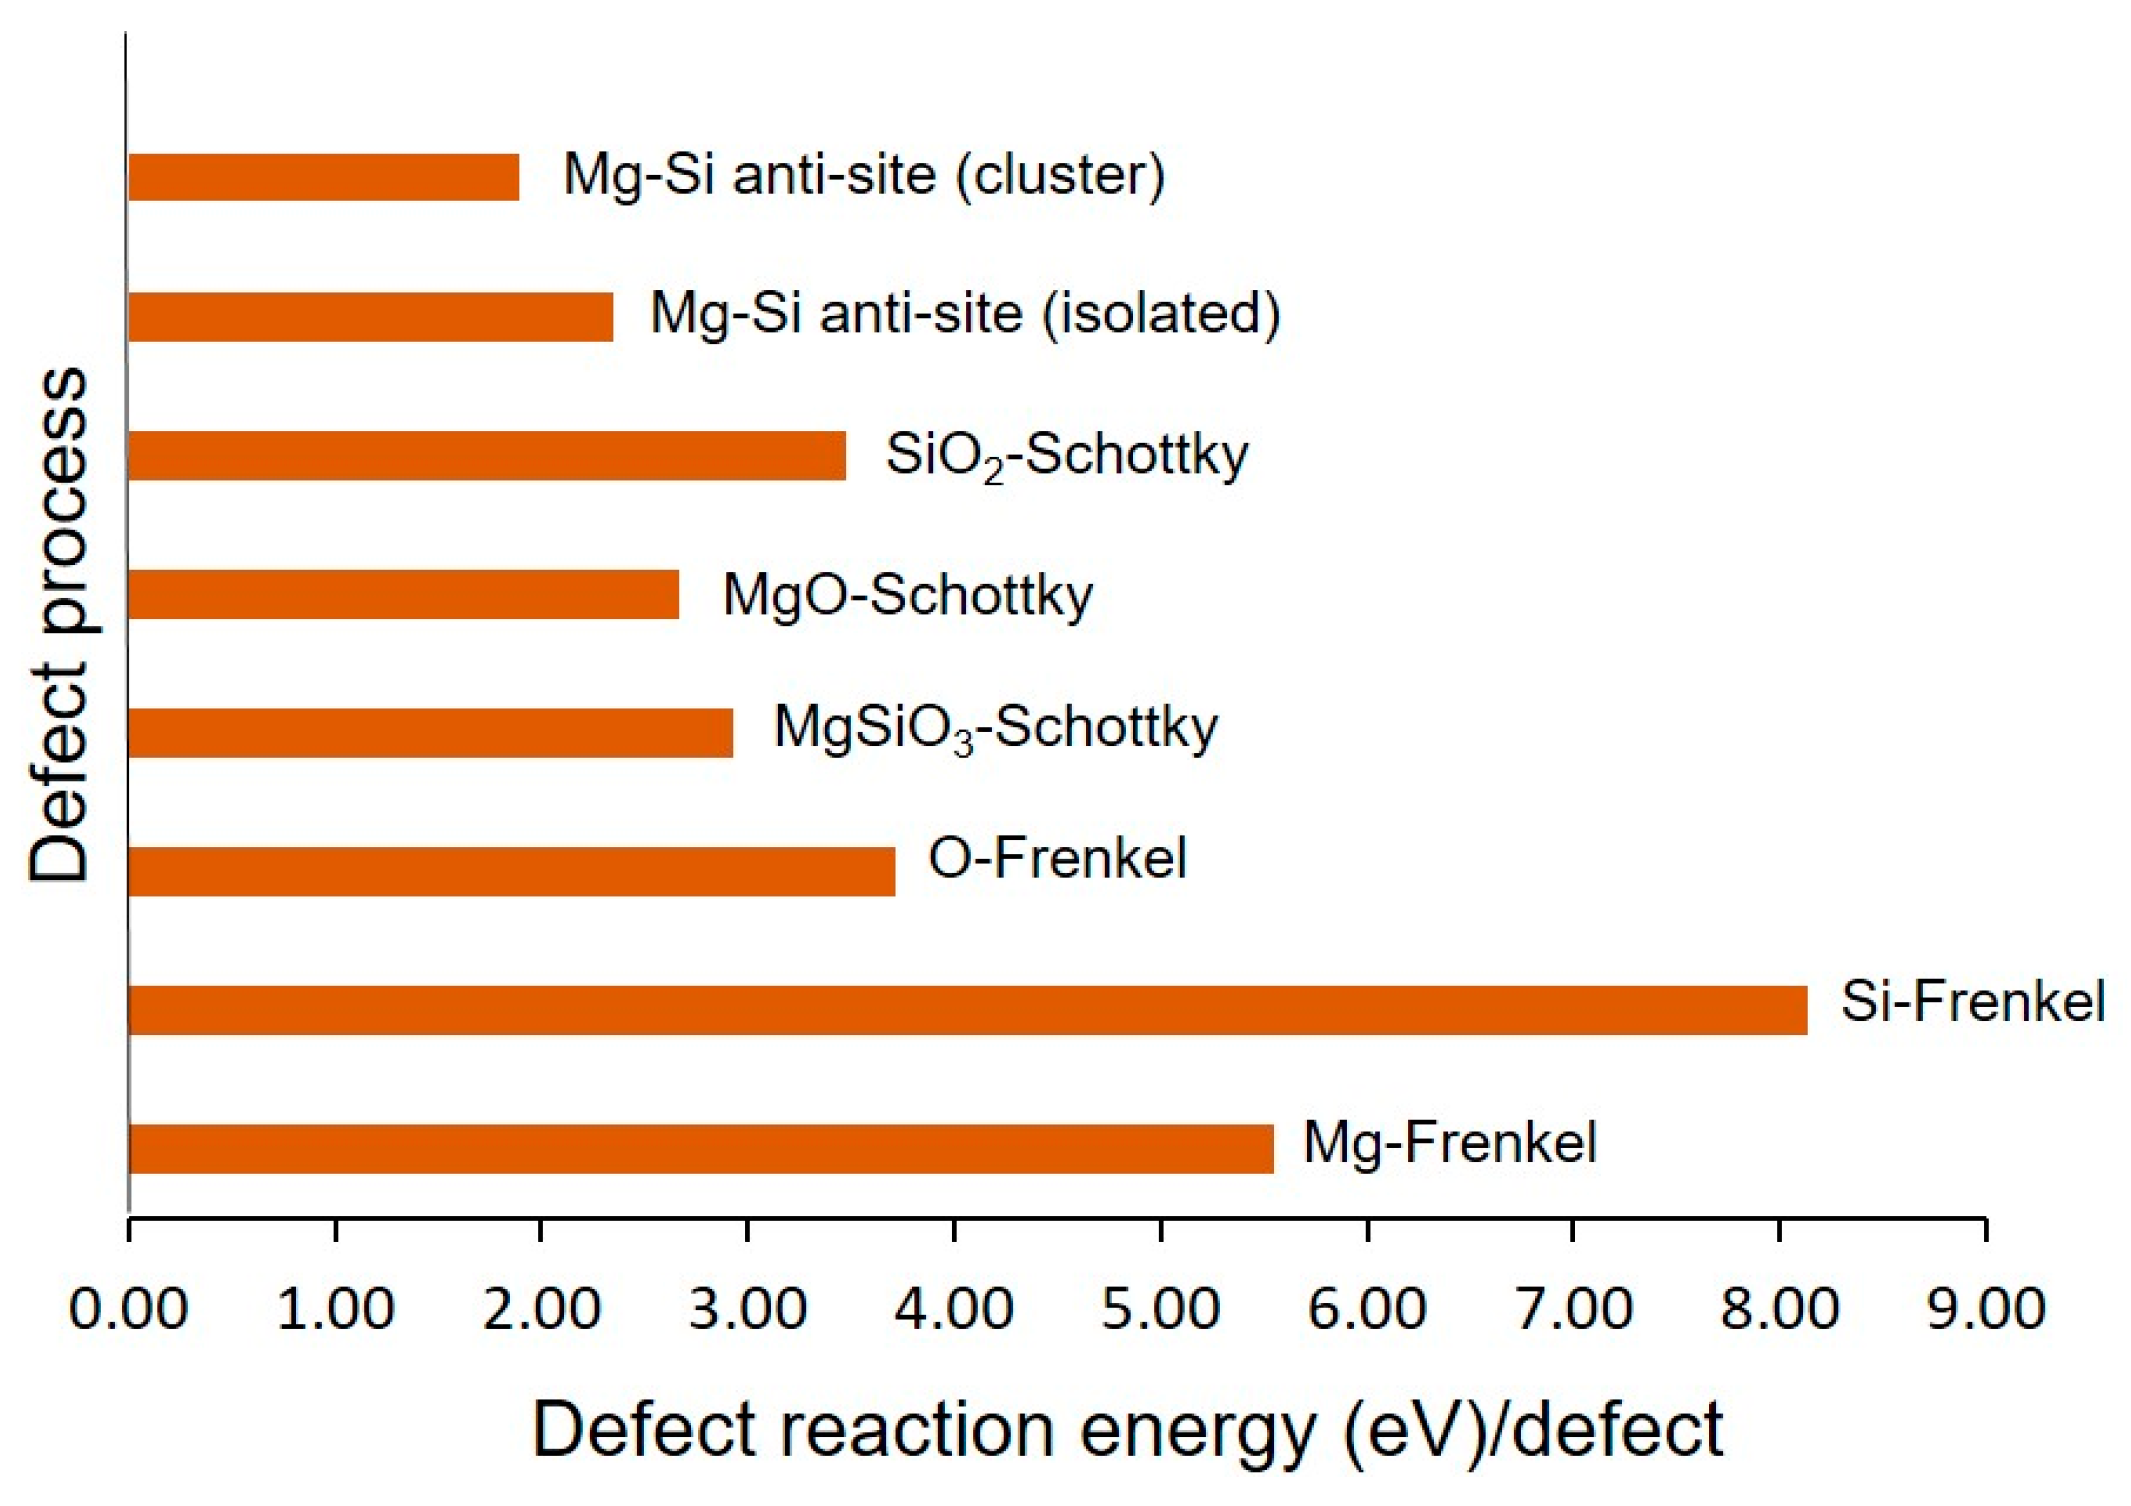
Figure 2 presents the reaction energies of intrinsic defect processes, including the anti-site, Schottky, and Frenkel defects. Among the listed processes, the Si-Frenkel defect has the highest reaction energy (8.13 eV), indicating that it is the least energetically favorable, consistent with a previous simulation study [46]. This is followed by the Mg-Frenkel defect, with a reaction energy of 5.55 eV. The Schottky defects in MgSiO3 (2.93 eV), MgO (2.67 eV), and SiO2 (3.48 eV) exhibit moderate reaction energies, indicating a balance between stability and likelihood of formation. Among the Schottky defects, the formation of MgO Schottky defects is the lowest energy process, as observed in another study [46]. The O-Frenkel defect, with a reaction energy of 3.71 eV, indicates greater oxygen mobility within the MgSiO3 lattice, which can offer several advantages. Enhanced oxygen diffusion can improve ionic conductivity, making MgSiO3 a potential candidate for solid electrolytes and sensors. Increased oxygen transport can also facilitate oxidation-reduction reactions, benefiting catalytic applications. Additionally, the presence of mobile oxygen species may enhance the structural flexibility of MgSiO3, allowing it to better accommodate external stresses. In the context of energy storage, such as magnesium-ion batteries, oxygen mobility could play a crucial role in charge transport and electrode performance, further expanding the functional applications of MgSiO3. A previous study reported that oxygen diffusion is most efficient along the <100> direction, with an activation energy of 452 kJmol−1 for intrinsic diffusion and 81 kJmol−1 for extrinsic diffusion [46]. Interestingly, Mg-Si anti-site defects show the lowest reaction energies, with clusters at 1.89 eV and isolated sites at 2.35 eV, implying that these defects form more readily. The difference between these two anti-site energies results in a negative binding energy of −0.46 eV. Since vacancy formation is crucial for ion migration, and Mg-Frenkel defects have a higher energy than O-Frenkel defects, it can be inferred that Mg diffusion is slower than O diffusion.

3.3. Solution of Dopants

Dopants are frequently introduced into metal oxides to alter their physical, chemical, and electronic properties, either by enhancing beneficial traits or reducing undesirable effects [47]. The concentration of point defects is a key factor influencing the functional properties of materials and it can be effectively managed by using aliovalent dopants to increase defect levels. This study explored both isovalent and aliovalent dopants at different lattice sites, calculating solution energies to assess the feasibility of dopant substitution. The solution energy of a dopant reflects its ease of incorporation into the host lattice. To ensure accuracy, lattice energies for various oxides were computed and applied in determining solution energies. These simulation results provide valuable insights into optimizing dopant incorporation, enabling the fine-tuning of MgSiO3 as a functional material.

3.3.1. Divalent Dopants

The process of incorporating divalent dopants (represented as M, where M = Be, Ca, Sr, Ba, Fe, Co, Mn, Ni, Cu, and Zn) into the Mg site can be expressed using the following equation in Kröger–Vink notation:
M O + M g M g X M M g X + M g O
The plots depict the relationship between the ionic radius and solution energy for two dopant groups: alkaline earth metals (Be, Ca, Sr, and Ba) and transition metals (Fe, Co, Mn, Ni, Cu, and Zn). In the alkaline earth metals group, solution energy increases steadily with ionic radius (see Figure 3). This indicates that larger dopants, such as Ba, are less energetically favorable for incorporation than smaller ones like Be. The most favorable dopant, Ca, has been studied, emphasizing the crucial role of grain boundaries as reservoirs for minor elements in the Earth’s mantle [48]. In contrast, the transition metals exhibit a non-monotonic trend. Mn has the lowest solution energy, making it the most favorable dopant, while Cu has the highest solution energy despite its moderate ionic radius. The excitation and emission spectra of the Mn2+-doped MgSiO3 sample were analyzed, revealing high luminescence intensity and a high quenching concentration [15]. This suggests that factors beyond ionic radius, such as electronic configuration or bonding compatibility, significantly influence solution energy in transition metals. Overall, the findings highlight the distinct behaviors of these two dopant groups in terms of the incorporation of energetics.
Figure 3. Solution energies of (a) alkali earth and (b) 3D block metal dopants regarding their ionic radii.
Eng 06 00051 g003
Table 4 summarizes the Bader charge, M-O bond distance, and lattice volume changes calculated for alkaline earth and transition metal dopants. For alkaline earth metals, the ionic radii increase from Be (0.59 Å) to Ba (1.35 Å), leading to reduced charge transfer and longer M-O bond distances, ranging from 1.69–1.79 Å for Be to 2.49–2.61 Å for Ba. The lattice volume changes from contraction with Be (−0.13%) to significant expansion with Ba (+1.47%), indicating greater lattice distortion as ion size increases. The 3D block elements, on the other hand, display smaller ionic radius variations (0.61 Å for Fe to 0.74 Å for Zn) and minor lattice expansions (+0.05% for Ni to +0.21% for Mn). Among the transition metals, Mn exhibits the highest charge transfer (+1.59 |e|), while Cu shows the lowest (+1.16 |e|), reflecting differences in bonding characteristics. Overall, alkaline earth metals cause more pronounced lattice distortions due to their larger size variations, whereas transition metals induce subtler changes, governed by electronic effects and covalency.
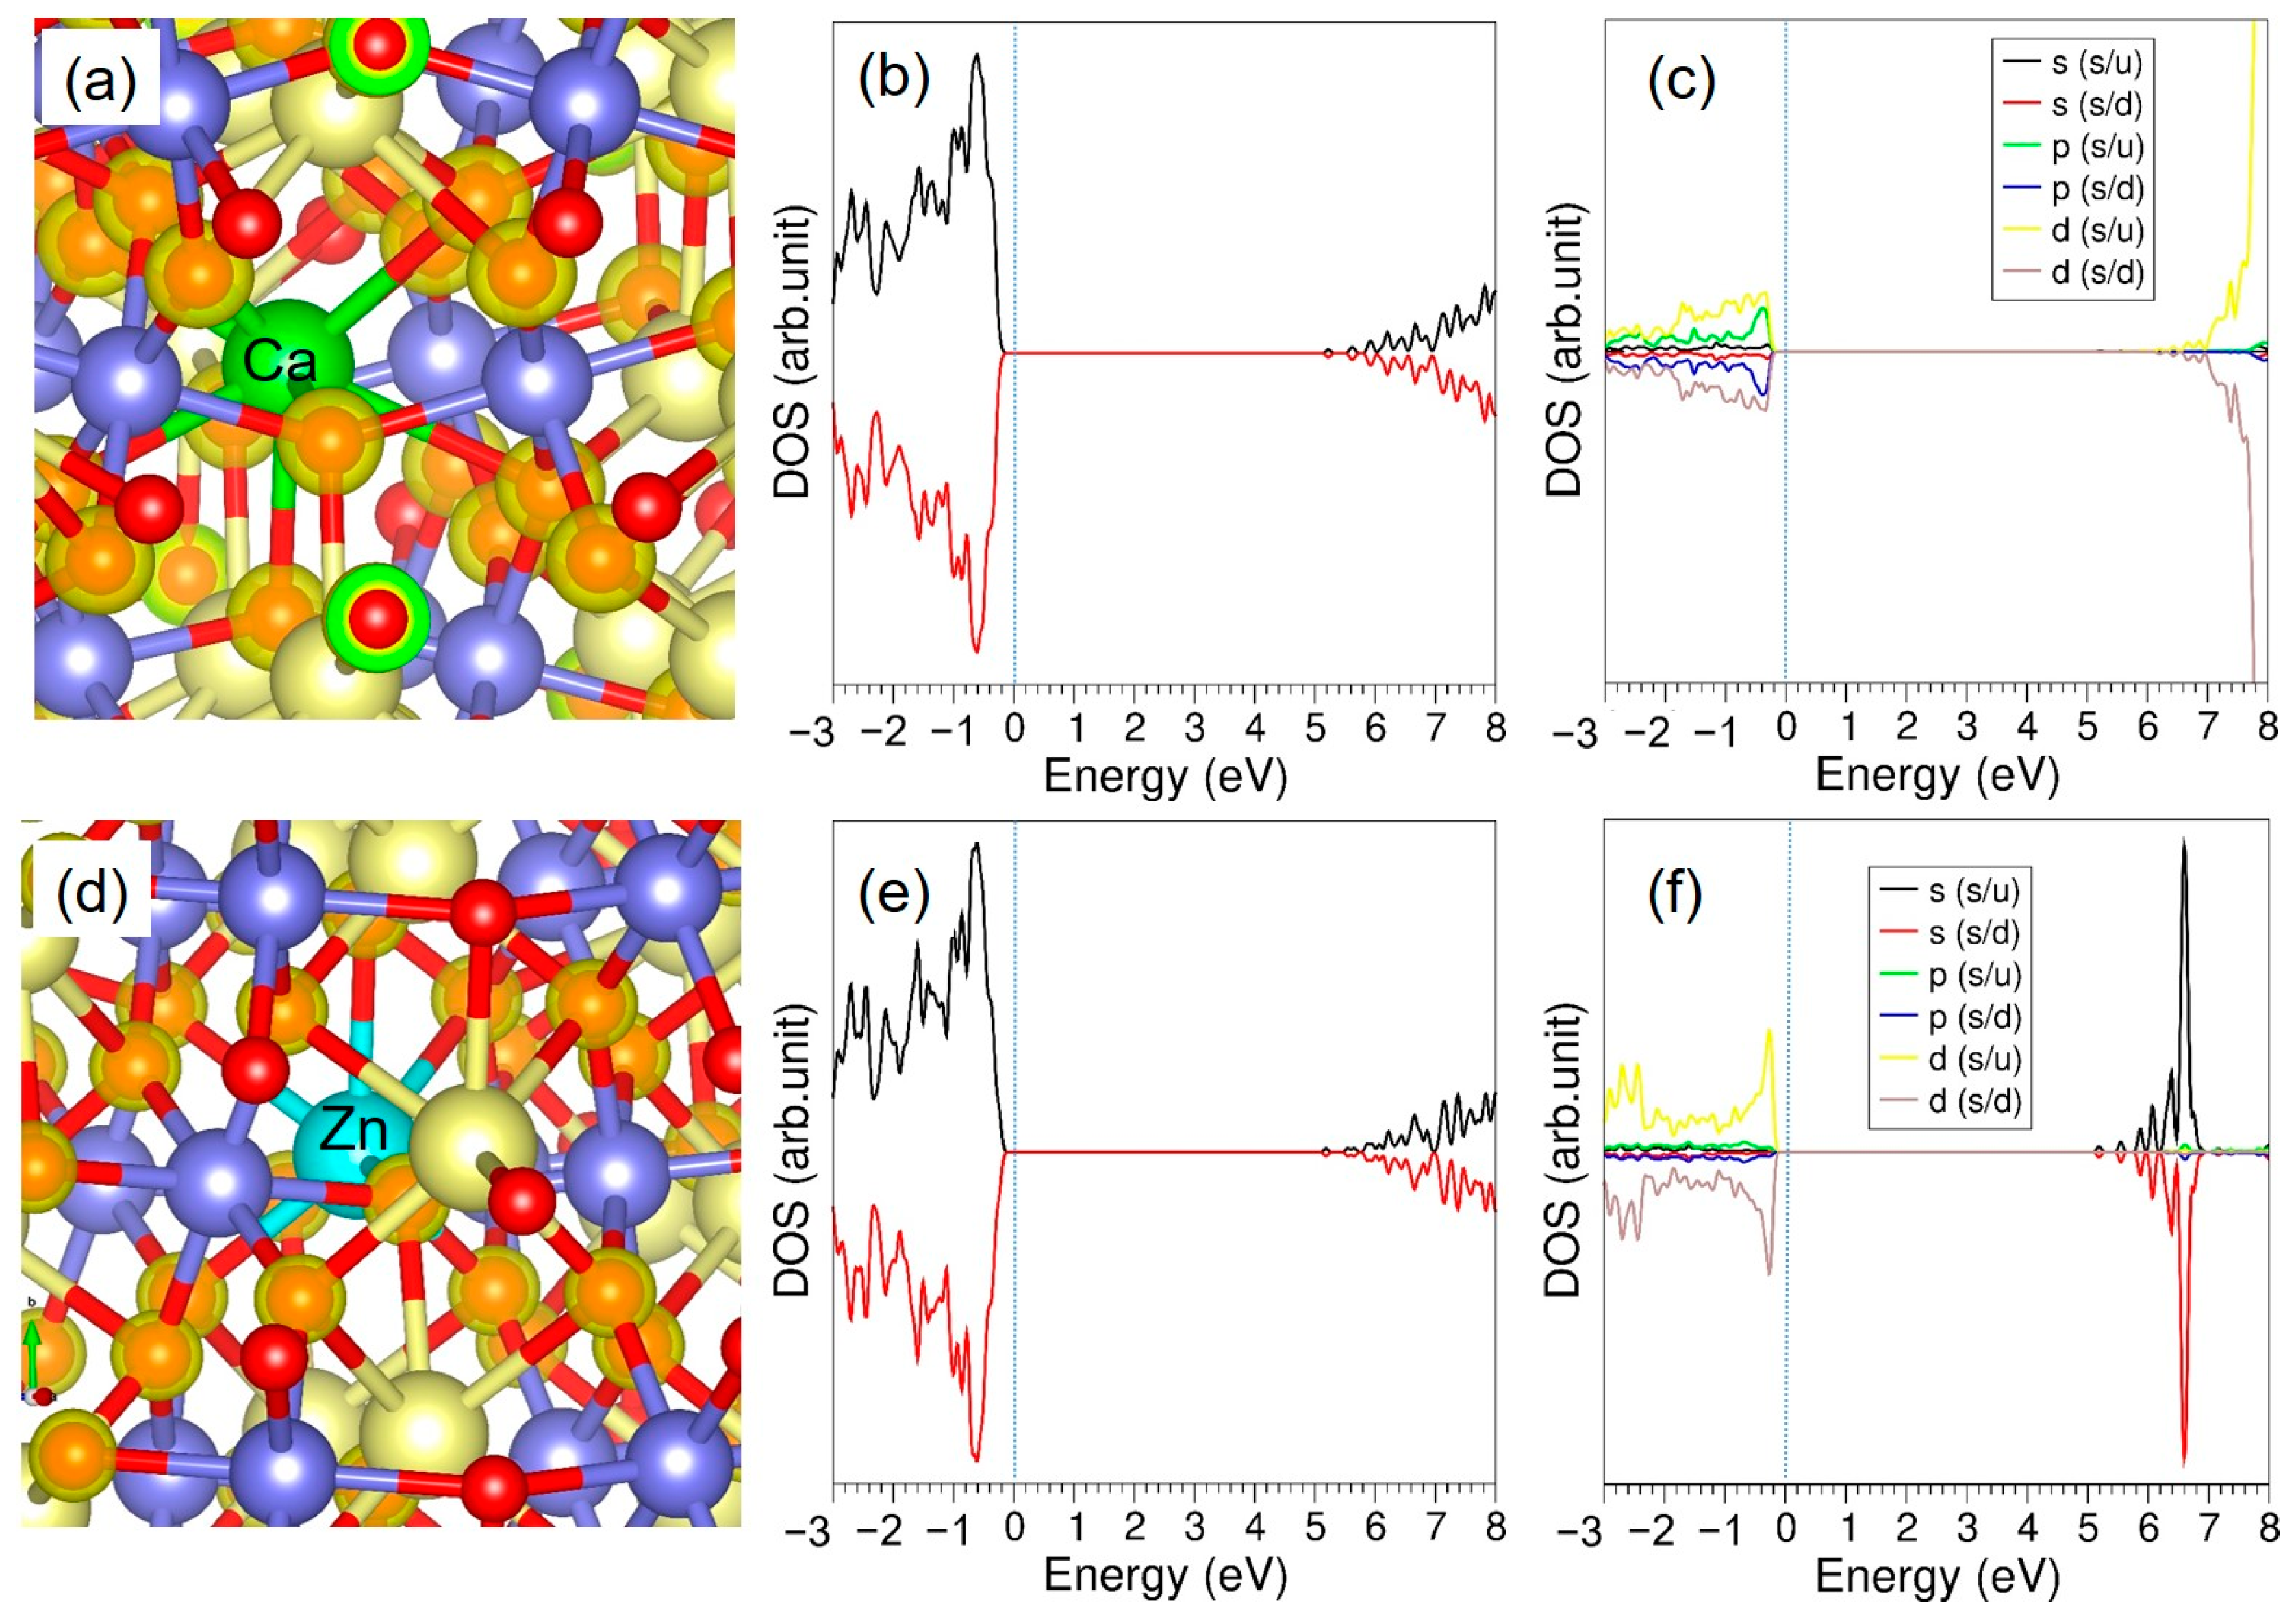
Ca doping induces significant lattice distortions due to its larger ionic radius and ionic bonding nature, while Zn doping causes subtler structural changes, but strongly influences the electronic structure through d-orbital contributions and partial covalent bonding. These differences reflect the contrasting effects of alkaline earth and transition metal dopants on the structural and electronic properties of host material. The total DOS shows weak electronic contributions near the Fermi level, reflecting the ionic bonding of Ca and limited interaction with the host lattice (see Figure 4). The PDOS of Ca indicates the negligible involvement of d-orbitals, with minor contributions from s and p orbitals. The total DOS of Zn shows localized electronic states near the Fermi level, highlighting the stronger interaction of Zn with the lattice. The PDOS of Zn reveals significant d-orbital contributions, especially near the Fermi level, indicating the role of Zn in enhancing covalent bonding and electronic coupling.
Figure 4. (a) Relaxed structure of Ca-doped MgSiO3, (b) its total DOS plot, and (c) atomic DOS plot of Ca. Corresponding structures and plots for Zn (df) are also provided.
Eng 06 00051 g004

3.3.2. Trivalent Dopants

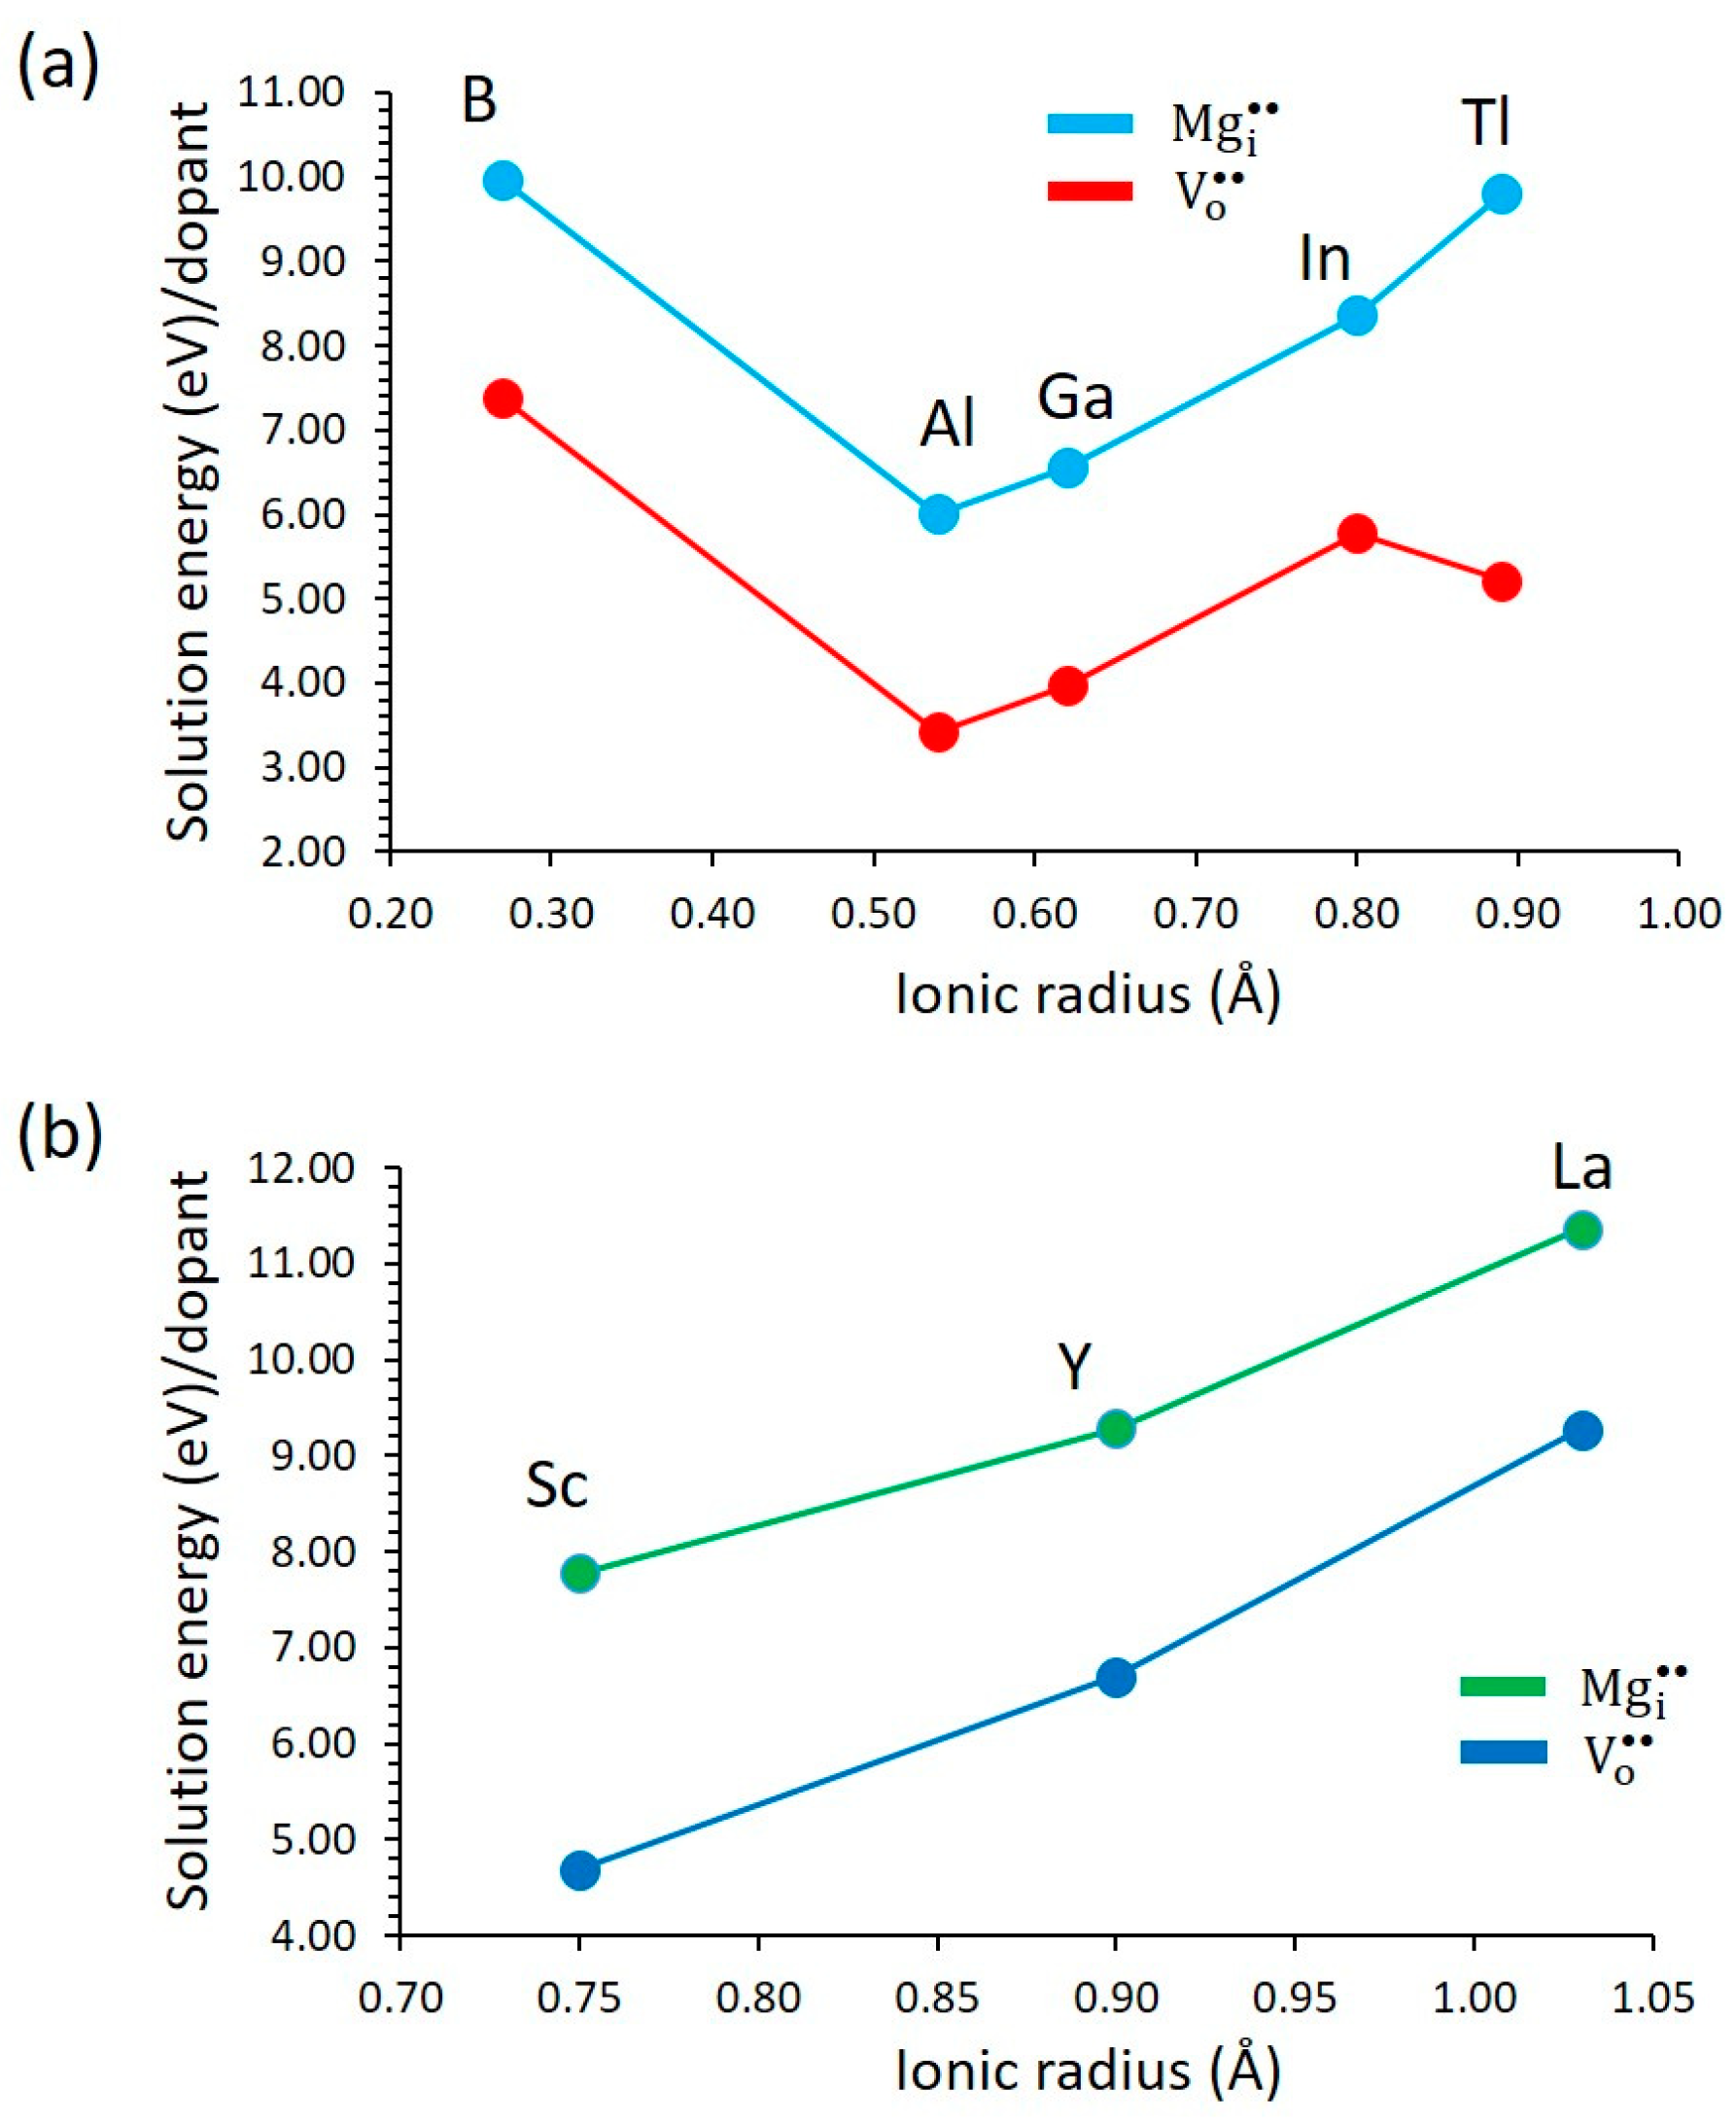
Trivalent substitutional dopants on Si sites lead to charge compensation via either interstitial magnesium defects ( M g ) or oxygen vacancies ( V O ). Figure 5 shows the solution energy per dopant as a function of the ionic radius for different dopants. In Figure 5a, Group 13 elements (B, Al, Ga, In, and Tl) are analyzed, showing that Al and Ga have the lowest solution energies, making them the most favorable dopants, whereas smaller (B) and larger (Tl) ions require higher energy. Oxygen vacancies created by Al substitution at the Si site can facilitate water incorporation as OH groups in the crystal structure of the mantle, playing a crucial role in its geochemical evolution [49]. Figure 5b examines Group 3 elements (Sc, Y, and La), demonstrating that solution energy increases with ionic radius, indicating that larger dopants are less favorable for incorporation. The most favorable dopant is noted to be Sc. These trends highlight the role of ion size in defect formation, where the choice of dopant significantly influences the defect chemistry of MgSiO3 and its potential applications. The formation of Mg interstitials can enhance the performance of Mg-ion batteries by increasing their capacity and improving Mg2+ ion transport within the MgSiO3 lattice. The presence of interstitial Mg atoms creates additional charge carriers, facilitating higher ionic conductivity and more efficient diffusion pathways. This can lead to faster charge–discharge cycles and improved electrochemical performance. Furthermore, enhanced Mg2+ mobility can reduce polarization effects, contributing to better cycling stability and overall battery efficiency. These advantages make MgSiO3 a promising material for next-generation Mg-ion battery applications.
1 2 M 2 O 3 + S i S i X + 1 2 M g O M S i + 1 2 M g + S i O 2
1 2 M 2 O 3 + S i S i X + 1 2 O o X M S i + 1 2 V O + S i O 2
Table 5 presents the key structural and electronic properties of various trivalent dopants (M3+) in MgSiO3, including their ionic radius, Bader charge, M-O bond length, and relative volume change after doping. As the ionic radius increases, the M-O bond length also increases, with Group 13 dopants showing a progressive expansion from 1.74 Å (B-O) to 2.20 Å (Tl-O), while Group 3 dopants exhibit bond lengths ranging from 2.03 Å (Sc-O) to 2.23 Å (La-O). The Bader charge analysis reveals that Group 13 dopants maintain a consistent +3.00 |e| charge. In contrast, Group 3 dopants display slightly lower values (+1.93 to +2.11 |e|), indicating weaker electron localization and a shift toward covalent bonding. The volume change follows a similar trend, where smaller dopants like B3+ cause slight lattice contraction (−0.21%), while larger dopants such as Tl3+ (+1.94%) and La3+ (+2.38%) significantly expand the structure. These trends suggest that smaller dopants enhance lattice stability, whereas larger dopants introduce structural distortions, potentially affecting the material’s defect formation, carrier mobility, and mechanical integrity.
Figure 6 shows a comparative analysis of the structural and electronic properties of Al- and Sc-doped MgSiO3 using atomic structure visualizations and DOS plots. Figures (a) and (d) depict the atomic structures, highlighting the positions of the Al and Sc dopants within the host lattice. The DOS plots in panels (b) and (e) show the total density of electronic states for the Al- and Sc-doped systems, respectively, where the conduction and valence bands are separated by a band gap. The atomic DOS plots in panels (c) and (f) further decompose the contributions of different atomic orbitals, illustrating how Al and Sc influence the electronic structure of MgSiO3. Notably, Sc doping introduces significant d-orbital contributions, as shown in panel (f), which can impact conductivity and electronic transitions, while Al doping primarily affects s- and p-orbital states (panel c). These differences suggest that Al and Sc modify the band structure in distinct ways, potentially affecting charge carrier mobility and defect formation in the material.

3.3.3. Tetravalent Dopants

Finally, tetravalent dopants were introduced at the Si site. Since this substitution involves replacing an atom with another of the same valence state, no charge-compensating defects were taken into account, as represented by the following equation:
M O 2 + S i S i X M S i X + S i O 2
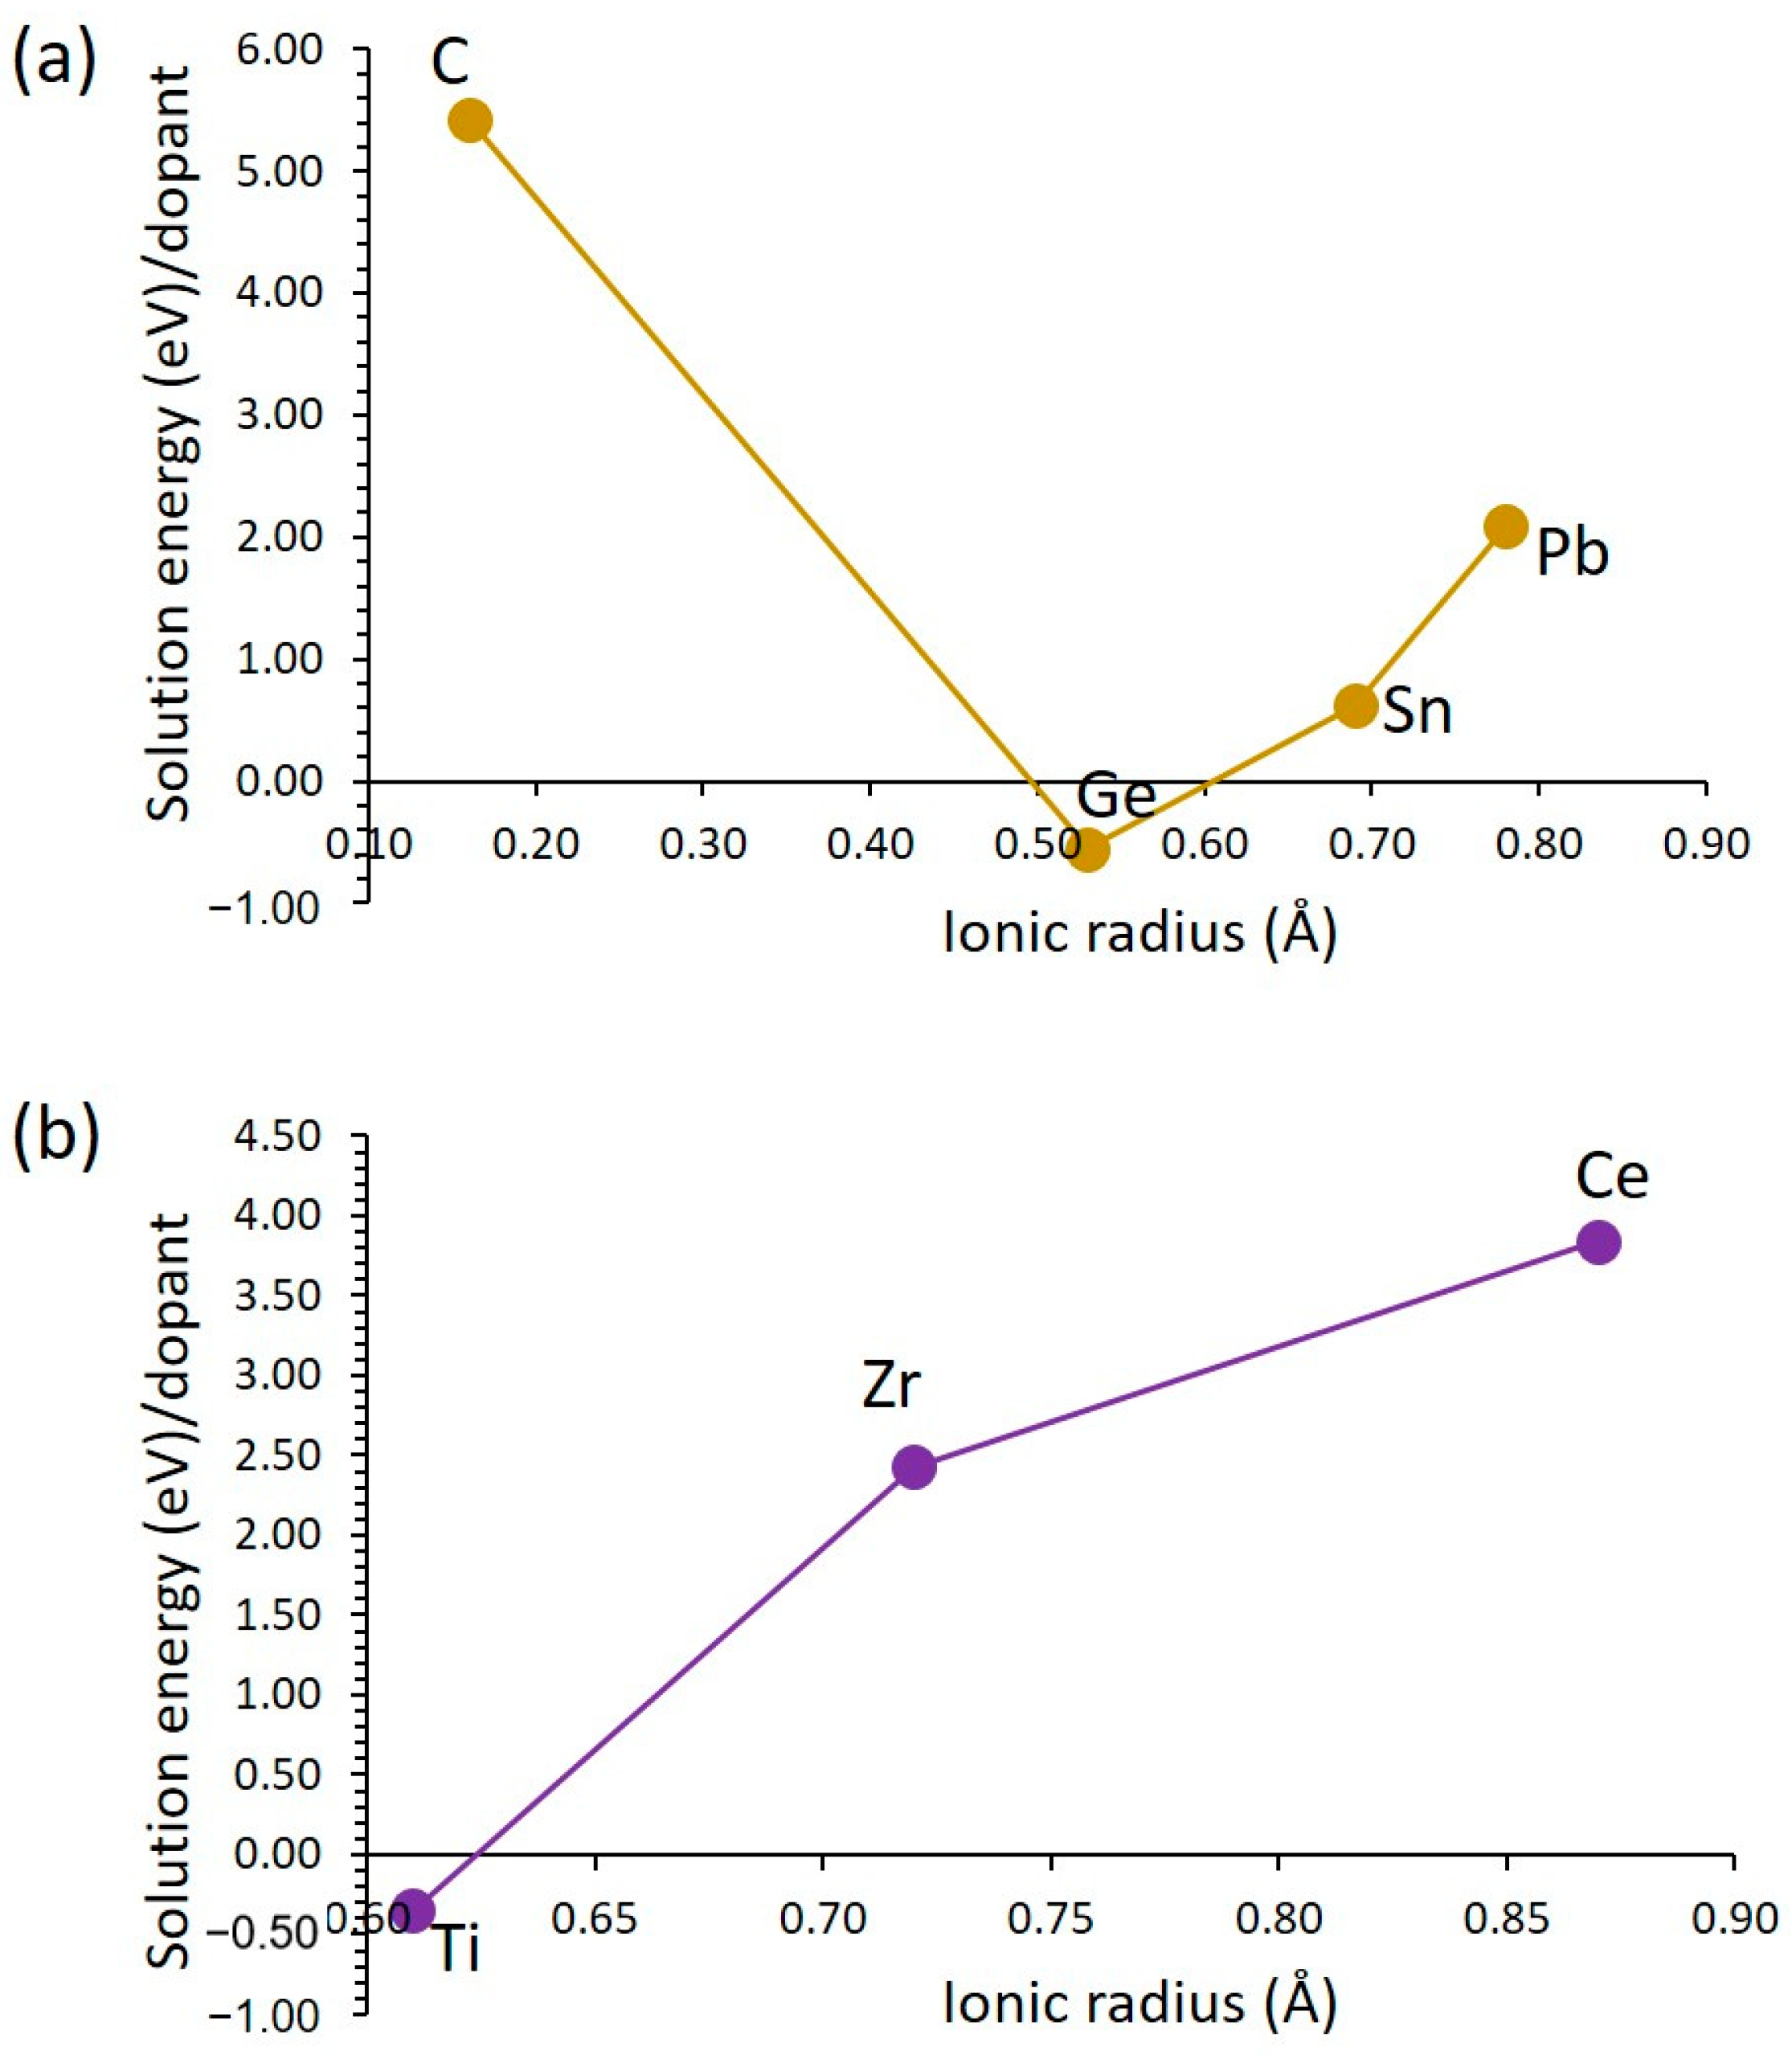
Figure 7 illustrates the solution energy per dopant as a function of the ionic radius for different dopants, providing insights into their thermodynamic stability in the host material. In Figure 7a, Group 14 elements (C, Ge, Sn, and Pb) are analyzed, showing a significant decrease in solution energy from C to Ge, indicating that Ge is the most favorable dopant among them. However, as the ionic radius increases from Ge to Sn and Pb, the solution energy rises, suggesting that larger dopants are less stable. In Figure 7b, Group 4 elements (Ti, Zr, and Ce) are examined, where Ti exhibits the lowest solution energy, implying the highest stability. As the ionic radius increases from Ti to Ce, the solution energy increases, indicating that larger dopants require more energy for incorporation. These trends suggest that dopant selection strongly depends on ionic size; while mid-sized dopants like Ge and Ti are more favorable for substitution, significantly smaller or larger dopants result in higher energy costs, making them less thermodynamically stable.
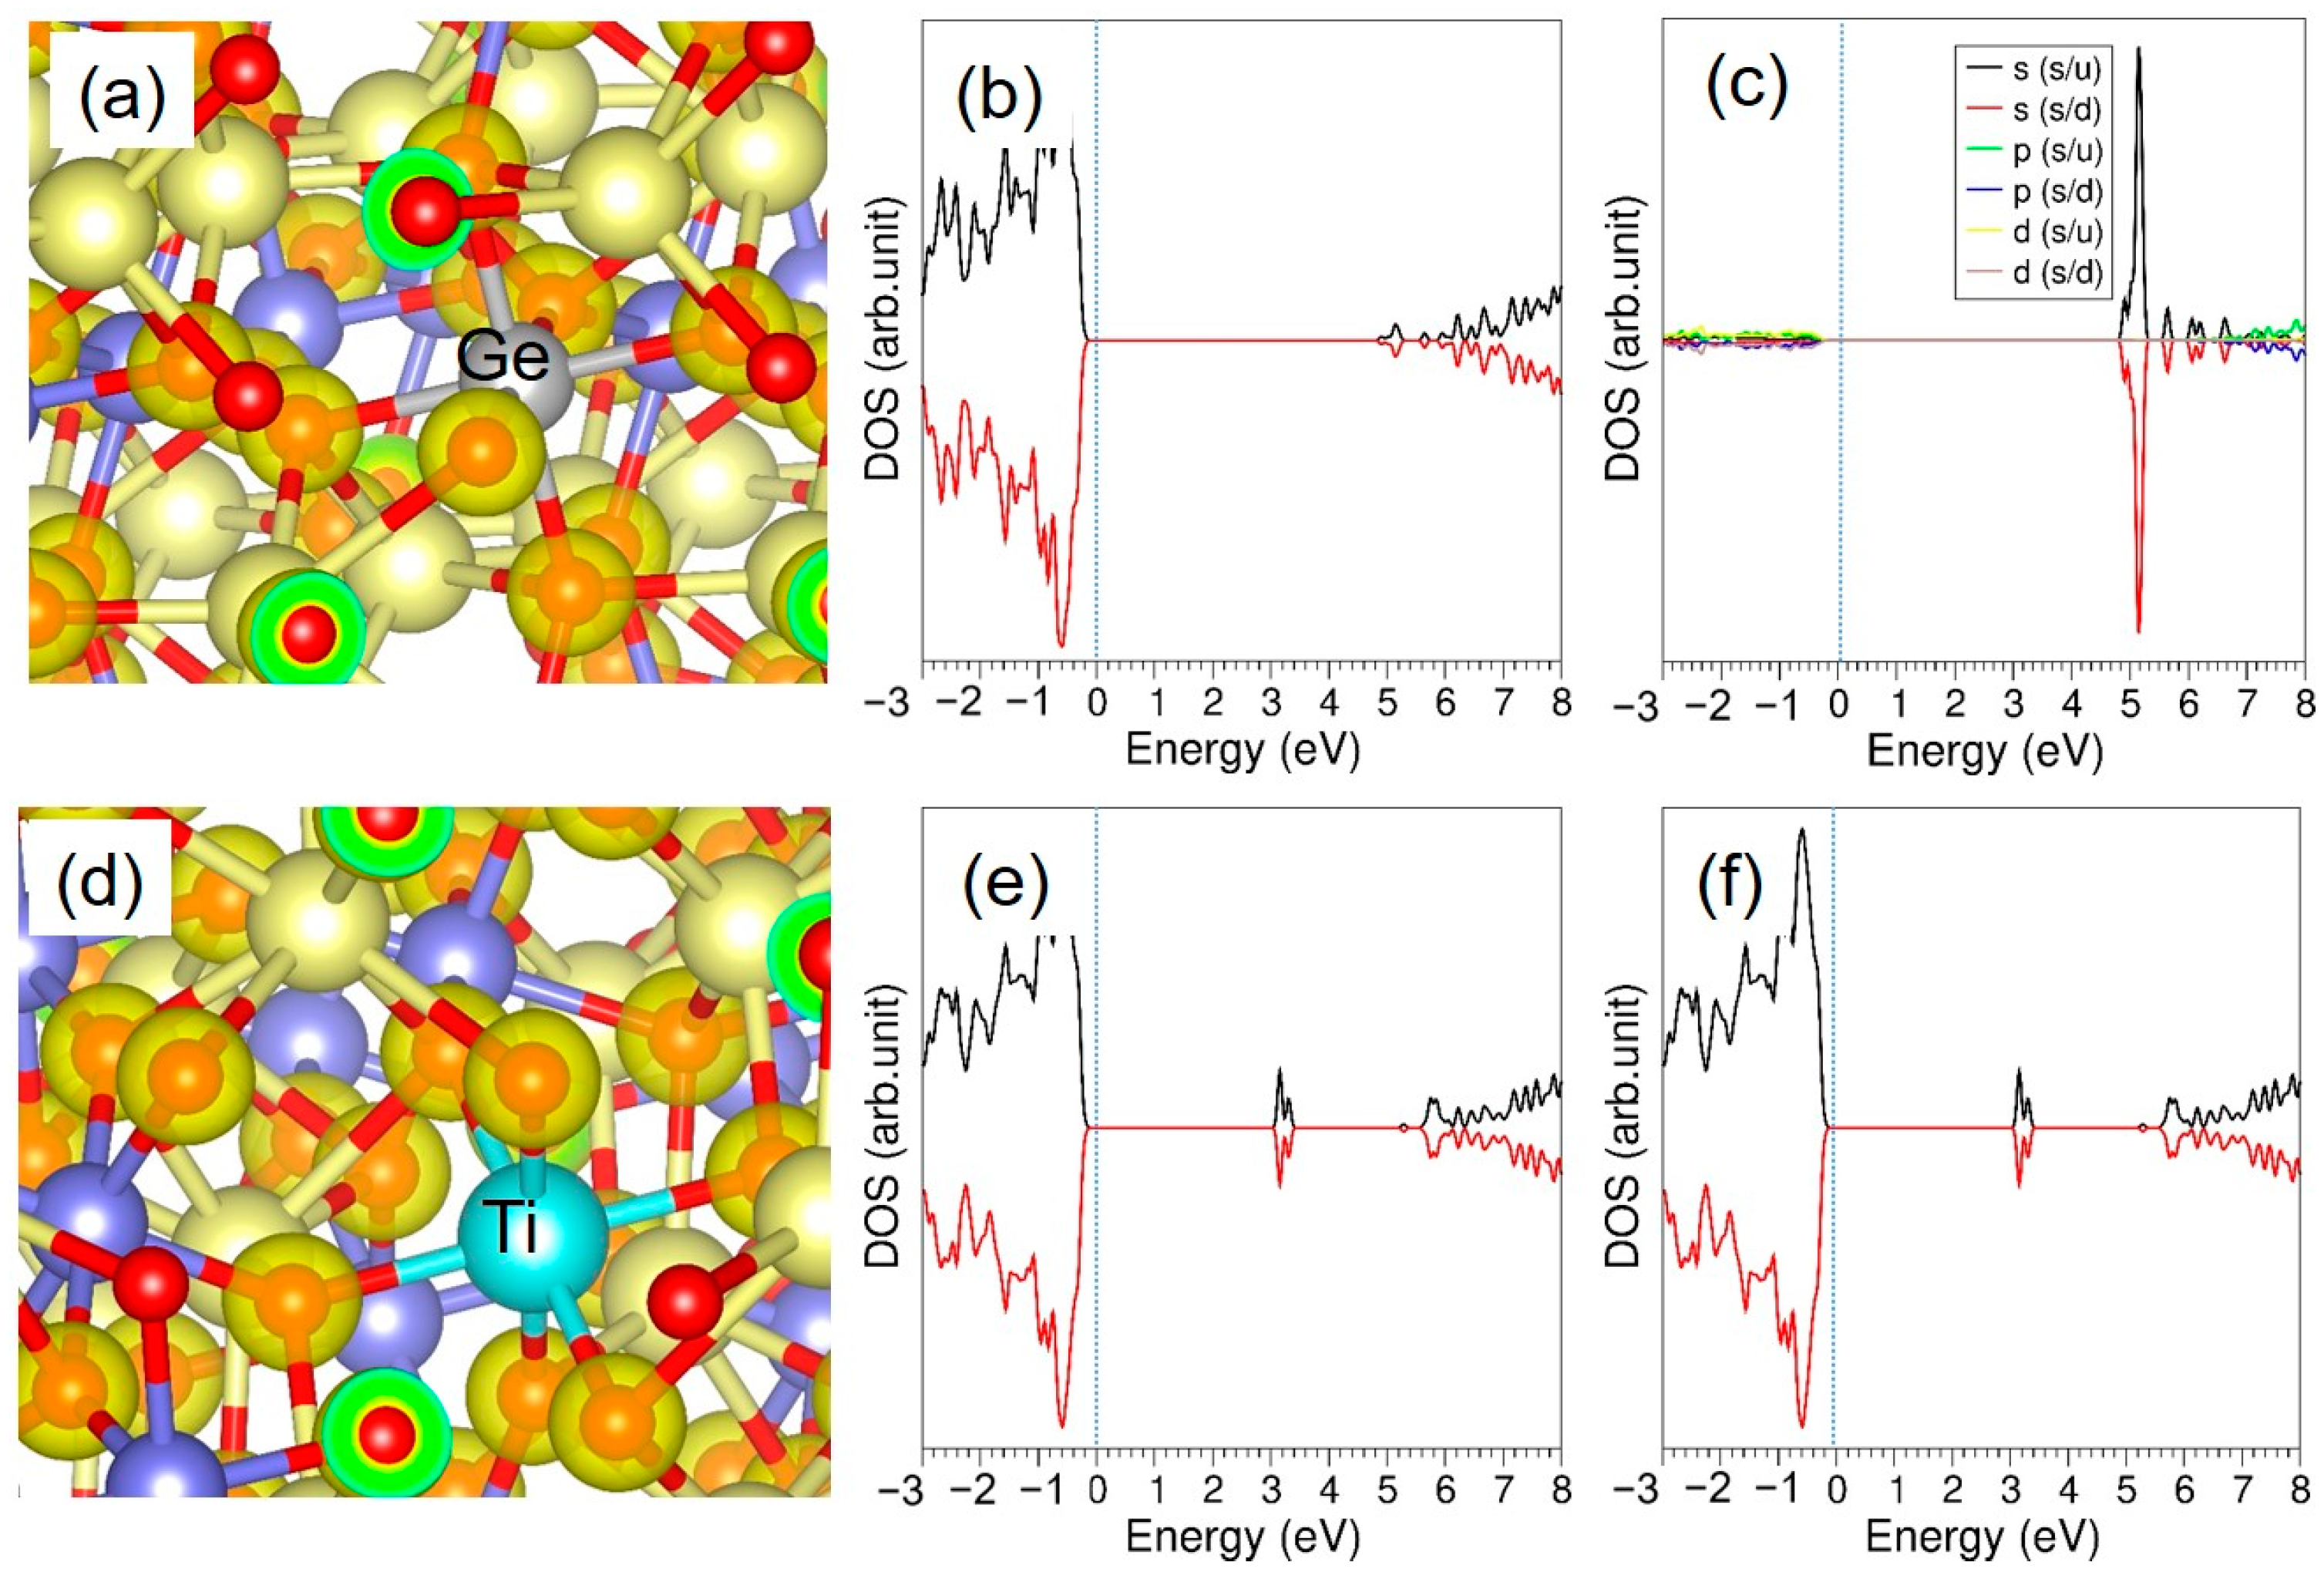
For Group 14 dopants, all maintain a consistent +4.00 |e| Bader charge, indicating strong ionic bonding (see Table 6). The M-O bond distance increases with the ionic radius, ranging from 1.65–1.79 Å for C to 2.49–2.94 Å for Pb, suggesting greater lattice distortion with larger dopants. The relative volume change also follows this trend, with Ge causing the least expansion (+0.46%), while larger dopants like Pb exhibit significant lattice swelling (+1.60%) (see Table 6). For Group 4 dopants, the Bader charge varies, with Ti (+2.67 |e|) and Ce (+2.19 |e|) exhibiting lower oxidation states than Zr (+3.52 |e|), indicating different charge compensation mechanisms. The M-O bond distance increases from Ti (1.93–1.95 Å) to Ce (2.12–2.16 Å), and the volume expansion follows a similar trend, with Ti causing the least distortion (+0.68%) and Ce inducing the most (+1.96%) (see Table 6). These results suggest that mid-sized dopants (Ge, Ti) are more structurally compatible, causing minimal lattice strain, whereas larger dopants (Pb, Ce) lead to significant expansion and distortion, which could impact material stability and electronic properties.
Figure 8 provides a comparative analysis of the electronic structure of two different atomic configurations, featuring Ge and Ti substitutions in MgSiO3. Panels (a) and (d) display atomic structures, highlighting the positions of Ge and Ti within the material. Panels (b) and (e) show the density of states (DOS) plots, illustrating the distribution of electronic states as a function of energy. These plots indicate the impact of Ge and Ti substitutions on the electronic properties. Panels (c) and (f) further decompose the DOS into contributions from different atomic orbitals, revealing the hybridization and interactions between states. The doping of Ti introduces states arising from the d-orbitals of Ti (see Figure 8e,f).

4. Conclusions

In summary, a theoretical investigation of the MgSiO3 structure, supported by detailed computational calculations, has provided valuable insights into the complex behavior of intrinsic defects and dopant incorporation. Notably, the Mg-Si anti-site defect emerges as an energy-efficient process. Isovalent doping indicates a preference for Ca and Zn at the Mg site, offering a promising direction for advancing Mg-based materials research. Additionally, aliovalent doping of Al and Sc at the Si site can lead to the formation of Mg interstitials and oxygen vacancies, with oxygen vacancy formation being the more energetically favorable process. Ge and Ti also preferentially substitute at the Si site without inducing charge-compensating defects. These selective dopants present potential opportunities for fine-tuning the properties of MgSiO3-based glass materials.

Author Contributions

Conceptualization, K.P. and N.K.; methodology, N.K.; validation, N.K., K.P. and P.I.; formal analysis, K.P., P.I. and P.A.; investigation, K.P. and N.K.; writing—original draft preparation, N.K. and K.P.; writing—review and editing, N.K.; supervision, N.K., P.I. and P.A. All authors have read and agreed to the published version of the manuscript.

Funding

This research received no external funding.

Data Availability Statement

The original data presented in this study are included in the article; further inquiries can be made to the corresponding author.

Acknowledgments

We acknowledge HPC services at Imperial College London for providing computational services. ChatGPT was used to polish the English.

Conflicts of Interest

The authors declare no conflicts of interest.

References

  1. Vandeginste, V.; Lim, C.; Ji, Y. Exploratory Review on Environmental Aspects of Enhanced Weathering as a Carbon Dioxide Removal Method. Minerals 2024, 14, 75. [Google Scholar] [CrossRef]
  2. Ma, D.; Duan, H.; Zhang, J.; Bai, H. A state-of-the-art review on rock seepage mechanism of water inrush disaster in coal mines. Int. J. Coal Sci. Technol. 2022, 9, 50. [Google Scholar] [CrossRef]
  3. Yao, D.; Jiang, N.; Wang, X.; Jia, X.; Lv, K. Mechanical behaviour and failure characteristics of rocks with composite defects of different angle fissures around hole. Bull. Eng. Geol. Environ. 2022, 81, 290. [Google Scholar] [CrossRef]
  4. Shi, T.; Fu, J.; Song, W.; Wang, J.; Y, K.M. Effect of internal fractures on mechanical properties and failure of sandstone under multi-physical fields. Heliyon 2024, 10, e24312. [Google Scholar] [CrossRef] [PubMed]
  5. Criniti, G.; Kurnosov, A.; Boffa Ballaran, T.; Frost, D.J. Single-Crystal Elasticity of MgSiO3 Bridgmanite to Mid-Lower Mantle Pressure. J. Geophys. Res. Solid Earth 2021, 126, e2020JB020967. [Google Scholar] [CrossRef]
  6. Sharp, T.G.; Lingemann, C.M.; Dupas, C.; Stöffler, D. Natural Occurrence of MgSiO3-Ilmenite and Evidence for MgSiO3-Perovskite in a Shocked L Chondrite. Science 1997, 277, 352–355. [Google Scholar] [CrossRef]
  7. Vanpeteghem, C.B.; Zhao, J.; Angel, R.J.; Ross, N.L.; Bolfan-Casanova, N. Crystal structure and equation of state of MgSiO3 perovskite. Geophys. Res. Lett. 2006, 33. [Google Scholar] [CrossRef]
  8. Howard, C.; Stokes, H. Structures and phase transitions in perovskites—A group-theoretical approach. Acta Crystallogr. Sect. A 2004, 61, 93–111. [Google Scholar] [CrossRef]
  9. Karki, B.B.; Stixrude, L.; Clark, S.J.; Warren, M.C.; Ackland, G.J.; Crain, J. Elastic properties of orthorhombic MgSiO3 perovskite at lower mantle pressures. Am. Mineral. 1997, 82, 635–638. [Google Scholar] [CrossRef]
  10. Kim, Y.H.; Yi, Y.S.; Kim, H.I.; Chow, P.; Xiao, Y.; Shen, G.; Lee, S.K. Structural Transitions in MgSiO3 Glasses and Melts at the Core-Mantle Boundary Observed via Inelastic X-ray Scattering. Geophys. Res. Lett. 2019, 46, 13756–13764. [Google Scholar] [CrossRef]
  11. Kono, Y.; Shibazaki, Y.; Kenney-Benson, C.; Wang, Y.; Shen, G. Pressure-induced structural change in MgSiO3 glass at pressures near the Earth’s core-mantle boundary. Proc. Natl. Acad. Sci. USA 2018, 115, 1742–1747. [Google Scholar] [CrossRef]
  12. Sinogeikin, S.V.; Zhang, J.; Bass, J.D. Elasticity of single crystal and polycrystalline MgSiO3 perovskite by Brillouin spectroscopy. Geophys. Res. Lett. 2004, 31, 6. [Google Scholar] [CrossRef]
  13. Goel, A.; Tulyaganov, D.U.; Shaaban, E.R.; Knee, C.S.; Eriksson, S.; Ferreira, J.M.F. Structure and crystallization behaviour of some MgSiO3-based glasses. Ceram. Int. 2009, 35, 1529–1538. [Google Scholar] [CrossRef]
  14. Mariñoso Guiu, J.; Ghejan, B.-A.; Bernhardt, T.M.; Bakker, J.M.; Lang, S.M.; Bromley, S.T. Cluster Beam Study of (MgSiO3)+-Based Monomeric Silicate Species and Their Interaction with Oxygen: Implications for Interstellar Astrochemistry. ACS Earth Space Chem. 2022, 6, 2465–2470. [Google Scholar] [CrossRef]
  15. Song, R.; Yang, L.; Luan, J.; Yuan, H.; Ji, S.; Wan, D.; Liu, J.; Hu, W.; Zhong, C. MgSiO3 doped, carbon-coated SiOx anode with enhanced initial coulombic efficiency for lithium-ion battery. J. Energy Storage 2025, 105, 114687. [Google Scholar] [CrossRef]
  16. Lin, L.; Min, Y.; Chaoshu, S.; Weiping, Z.; Baogui, Y. Synthesis and Luminescence Properties of Red Phosphors: Mn2+ Doped MgSiO3 and Mg2SiO4 Prepared by Sol-Gel Method. J. Rare Earths 2006, 24, 104–107. [Google Scholar] [CrossRef]
  17. Moncorgé, R.; Capobianco, J.A.; Bettinelli, M.; Cavalli, E.; Girard, S.; Guyot, Y. Cr:MgSiO3, a Cr doped crystal with long fluorescence lifetime and broad-band emission around 1.52 µm. In Advanced Solid State Lasers, Coeur d’Alene, Idaho, 1998/02/02; Bosenberg, W., Fejer, M., Eds.; Optica Publishing Group: Washington, DC, USA, 1998; Volume 19, p. CS16. [Google Scholar]
  18. Kuganathan, N.; Kordatos, A.; Anurakavan, S.; Iyngaran, P.; Chroneos, A. Li3SbO4 lithium-ion battery material: Defects, lithium ion diffusion and tetravalent dopants. Mater. Chem. Phys. 2019, 225, 34–41. [Google Scholar] [CrossRef]
  19. Kuganathan, N.; Ganeshalingam, S.; Chroneos, A. Defects, Diffusion, and Dopants in Li2Ti6O13: Atomistic Simulation Study. Materials 2019, 12, 2851. [Google Scholar] [CrossRef]
  20. Santos, A.L.D.S.; Freire, E.B.; Bispo, G.F.D.C.; Jackson, R.A.; Macedo, Z.S.; Valerio, M.E. A comparison of oxygen Frenkel formation and rare earth doping in the Lu2SiO5 and Y2SiO5 orthosilicates using a computer modelling approach. Comput. Mater. Sci. 2024, 243, 113125. [Google Scholar] [CrossRef]
  21. Freire, E.B.V.; Santos, A.L.d.S.; Bispo, G.F.d.C.; Macedo, Z.S.; Jackson, R.A.; Valerio, M.E.G. Local modification of the crystalline structure due to co-doping with RE3+ in cadmium metasilicate. Ceram. Int. 2024, 50 Part A, 22534–22543. [Google Scholar] [CrossRef]
  22. Kuganathan, N.; Kelaidis, N.; Chroneos, A. Defect Chemistry, Sodium Diffusion and Doping Behaviour in NaFeO2 Polymorphs as Cathode Materials for Na-Ion Batteries: A Computational Study. Materials 2019, 12, 3243. [Google Scholar] [CrossRef] [PubMed]
  23. Karki, B.B.; Khanduja, G. Computer simulation and visualization of vacancy defects in MgSiO3 perovskite. Model. Simul. Mater. Sci. Eng. 2006, 14, 1041. [Google Scholar] [CrossRef]
  24. Ammann, M.W.; Brodholt, J.P.; Dobson, D.P. DFT study of migration enthalpies in MgSiO3 perovskite. Phys. Chem. Miner. 2009, 36, 151–158. [Google Scholar] [CrossRef]
  25. Stashans, A.; Rivera, K.; Pinto, H.P. First-principles investigation of Fe-doped MgSiO3-ilmenite. Phys. B Condens. Matter 2012, 407, 2037–2043. [Google Scholar] [CrossRef]
  26. Stashans, A.; Eras, L.; Chamba, G. Modelling of Al impurity in perovskite and ilmenite structures of MgSiO3. Phys. Chem. Miner. 2010, 37, 191–199. [Google Scholar] [CrossRef]
  27. Kaushalya, R.; Iyngaran, P.; Kuganathan, N.; Chroneos, A. Defect, Diffusion and Dopant Properties of NaNiO2: Atomistic Simulation Study. Energies 2019, 12, 3094. [Google Scholar] [CrossRef]
  28. Zhao, Y.; Cormack, A.N.; Wu, Y. Atomistic Simulations of Defect Structures in Rare-Earth-Doped Magnesium Oxide. Crystals 2024, 14, 384. [Google Scholar] [CrossRef]
  29. Bispo, G.F.C.; Nascimento, D.S.; Santana, L.B.; Ferreira, G.S.; Macedo, Z.S.; Lima, H.R.B.R.; Souza, S.O.; d’Errico, F.; Jackson, R.A.; Valerio, M.E.G. Defects in MgB4O7 (pure and doped with lanthanides): A case study using a computational modelling approach. Phys. B Condens. Matter 2022, 640, 414049. [Google Scholar] [CrossRef]
  30. Freire, E.B.V.; Santos, A.L.d.S.; Bispo, G.F.d.C.; Macedo, Z.S.; Jackson, R.A.; Valerio, M.E.G. Effect of trivalent rare earth doping in cadmium silicates hosts: A theoretical study. Phys. Scr. 2022, 97, 125829. [Google Scholar] [CrossRef]
  31. Gale, J.D.; Rohl, A.L. The General Utility Lattice Program (GULP). Mol. Simul. 2003, 29, 291–341. [Google Scholar] [CrossRef]
  32. Kuganathan, N.; Chroneos, A. Atomic-scale studies of garnet-type Mg3Fe2Si3O12: Defect chemistry, diffusion and dopant properties. J. Power Sources Adv. 2020, 3, 100016. [Google Scholar] [CrossRef]
  33. Gale, J.D. GULP: A computer program for the symmetry-adapted simulation of solids. J. Chem. Soc. Faraday Trans. 1997, 93, 629–637. [Google Scholar] [CrossRef]
  34. Mott, N.F.; Littleton, M.J. Conduction in polar crystals. I. Electrolytic conduction in solid salts. Trans. Faraday Soc. 1938, 34, 485–499. [Google Scholar] [CrossRef]
  35. Kresse, G.; Furthmüller, J. Efficient iterative schemes for ab initio total-energy calculations using a plane-wave basis set. Phys. Rev. B 1996, 54, 11169–11186. [Google Scholar] [CrossRef]
  36. Perdew, J.P.; Burke, K.; Ernzerhof, M. Generalized Gradient Approximation Made Simple. Phys. Rev. Lett. 1996, 77, 3865–3868. [Google Scholar] [CrossRef] [PubMed]
  37. Blöchl, P.E. Projector augmented-wave method. Phys. Rev. B 1994, 50, 17953–17979. [Google Scholar] [CrossRef]
  38. Monkhorst, H.J.; Pack, J.D. Special points for Brillouin-zone integrations. Phys. Rev. B 1976, 13, 5188–5192. [Google Scholar] [CrossRef]
  39. Press, W.H.; Teukolsky, S.A.; Vetterling, W.T.; Flannery, B.P. Numerical Recipes in C, 2nd ed.; The Art of Scientific Computing; Cambridge University Press: Cambridge, UK, 1992. [Google Scholar]
  40. Henkelman, G.; Arnaldsson, A.; Jónsson, H. A fast and robust algorithm for Bader decomposition of charge density. Comput. Mater. Sci. 2006, 36, 354–360. [Google Scholar] [CrossRef]
  41. Kudoh, Y.; Ito, E.; Takeda, H. Effect of pressure on the crystal structure of perovskite-type MgSiO3. Phys. Chem. Miner. 1987, 14, 350–354. [Google Scholar] [CrossRef]
  42. Spitaler, J.; Estreicher, S.K. Perspectives on the Theory of Defects. Front. Mater. 2018, 5, 70. [Google Scholar] [CrossRef]
  43. Kim, Y. Theoretical investigation of the cation antisite defect in layer-structured cathode materials for Li-ion batteries. Phys. Chem. Chem. Phys. 2019, 21, 24139–24146. [Google Scholar] [CrossRef] [PubMed]
  44. Kempaiah Devaraju, M.; Duc Truong, Q.; Hyodo, H.; Sasaki, Y.; Honma, I. Synthesis, characterization and observation of antisite defects in LiNiPO4 nanomaterials. Sci. Rep. 2015, 5, 11041. [Google Scholar] [CrossRef] [PubMed]
  45. Kröger, F.A.; Vink, H.J. Relations between the Concentrations of Imperfections in Crystalline Solids. In Solid State Physics; Seitz, F., Turnbull, D., Eds.; Academic Press: Cambridge, MA, USA, 1956; Volume 3, pp. 307–435. [Google Scholar]
  46. Wall, A.; Price, G.D. Defects and diffusion in MgSiO3 perovskite: A computer simulation. In Perovskite: A Structure of Great Interest to Geophysics and Materials Science; American Geophysical Union: Washington, DC, USA, 1989; pp. 45–53. [Google Scholar]
  47. Smyth, D.M. The effects of dopants on the properties of metal oxides. Solid State Ion. 2000, 129, 5–12. [Google Scholar] [CrossRef]
  48. Alfredsson, M.; Corà, F.; Brodholt, J.P.; Parker, S.C.; Price, G.D. Crystal morphology and surface structures of orthorhombic MgSiO3 in the presence of divalent impurity ions. Phys. Chem. Miner. 2005, 32, 379–387. [Google Scholar] [CrossRef]
  49. Ishii, T.; McCammon, C.; Katsura, T. Iron and aluminum substitution mechanism in the perovskite phase in the system MgSiO3-FeAlO3-MgO. Am. Mineral. 2023, 108, 738–743. [Google Scholar] [CrossRef]
Figure 1. (a) Crystal structure of MgSiO3, (b) its DOS plot, and (c) charge density plot showing the electron distribution.
Eng 06 00051 g001
Figure 2. Defect energy processes and their reaction energies.
Eng 06 00051 g002
Figure 5. Solution energies of (a) Group 13 and (b) Group 3 dopants regarding their ionic radii.
Eng 06 00051 g005
Figure 6. (a) Relaxed structure of Al-doped MgSiO3, (b) its total DOS plot, and (c) atomic DOS plot of Al. Corresponding structures and plots for Sc (df) are also provided.
Eng 06 00051 g006
Figure 7. Solution energies of (a) Group 14 and (b) Group 4 metal dopants regarding their ionic radii.
Eng 06 00051 g007
Figure 8. (a) Relaxed structure of Ge-doped MgSiO3, (b) its total DOS plot, and (c) atomic DOS plot of Ge. Corresponding structures and plots (df) for Ti are also provided.
Eng 06 00051 g008
Table 1. The Buckingham potential parameters utilized for modeling the crystal structure of MgSiO3 are based on established values from previous studies [32]. The two-body interaction [Φij (rij) = Aij exp (−rij/ρij) − Cij/rij6], where A, ρ, and C are parameters fitted to reproduce experimental data. The parameters Y and K represent shell charges and spring constants, respectively.
InteractionA/eVρC/eV·Å6Y/eK/eV·Å−2
Mg2+–O2−946.6270.31810.002.0099,999
Si4+–O2−1283.910.32050.004.0099,999
O2–O2−22,764.00.149027.89−2.8674.92
Table 2. Calculated and experimental lattice parameters of MgSiO3.
Lattice PropertiesCalculatedExperiment [41]|∆|(%)
ClassicalDFTClassicalDFT
a (Å)4.864.824.752.321.47
b (Å)4.884.974.910.611.22
c (Å)6.896.976.850.581.75
α = β = γ (°)90.090.090.00.000.00
V (Å3)163.1166.9159.62.194.57
Table 3. Bader charges calculated on the atoms in bulk MgSiO3.
AtomBader Charge (e)
Mg+2.00
Si+4.00
O−2.00
Table 4. Bader charges on the divalent dopants, M-O bond distances, and changes in the volume of the doped configurations.
Dopant Ionic Radius of Dopant Ion (Å)Bader Charge on Dopant (|e|)M-O Distance(Å) Δ V V × 100   ( % )
Be2+0.59+2.001.69–1.79−0.13
Ca2+1.00+1.502.19–2.38+0.50
Sr2+1.18+1.512.25–2.47+0.89
Ba2+1.35+1.492.49–2.61+1.47
Fe2+0.61+1.462.09–2.28+0.10
Co2+0.65+1.332.07–2.21+0.07
Mn2+0.67+1.592.10–2.36+0.21
Ni2+0.69+1.261.98–2.21+0.05
Cu2+0.73+1.162.14–2.33+0.08
Zn2+0.74+1.382.05–2.16+0.10
Table 5. Bader charges on the dopants, M-O bond distances, and changes in the volume of the doped configurations.
Dopant Ionic Radius of Dopant Ion (Å)Bader Charge on Dopant (|e|)M-O Distance(Å) Δ V V × 100   ( % )
B3+0.27+3.001.74–1.80−0.21
Al3+0.54+3.001.89–1.91+0.39
Ga3+0.62+3.001.95–1.98+0.74
In3+0.80+3.002.09–2.11+1.49
Tl3+0.89+3.002.18–2.20+1.94
Sc3+0.75+1.932.01–2.03+1.14
Y3+0.90+2.112.12–2.14+1.82
La3+1.03+1.992.21–2.23+2.38
Table 6. Solution energies calculated for the monovalent dopants substituted at the Na site. Ionic radius, Bader charges on the dopant atoms, M-O distances, and volume change are also provided.
Dopant Ionic Radius (Å)Bader Charge (|e|)M-O Distance (Å) Δ V V × 100   ( % )
C 0.16+4.001.65–1.79+0.96
Ge0.53+4.002.19–2.38 +0.46
Sn0.69+4.002.25–2.80+1.13
Pb0.78+4.002.49–2.94+1.60
Ti0.61+2.671.93, 1.95+0.68
Zr0.72+3.522.04, 2.05+1.39
Ce0.87+2.192.12, 2.16+1.96
Disclaimer/Publisher’s Note: The statements, opinions and data contained in all publications are solely those of the individual author(s) and contributor(s) and not of MDPI and/or the editor(s). MDPI and/or the editor(s) disclaim responsibility for any injury to people or property resulting from any ideas, methods, instructions or products referred to in the content.