Article

Prediction of Concrete Compressive Strength Based on Gradient-Boosting ABC Algorithm and Point Density Correction

1
School of Automation, Chengdu University of Information Technology, Chengdu 610225, China
2
Southwest Municipal Engineering Design & Research Institute of China, Chengdu 610299, China
3
School of Highway, Chang’an University, Xi’an 710064, China
4
College of Electrical Engineering, Sichuan University, Chengdu 610065, China
*
Author to whom correspondence should be addressed.
These authors contributed equally to this work.
Eng 2025, 6(10), 282; https://doi.org/10.3390/eng6100282
Submission received: 11 September 2025 / Revised: 7 October 2025 / Accepted: 11 October 2025 / Published: 21 October 2025

Abstract

Accurate prediction of concrete compressive strength is essential for ensuring structural safety in civil engineering, particularly in road and bridge construction, where inadequate strength can lead to deformation, cracking, or collapse. Traditional non-destructive testing (NDT) methods, such as the Rebound Hammer Test, estimate strength using regression-based formulas fitted with measurement data; however, these formulas, typically optimized via the least squares method, are highly sensitive to initial parameter settings and exhibit low robustness, especially for nonlinear relationships. Meanwhile, AI-based models, such as neural networks, require extensive datasets for training, which poses a significant challenge in real-world engineering scenarios with limited or unevenly distributed data. To address these issues, this study proposes a gradient-boosting artificial bee colony (GB-ABC) algorithm for robust regression curve fitting. The method integrates two novel mechanisms: gradient descent to accelerate convergence and prevent entrapment in local optima, and a point density-weighted strategy using Gaussian Kernel Density Estimation (GKDE) to assign higher weights to sparse data regions, enhancing adaptability to field data irregularities without necessitating large datasets. Following data preprocessing with Local Outlier Factor (LOF) to remove outliers, validation on 600 real-world samples demonstrates that GB-ABC outperforms conventional methods by minimizing mean relative error rate (RER) and achieving precise rebound-strength correlations. These advancements establish GB-ABC as a practical, data-efficient solution for on-site concrete strength estimation.

1. Introduction

Concrete is the most widely used construction material, particularly in the field of road and bridge construction, because of integrity, durability, modularity, economy, etc. [1,2]. Insufficient concrete strength can lead to a decrease in structural load-bearing capacity, which in turn can cause deformation, cracking, and even collapse of buildings, posing serious threats to personal safety and property security [3,4,5,6]. Subsequently, during the construction or usage phase, ensuring the reliability and safety of concrete renders the accurate assessment of its performance particularly important [7]. Currently, destructive testing is the most accurate method for assessing concrete strength. However, its unsustainability and high cost prevent it from being widely applied in practice. Therefore, non-destructive testing methods are frequently employed to diagnose the strength of concrete elements or entire structures [8,9,10]. Currently, commonly used non-destructive testing methods include (1) Rebound Hammer Test [11,12] and (2) Ultrasonic Pulse Velocity Method [13]. Just as the rebound hammer test is widely favored for its simplicity and near-nondestructive nature [14,15], leveraging elastic vibration for engineering optimization is a common practice [16]. Meanwhile, since surface hardness correlates with compressive strength, rebound values can be calibrated against large datasets of concrete samples with known strengths to establish standard strength prediction curves. However, the rebound hammer test only reflects surface hardness, while different aggregate types can significantly alter the intrinsic relationship between hardness and compressive strength [17]. This leads to inherent defects in the current unified prediction models, making it difficult to ensure the accuracy of strength estimation.
To sum up, predicting the compressive strength of concrete determined using NDT includes high levels of uncertainty [18,19,20,21]. Kocáb et al. have proposed that the use of general regression models for estimating compressive strength typically yields inaccurate results [22,23]. Therefore, they have introduced an innovative design for constructing a characteristic curve, which can be utilized to determine the stripping rebound number obtained from various types of rebound hammers. Mohammed et al. proposed using the rebound hammer (RH) and ultrasonic pulse velocity (UPV) to establish valid relationships [24]. With the advancement of machine learning, researchers have begun to employ end-to-end networks to predict compressive strength, maximizing the utilization of the collected data [25,26,27]. To address the variability in concrete properties, El-Mir et al. have proposed a solution using machine learning to provide unique predictive modeling [18]. Kazemi proposed a sophisticated artificial intelligence framework (ACO + ANN model) to simulate the compressive strength of concrete containing casting waste sand, with the aim of significantly reducing time-consuming laboratory tests and the need for skilled technical personnel [28,29]. Subsequently, the black-box nature of neural networks results in an ambiguous relationship between inputs and outputs, and it requires a substantial amount of data for training. In practical applications, this can increase the workload of on-site operators. Therefore, constructing a transformation formula and determining its parameters is the simplest and most efficient approach [30,31].
Fitting the transformation formula curve for predicting concrete compressive strength can be regarded as a regression problem, where the goal is to establish a functional relationship between rebound values and strength. Conventional regression models, such as linear or polynomial regression, are widely used for this purpose; however, they may struggle to accurately capture complex, nonlinear relationships in heterogeneous or sparsely distributed data [22,23]. Currently, the determination of parameters for the transformation formula typically relies on the least squares method. While effective for simple linear problems, the least squares method often fails to provide satisfactory solutions for nonlinear or highly variable cases. From another perspective, the parameter identification process in the transformation formula can be naturally formulated as a real-valued optimization problem. This observation motivates the use of optimization algorithms, particularly meta-heuristic algorithms, which leverage domain knowledge and guided search strategies to explore the solution space efficiently [32]. Compared with traditional optimization methods, meta-heuristic algorithms are more flexible: they can handle a broader search range and impose no strict requirements on the form of the objective function [33,34,35,36]. As a result, they have been successfully applied in diverse complex environments, including economic dispatch problems [37], chip design [38], big data [39], image processing [36,40], robotics [41], feature selection [35], and energy management [42,43].
Based on the above-mentioned methods and survey, an gradient-boosting artificial bee colony (GB-ABC) algorithm is proposed for establishing a more accurate standard curve relating rebound values to compressive strength. The specific contributions are described as follows:
  • This research pioneers the application of this enhanced metaheuristic framework to the complex problem of concrete compressive strength prediction using non-destructive testing data, offering a more robust and reliable approach than conventional methods;
  • This study proposes a novel gradient-boosting artificial bee colony algorithm, which effectively integrates gradient descent to significantly accelerate convergence and enhance the precision of concrete compressive strength prediction;
  • A unique point density-weighted mechanism, based on Gaussian Kernel Density Estimation, is incorporated into the GB-ABC algorithm to ensure the model’s fitting results are more suitable for real-world scenarios, particularly by preventing small sample data from becoming isolated and improving the representation in sparse or unevenly distributed data regions.
The structure of this paper is organized as follows. Section 2 recalls basic concept of ABC algorithm. The automatic design of arithmetic operation ABC is introduced in Section 3. In Section 4, experimental results are shown and analyzed. Finally, conclusions and future work are given in Section 5.

2. Preliminaries

Artificial Bee Colony Algorithm

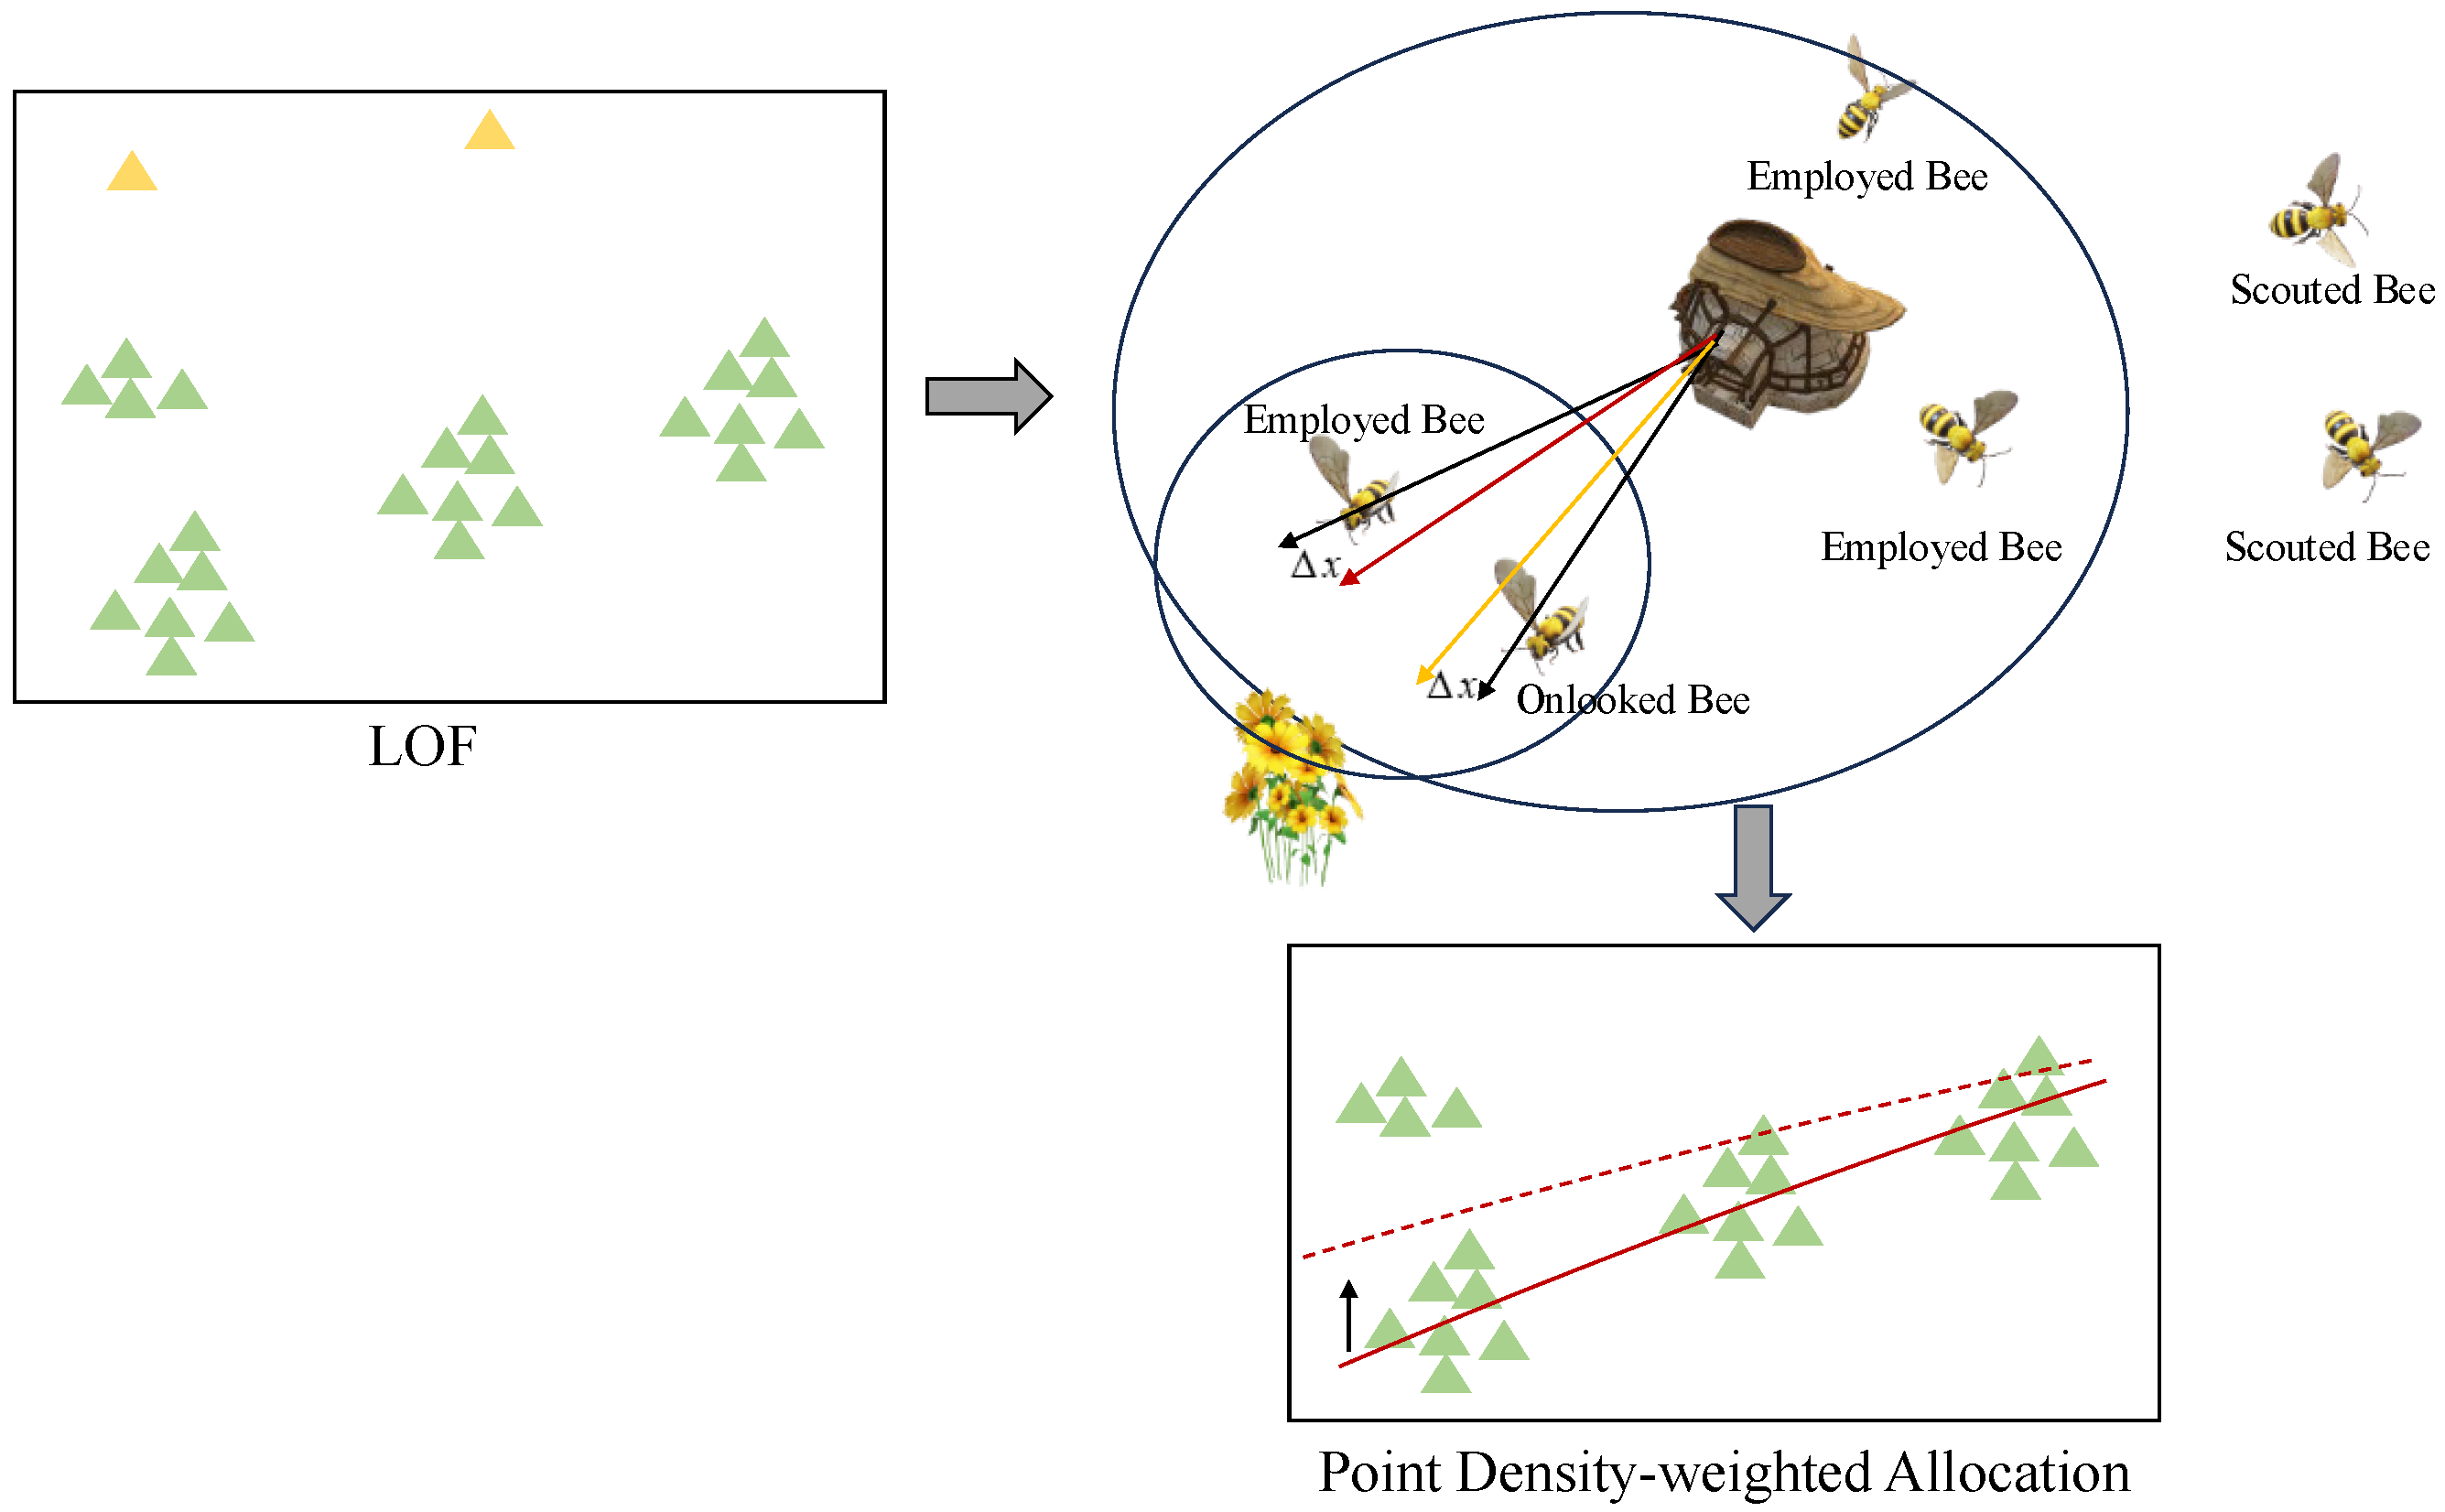
The artificial bee colony algorithm, proposed by Dr Dervis Karaboga, is a meta-heuristic algorithm [44]. The software simulates the collaborative mechanisms of a bee colony searching for and utilizing food sources in order to solve numerical optimization problems [45]. The algorithm is comprised of three constituent components: firstly, scout and onlooker bees that have not yet been assigned tasks; secondly, employed bees that have been assigned tasks; and thirdly, food sources near the hive and their quantities of nectar [46]. In the ABC algorithm, food sources are representative of feasible solutions to the problem, with the quantity of nectar at each food source corresponding to the fitness value of each solution. Each employed bee is associated with a specific food source, meaning the number of employed bees (i.e., the population size N) is equal to the number of food sources. The schematic diagram is illustrated in Figure 1 [44].
In the initial stage, scout bees search for random food sources in the vicinity of the hive. This results in the generation of random feasible solutions in the solution space. The initialization process may be accomplished by employing the following equation:
x i j = l i + rand ( 0 , 1 ) · ( u i l i )
where:
  • j { 1 , 2 , , D } ;
  • D represents the dimension of the problem to be solved;
  • x i j represents the value of the i-th food source in the j-th dimension;
  • l i represents the lower limit of the parameter x i j ;
  • u i represents the upper limit.
The initial solution information provided by scout bees is received and utilized by employed bees. In addition, according to Equation (2), new food sources in the vicinity are searched for by employed bees. The adaptability value of these new food sources is then assigned by employed bees according to Equation (3) for greedy selection. The retention of the new food source is determined by the nectar yield of the new food source being greater than or equal to that of the old food source. In the event that the nectar yield of the new food source is not lower than that of the old food source, the retention of the new food source occurs [47]. Conversely, if the nectar yield of the new food source is greater than that of the old food source, the retention of the old food source occurs.
v i j = x i j + z · ( x i j x k j )
F i t i = 1 1 + f i , if f i 0 1 + | f i | , if f i < 0
where 1 k N , k i , z is defined as a random number belonging to the interval [ 1 , 1 ] . In this setting, v i j denotes the value of the new solution in the i-th dimension, F i t i signifies the fitness value of the i-th solution, and f i represents the objective function value.
The onlooker then selects the location information provided by the employed bees according to the probability Equation (4). Concurrently, the onlooker persists in its search by employing the aforementioned Equation (2) and the greedy selection mechanism to identify food sources of higher nectar quality.
p i = F i t i . i n F i t i
where the total value of food sources selected by worker bees after greedy selection is denoted by n.
In the event that the optimal value is not obtained within the specified number of iterations, the employed bee will transform into a scout bee, which will then randomly generate new food sources and initiate a new round of iterations [48].

3. Method

3.1. Overall Framework

The proposed method employs an improved ABC algorithm to fit the parameters of the prediction formula, thereby avoiding the issues inherent in the traditional least squares method. First, the collected data undergo preprocessing to eliminate outliers. Subsequently, parameter fitting is performed using the preprocessed data, incorporating a combination of gradient descent and a metaheuristic algorithm. Additionally, Gaussian kernel density estimation is integrated into the objective function calculation to adjust the curve position, enhancing its alignment with the data distribution trend. The overall framework is illustrated in Figure 2.

3.2. Data Preprocessing

Outlier detection is a statistical process aimed at identifying rare events or abnormal activities that differ from the majority of data points in a dataset [49]. Outlier detection encompasses two conventional types: global and local. Global outliers fall outside the normal range of the entire dataset, whereas local outliers may be within the normal range of the entire dataset but exceed the normal range of the surrounding data points [50]. Since experimental data are directly sourced from on-site operations, it is inevitable that outliers will be produced, making the screening of outliers particularly important. Especially for data from different laboratories and regions, it is necessary to conduct local outlier detection.
The LOF is an algorithm used to identify outliers (anomalous points) within a dataset [51]. Outliers typically refer to data points that are significantly different from the majority of other data points in the dataset [52]. The basic idea of the LOF algorithm is to determine whether a data point is an outlier by comparing its local density to the local densities of other points within its neighborhood, as shown in Equation (5).
l o f ( p ) = o N k ( p ) l r d ( o ) l r d ( p ) N k ( p )
where N k ( p ) is the set of k nearest neighbors of point p, and l r d ( p , o ) is the local reachability density from p to o.

3.3. Rebound-Strength Correlation Modeling with GB-ABC

This study aims to model the relationship between rebound and strength using a curve. The curve fitting will be optimized by ABC algorithm, which seeks to maximize the curve’s alignment with the distribution trend of the rebound-strength scatter points, thereby reducing the uncertainty in the predictions.
The GB-ABC algorithm is utilized in this paper to search for the optimal curve parameters. The mean relative error rate (RER) is adopted as the objective function for the metaheuristic algorithm, and optimization is conducted by minimizing the mean RER. Additionally, prior knowledge is integrated into the calculation of the objective function, assigning different weights to scatter points under various conditions, thereby enhancing the adaptability of the optimized curve to practical engineering scenarios. More specifically, the parameter optimization direction is guided by incorporating gradient descent methods, which enhance the local convergence speed and prevent the algorithm from becoming trapped in local optima. The following subsection will provide a detailed introduction to the proposed method.

3.3.1. Objective Function

In metaheuristic algorithms, the objective function plays a key role in evaluating the quality of solutions and guiding the search for the optimal solution [53]. In this study, conventional polynomials are employed as the curves to be fitted, as illustrated below:
F = a · R b
where F represents the compressive strength, R is the rebound value, and a and b are the parameters to be determined. This study employs optimization algorithms to identify the optimal values of a and b for determining the best fitting curve. Therefore, the objective function is as follows:
L ( F ^ , F ) = 1 n i = 1 n ( F ^ i F i ) 2
where F ^ represents the predicted value of the model, F is the actual value, and n is the number of data points. The GB-ABC algorithm will search for the optimal values of a and b by minimizing the value of the objective function L.

3.3.2. Prior Knowledge Based on Point Density-Weighted Allocation

The evolution of mechanical properties in on-site concrete test blocks is governed by multi-scale environmental factors, resulting in a non-stationary and multi-modal relationship between rebound values and compressive strength. In high-quality controlled sites, rebound-compressive strength data are densely concentrated near the design strength, whereas in remote or extreme environments, sparse sampling leads to low-density regions. This uneven data distribution can bias traditional regression models toward dense regions, underrepresenting the significance of marginal data. To mitigate this issue, we propose a Kernel Density Weighted Regression (KDWR) objective function, which adaptively assigns weights according to local data density, thereby enhancing both global consistency and local adaptability in concrete strength prediction.
1.
Spatial Density Field Modeling
This paper aims to modify the trend of the fitted curve by utilizing the spatial distribution of the data, so that the trend is not only to satisfy the minimum mean RER, but also to be closer to the trend direction in the data. Therefore, this study adopts Gaussian kernel density estimation to create a continuous probability density function, because of its non-parametric nature, that is, it does not make any specific assumptions about the underlying distribution of the data. This function leverages the normal distribution’s probability density to smoothly disperse the influence of each data point to surrounding areas, with closer points receiving higher weights, as shown in Figure 3. Ultimately, by integrating discrete data values with spatial distance relationships through Gaussian kernel density estimation, the spatial density assessment is completed.
Based on Gaussian Kernel Density Estimation (GKDE), calculate the local density estimate D ^ ( x i , y i ) for each data point ( x i , y i ) as shown in Equation (8).
D ^ ( x i , y i ) = 1 n 2 π h x h y j = 1 n exp ( x i x j ) 2 2 h x 2 ( y i y j ) 2 2 h y 2
where the bandwidth parameters for rebound values and strength are automatically optimized using the Silverman rule.
2.
Density-Weighted Mapping
Design an allocation mechanism that assigns higher weights to low-density regions to compensate for their lack of information content, while simultaneously maintaining the influence of high-density regions on the regression trend. The density values are divided into three equal parts. The portion below one-third is considered a low-density region, and the weights of the low-density region are multiplied by 1.5 , while the weights of other regions remain unchanged.
3.
Weighted Nonlinear Regression
The updated objective function is as follows:
L ( F ^ , F ) = ω i i = 1 n ( F ^ i F i ) 2
The issue of fitting variation caused by local density differences can be addressed by assigning weights to each scattered point and applying these weights to the objective function.

3.3.3. Local Optimization Strategy Based on Gradient Descent

The gradient-boosting artificial bee colony algorithm proposed in this subsection achieves deep synergy between gradient descent and the artificial bee colony algorithm through the following two core innovation points, addressing the issues of local optima trapping and insufficient convergence speed faced by traditional methods in concrete strength prediction.
1.
Dynamic Role Allocation Mechanism
To balance the exploration and exploitation capabilities of the algorithm, an adaptive role-switching controller is designed based on the state feedback of the optimization process. This controller dynamically adjusts the dominance weight between GD and ABC by real-time analyzing the population diversity (measured by the fitness standard deviation) and the iteration progress (time decay factor). Specifically, the dominance factor D t at the t-th iteration is defined as follows:
D t = σ f t μ f t · e t T max
where:
  • σ f t : Standard deviation of population fitness;
  • μ f t : Mean population fitness;
  • T max : Maximum iterations.
If D(t) is more than the threshold, the gradient descent strategy is activated; otherwise, the ABC algorithm is used to search for the global optimal solution normally.
2.
Gradient-Boosting Neighborhood Search
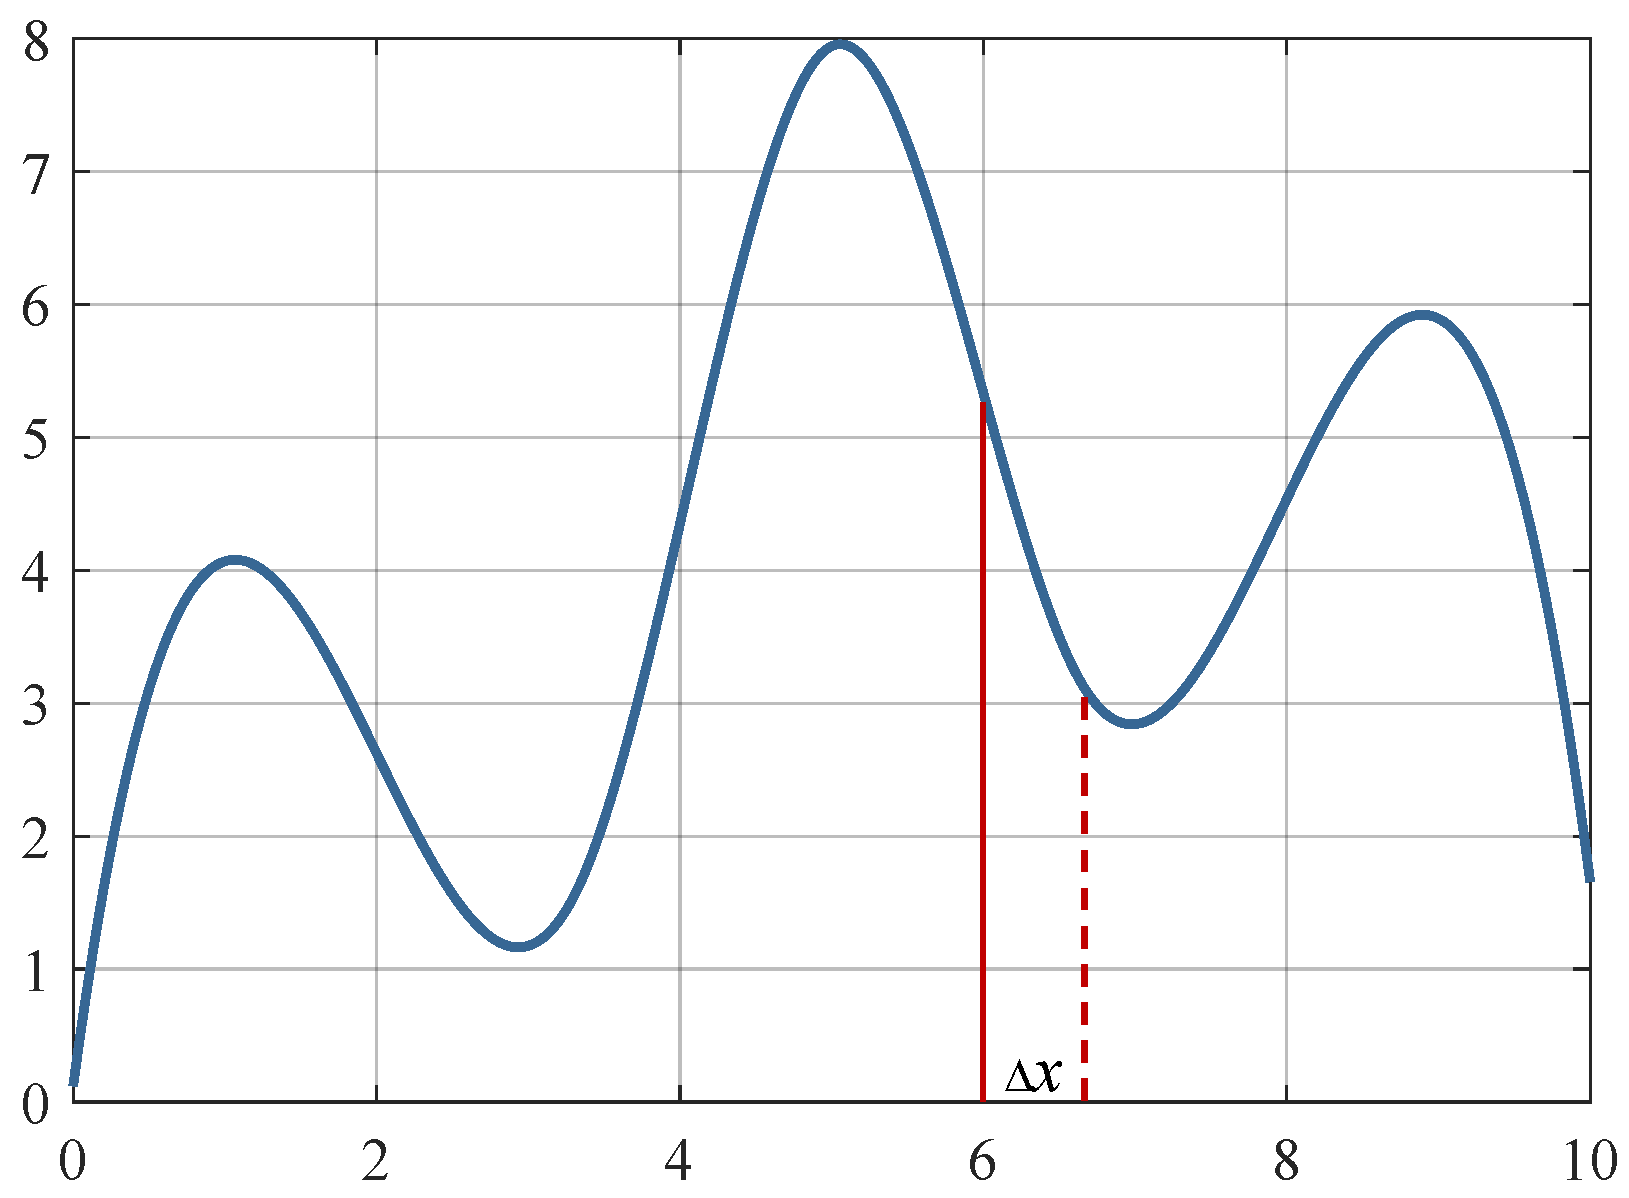
In the ABC algorithm, bees are categorized into three types: employed bees, onlooker bees, and scout bees. This paper primarily focuses on incorporating gradient information into the metaheuristic algorithm to conduct local refined searches around the optimal points found by the algorithm, aiming to achieve a more precise local optimum, as shown in Figure 4.
Assuming the solution space is D-dimensional, the solution corresponding to the i-th employed bee can be represented as a vector: x i = ( x i 1 , x i 2 , , x i D ) .
The process by which employed bees search for a new solution in the vicinity of their current solution can be expressed with the following formula:
The process by which employed bees search for a new solution in the vicinity of their current solution can be expressed with the Equation (2).
In the employed bee phase, the traditional random neighborhood search is not effective in finding the optimal direction during the convergence phase. Therefore, gradient information is incorporated to guide the mutation direction, as shown in Equation (11):
v i = x i + ϕ i · [ α · ( f ( x i ) ) + ( 1 α ) · ( x i x k ) ]
where α = 1 1 + f ( x i ) is the adaptive fusion coefficient. When the gradient magnitude is large, the direction tends to favor the gradient descent direction; otherwise, it enhances the random exploration of ABC. f ( x i ) represents the gradient information, which uses the sub-gradient approximation, as shown in Equation (12):
f ( x ) f ( x + Δ x ) f ( x Δ x ) 2 Δ x
The adaptive fusion coefficient in the employed bee phase is adjusted based on the gradient magnitude, which allows for greater reliance on the GD direction in regions with larger gradients (steep areas), and increased random exploration in regions with smaller gradients (flat areas). Unlike the employed bees, its adaptive fusion coefficient linearly increases the gradient weight over time to ensure local exploitation in the later stages of the algorithm. Its calculation method is shown as Equation (13).
α = 1 1 + 0.1 t

3.4. Algorithm Pseudocode

The pseudocode of algorithms are introduced in this subsection. The pseudocode includes two main parts: the point density-weighted allocation, the gradient descent. The detailed process is interpreted in Algorithm 1 and Algorithm 2, respectively.
Algorithm 1 Point Density-weighted Allocation
Require: data—dataset whose second column contains the input feature
Ensure: weights—normalized density-based weight vector
   1:
inputs ← data[:,1]    // extract input feature
   2:
densities ← KernelDensityEstimation(inputs)
   3:
weights ← ones(size(densities))    // default weight = 1
   4:
tertiles ← quantiles(densities, [1/3, 2/3])
   5:
for  i = 0 to len(densities)-1 do
   6:
   if  d e n s i t i e s [ i ] t e r t i l e s [ 1 ]  then
   7:
        weights[i] ← weights[i] × 1.5    // boost low-density region
   8:
   end if
   9:
end for
 10:
weights ← weights / sum(weights)    // normalize
 11:
return weights
Algorithm 2 Gradient Descent
Require: solution—current solution vector
Require: problem—problem instance containing lower and upper bounds
Require: step—finite-difference step size
Ensure: gradient—estimated gradient vector
   1:
gradient ← zeros(len(solution))
   2:
for  i = 0 to len(solution)-1 do
   3:
   lower ← problem.lower[i]
   4:
   upper ← problem.upper[i]
   5:
    δ step
   6:
   if solution[i] + δ > upper then
   7:
      δ upper − solution[i]
   8:
   else if solution[i] − δ < lower then
   9:
      δ solution[i] − lower
 10:
   end if
 11:
   if  δ = 0  then
 12:
     continue    // skip if at boundary
 13:
   end if
 14:
   solutionPlus ← solution
 15:
   solutionPlus[i] ← solutionPlus[i] + δ
 16:
   fitnessPlus ← Evaluate(solutionPlus, problem)
 17:
   solutionMinus ← solution
 18:
   solutionMinus[i] ← solutionMinus[i] − δ
 19:
   fitnessMinus ← Evaluate(solutionMinus, problem)
 20:
   gradient[i] ← (fitnessPlus − fitnessMinus) / (2 · δ )
 21:
end for
 22:
return gradient

4. Experimental Results

To further demonstrate the feasibility and the effectiveness of GB-ABC, empirical data collected from a region in western China are employed to test the performance of algorithm. The experimental results are used to test the convergence and the performance of the point density-weighted allocation. All the experiments are implemented on the platform MATLAB 2024b and on a work station with Intel i5, GPU 3060, 16GB RAM and Windows 11. The parameter setting and results of data pre-process are described in Section 4.1 and Section 4.2, respectively. The analysis of experimental results are discussed in Section 4.3.1 and Section 4.3.2, respectively.

4.1. Data Description

In this study, an GB-ABC algorithm is proposed for fitting the standard curve relating rebound values to compressive strength. To validate the performance of the algorithm in practical applications and explore potential directions for future improvements, a large amount of actual data was collected. All data were derived from the actual measurements of rebound values and compressive strengths in a certain region of China. More specifically, a total of 600 real data points were collected on-site, with concrete age ranging from 14 to 90 days and concrete grades of C40 and C50 (“C40” and “C50” refer to the concrete strength grades defined in the Chinese standard GB 50010-2010, where the number indicates the 28-day cube compressive strength in MPa (e.g., C40 corresponds to 40 MPa)).

4.2. Results of Data Pre-Process

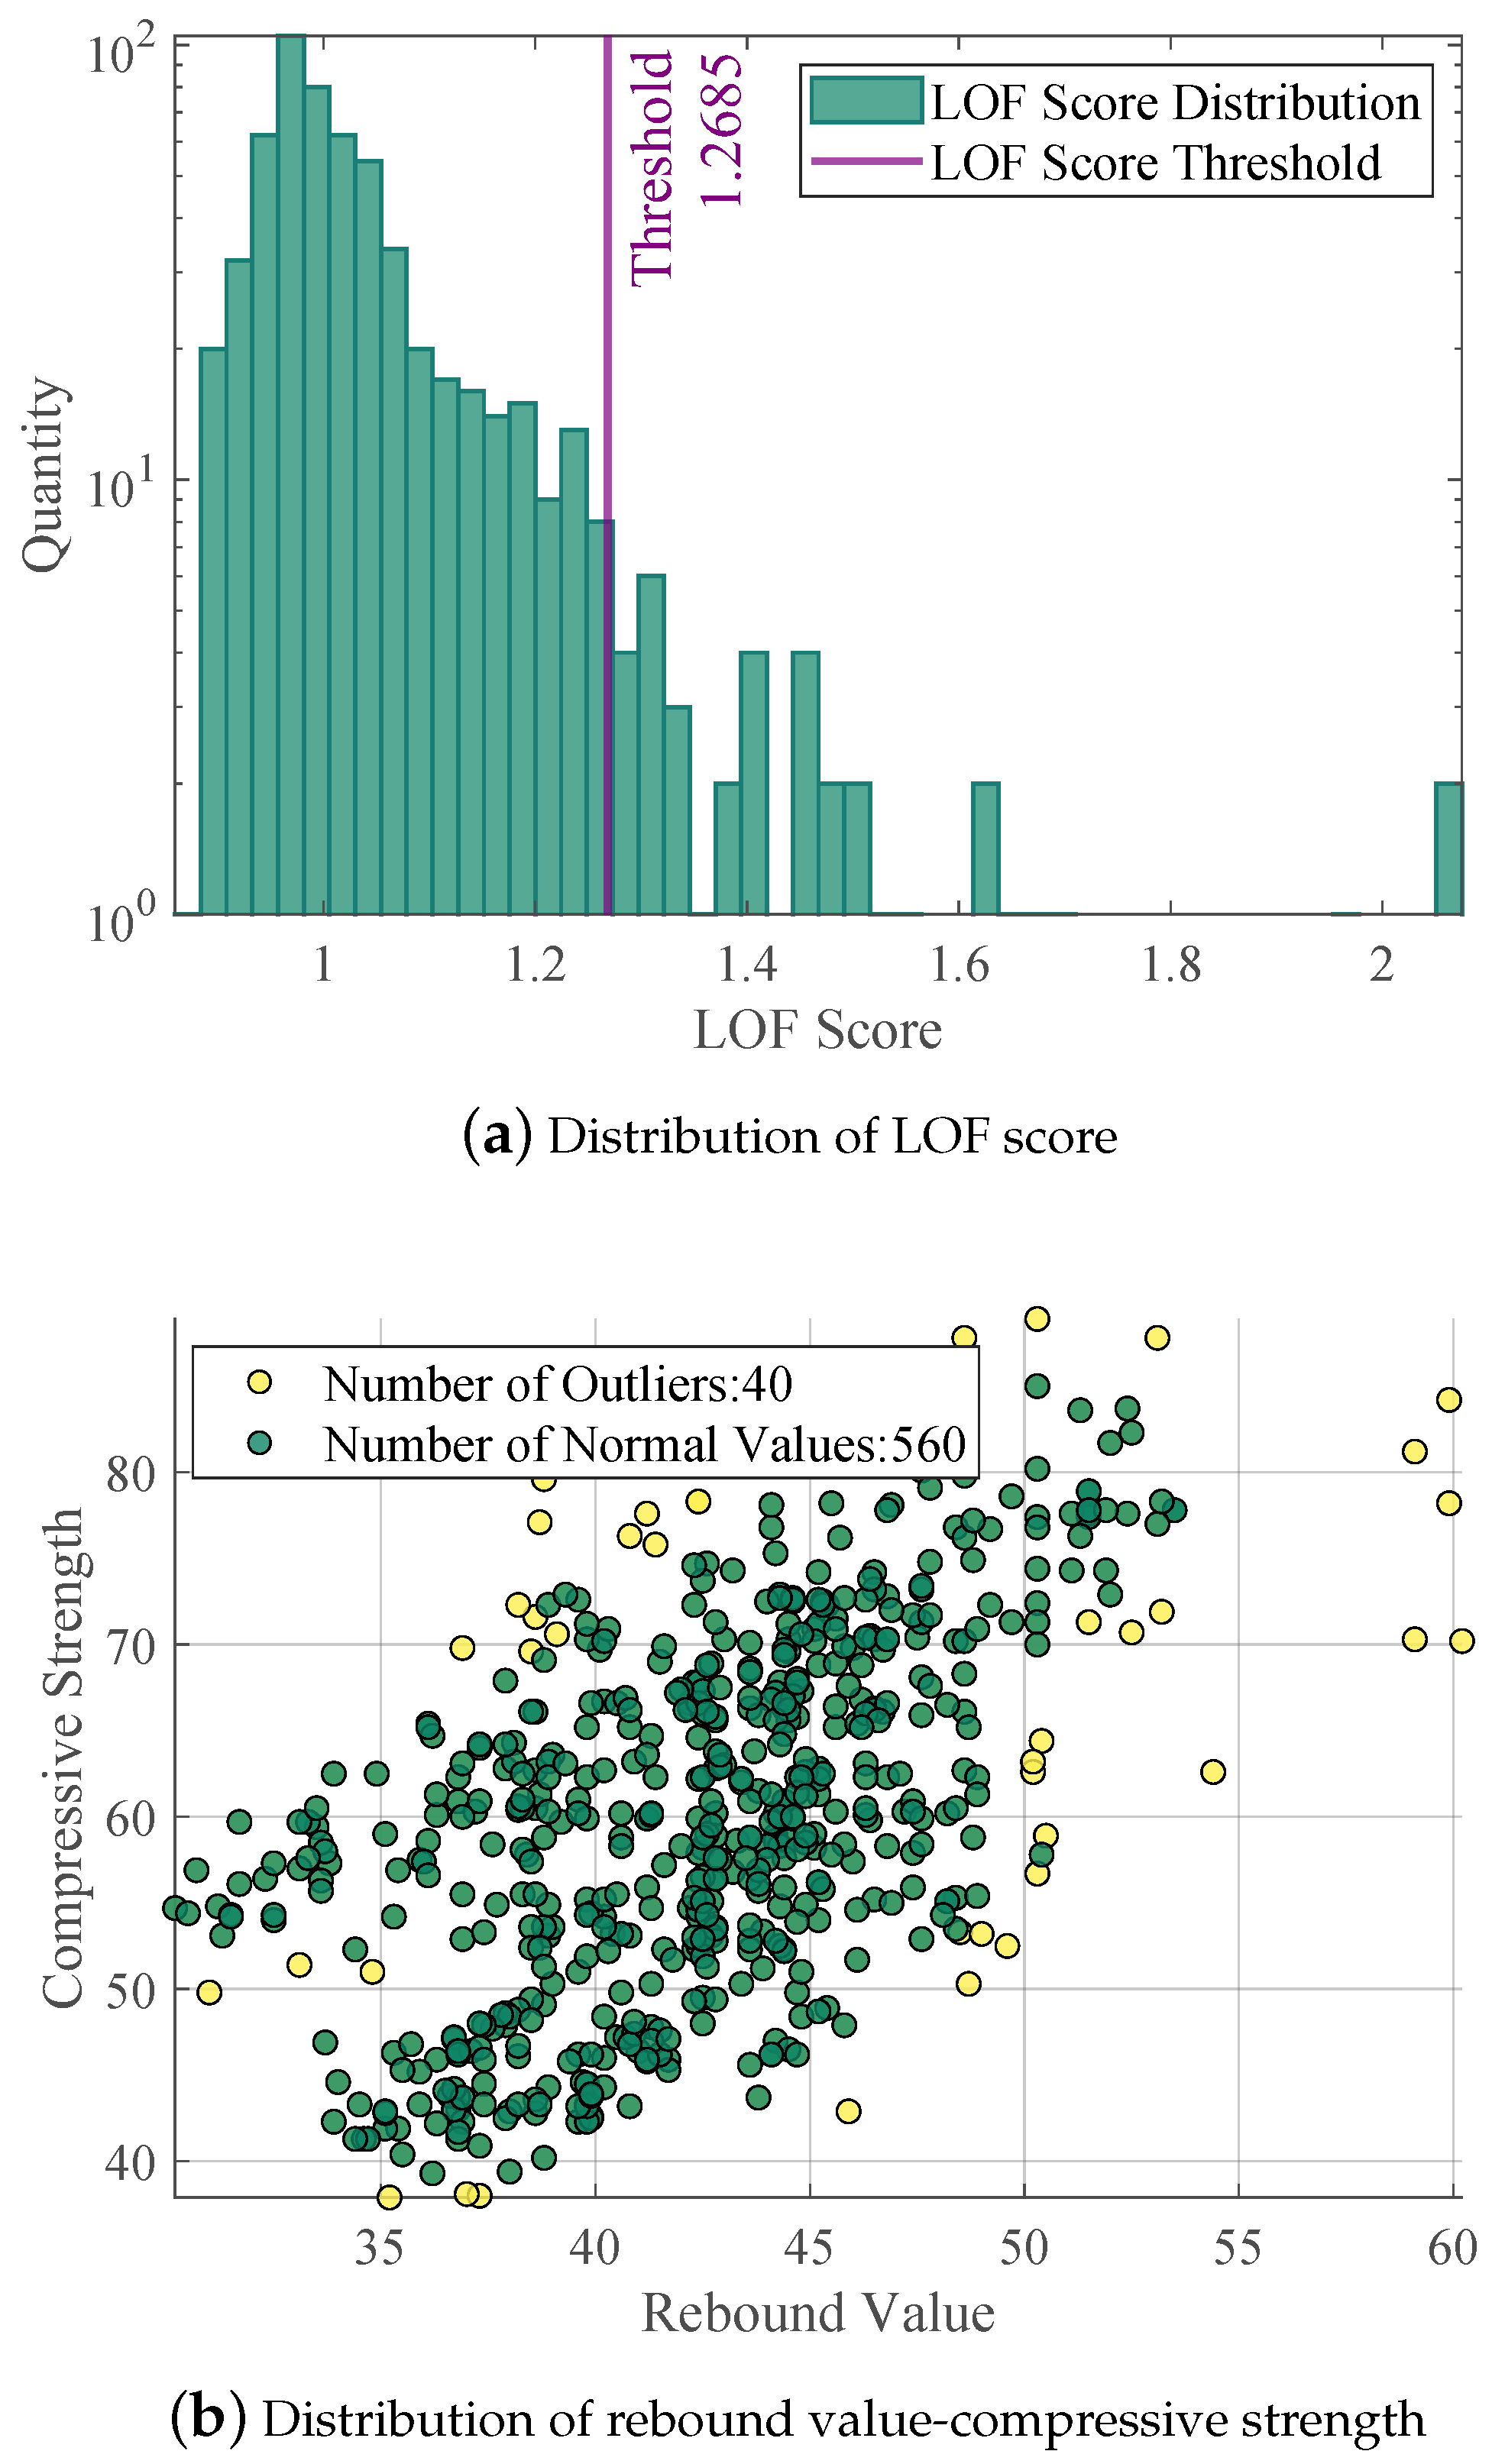
To minimize the influence of experimental errors on the validation of the proposed method, this study employed LOF algorithm to identify outliers in the raw data. Initially, the LOF value for each data point was calculated. Subsequently, outliers were marked based on a threshold, which was determined using Equation (14):
Threshold = mean ( LOF ) + 1.5 × std ( LOF )
The parameter in Equation (14) is empirically set as the mean plus 1.5 times the standard deviation of the observed data. This is because (1) the mean represents the data’s central tendency, and the standard deviation captures its variability; (2) adding 1.5 standard deviations provides an upper bound that includes most data points while reducing the influence of extreme outliers; and (3) this range improves convergence stability and the accuracy of the fitted regression curve. This empirical approach is commonly used in engineering and statistical applications to ensure robustness and efficiency.
Data points with LOF scores below the threshold were retained, while those with scores above the threshold were removed.
The results of data preprocessing are shown in Figure 5a is the distribution of the LOF Scores. The threshold calculated by the Equation (14) is 1.2685. Therefore, data with LOF scores greater than the threshold are removed. The distribution of the processed scores is close to a Gaussian distribution. Figure 5b is the distribution of rebound value-compressive strength. The data to be retained after screening are shown in green, and the data to be removed are shown in yellow. Among them, 40 outlier data points are removed, and 560 data samples are retained.

4.3. Analysis of Experimental Results

Section 4.3.1 will demonstrate the convergence capability and optimization performance of the proposed method. Additionally, it will showcase the performance of the point density-weighted allocation in practical data in Section 4.3.2.

4.3.1. Performance Analysis of Algorithm Results

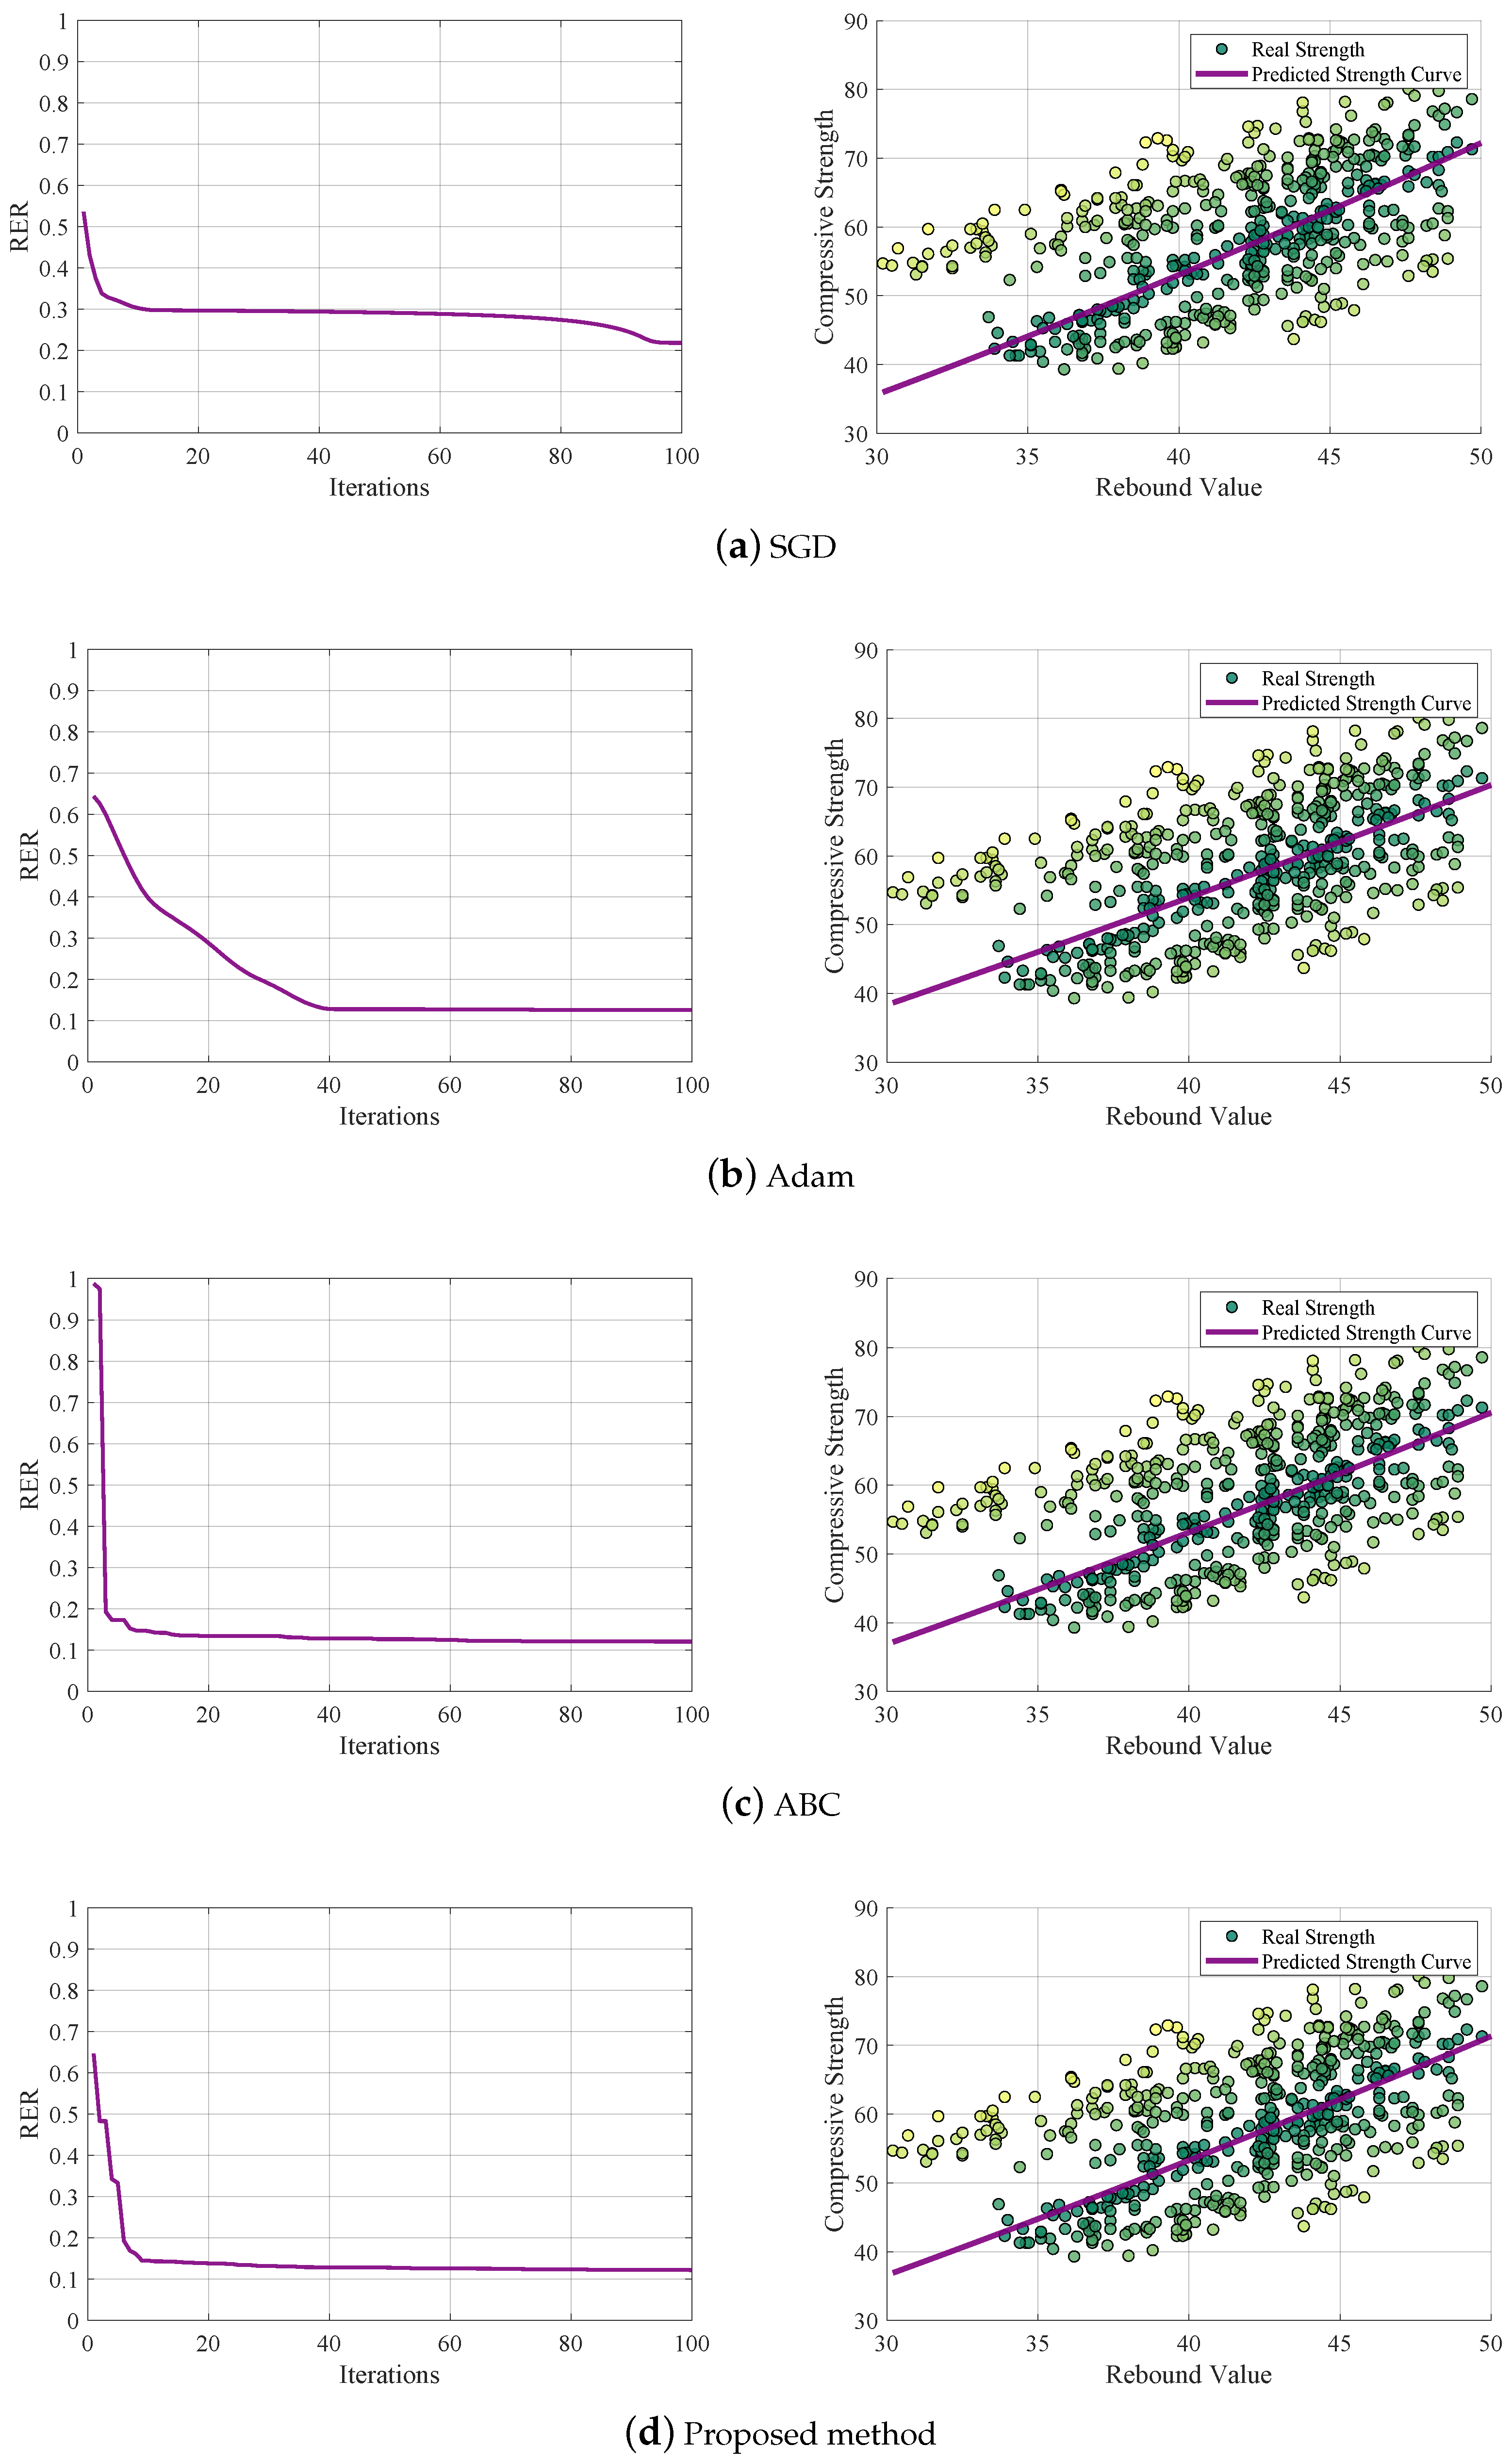
The preprocessed data from a certain region in China were used to test nonlinear least squares, ABC, Adam SGD, and the proposed method. The commonly used industry standard of mean RER was employed for evaluation. Each method is executed for 30 independent experiments. Among these, the least squares method is set with a maximum of 50 iterations, while the other methods were set with a maximum of 100 iterations.
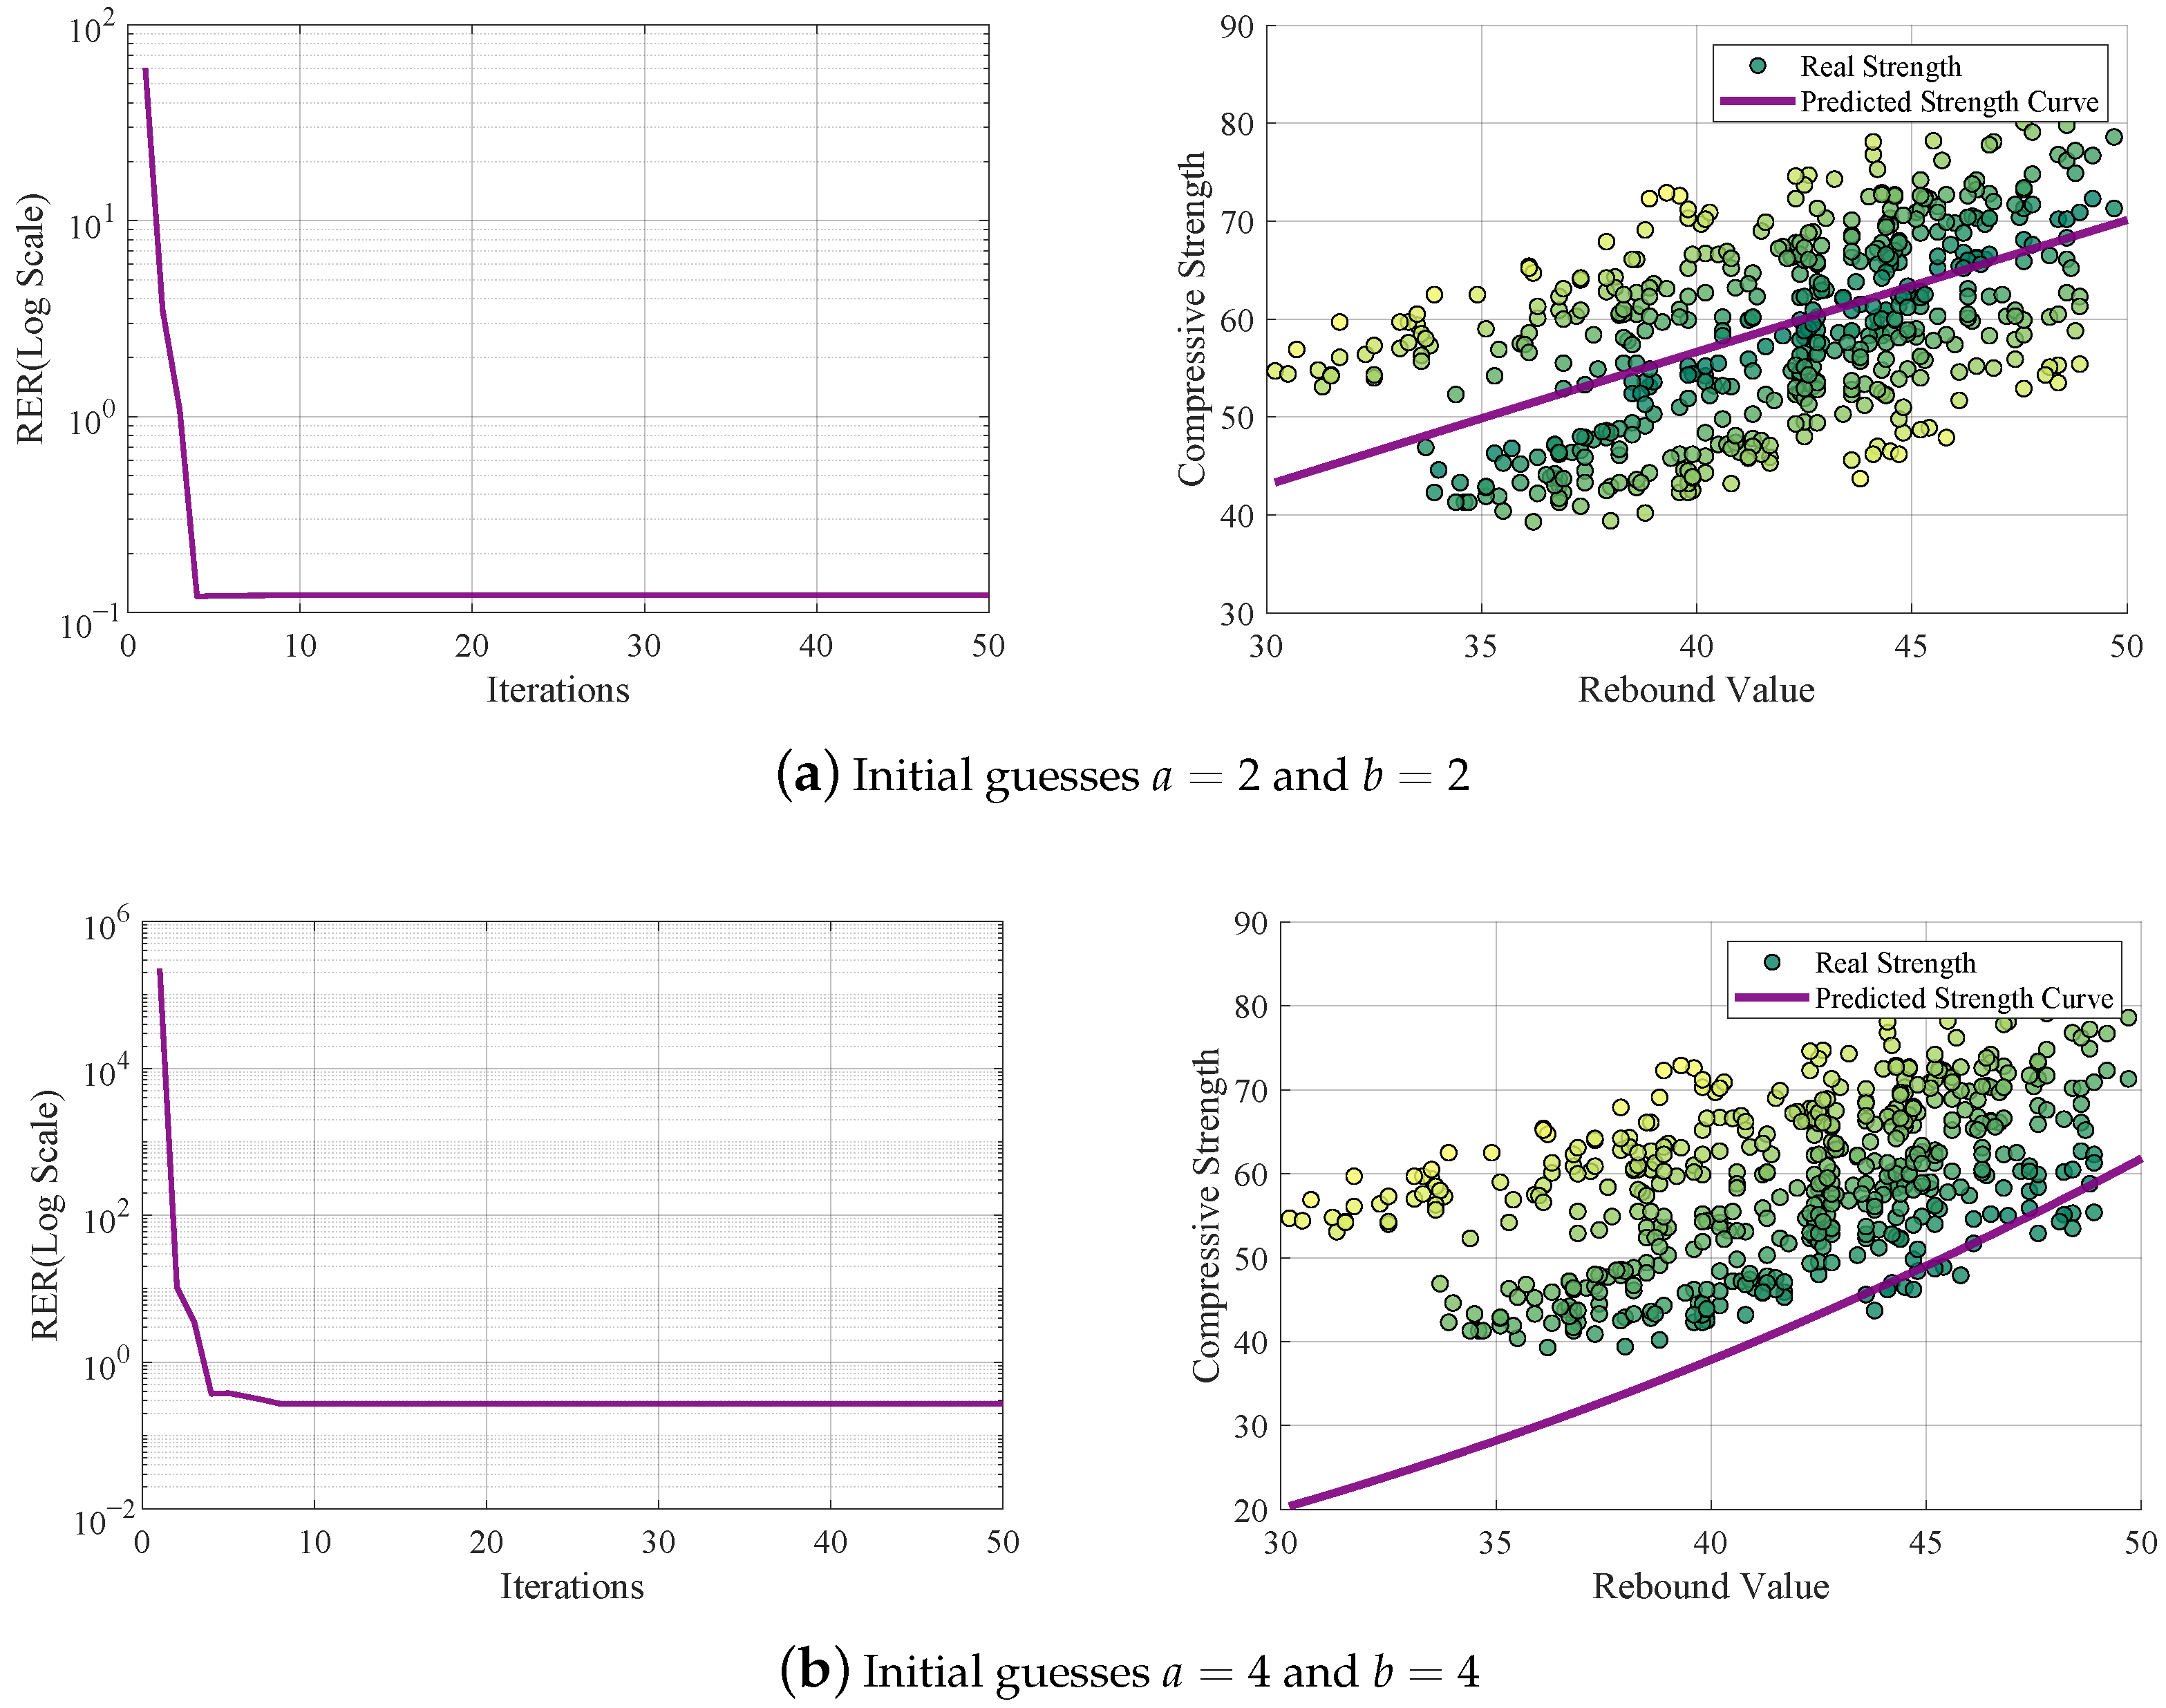
Due to the high sensitivity of the least squares method to initial guess values, the initial guesses a and b were first set to (2, 2) and (4, 4), respectively, for this method. The convergence and fitting results are shown in Figure 6, where RER is used as the objective function, and a logarithmic scale is employed on the vertical axis to intuitively observe the convergence state. The convergence results indicate that the mean RER was minimized when the initial guesses were set to (2, 2). It can be observed from the results that the least squares method tends to stabilize within the first ten iterations, demonstrating fast convergence. However, this requires more accurate initial guesses. In practical applications, obtaining an accurate range for the initial guesses is often challenging, as it is typically not possible to determine this range a priority.
The optimal results of the least squares method were compared with those of other commonly used methods and the proposed method. For the ABC algorithm and the proposed algorithm, the initial value range for parameters a and b is set to [−100, 100]. However, for SGD and Adam, to ensure better convergence performance, the initial value range for a and b is restricted to [−10, 10]. The convergence results are shown in the Table 1.
To visualize the convergence process of the four methods and to better compare the performance between the four algorithms, the convergence and fitting results for the four methods are shown in Figure 7.
As indicated by the Table 1 and Figure 7, although the proposed algorithm achieves the optimal MAPE value, demonstrating superior performance in minimizing relative error as required by national standards, its RMSE and MAE values, while competitive, are not the best. The relatively low R 2 value arises because the algorithm directly optimizes MAPE as the objective function without explicitly modeling the underlying variance structure of the data. The results presented here primarily reflect the algorithm’s optimization capability rather than its ability to explain data variance. It is important to emphasize that if other metrics, such as RMSE or MAE, were used as the objective function, we are confident that the proposed algorithm could also achieve outstanding optimization performance, owing to its powerful search mechanism and adaptability in complex solution spaces. This divergence between error-based metrics and goodness-of-fit metrics is not uncommon in optimization-oriented methods, particularly when dealing with complex or noisy datasets. Furthermore, the results obtained using the GB-ABC algorithm are superior to those of the comparative algorithms. Additionally, compared to the nonlinear least squares method, Adam and SGD, the GB-ABC and ABC algorithm utilizes an initial value range of [−100, 100], which represents a broader search space. This suggests that the algorithm is less sensitive to the range of initial values, thereby enhancing its practical applicability in real-world scenarios.

4.3.2. Analysis of Point Density-Weighted Allocation

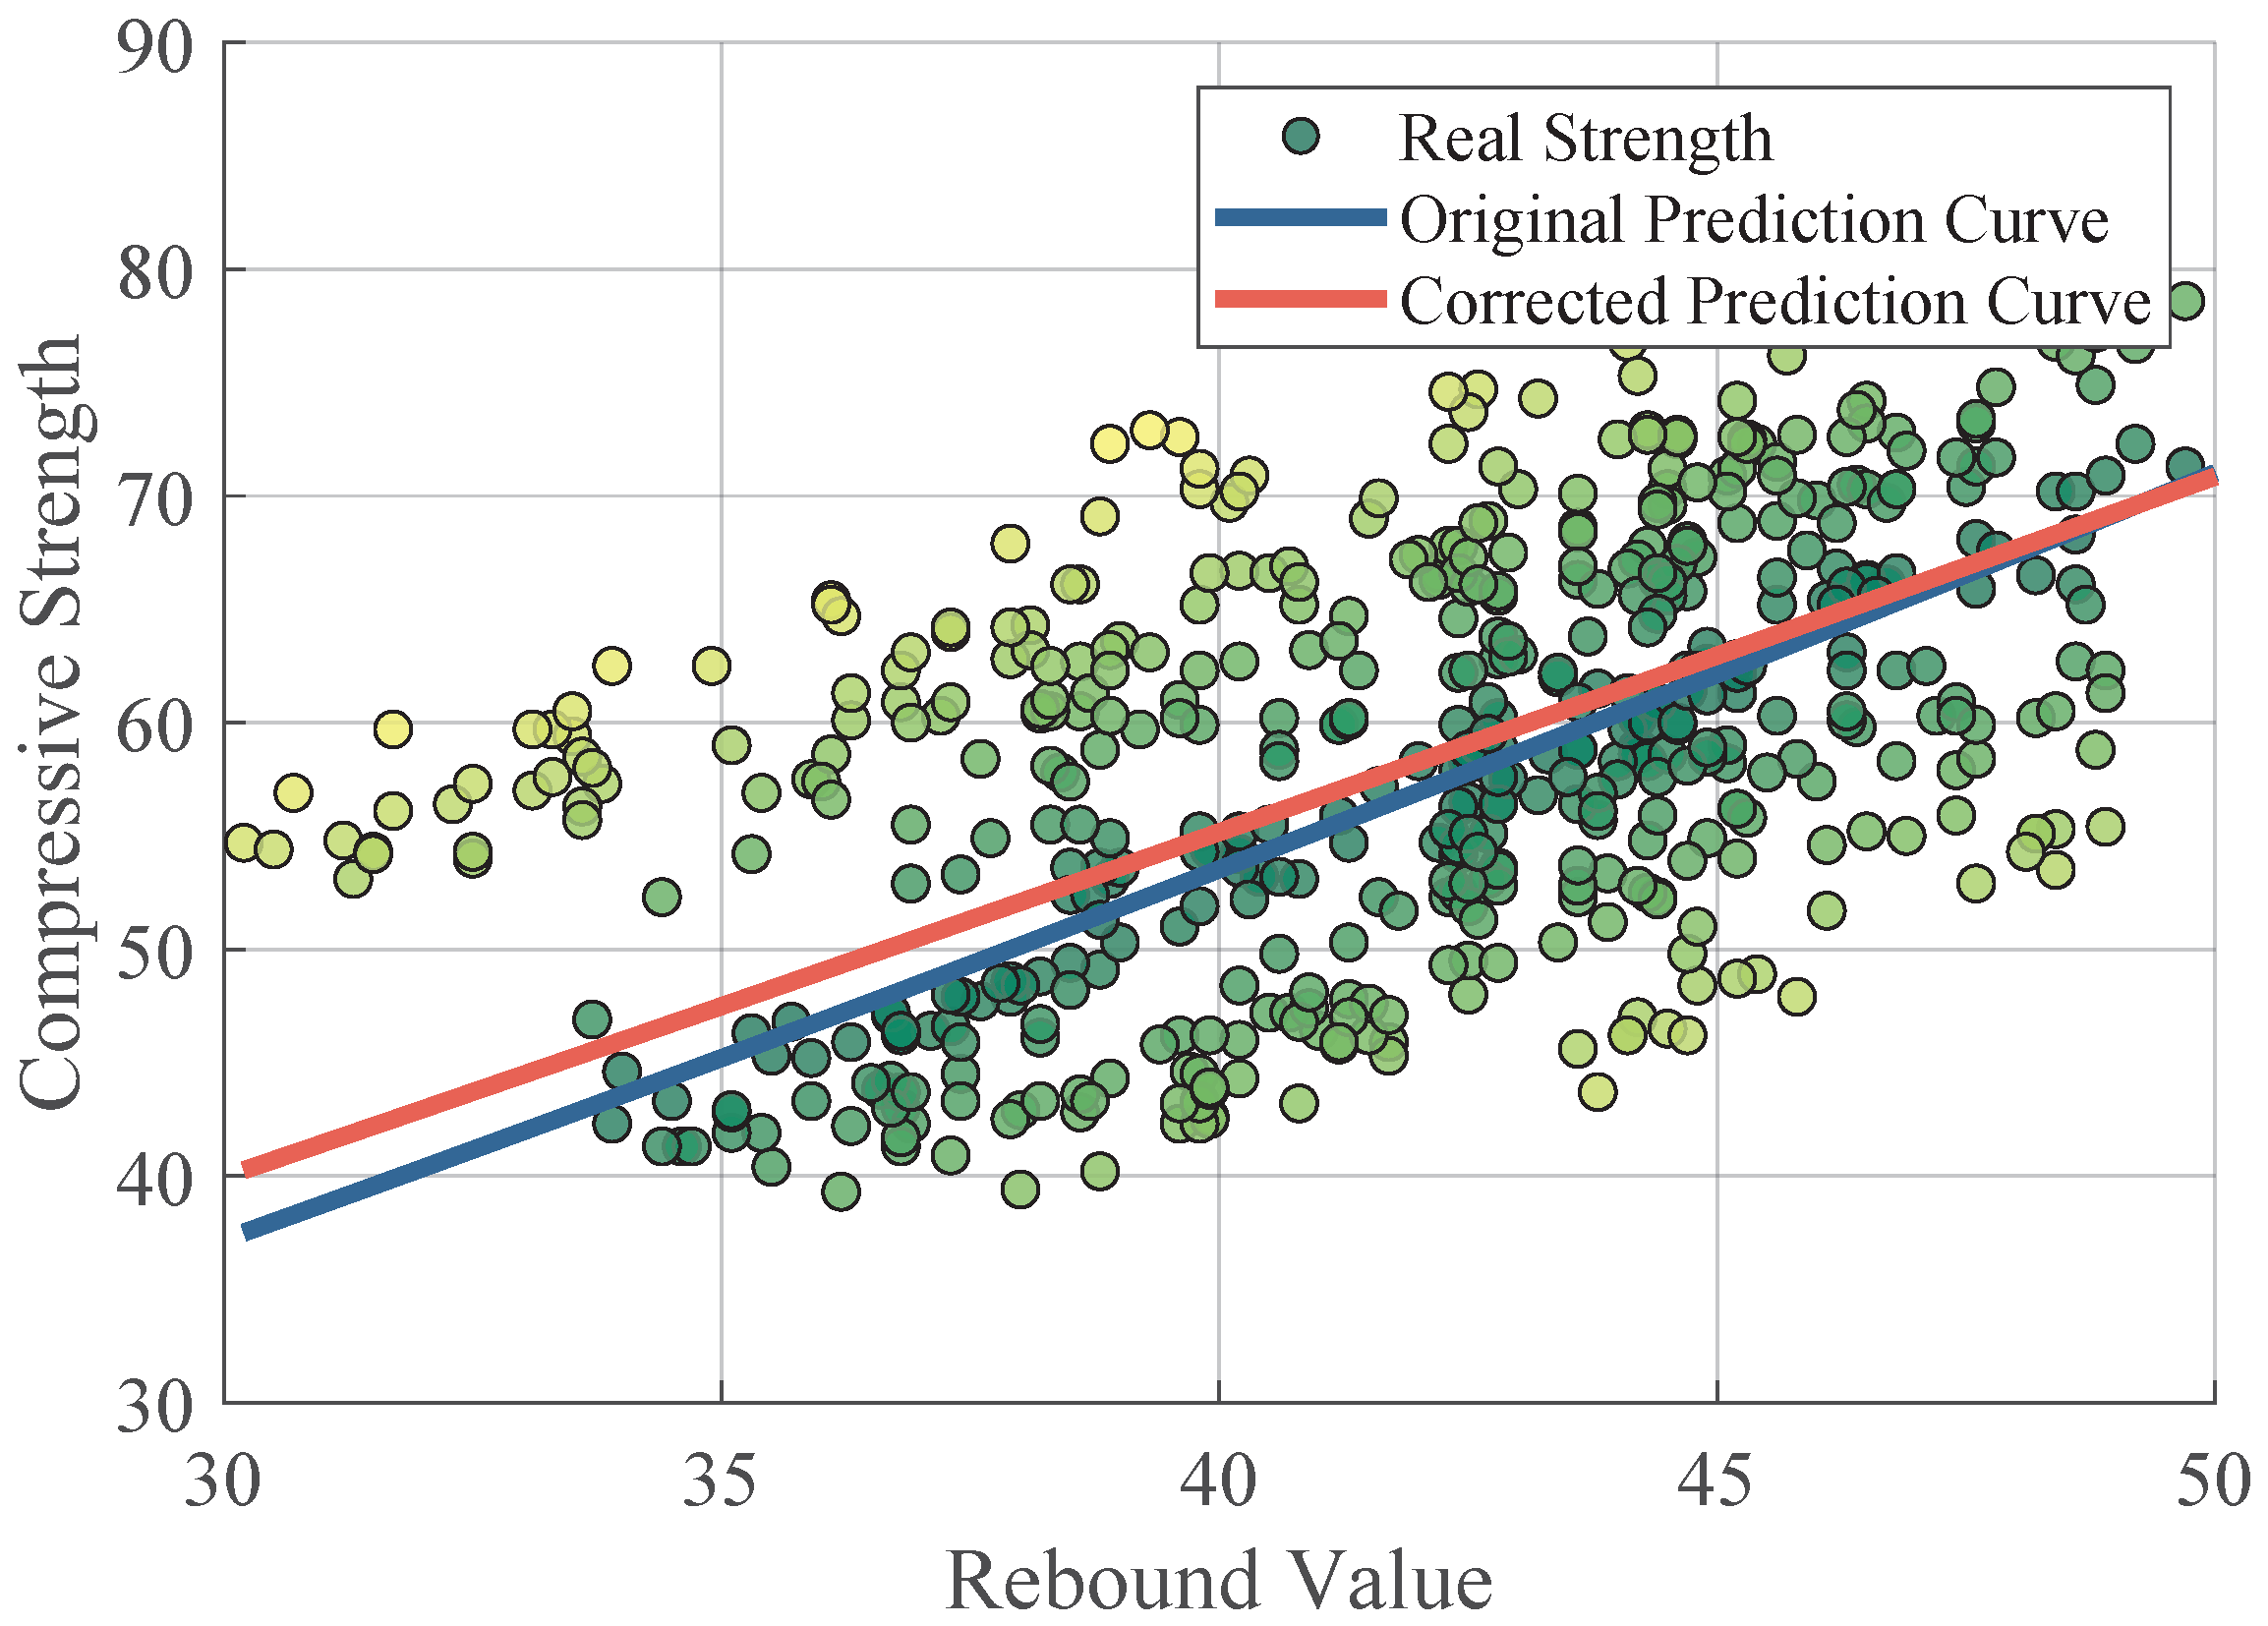
As shown in Section 4.3.1, the proposed method has advantages in convergence compared to other methods. Therefore, the same dataset was used to test the point density-weighted allocation, comparing the proposed method with the improved proposed method. Each method underwent 30 independent experiments, with the maximum number of iterations set to 100.
As shown in Figure 8, visual representation of the results demonstrates that the corrected curve resides above the original prediction curve when the rebound values are relatively low. As the rebound values increase, the trend of the corrected curve gradually aligns with that of the original curve. This indicates that the curve, after undergoing weight redistribution, better conforms to the characteristics of the actual strength distribution.
To quantitatively evaluate the improvement achieved by the correction method, we conducted a comparative analysis of the RER between the original and corrected prediction curves in two representative intervals. As shown in Figure 8, in the interval [30,31,32,33,34,35], the RER of the corrected curve is 19.9100 % , a notable reduction from the 22.7579 % observed in the original curve. Likewise, in the interval [35,40], the corrected curve achieves an RER of 13.7861 % , compared to 14.4507 % for the original curve. These results confirm that the correction method effectively reduces numerical errors, especially in sparse data regions, thereby enhancing the overall reliability and accuracy of the predictions.

5. Conclusions

This study presents a novel ABC-based algorithm for fitting concrete compressive strength prediction curves, enabling accurate non-destructive testing of concrete in engineering applications. By incorporating gradient descent and point density mapping, the algorithm improves convergence accuracy and ensures the prediction curve better aligns with both dense and sparse data regions.
Validation using 600 real concrete samples from a specific region in China shows that the proposed method achieves significantly lower fitting errors compared to traditional least squares methods. Moreover, the point density mapping markedly enhances prediction accuracy in low-density regions, effectively addressing limitations caused by incomplete field data.
Therefore, in practical applications, our method enables rapid generation of accurate and reliable prediction curves using field data. Compared to traditional least squares methods and other algorithms, our approach achieves superior convergence accuracy within comparable computational time. Furthermore, it effectively handles sparse data challenges. Unlike deep learning methods, which require extensive training data, our algorithm leverages predefined regression curves, enhancing the interpretability of predictions.
Despite these improvements, the current point density weighting relies on piecewise calculations, requiring manual segmentation. Future work will focus on developing continuous weighting functions to further improve adaptability and performance.

Author Contributions

Conceptualization, Y.X., Q.L. and Y.T.; methodology, Y.X., Q.L. and Y.T.; software, Y.X., Q.L. and Y.T.; writing—original draft preparation, Y.X., Q.L. and Y.T.; writing—review and editing, Y.H., Y.W. and Y.Y. All authors have read and agreed to the published version of the manuscript.

Funding

This work was supported by the Key Research and Development Projects of Sichuan-Chongqing Alliance (CSTB2022TIAD-CUX0018) and Research Fund of Chengdu University of Information Technology (KYTZ2023009).

Data Availability Statement

The original contributions presented in this study are included in the article.

Acknowledgments

The authors acknowledge the above funds for supporting this research and the editor and reviewers for their comments and suggestions.

Conflicts of Interest

The authors declare no conflicts of interest.

References

  1. Neville, A.M.; Brooks, J.J. Concrete Technology; Longman Scientific & Technical: London, UK, 1987; Volume 438. [Google Scholar]
  2. Khan, K.; Johari, M.A.M.; Amin, M.N.; Khan, M.I.; Iqbal, M. Optimization of colloidal nano-silica based cementitious mortar composites using RSM and ANN approaches. Results Eng. 2023, 20, 101390. [Google Scholar] [CrossRef]
  3. Khan, M. Robust segmentation of concrete road surfaces via fuzzy entropy modelling and multiscale laplacian texture analysis. Mechatron. Intell. Transp. Syst. 2025, 4, 72–80. [Google Scholar] [CrossRef]
  4. Hussain, I. An adaptive multi-stage fuzzy logic framework for accurate detection and structural analysis of road cracks. Mechatron. Intell. Transp. Syst. 2024, 3, 190–202. [Google Scholar] [CrossRef]
  5. Elmansouri, O.; Alossta, A.; Badi, I. Pavement condition assessment using pavement condition index and multi-criteria decision-making model. Mechatron. Intell. Transp. Syst. 2022, 1, 57–68. [Google Scholar] [CrossRef]
  6. Khan, M.I.; Khan, N.; Hashmi, S.R.Z.; Yazid, M.R.M.; Yusoff, N.I.M.; Azfar, R.W.; Ali, M.; Fediuk, R. Prediction of compressive strength of cementitious grouts for semi-flexible pavement application using machine learning approach. Case Stud. Constr. Mater. 2023, 19, e02370. [Google Scholar] [CrossRef]
  7. El Mir, A.; Nehme, S.G. Repeatability of the rebound surface hardness of concrete with alteration of concrete parameters. Constr. Build. Mater. 2017, 131, 317–326. [Google Scholar] [CrossRef]
  8. Helal, J.; Sofi, M.; Mendis, P. Non-destructive testing of concrete: A review of methods. Electron. J. Struct. Eng. 2015, 14, 97–105. [Google Scholar] [CrossRef]
  9. Lantsoght, E.O.; van der Veen, C.; de Boer, A.; Hordijk, D.A. State-of-the-art on load testing of concrete bridges. Eng. Struct. 2017, 150, 231–241. [Google Scholar] [CrossRef]
  10. Malhotra, V.M.; Carino, N.J. Handbook on Nondestructive Testing of Concrete; CRC Press: Boca Raton, FL, USA, 2003. [Google Scholar]
  11. Bungey, J.H.; Grantham, M.G. Testing of Concrete in Structures; CRC Press: Boca Raton, FL, USA, 2006. [Google Scholar]
  12. Ali-Benyahia, K.; Sbartaï, Z.M.; Breysse, D.; Kenai, S.; Ghrici, M. Analysis of the single and combined non-destructive test approaches for on-site concrete strength assessment: General statements based on a real case-study. Case Stud. Constr. Mater. 2017, 6, 109–119. [Google Scholar] [CrossRef]
  13. Xu, T.; Li, J. Assessing the spatial variability of the concrete by the rebound hammer test and compression test of drilled cores. Constr. Build. Mater. 2018, 188, 820–832. [Google Scholar] [CrossRef]
  14. Verma, S.K.; Bhadauria, S.S.; Akhtar, S. Review of nondestructive testing methods for condition monitoring of concrete structures. J. Constr. Eng. 2013, 2013, 834572. [Google Scholar] [CrossRef]
  15. Maierhofer, C.; Reinhardt, H.W.; Dobmann, G. Non-Destructive Evaluation of Reinforced Concrete Structures: Non-Destructive Testing Methods; Elsevier: Amsterdam, The Netherlands, 2010. [Google Scholar]
  16. Li, H.; He, Y.; Wang, L.; Li, Z.; Deng, Z.; Zhang, W. Enhancing lateral dynamic performance of HTS Maglev vehicles using electromagnetic shunt dampers: Optimisation and experimental validation. Veh. Syst. Dyn. 2025, 1–20. [Google Scholar] [CrossRef]
  17. Khan, K.; Jalal, F.E.; Iqbal, M.; Khan, M.I.; Amin, M.N.; Al-Faiad, M.A. Predictive modeling of compression strength of waste pet/scm blended cementitious grout using gene expression programming. Materials 2022, 15, 3077. [Google Scholar] [CrossRef] [PubMed]
  18. El-Mir, A.; El-Zahab, S.; Sbartaï, Z.M.; Homsi, F.; Saliba, J.; El-Hassan, H. Machine learning prediction of concrete compressive strength using rebound hammer test. J. Build. Eng. 2023, 64, 105538. [Google Scholar] [CrossRef]
  19. Dong, Y.; Tang, J.; Xu, X.; Li, W.; Feng, X.; Lu, C.; Hu, Z.; Liu, J. A new method to evaluate features importance in machine-learning based prediction of concrete compressive strength. J. Build. Eng. 2025, 102, 111874. [Google Scholar] [CrossRef]
  20. Chaabene, W.B.; Flah, M.; Nehdi, M.L. Machine learning prediction of mechanical properties of concrete: Critical review. Constr. Build. Mater. 2020, 260, 119889. [Google Scholar] [CrossRef]
  21. Onyelowe, K.C.; Hanandeh, S.; Ulloa, N.; Barba-Vera, R.; Moghal, A.A.B.; Ebid, A.M.; Arunachalam, K.P.; Ur Rehman, A. Developing machine learning frameworks to predict mechanical properties of ultra-high performance concrete mixed with various industrial byproducts. Sci. Rep. 2025, 15, 24791. [Google Scholar] [CrossRef]
  22. Kocáb, D.; Misák, P.; Cikrle, P. Characteristic curve and its use in determining the compressive strength of concrete by the rebound hammer test. Materials 2019, 12, 2705. [Google Scholar] [CrossRef]
  23. Amar, M. Comparative use of different AI methods for the prediction of concrete compressive strength. Clean. Mater. 2025, 15, 100299. [Google Scholar] [CrossRef]
  24. Mohammed, B.S.; Azmi, N.J.; Abdullahi, M. Evaluation of rubbercrete based on ultrasonic pulse velocity and rebound hammer tests. Constr. Build. Mater. 2011, 25, 1388–1397. [Google Scholar] [CrossRef]
  25. Ziolkowski, P. Influence of Optimization Algorithms and Computational Complexity on Concrete Compressive Strength Prediction Machine Learning Models for Concrete Mix Design. Materials 2025, 18, 1386. [Google Scholar] [CrossRef]
  26. Liu, Y.; Yu, H.; Guan, T.; Chen, P.; Ren, B.; Guo, Z. Intelligent prediction of compressive strength of concrete based on CNN-BiLSTM-MA. Case Stud. Constr. Mater. 2025, 22, e04486. [Google Scholar] [CrossRef]
  27. Huang, H.; Lei, L.; Xu, G.; Cao, S.; Ren, X. Machine learning approaches for predicting mechanical properties of steel-fiber-reinforced concrete. Mater. Today Commun. 2025, 45, 112149. [Google Scholar] [CrossRef]
  28. Kazemi, R.; Golafshani, E.M.; Behnood, A. Compressive strength prediction of sustainable concrete containing waste foundry sand using metaheuristic optimization-based hybrid artificial neural network. Struct. Concr. 2024, 25, 1343–1363. [Google Scholar] [CrossRef]
  29. Roy, T.; Das, P.; Jagirdar, R.; Shhabat, M.; Abdullah, M.S.; Kashem, A.; Rahman, R. Prediction of mechanical properties of eco-friendly concrete using machine learning algorithms and partial dependence plot analysis. Smart Constr. Sustain. Cities 2025, 3, 2. [Google Scholar] [CrossRef]
  30. ČSN 73 1373; Non-Destructive Testing of Concrete—Determination of Compressive Strength by Hardness Testing Methods. Czech Technical Standard (ČSN): Prague, Czech Republic, 2011.
  31. PCTE. SilverSchmidt Reference Curve. 2019. Available online: https://hammondconcrete.co.uk/wp-content/uploads/2020/06/The-SilverSchmidt-Reference-Curve.pdf (accessed on 10 September 2025).
  32. Tayarani-N, M.H.; Yao, X.; Xu, H. Meta-heuristic algorithms in car engine design: A literature survey. IEEE Trans. Evol. Comput. 2014, 19, 609–629. [Google Scholar] [CrossRef]
  33. Salgotra, R.; Singh, U.; Singh, G.; Mittal, N.; Gandomi, A.H. A self-adaptive hybridized differential evolution naked mole-rat algorithm for engineering optimization problems. Comput. Methods Appl. Mech. Eng. 2021, 383, 113916. [Google Scholar] [CrossRef]
  34. Khalid, O.W.; Isa, N.A.M.; Sakim, H.A.M. Emperor penguin optimizer: A comprehensive review based on state-of-the-art meta-heuristic algorithms. Alex. Eng. J. 2023, 63, 487–526. [Google Scholar] [CrossRef]
  35. Hu, Y.; Dong, J.; Zhang, G.; Wu, Y.; Rong, H.; Zhu, M. Cancer gene selection with adaptive optimization spiking neural p systems and hybrid classifiers. J. Membr. Comput. 2023, 5, 238–251. [Google Scholar] [CrossRef]
  36. Dong, J.; Zhang, G.; Hu, Y.; Wu, Y.; Rong, H. An optimization numerical spiking neural membrane system with adaptive multi-mutation operators for brain tumor segmentation. Int. J. Neural Syst. 2024, 34, 2450036. [Google Scholar] [CrossRef]
  37. Luo, W.; Yu, X. Reinforcement learning-based modified cuckoo search algorithm for economic dispatch problems. Knowl.-Based Syst. 2022, 257, 109844. [Google Scholar] [CrossRef]
  38. Erbas, C.; Cerav-Erbas, S.; Pimentel, A.D. Multiobjective optimization and evolutionary algorithms for the application mapping problem in multiprocessor system-on-chip design. IEEE Trans. Evol. Comput. 2006, 10, 358–374. [Google Scholar] [CrossRef]
  39. Aslan, S.; Karaboga, D. A genetic Artificial Bee Colony algorithm for signal reconstruction based big data optimization. Appl. Soft Comput. 2020, 88, 106053. [Google Scholar] [CrossRef]
  40. Dhal, K.G.; Ray, S.; Das, A.; Das, S. A Survey on Nature-Inspired Optimization Algorithms and Their Application in Image Enhancement Domain: KG Dhal et al. Arch. Comput. Methods Eng. 2019, 26, 1607–1638. [Google Scholar] [CrossRef]
  41. Fong, S.; Deb, S.; Chaudhary, A. A review of metaheuristics in robotics. Comput. Electr. Eng. 2015, 43, 278–291. [Google Scholar] [CrossRef]
  42. Lu, P.; Ye, L.; Zhao, Y.; Dai, B.; Pei, M.; Tang, Y. Review of meta-heuristic algorithms for wind power prediction: Methodologies, applications and challenges. Appl. Energy 2021, 301, 117446. [Google Scholar] [CrossRef]
  43. Shaheen, A.M.; Spea, S.R.; Farrag, S.M.; Abido, M.A. A review of meta-heuristic algorithms for reactive power planning problem. Ain Shams Eng. J. 2018, 9, 215–231. [Google Scholar] [CrossRef]
  44. Karaboga, D. Artificial bee colony algorithm. Scholarpedia 2010, 5, 6915. [Google Scholar] [CrossRef]
  45. Karaboga, D.; Akay, B. A comparative study of artificial bee colony algorithm. Appl. Math. Comput. 2009, 214, 108–132. [Google Scholar] [CrossRef]
  46. Gao, W.f.; Liu, S.y. A modified artificial bee colony algorithm. Comput. Oper. Res. 2012, 39, 687–697. [Google Scholar] [CrossRef]
  47. Bansal, J.C.; Sharma, H.; Jadon, S.S. Artificial bee colony algorithm: A survey. Int. J. Adv. Intell. Paradig. 2013, 5, 123–159. [Google Scholar] [CrossRef]
  48. Kumar, B.; Kumar, D. A review on Artificial Bee Colony algorithm. Int. J. Eng. Technol. 2013, 2, 175. [Google Scholar] [CrossRef]
  49. Boukerche, A.; Zheng, L.; Alfandi, O. Outlier detection: Methods, models, and classification. ACM Comput. Surv. (CSUR) 2020, 53, 1–37. [Google Scholar] [CrossRef]
  50. Alghushairy, O.; Alsini, R.; Soule, T.; Ma, X. A review of local outlier factor algorithms for outlier detection in big data streams. Big Data Cogn. Comput. 2020, 5, 1. [Google Scholar] [CrossRef]
  51. Xu, H.; Zhang, L.; Li, P.; Zhu, F. Outlier detection algorithm based on k-nearest neighbors-local outlier factor. J. Algorithms Comput. Technol. 2022, 16, 17483026221078111. [Google Scholar] [CrossRef]
  52. Ma, H.; Hu, Y.; Shi, H. Fault detection and identification based on the neighborhood standardized local outlier factor method. Ind. Eng. Chem. Res. 2013, 52, 2389–2402. [Google Scholar] [CrossRef]
  53. Abdel-Basset, M.; Abdel-Fatah, L.; Sangaiah, A.K. Metaheuristic algorithms: A comprehensive review. In Computational Intelligence for Multimedia Big Data on the Cloud with Engineering Applications; Elsevier: Amsterdam, The Netherlands, 2018; pp. 185–231. [Google Scholar]
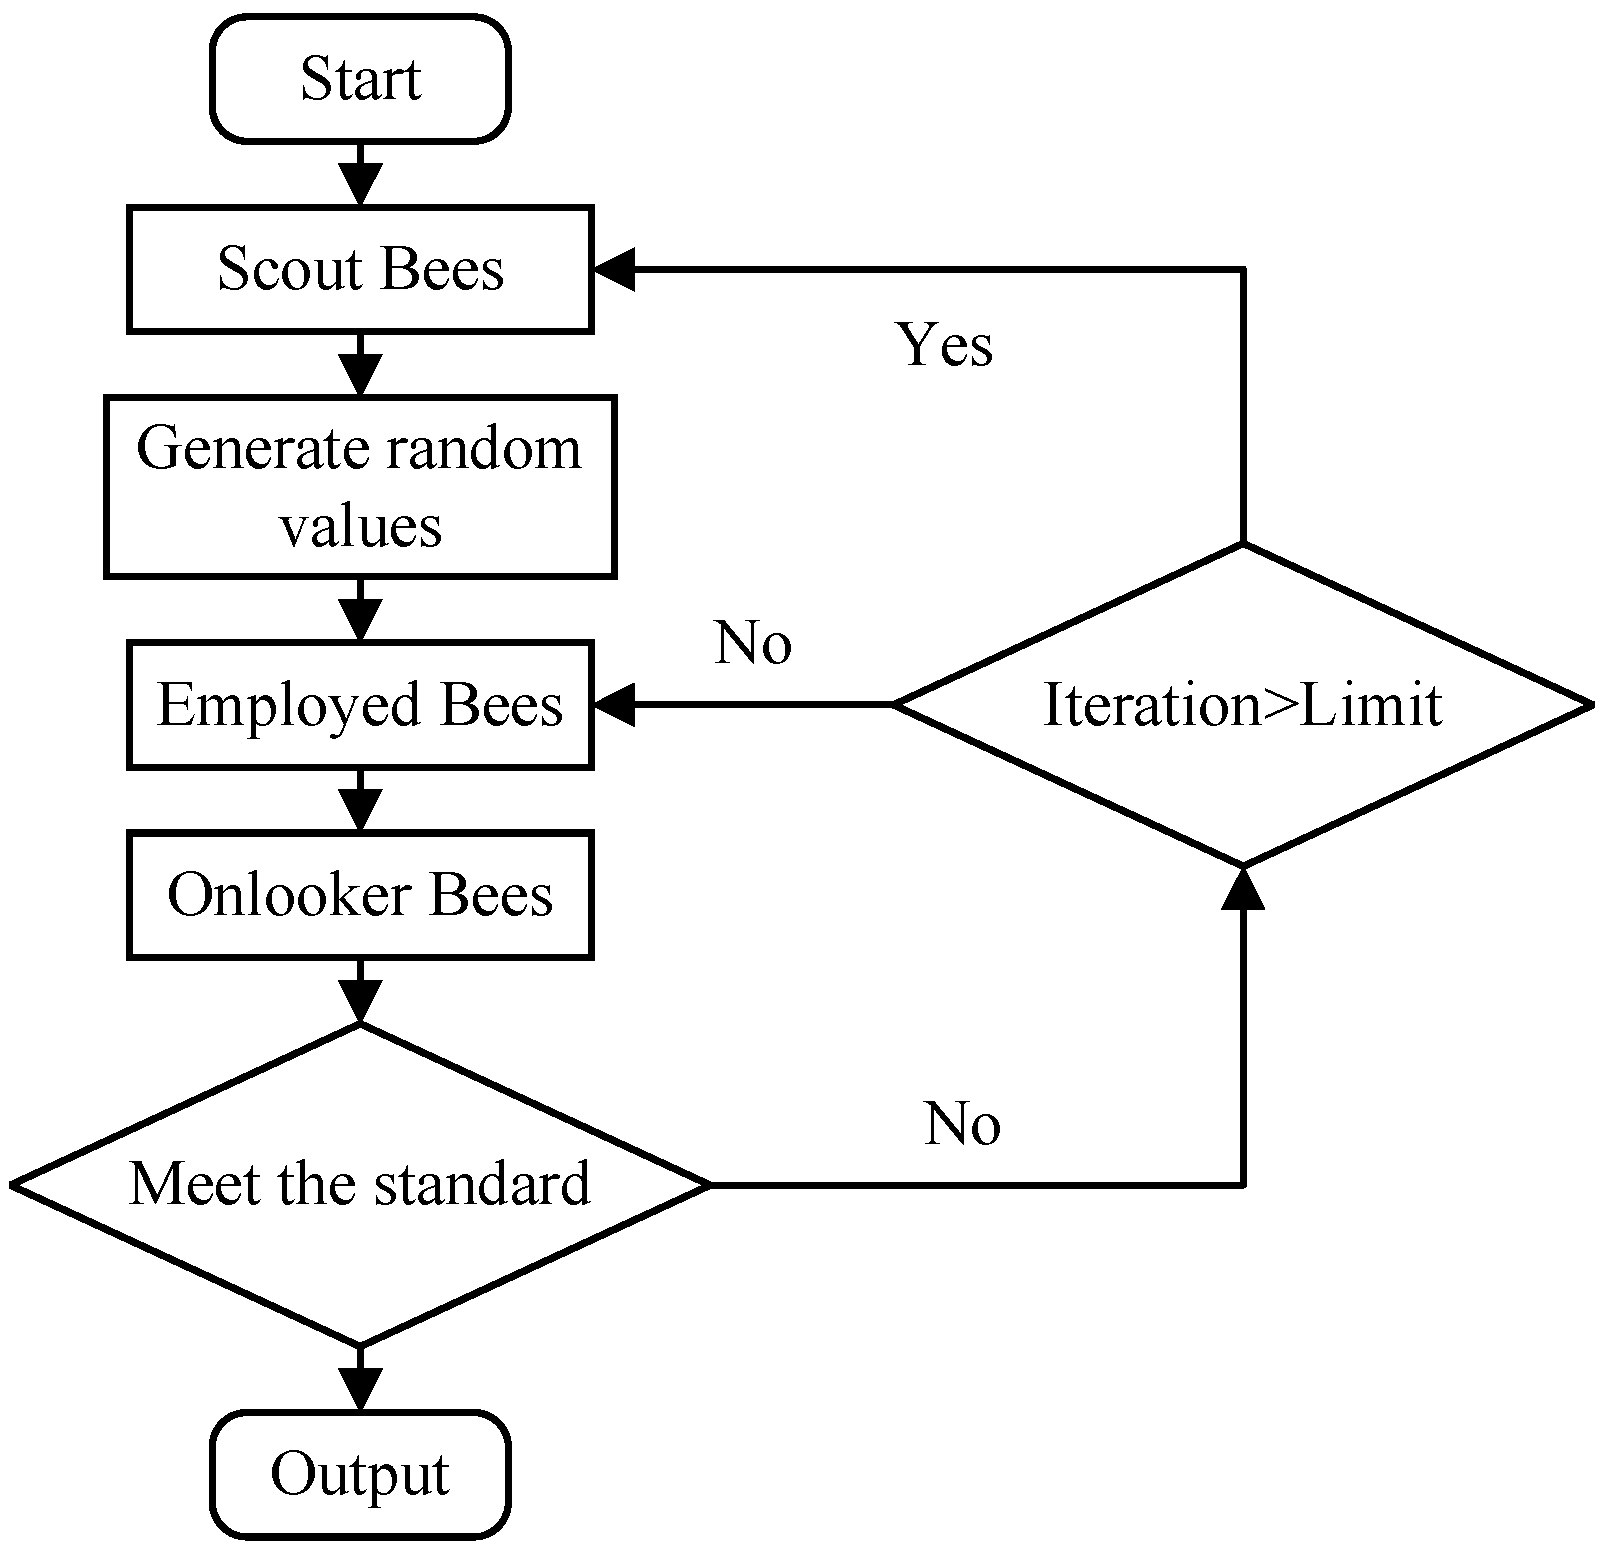
Figure 1. Artificial bee colony algorithm.
Eng 06 00282 g001
Figure 2. Overall framework of proposed method.
Eng 06 00282 g002
Figure 3. Gaussian kernel density.
Eng 06 00282 g003
Figure 4. Conducting a search in the direction of the gradient.
Eng 06 00282 g004
Figure 5. Preprocessing results.
Eng 06 00282 g005
Figure 6. Convergence and fitting results for nonlinear least squares results.
Eng 06 00282 g006
Figure 7. Convergence and fitting results for proposed method and compared methods.
Eng 06 00282 g007
Figure 8. Original prediction curve and corrected prediction curve.
Eng 06 00282 g008
Table 1. Convergence results of different methods.
MethodsRERRMSEMAE R 2
Nonlinear least squares 12.45 % 8.15 7.05 0.3612
SGD 21.84 % 8.77 7.09 0.2595
Adam 12.62 % 8.72 7.08 0.3079
ABC 12.13 % 8.69 7.13 0.2725
Proposed Method 12.03 % 8.66 7.08 0.2773
Disclaimer/Publisher’s Note: The statements, opinions and data contained in all publications are solely those of the individual author(s) and contributor(s) and not of MDPI and/or the editor(s). MDPI and/or the editor(s) disclaim responsibility for any injury to people or property resulting from any ideas, methods, instructions or products referred to in the content.