Abstract
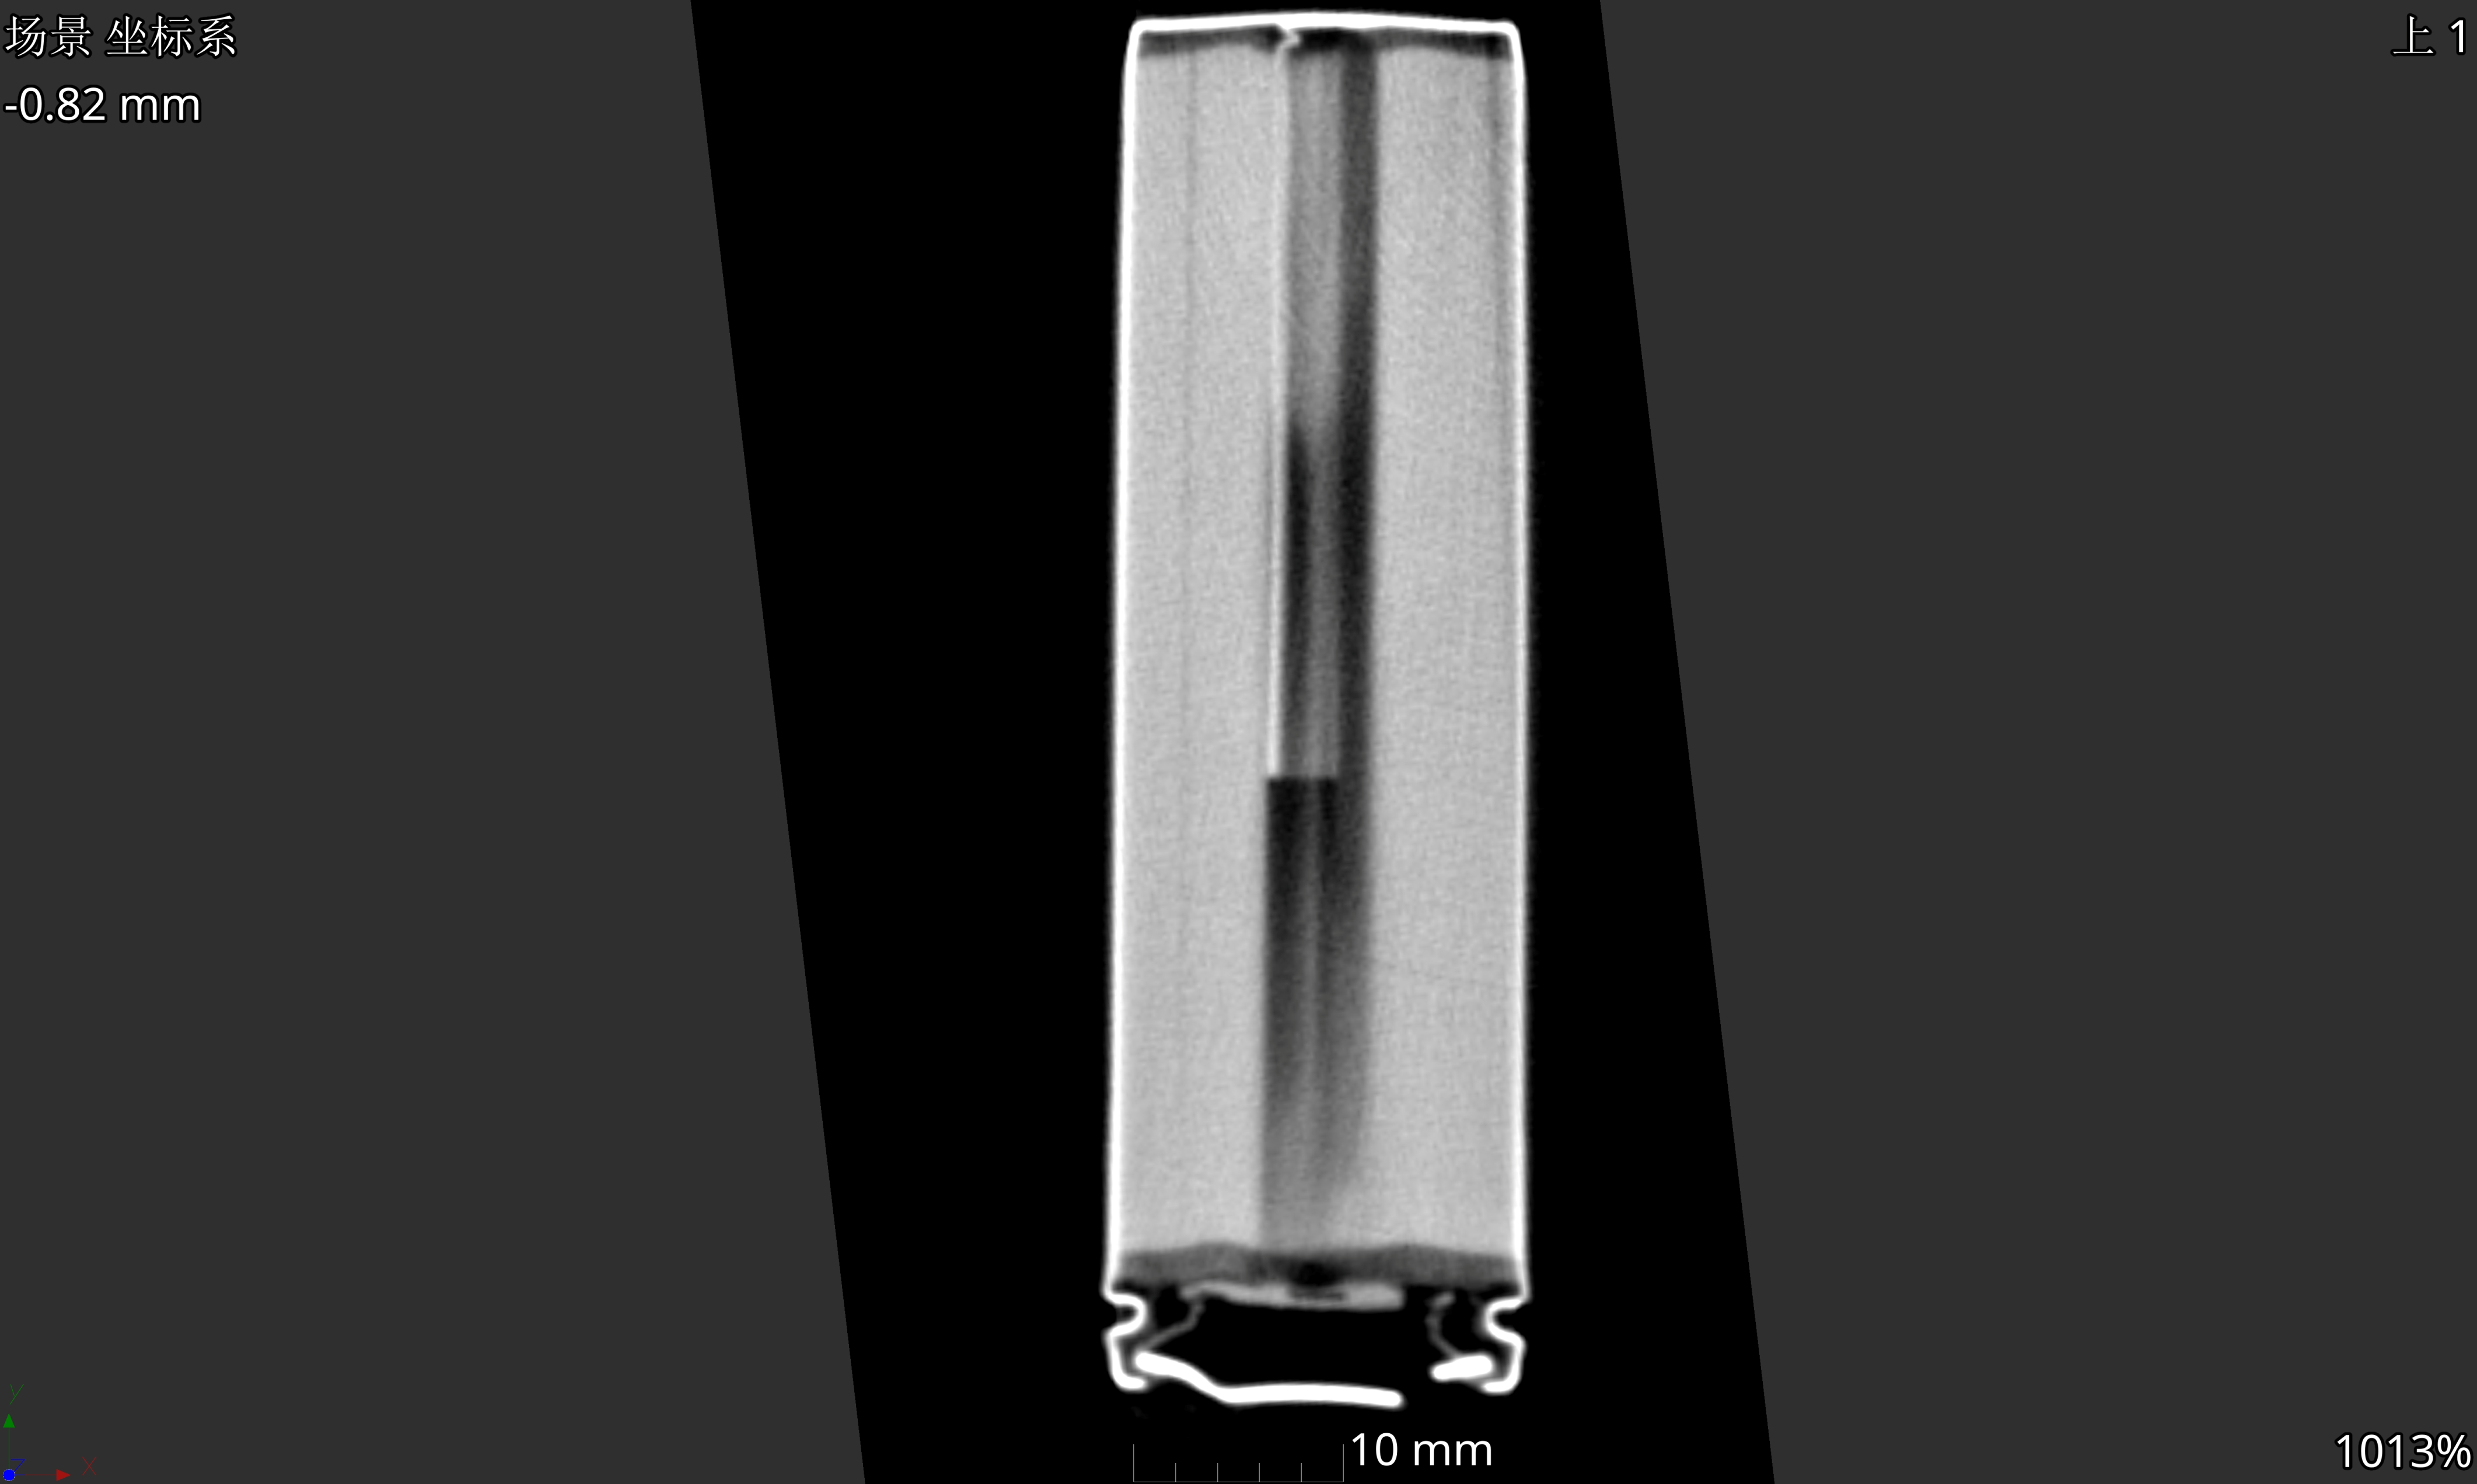
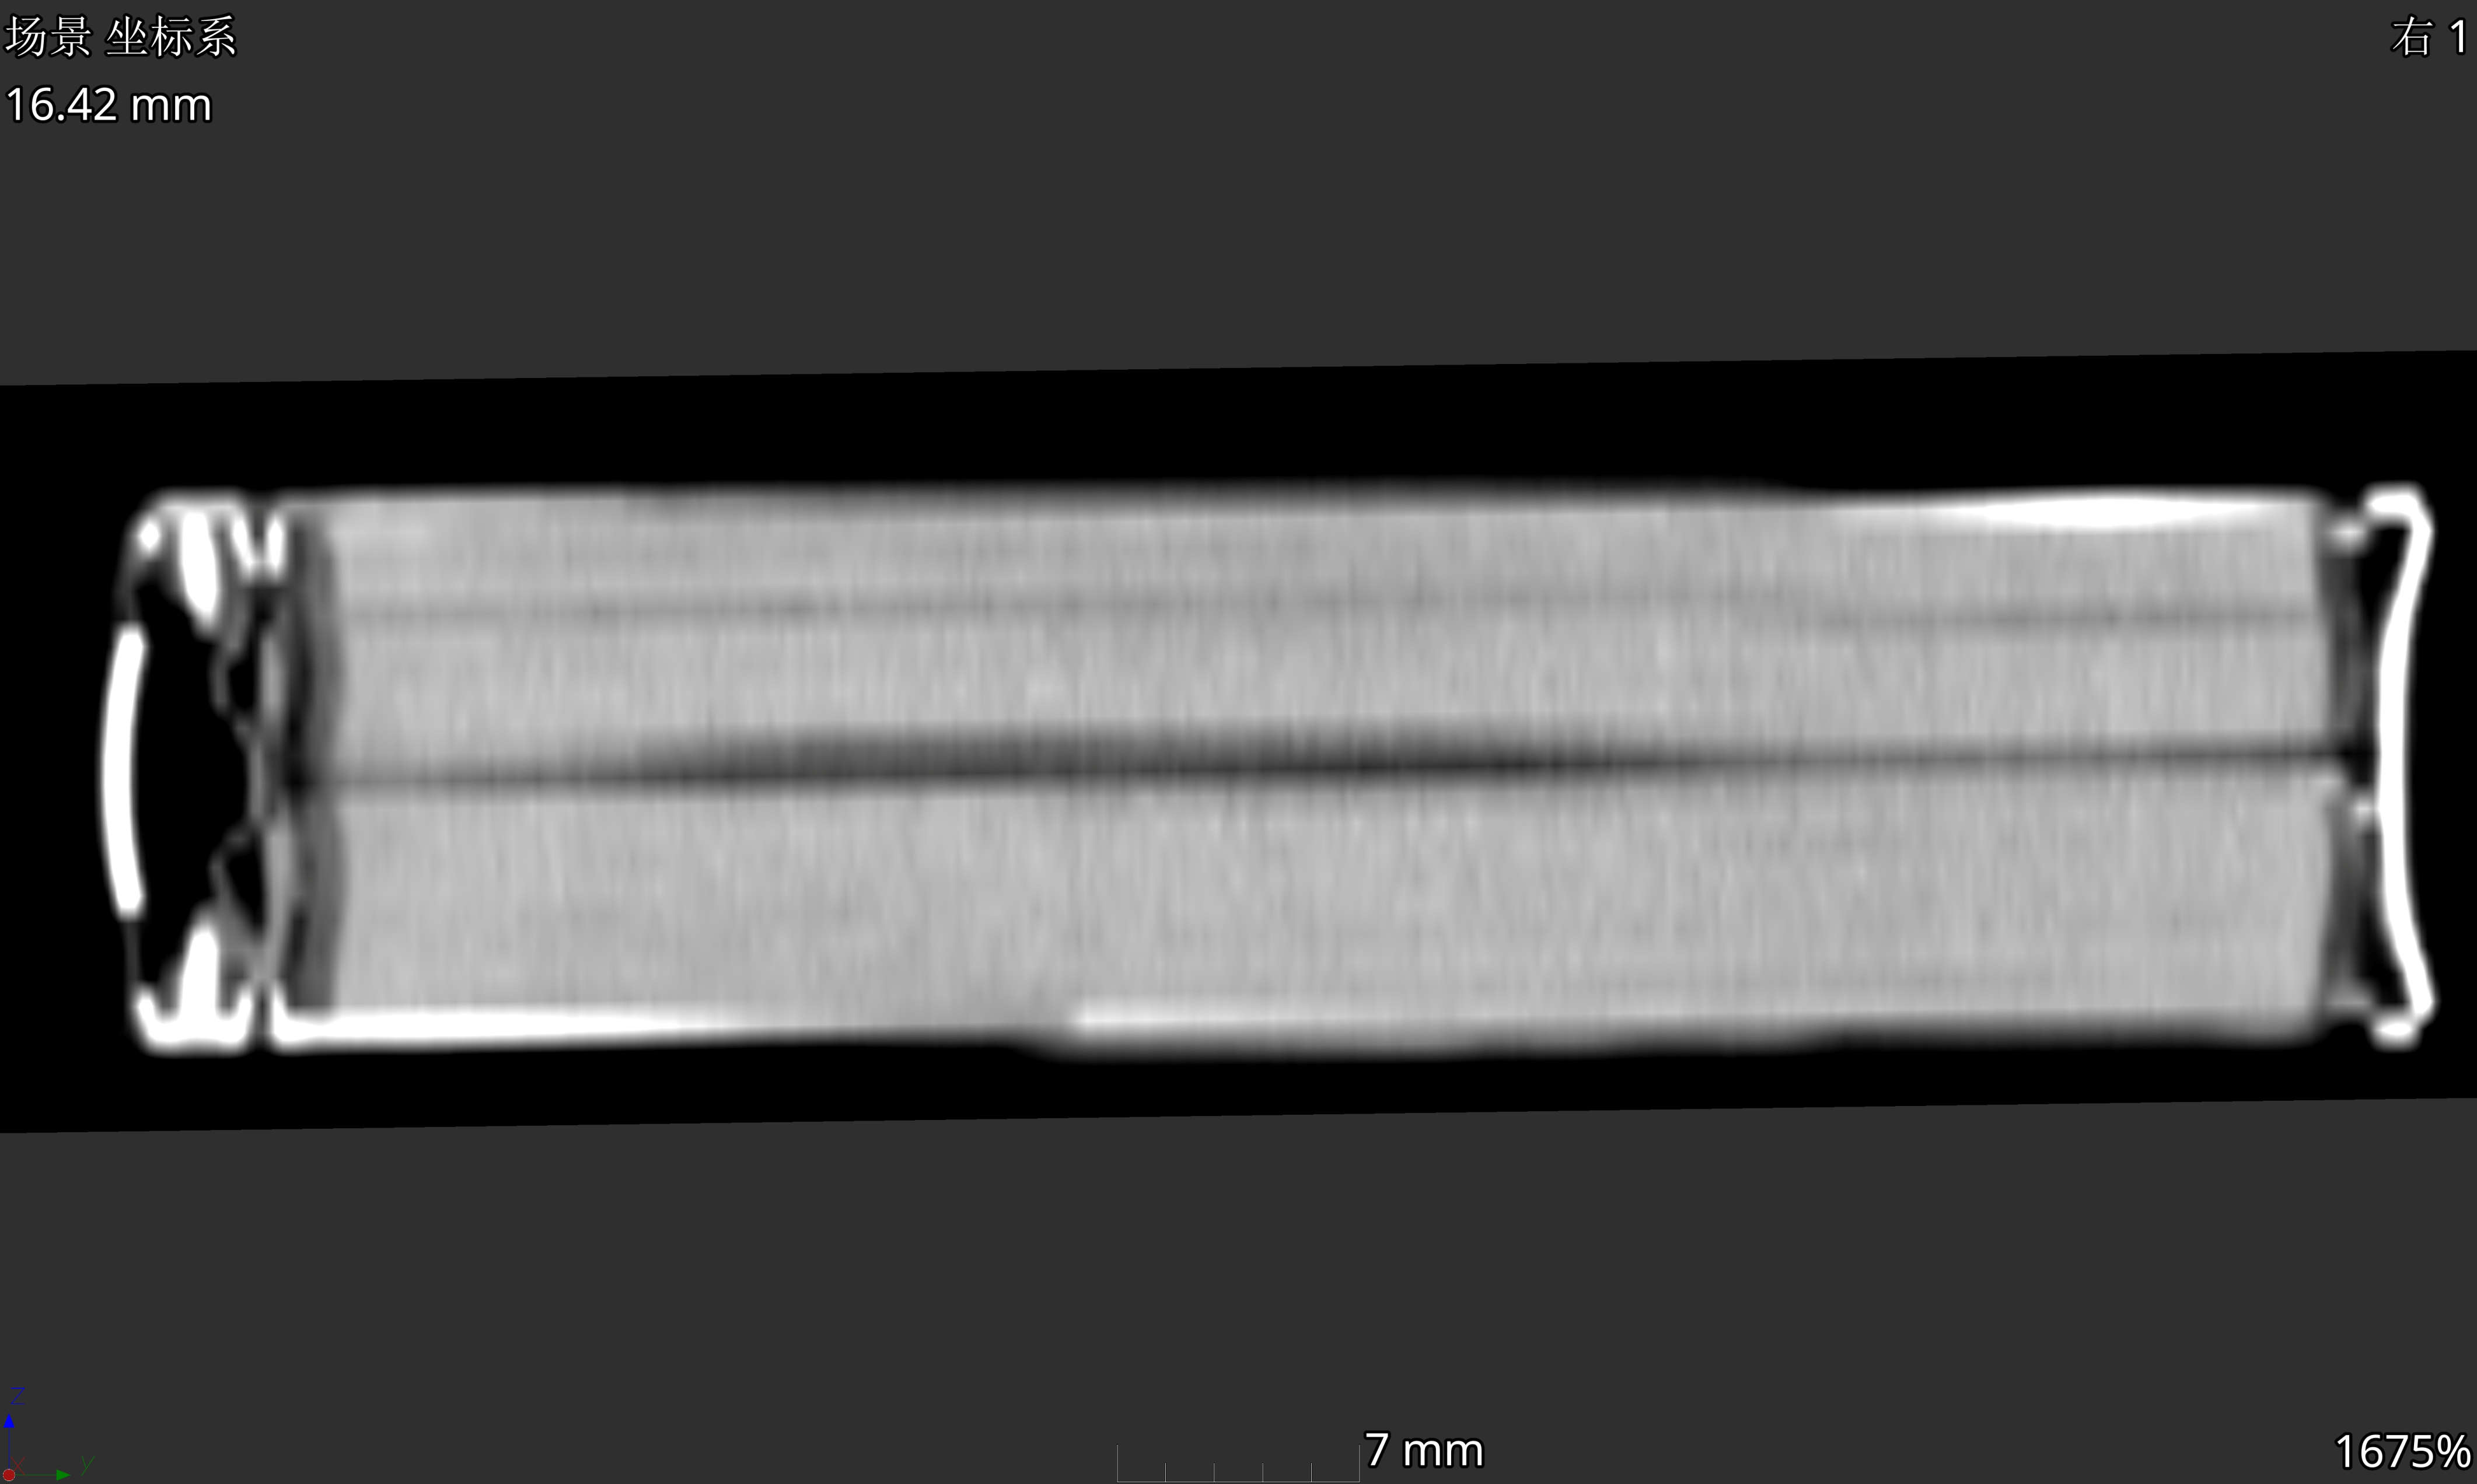
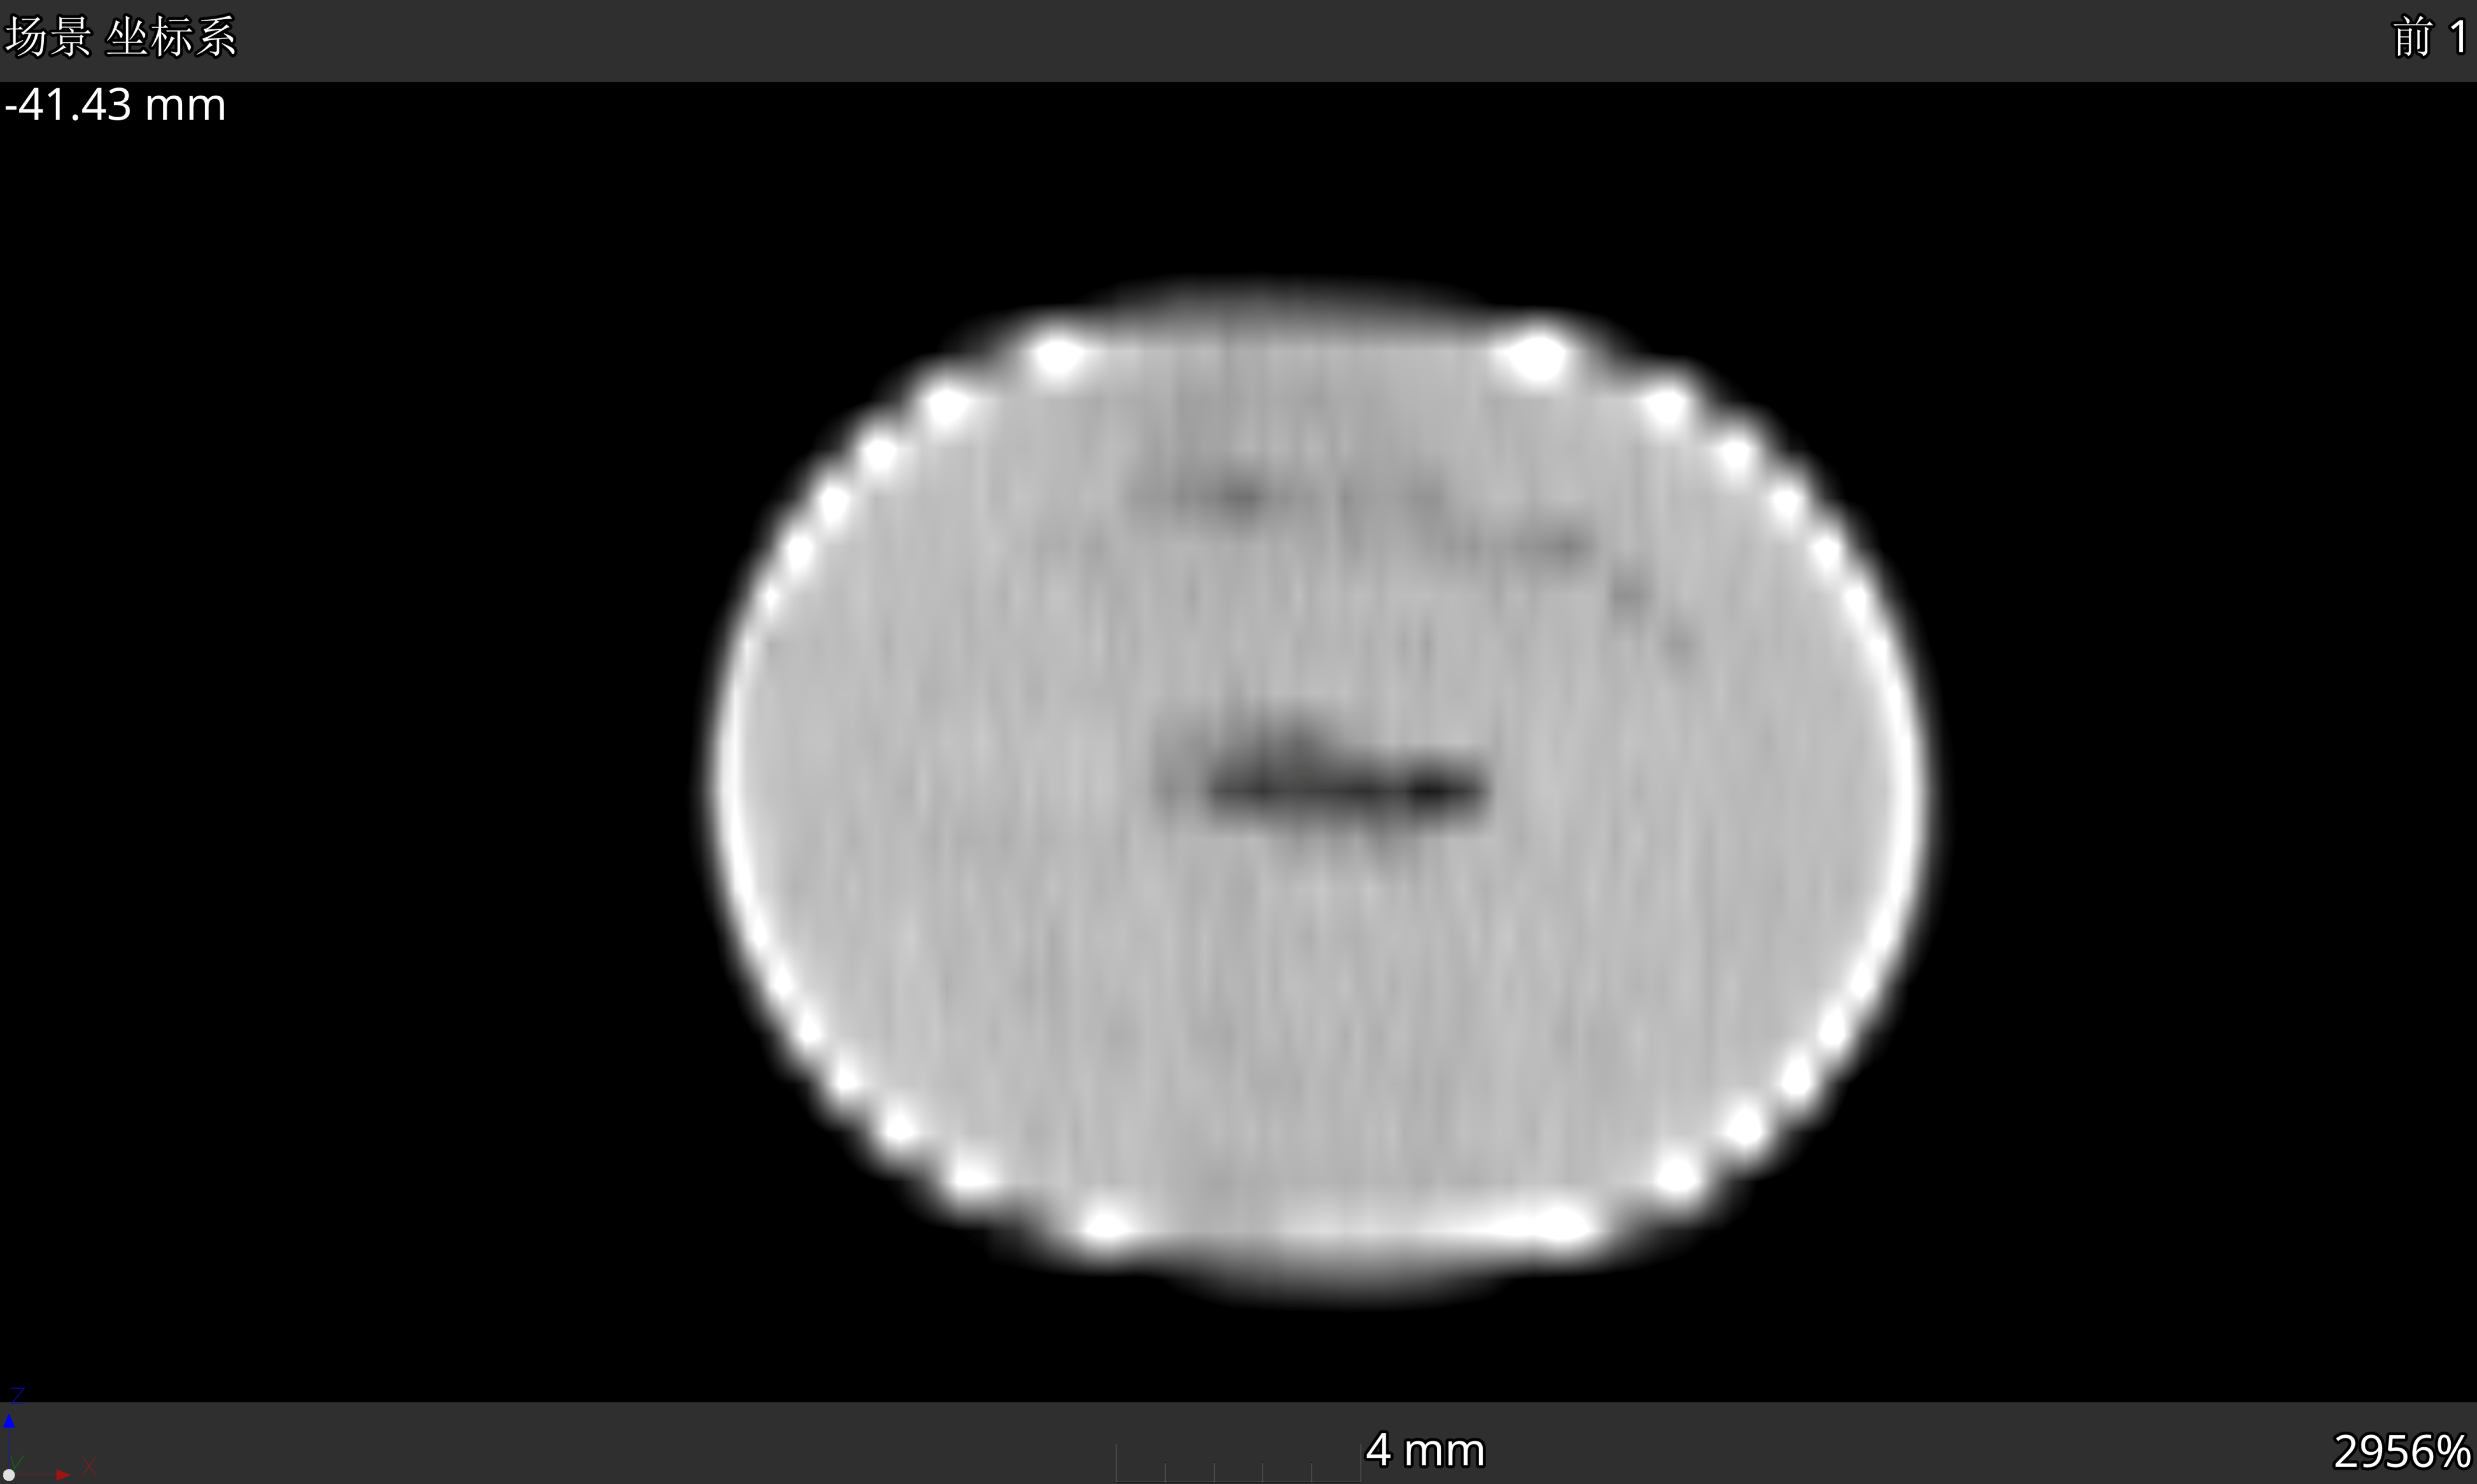
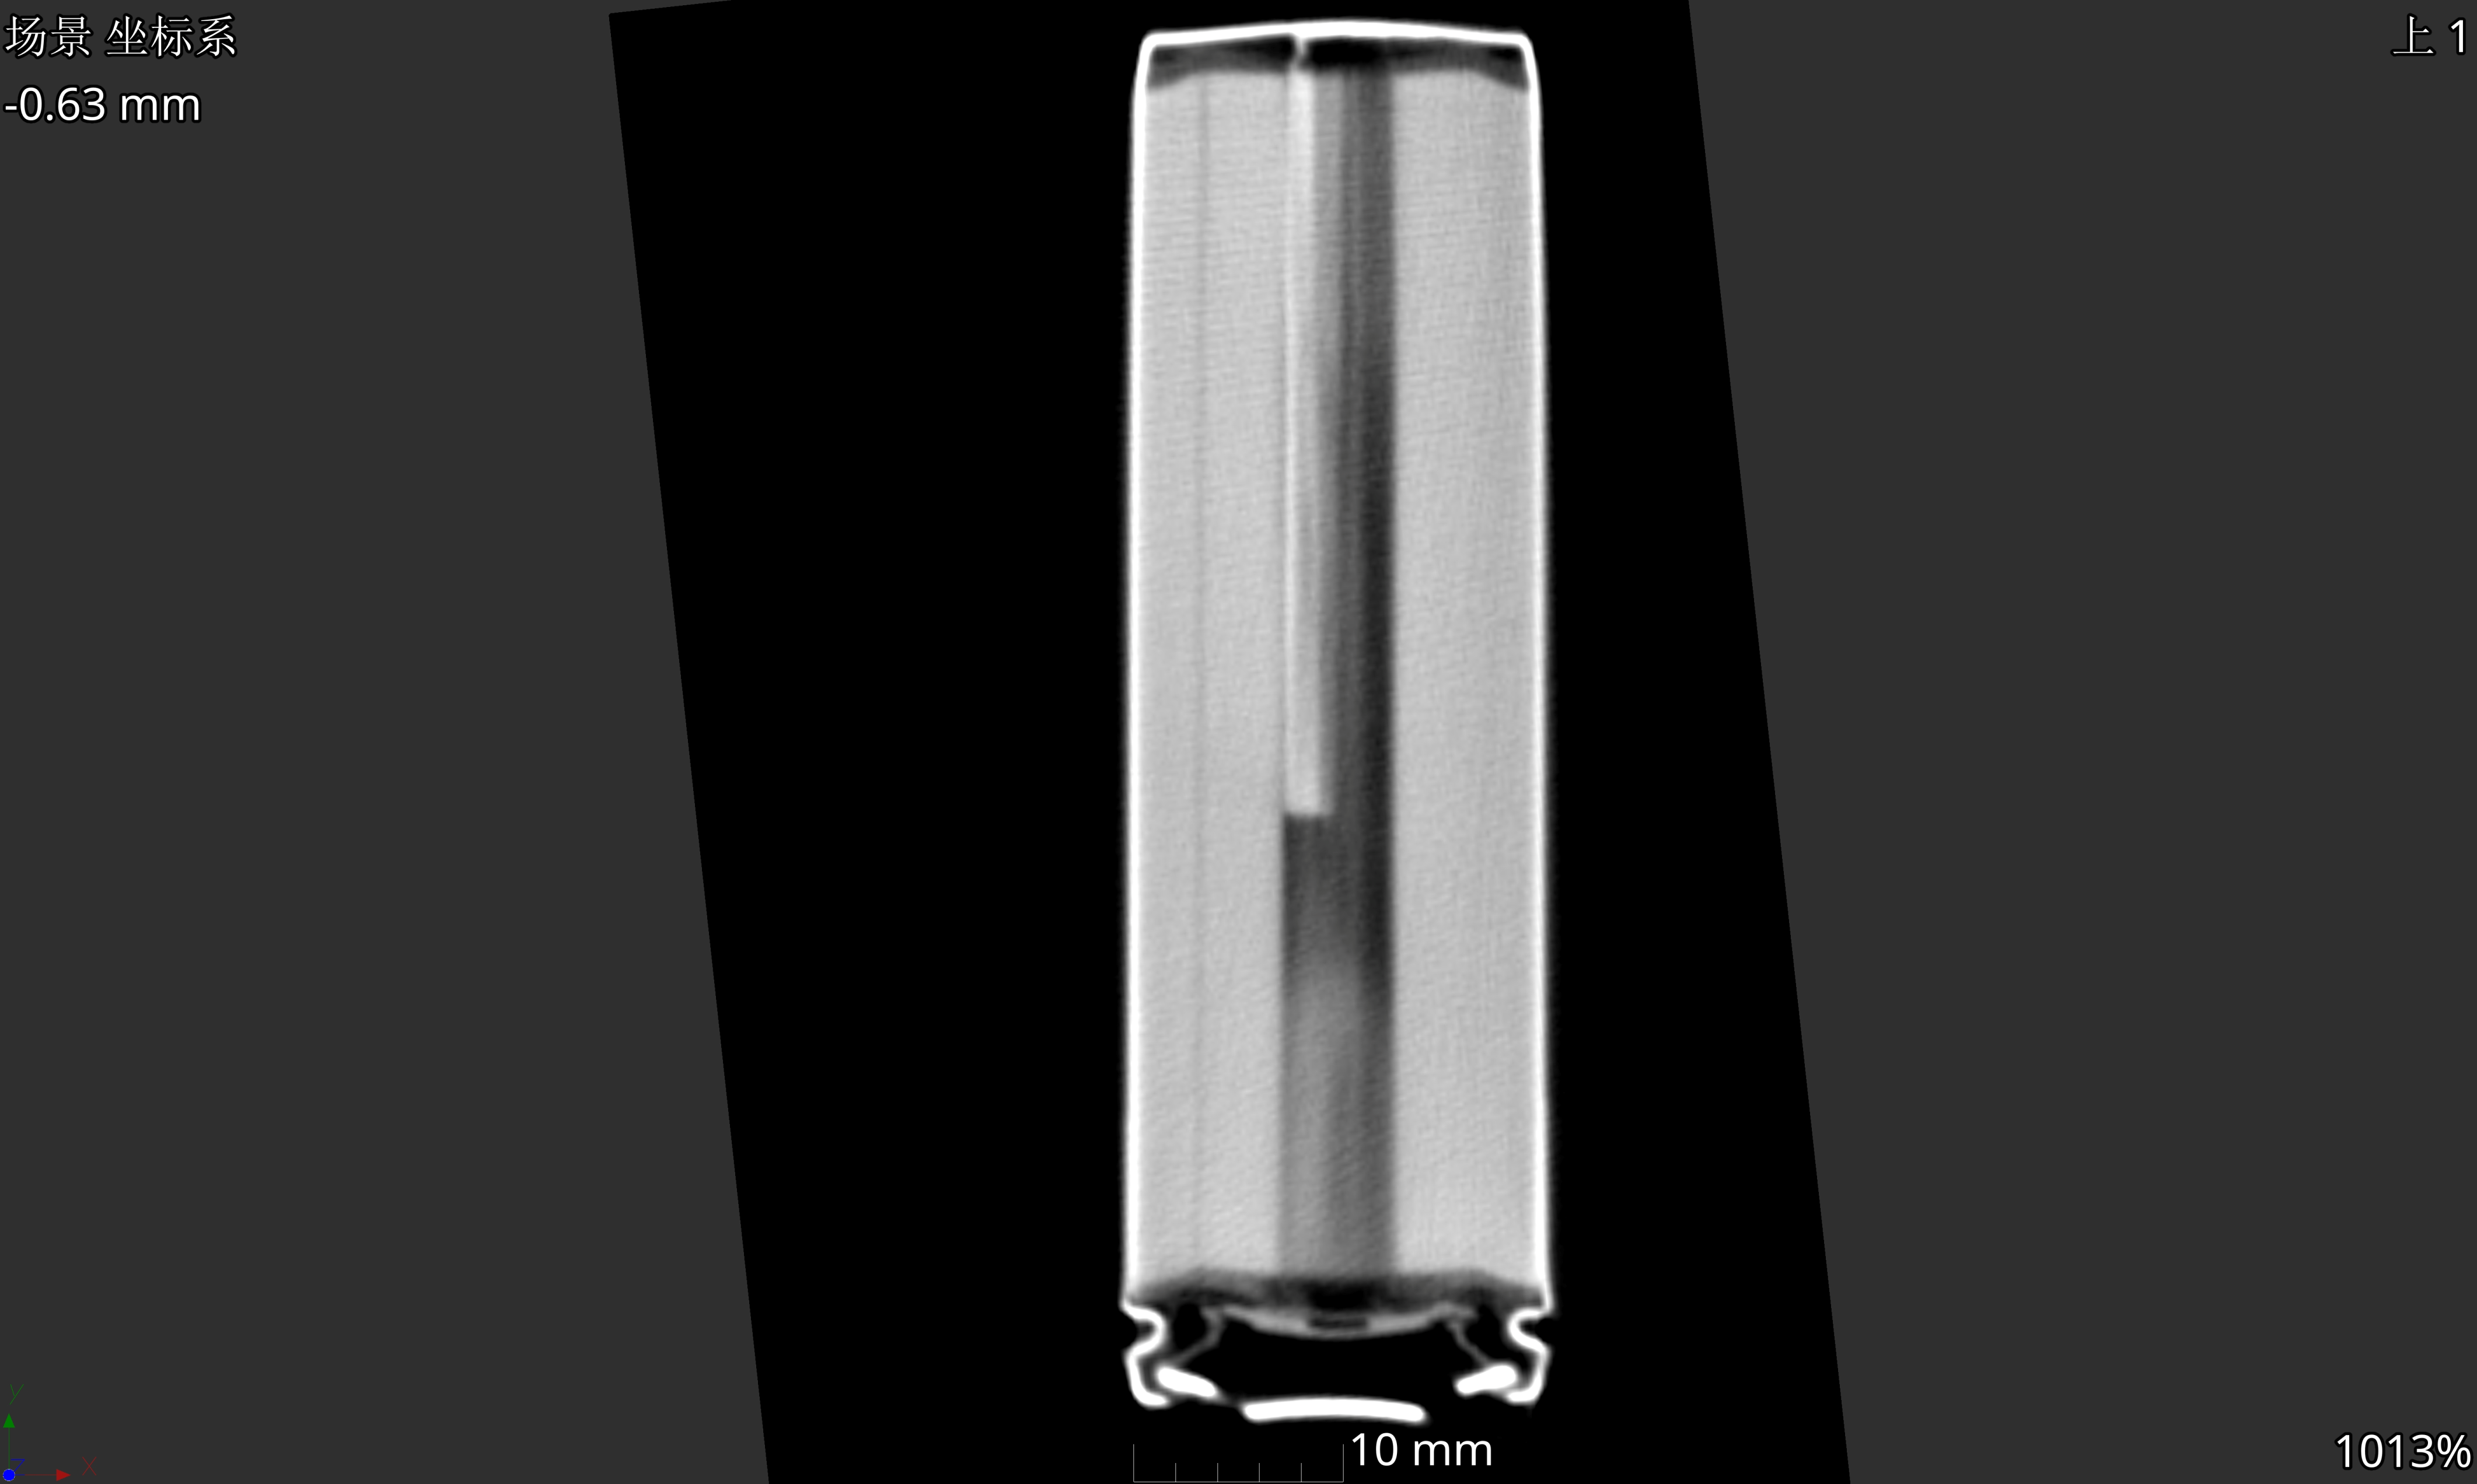
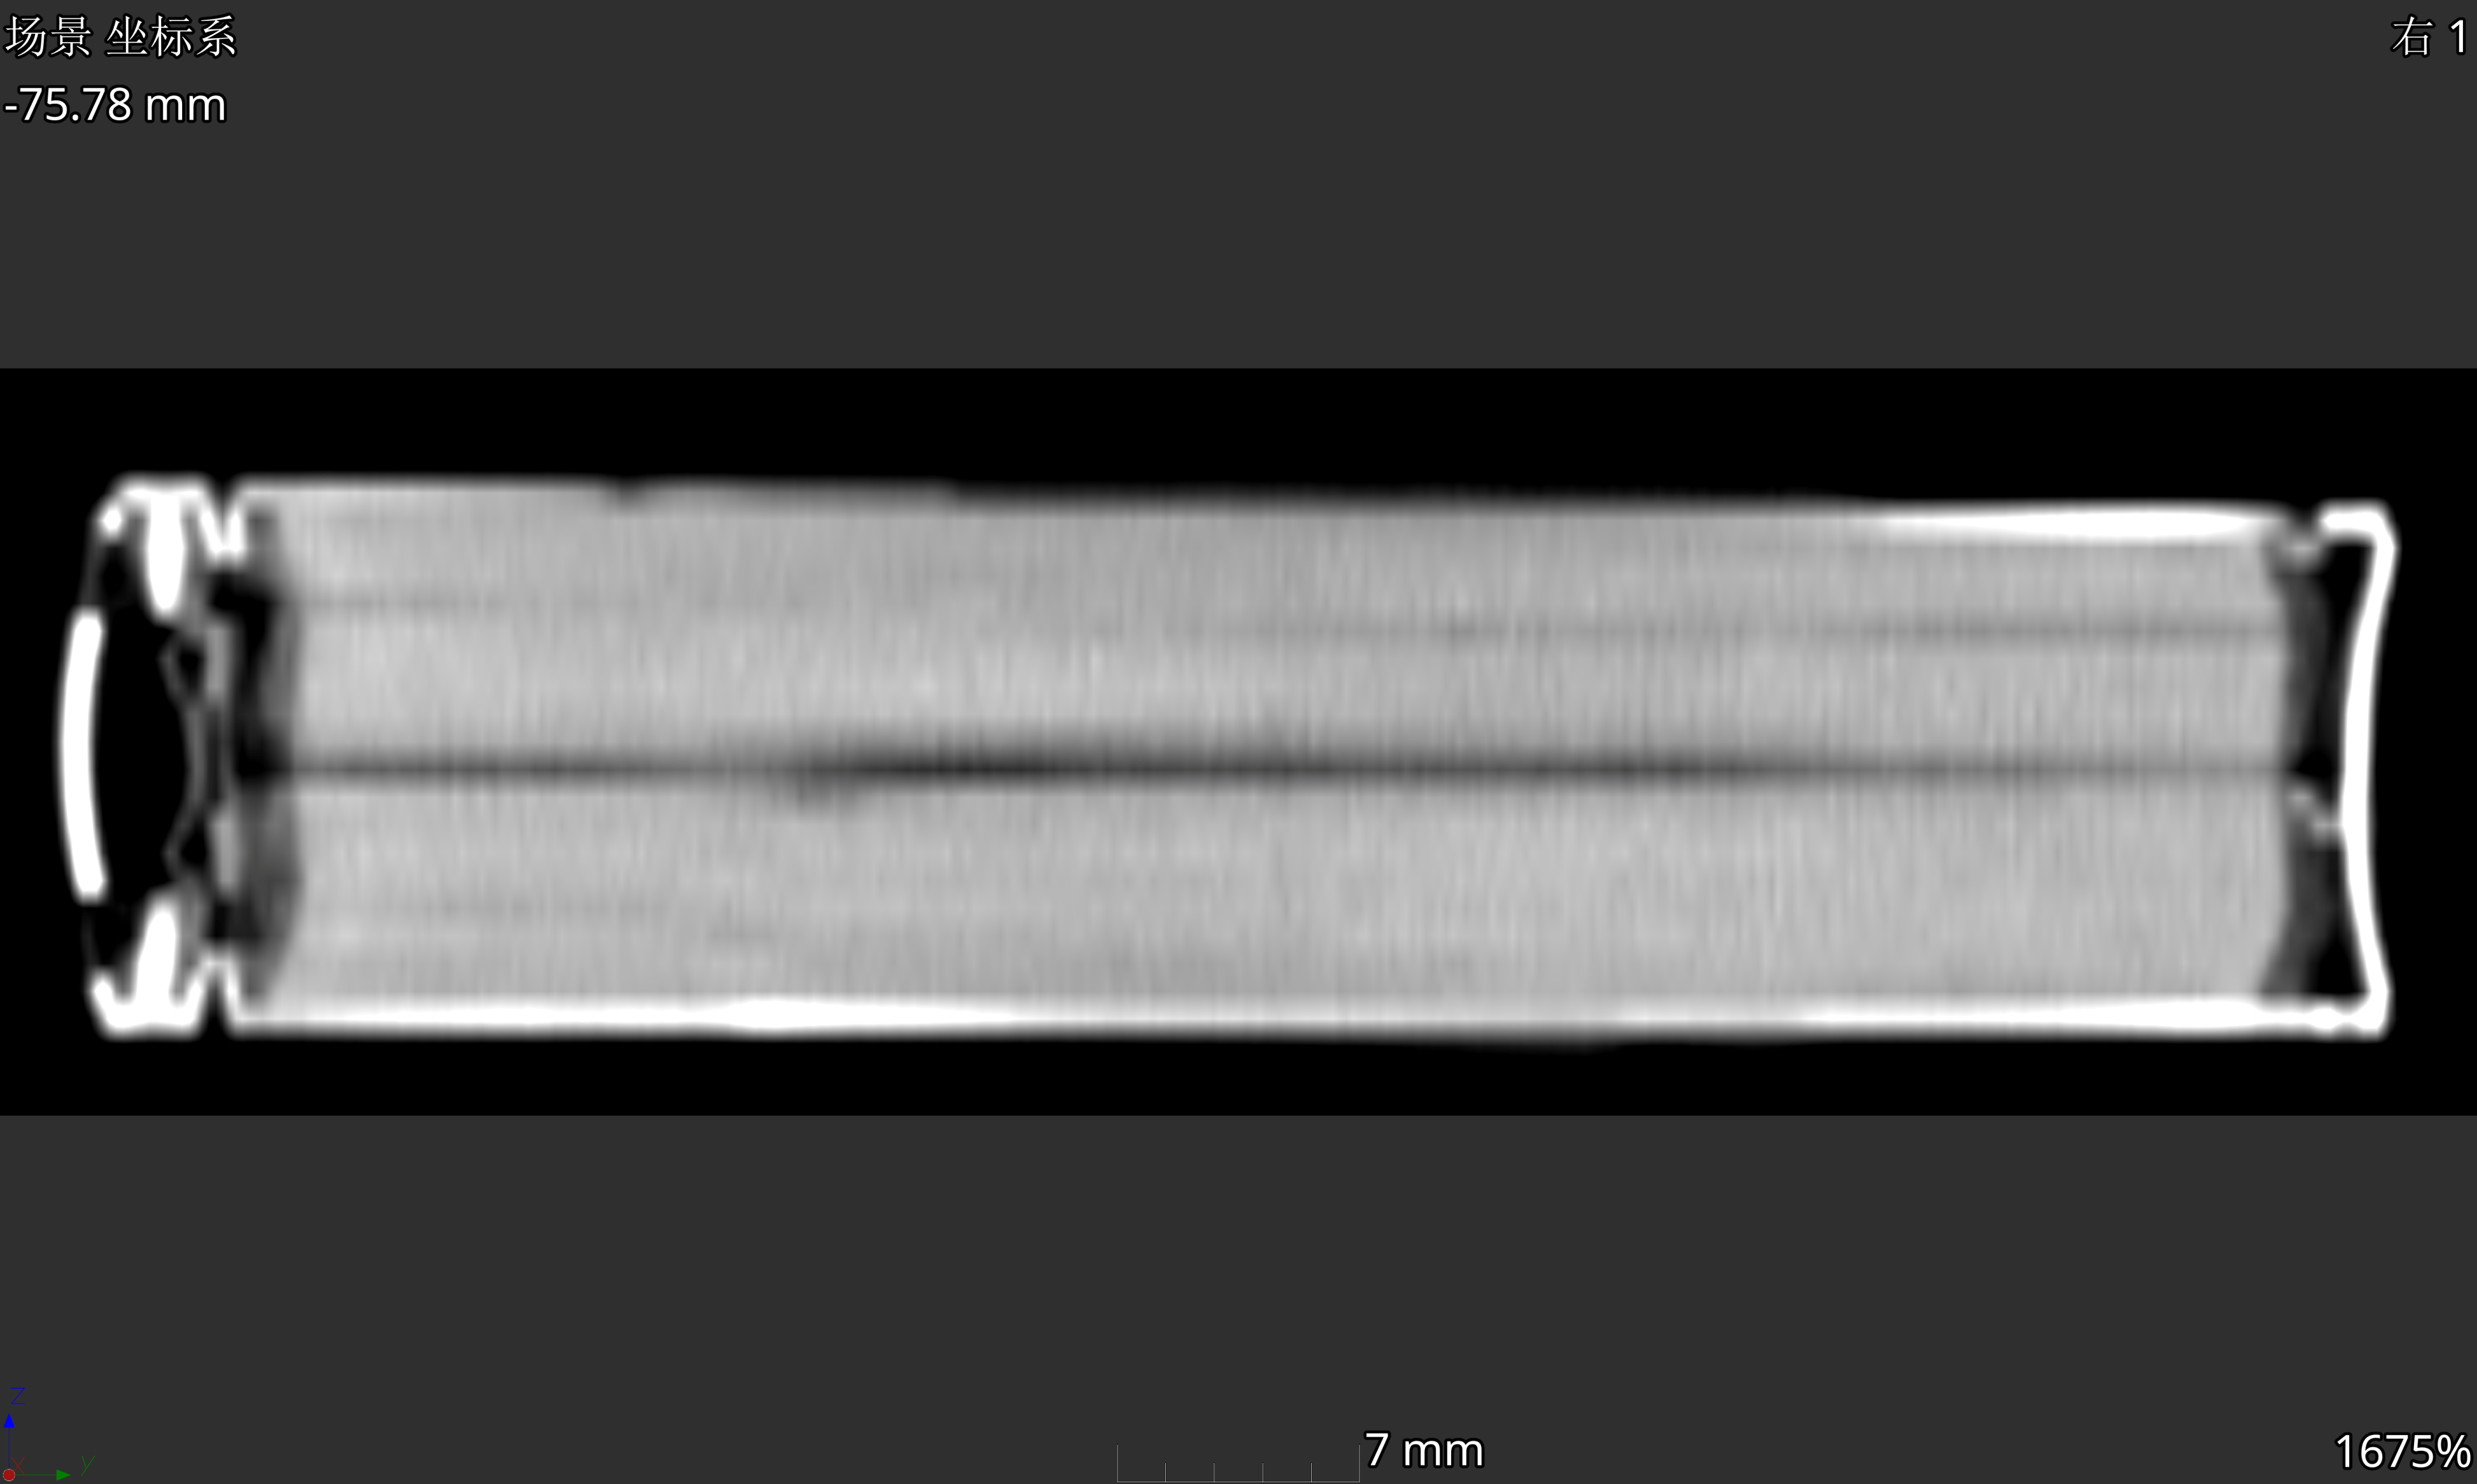
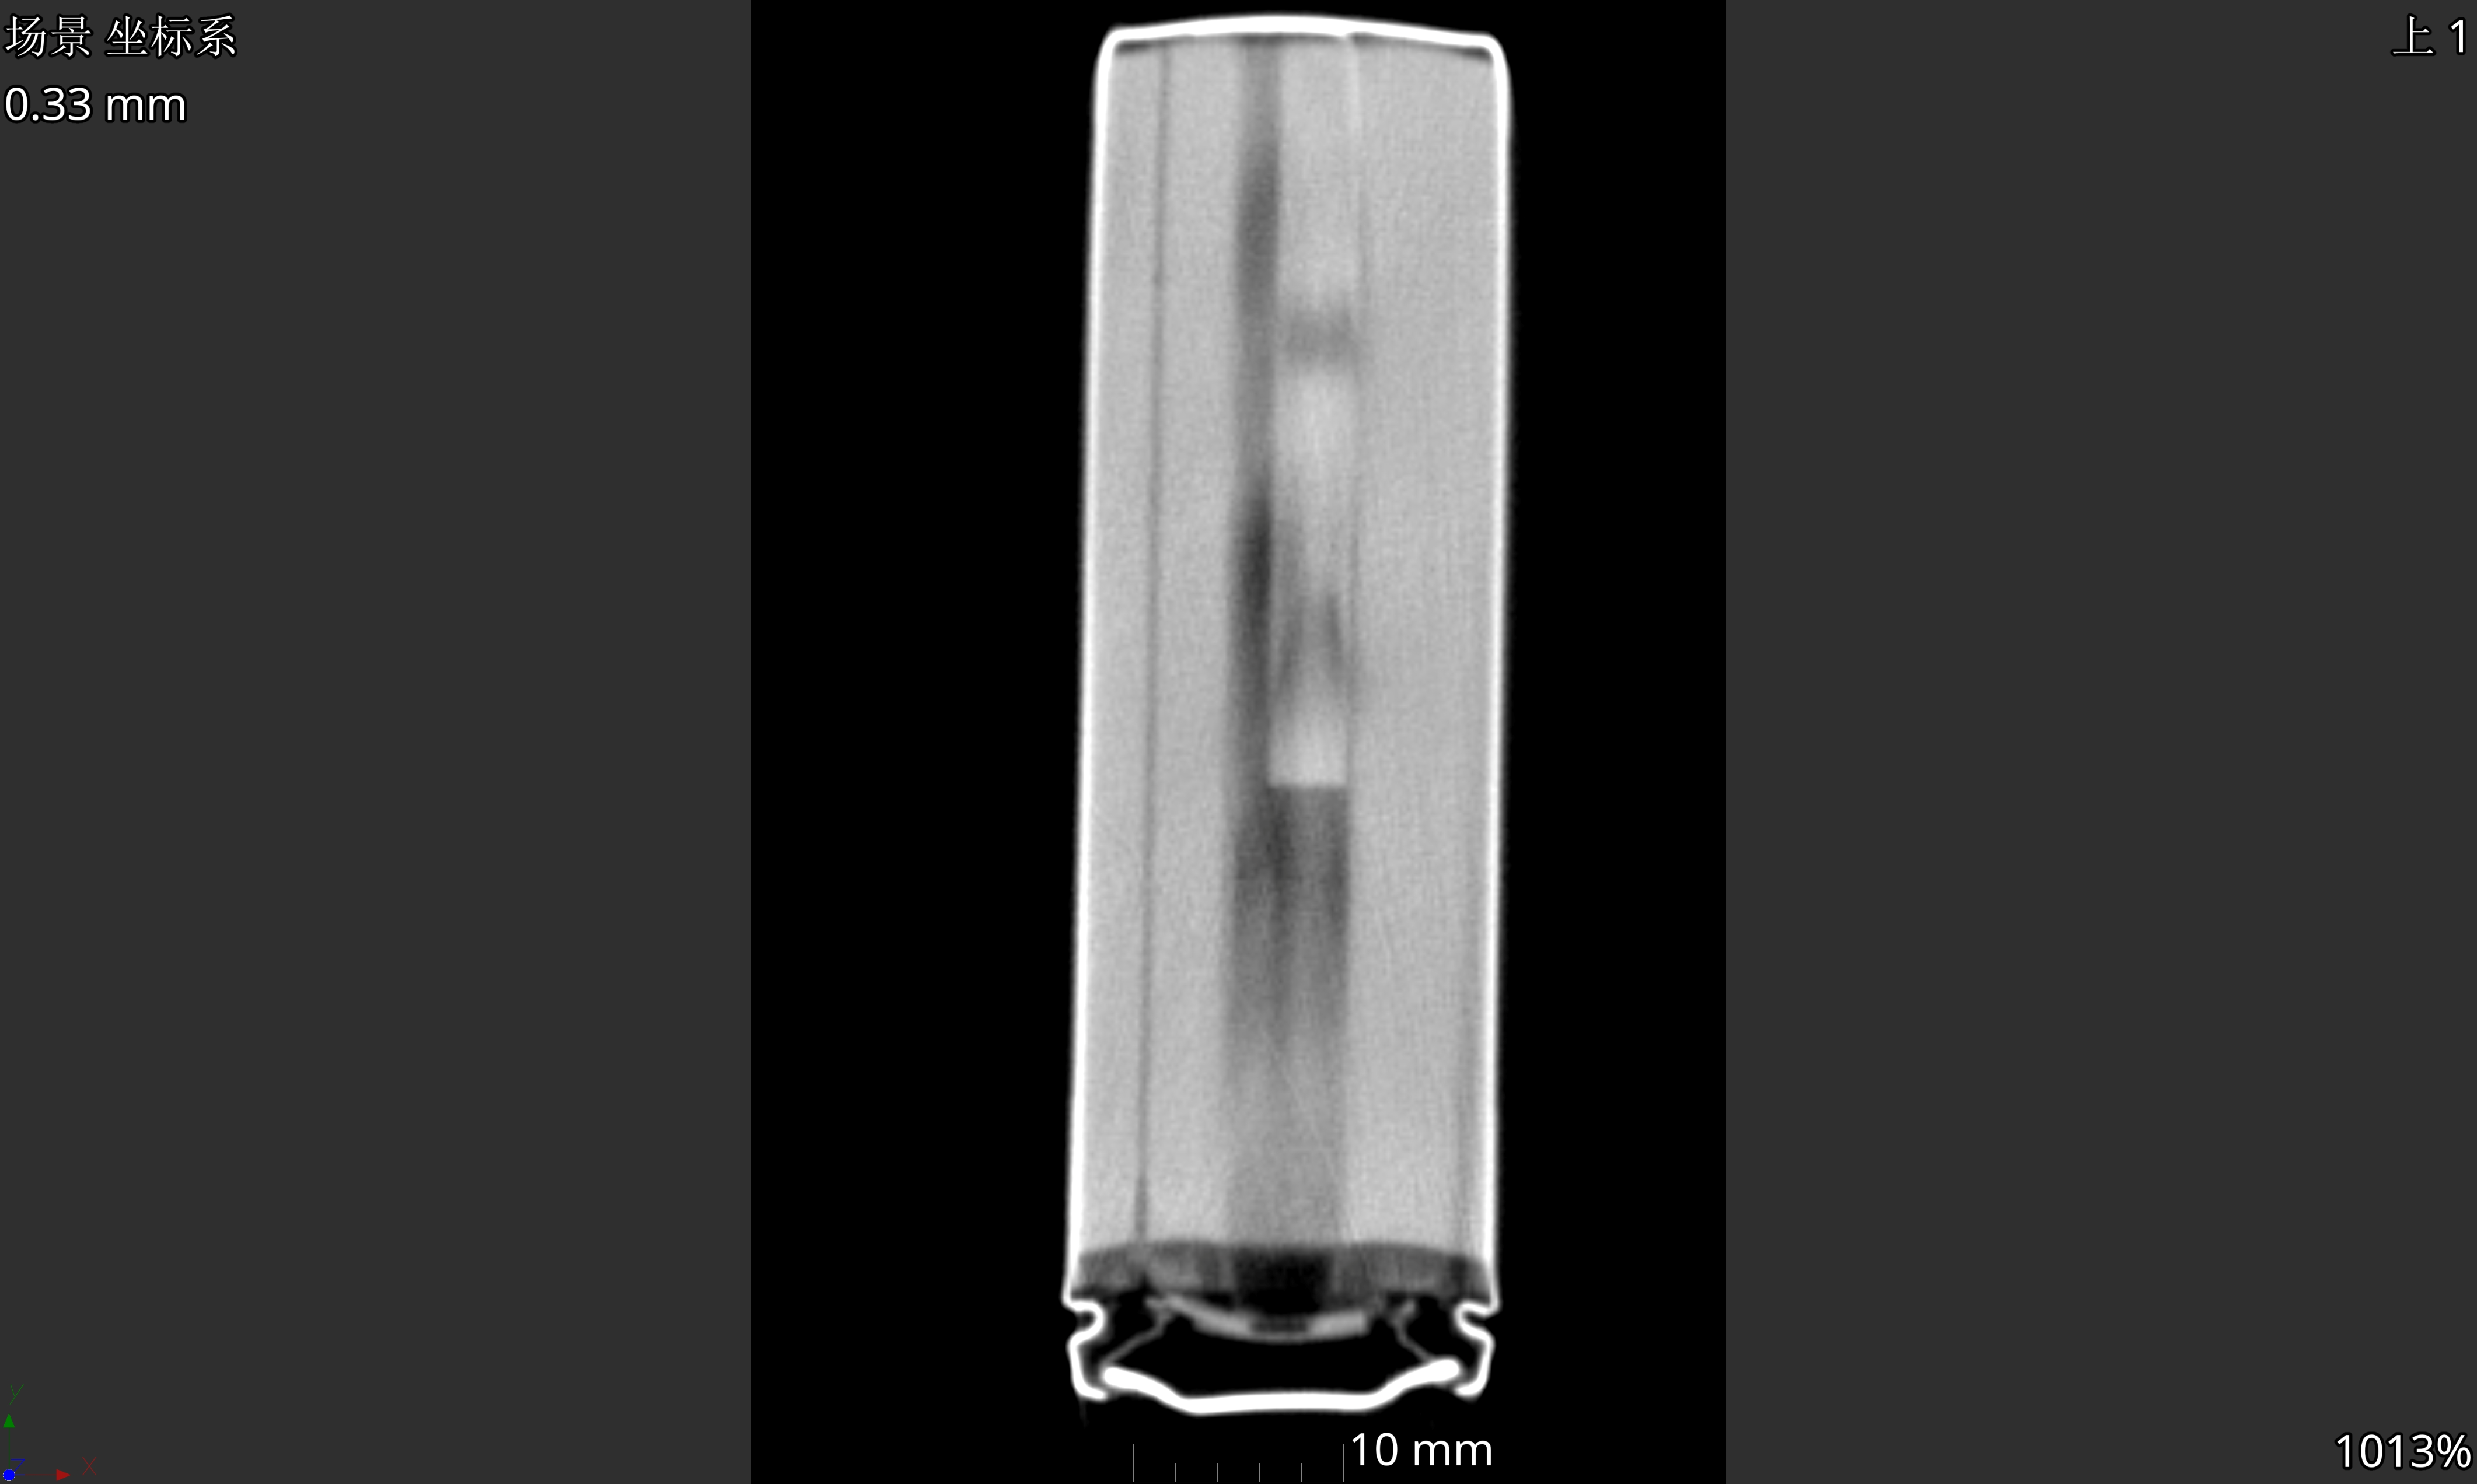
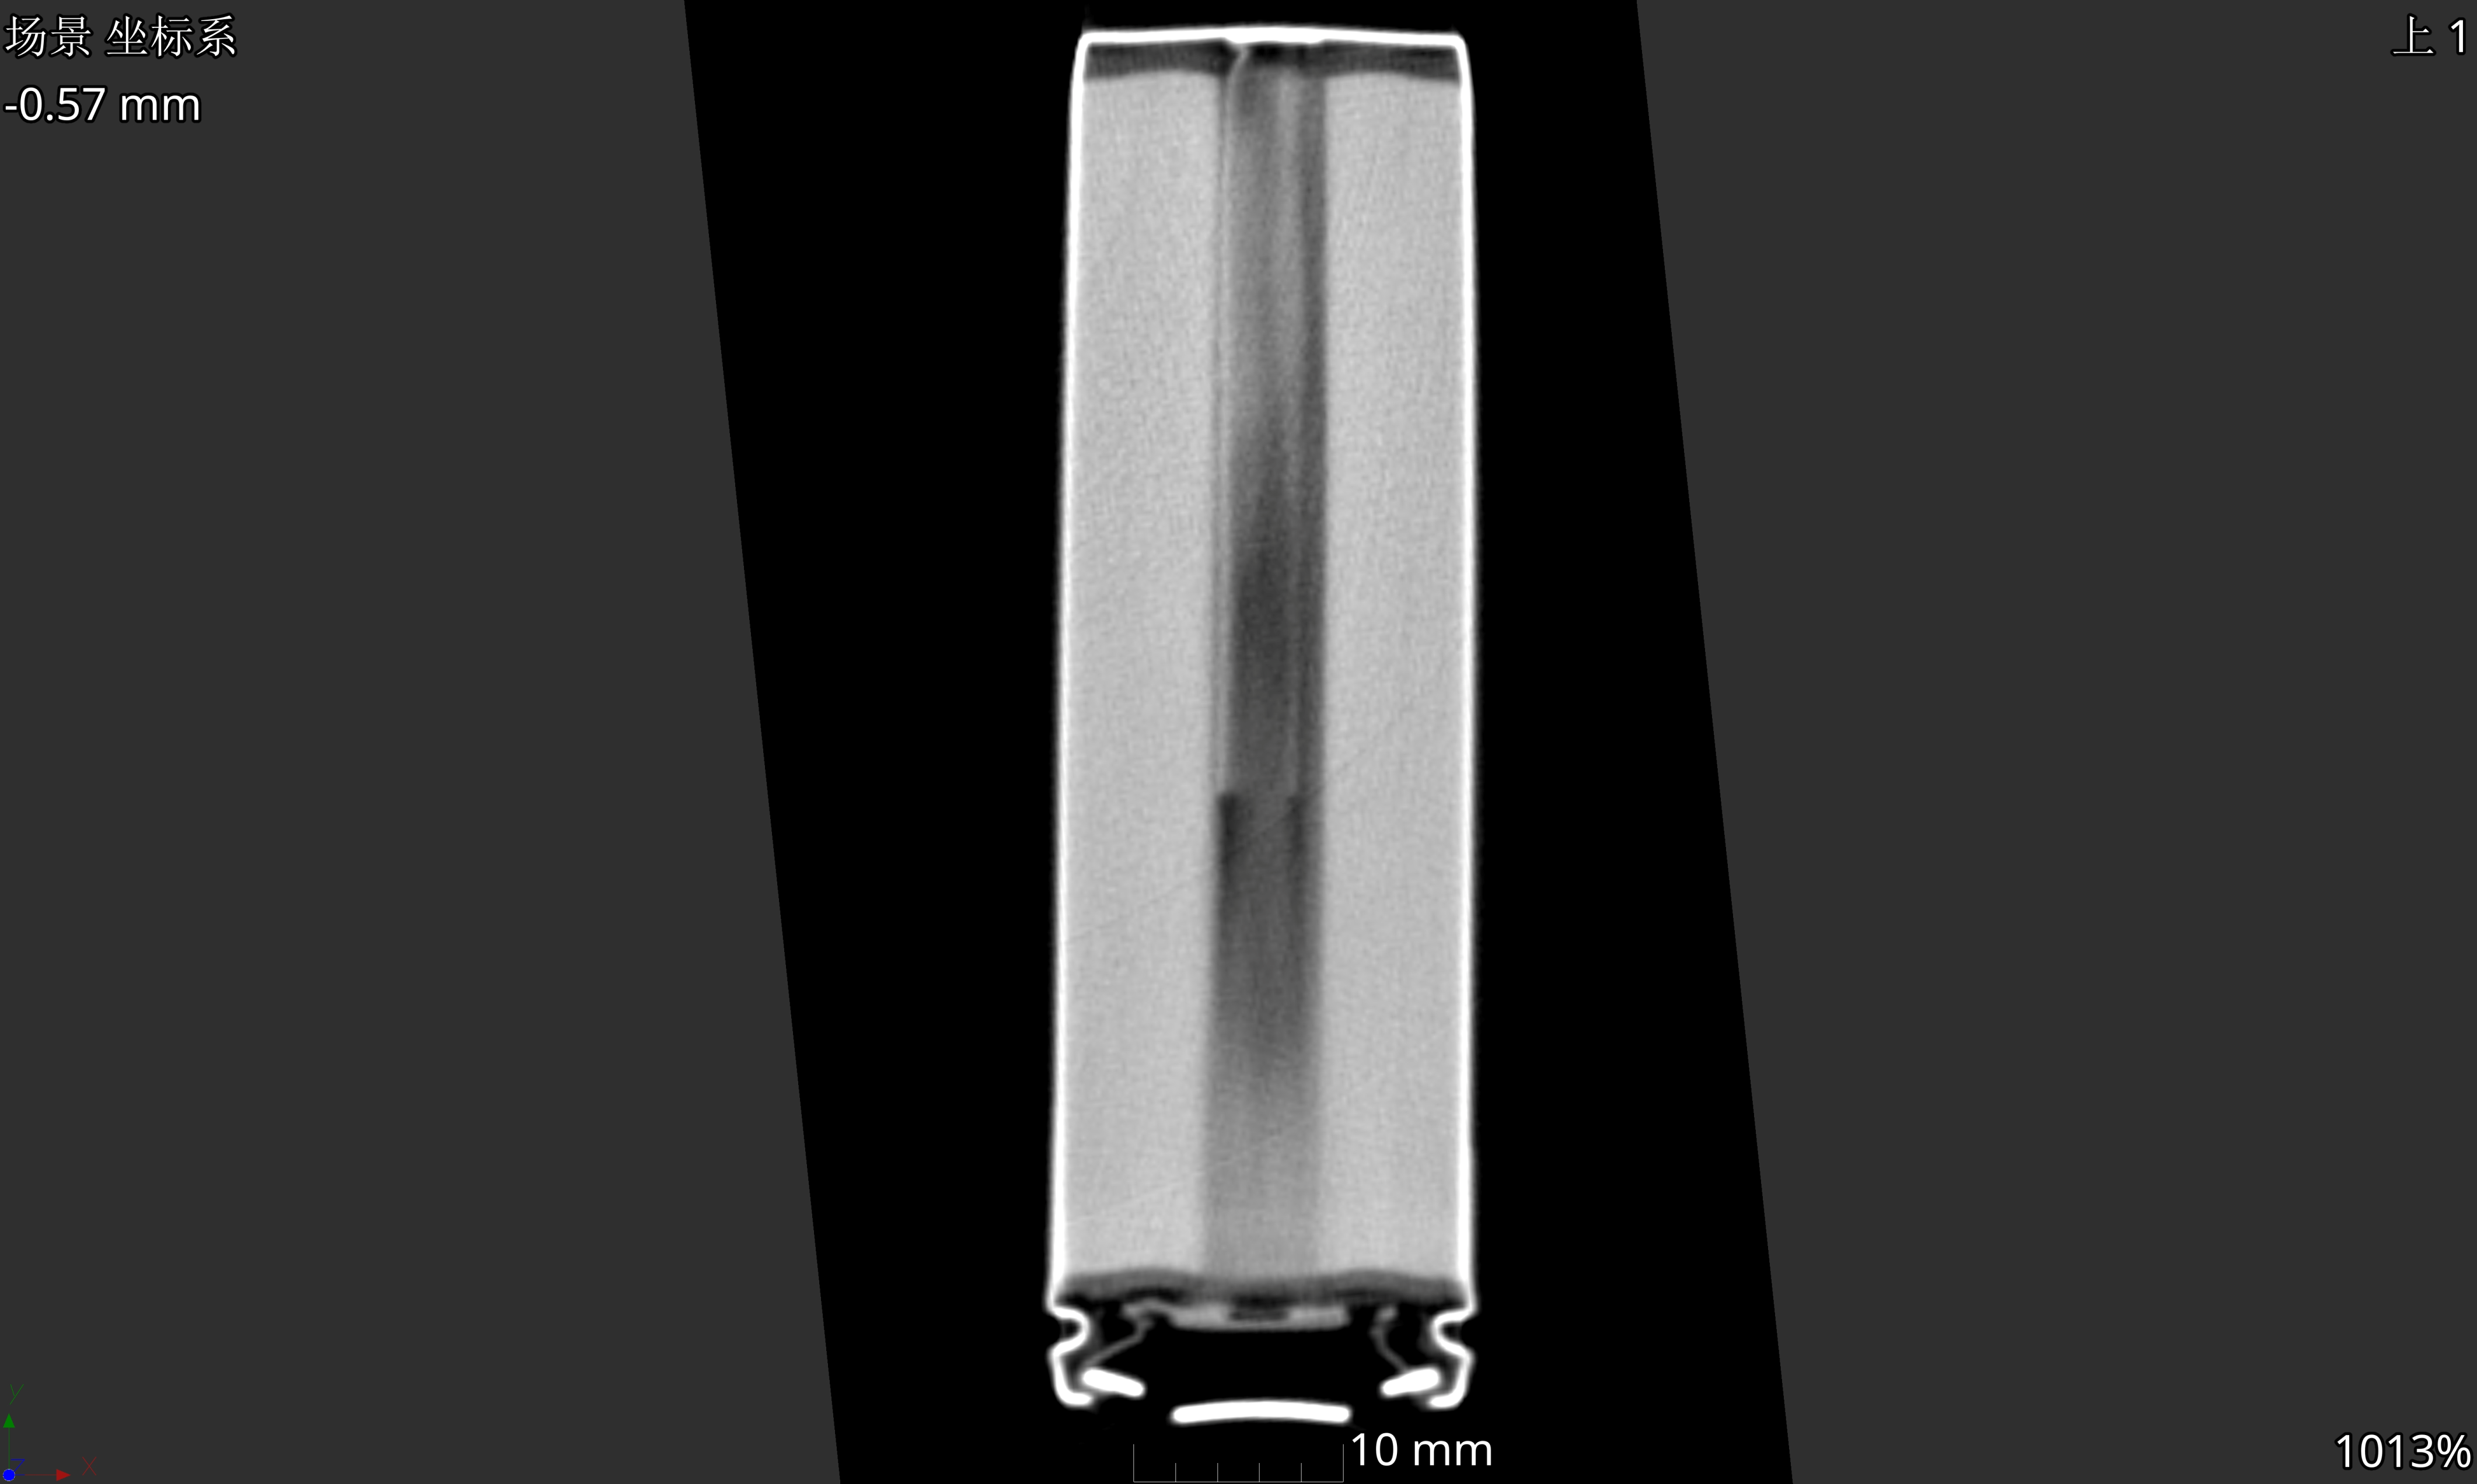
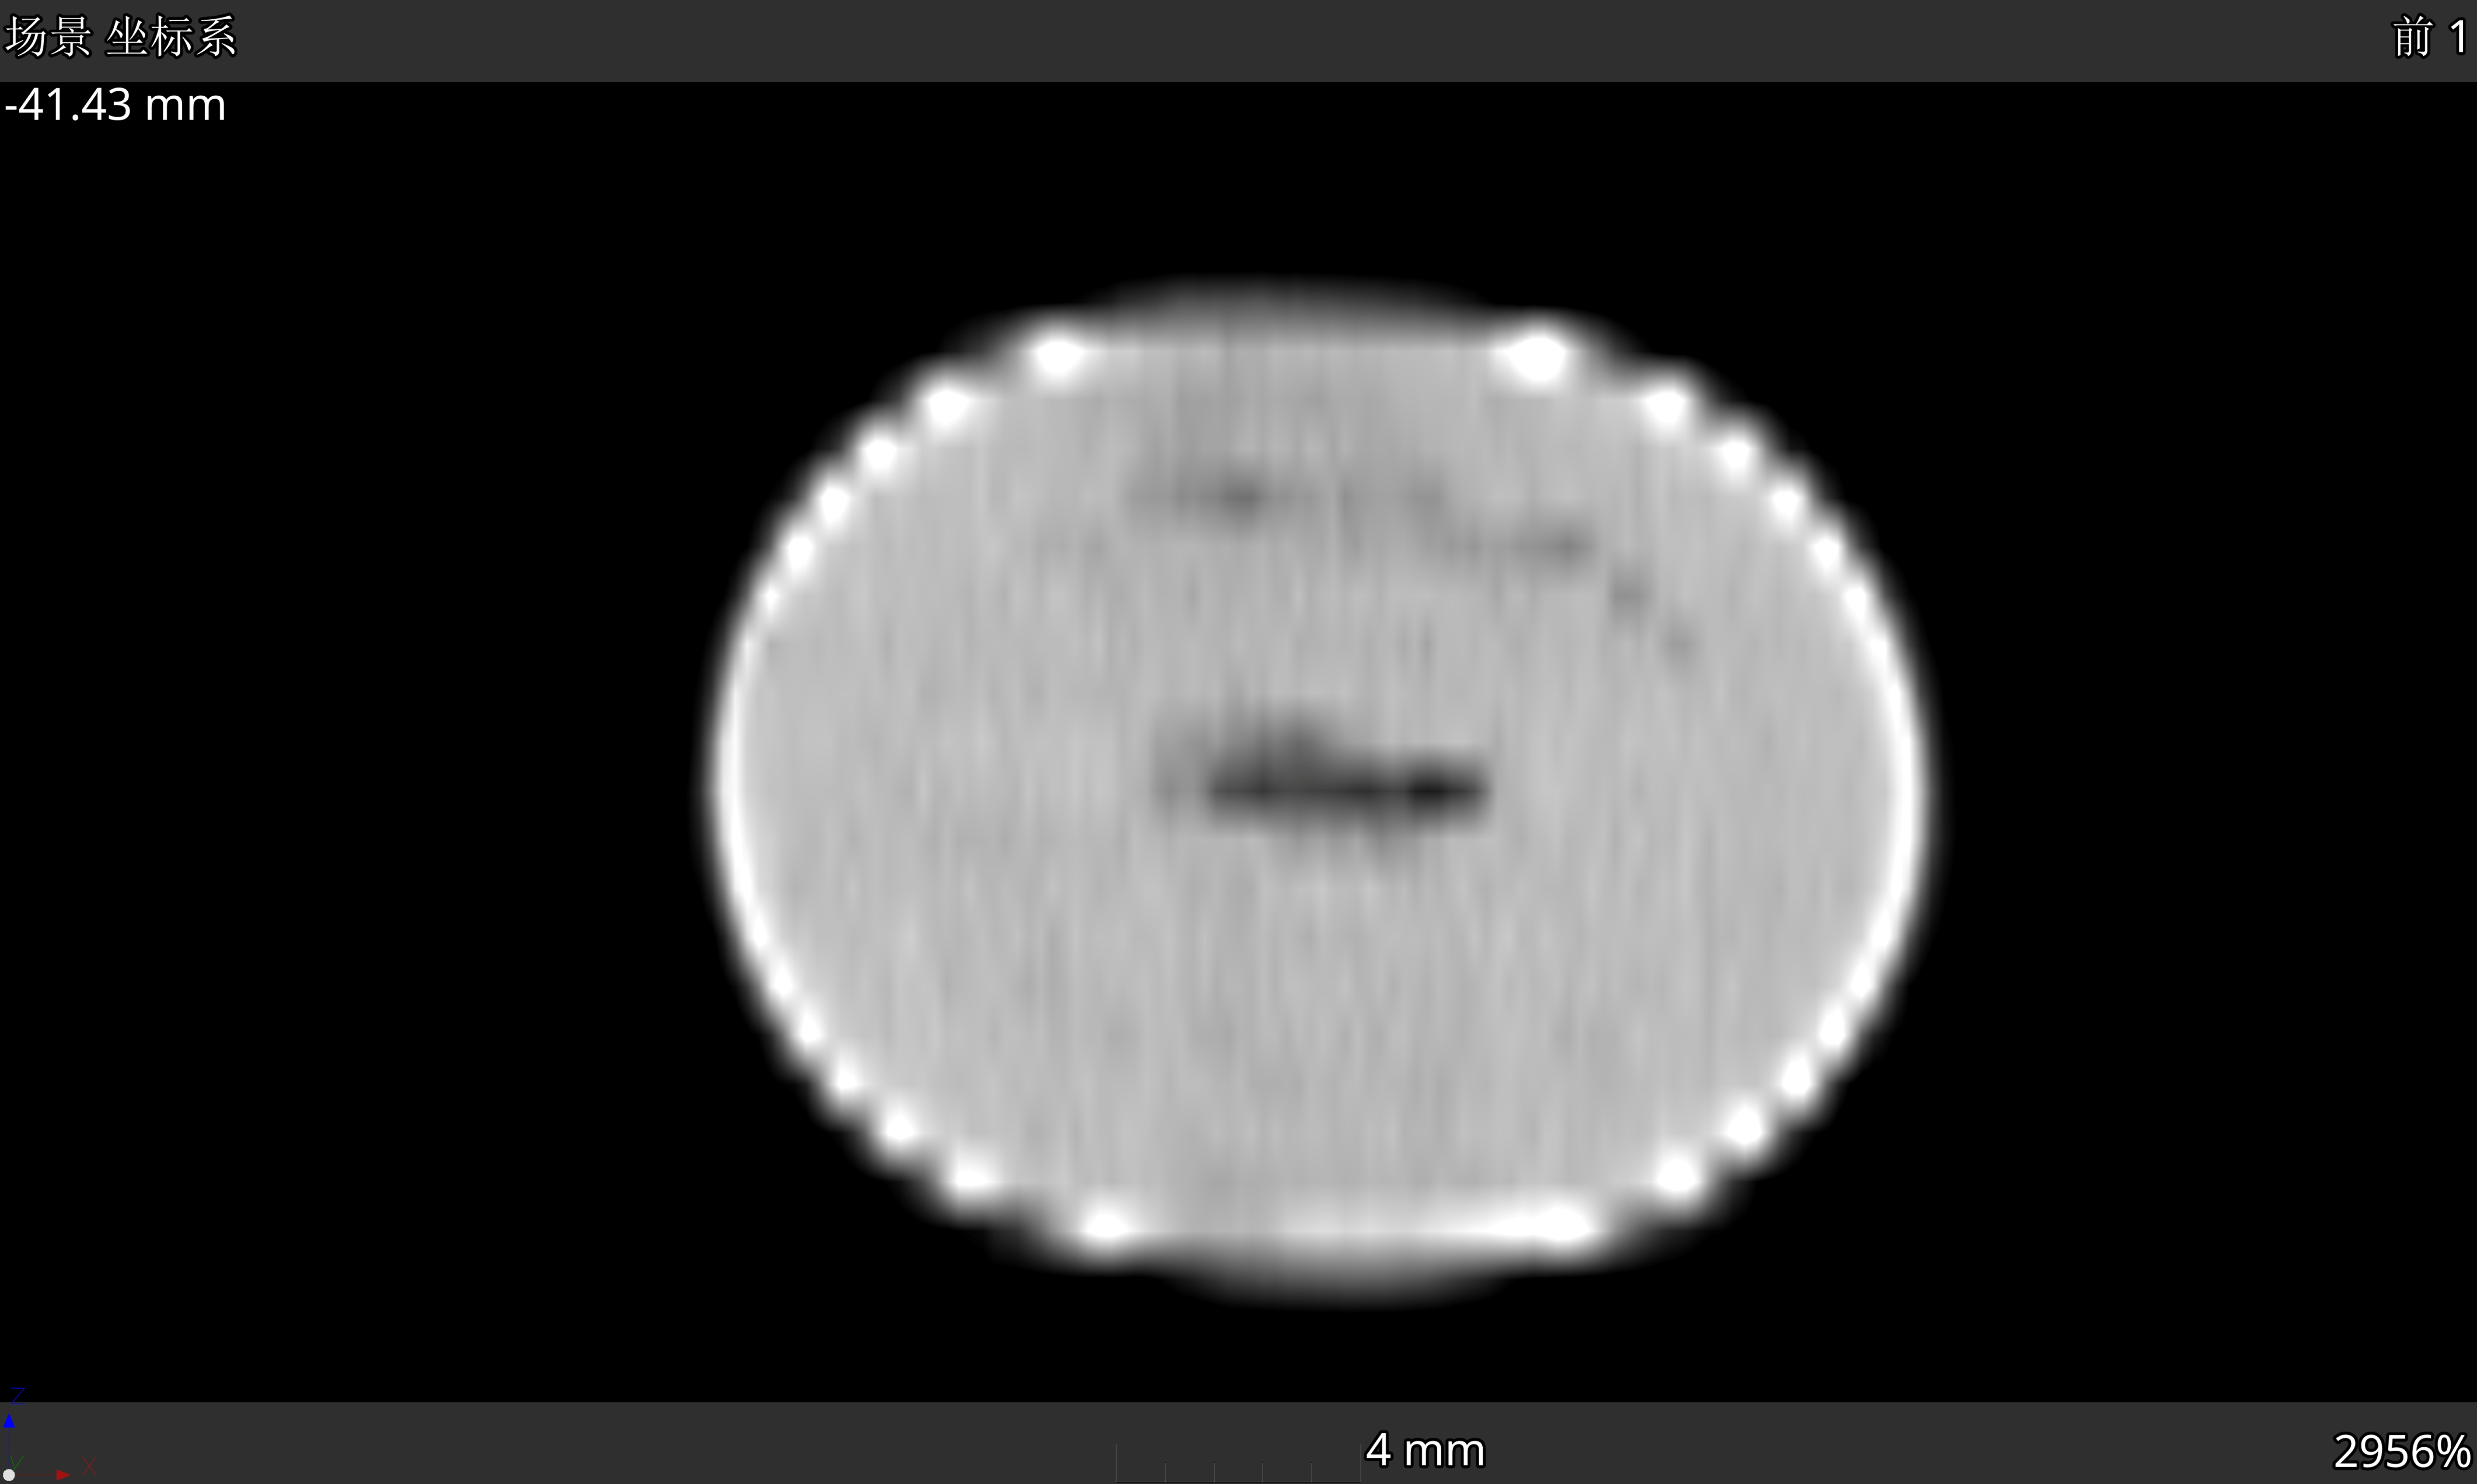
This study systematically investigated the structural damage and electrochemical performance changes in 18650 cylindrical lithium-ion batteries under multiple impacts through a 10 kg drop-hammer impact test. The experimental results showed that as the state of charge (SOC) increased from 25% to 75%, the battery’s stiffness increased and its impact resistance improved, but the electrolyte leakage intensified, with a higher risk of leakage at high SOCs. An increase in the impact force led to enhanced voltage fluctuations and a continuous increase in deformation. After an impact of 500 mm, the voltage decreased about 0.02 V, while after an impact of 1000 mm, it dropped about 0.04 V. Axial impacts caused a sudden voltage drop to 1.96 V, resulting in permanent failure; compared with planar impacts, cylindrical surface impacts are more likely to cause compression in the middle and warping at both ends, significantly increasing the risk of internal short circuits. CT scans revealed that the battery porosity can reach up to 3.09% under high impact energy, and the deformation rate can reach 28.39%. The research results provide a quantitative experimental basis for the impact-resistant design and safety assessment of power batteries.
1. Introduction
Lithium-ion batteries may experience various mechanical impacts during use, which can result in internal structural damage and potentially lead to safety risks such as thermal runaway. Studies have indicated that impact-induced internal structural deformations may give rise to micro-short circuits. These latent defects may progressively accumulate over extended charge–discharge cycles, ultimately serving as a critical factor in the initiation of thermal runaway [1]. With regard to the effects of mechanical impact conditions on the performance of lithium-ion batteries, Sahraei et al. [2] carried out ball-head, round-rod, and flat-plate indentation tests, along with three-point bending tests, on lithium-ion batteries at a state of charge (SOC) of 10%. Additionally, they established a finite element model of the battery incorporating both shell and solid elements. Gilaki et al. [3] performed layer-by-layer stacking of the materials comprising the lithium-ion battery core and conducted compression tests to compare the stress–strain characteristics of cores fabricated using wet and dry methods. Wierzbicki et al. [4] experimentally investigated the local impact damage in 18650 cylindrical lithium-ion batteries and found that the battery core constituted the primary load-bearing component, whereas the shell and end caps played secondary supportive roles. Meier [5] demonstrated that damaged regions within lithium-ion batteries were susceptible to internal short circuits under the influence of external mechanical forces, which can result in significant heat accumulation and potentially initiate thermal runaway reactions. Olivares [6] classified the fire risks of lithium-ion batteries and proposed a three-level fire risk assessment system. Xu et al. [7] carried out a systematic investigation into the mechanical integrity of lithium-ion batteries. Huang et al. [8] examined the response behaviors of cylindrical lithium-ion batteries under impact loading conditions, thereby offering theoretical insights for the development of impact-resistant battery structure designs. Yao [9] investigated the mechanical properties and short-circuit behaviors of 18650 lithium-ion batteries under both quasi-static and impact loading conditions in a stacked configuration and provided recommendations for optimizing the structural design of the batteries. Gu et al. [10] analyzed the critical factors influencing the failure of cylindrical lithium-ion batteries under compressive and impact loading conditions. They revealed the evolution of the battery’s internal structure under mechanical stress in depth and examined the correlations between structural changes and battery performance degradation. Zhang et al. [11] experimentally investigated the mechanical behaviors of lithium-ion batteries under various impact conditions, elucidated the dynamic failure mechanisms, and established criteria for internal short circuits by integrating experimental data with finite element analysis. Wang et al. [12] developed a multi-physics field coupling model to simulate the mechanical, electrical, and thermal responses of cylindrical lithium-ion batteries under dynamic loading conditions. Based on this model, they predicted the progression of internal short circuits and thermal runaway under varying impact energies and SOC conditions. Zhang [13] applied the membrane force factor method to predict the dynamic response of lithium-ion batteries and systematically analyzed the response mechanisms of the batteries under impact loading and the variation pattern of their maximum deflection. Guo et al. [14] carried out experimental research on the safety performance of soft-pack lithium-ion batteries used in unmanned aerial vehicles under impact loading conditions through a drop-hammer impact testing method. They compared the impact response characteristics of battery cells at various SOCs and analyzed the effects of different impact velocities and energies on battery voltage and temperature variations.
This study investigated the effects of various impact conditions on cylindrical lithium-ion batteries using a drop-hammer impact test device, focusing on medium- and low-speed collisions as well as daily jolting conditions. The results highlight the influence of different states of charge, impact intensities, impact directions, and surface geometries on the structural deformation and electrochemical behavior of the batteries. By integrating CT scanning technology, the failure behaviors of the lithium-ion batteries were examined at both the macro- and microscopic levels, thereby elucidating the mechanisms through which the shock conditions affect structural integrity and functional stability. The findings of this research are expected to provide a robust experimental foundation and technical support for the crash safety design of power battery systems.
2. Test Plan for 18650 Lithium Batteries
2.1. Study Variables and Controlled Parameters
This study focused on the 18650 cylindrical lithium-ion battery, the parameters of which are summarized in Table 1.

Table 1.
Parameters of the sample batteries.
The test equipment included a heavy-object impact testing machine (ZS-1009), a battery testing system (CT3002K), and an industrial CT scanner (YXLON).
2.2. Experimental Steps
2.2.1. Pretreatment of Battery Samples
Prior to the start of the test, the battery cells underwent a pretreatment cycle to ensure that their performance was in an activated and stable condition. According to GB 38031-2020, no more than five pretreatment cycles were carried out, and the capacity deviation was considered stable if it was less than 3% [15].
After a battery had been fully discharged, it was allowed to stand for 30 min to ensure the stabilization of its internal state. Only after this period was the impact test conducted, with different SOC levels set in accordance with the specific test requirements.
2.2.2. Work Step Settings
After pretreatment of the 18650 cylindrical lithium-ion batteries, it was necessary to set specific working steps for the battery testing system. The working steps are detailed in Table 2.

Table 2.
Work step settings.
2.2.3. Impact Test
The entire test was conducted at room temperature in a well-ventilated environment. The 10 kg drop hammer used in the experiment complied with the recommended configuration for mechanical shock tests in Ref. [15], and its impact energy (19.6–98 J) covered medium- and low-speed collision scenarios as well as daily jolting situations. The detailed compositions of the test groups are presented in Table 3, where batteries 1, 2, and 3 formed the test group with different SOC values; batteries 2, 4, and 5 formed the test group with different impact heights; batteries 2 and 6 formed the test group with different impact directions; and batteries 2 and 7 formed the test group with different impact surfaces.

Table 3.
Test groups with different SOC values.
2.3. Test Data
During the test, varying levels of energy were applied by adjusting the impact height, simulating the mechanical loads that batteries may experience during vehicle collisions or bumps. The experimental setup encompassed impact energies of 19.6–98 J, corresponding to medium- and low-speed collision scenarios as well as daily jolting situations. The results are summarized in Table 4.

Table 4.
Test data.
3. Experimental Data and Analysis
3.1. Charge–Discharge Experimental Data
To achieve variable control and screen for batteries that met the experimental requirements for impact testing, the 18650 cylindrical lithium batteries were pretreated using the Blue power battery testing system CT3002K. The charge–discharge data of the batteries are shown in Figure 1.
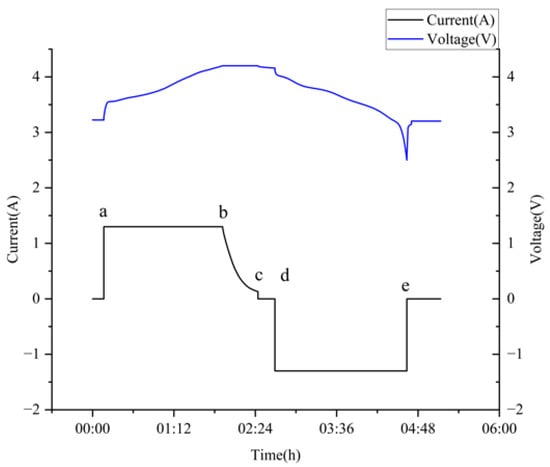
Figure 1.
Graph of charge–discharge data.
The a–b section in Figure 1 corresponds to the constant-current charging phase. During this stage, the charging current is maintained at a constant level, while the voltage progressively increases with the charging time until it reaches the predetermined upper voltage limit, which enables the rapid charging of the battery. The b–c section represents the constant-voltage charging stage. Once the battery voltage reaches the preset upper limit, the system automatically transitions to the constant-voltage charging mode. During this stage, the voltage is maintained at a steady level while the charging current gradually diminishes until it reaches a certain threshold, at which point the charging process is terminated. The c–d section represents the resting stage, during which the battery remains idle to allow for the internal electrochemical reactions to reach equilibrium and for the voltage and temperature distributions to stabilize. The d–e section represents the constant-current discharge phase. During this stage, the current remains stable while the voltage gradually declines until it reaches the cutoff voltage. Near point e, the battery voltage initially drops rapidly and subsequently rebounds, a phenomenon attributed to the polarization effect.
The charge–discharge capacity data of the battery are summarized in Table 5. After excluding those batteries whose capacities failed to meet the specified criteria, the actual average discharge capacity was calculated as 2537 mAh. Through the analysis of the capacity–voltage variation curve (refer to Figure 2), the correlation between the voltage and capacity became more evident. Based on this analysis, the corresponding voltage values at SOC levels of 25%, 50%, and 75% were 3.41 V, 3.64 V, and 3.81 V, respectively.

Table 5.
Battery charge–discharge capacities.

Figure 2.
Voltage–capacity curve.
3.2. Impact Test Analysis
3.2.1. Different SOC Groups
The experimental groups were set up with the same impact loads, directions, and impact surfaces but different SOC values. The experimental setup is shown in Figure 3, while the post-experiment condition of the battery is presented in Figure 4.
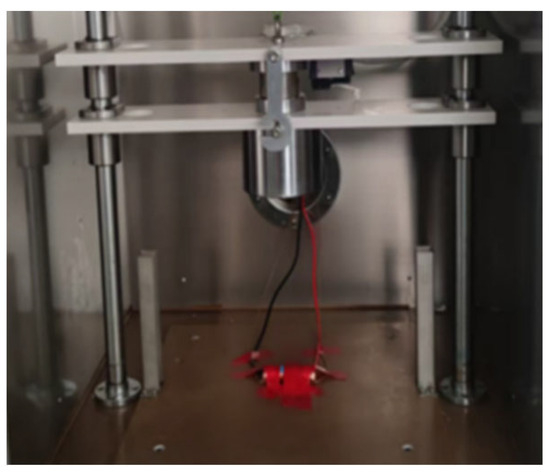
Figure 3.
Experimental setup.
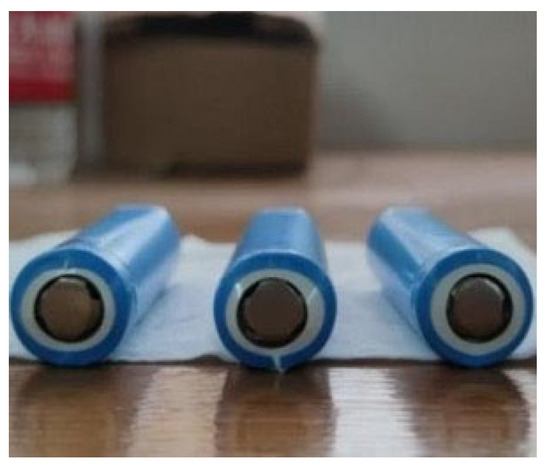
Figure 4.
Post-experimental batteries.
In the radial plane impact test with an impact height of 200 mm, the battery with an SOC of 25% demonstrated higher stability. The specific manifestations were as follows: after impact, the voltage remained stable, the electrodes remained intact, and the battery temperature remained steady without thermal runaway. For the battery with an SOC of 50%, the voltage performance was consistent with that of the battery with an SOC of 25%; however, slight electrolyte leakage was observed, while the battery with an SOC of 75% showed more severe electrolyte leakage. The overall performance of the battery at different SOC states was relatively stable under an impact energy of 19.6 J, which can be mainly attributed to the internal structure design of the battery: a four-layer composite structure composed of one separator layer and one electrode layer wound into a cylinder. Both the separator and electrode had a certain ductility, and there were gaps between the different materials, which can effectively buffer external impacts.
Subsequently, a secondary impact test was conducted on the batteries, revealing certain differences among the batteries at different SOCs. As shown in Figure 5, the changes in the shaft diameter after the impact indicated that the batteries with SOCs of 25% and 50% did not show any leakage, while the battery with an SOC of 75% still had leakage after the secondary impact. Additionally, the compression of the battery was closely related to the SOC values: batteries with lower SOCs had greater compression, while batteries with higher SOCs had smaller compression, suggesting that batteries with higher SOCs have stronger impact resistance. In subsequent experiments, the batteries were fully discharged and disassembled, and the internal winding structure of the cells was carefully unfolded. The electrolytes in the outer regions exhibited a relatively dry state, whereas the electrolytes in the central areas remained moister. There are two explanations for this phenomenon. First, the higher the SOC, the greater the mobility of the electrolyte. Second, during the charging process, lithium ions migrate from the positive electrode through the electrolyte to the negative electrode, and the number of lithium ions embedded in the graphite layers of the negative electrode increases, leading to an increase in the Young’s modulus of the negative electrode (E ≈ 6 GPa at low SOC, and E ≈ 12 GPa at high SOC) [2,3]. Simultaneously, the active material on the positive electrode also experiences an increase in the Young’s modulus after lithium-ion extraction (E ≈ 8 GPa at low SOC, and E ≈ 10–14 GPa at high SOC) [2,3]. Consequently, the SOC increases, and the overall mechanical rigidity of the battery cell significantly improves [10].

Figure 5.
SOC–shaft diameter curve.
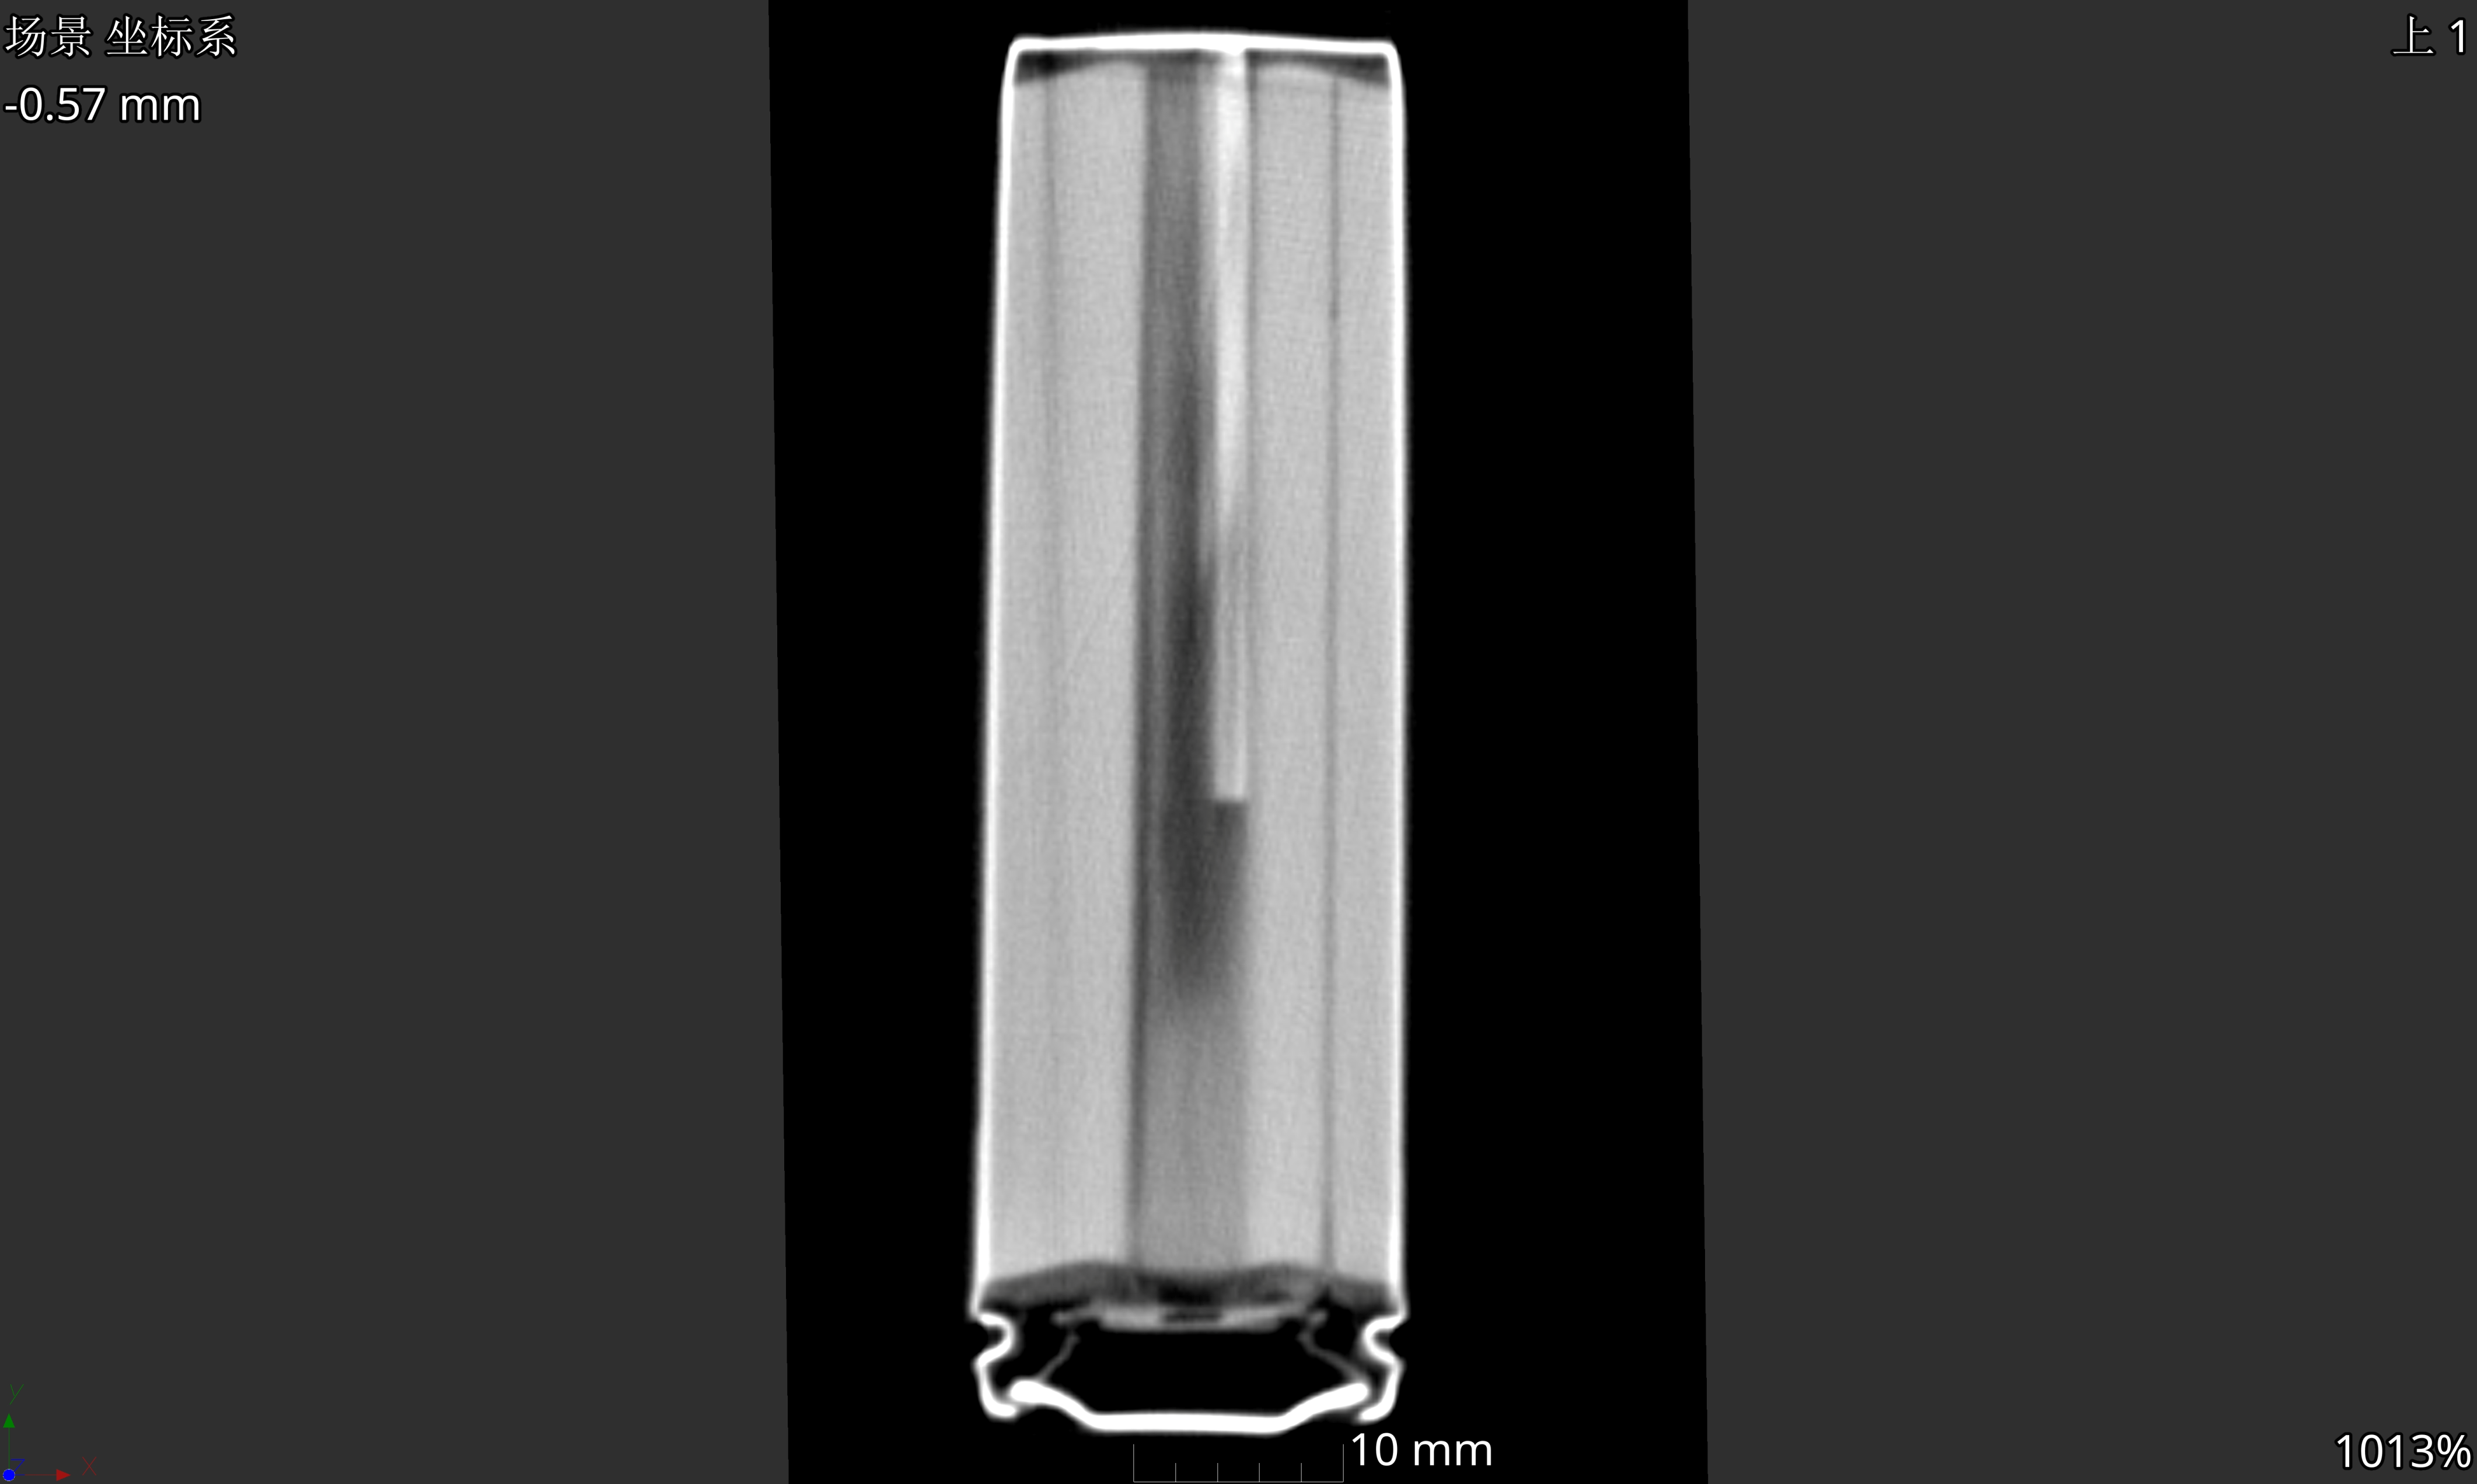
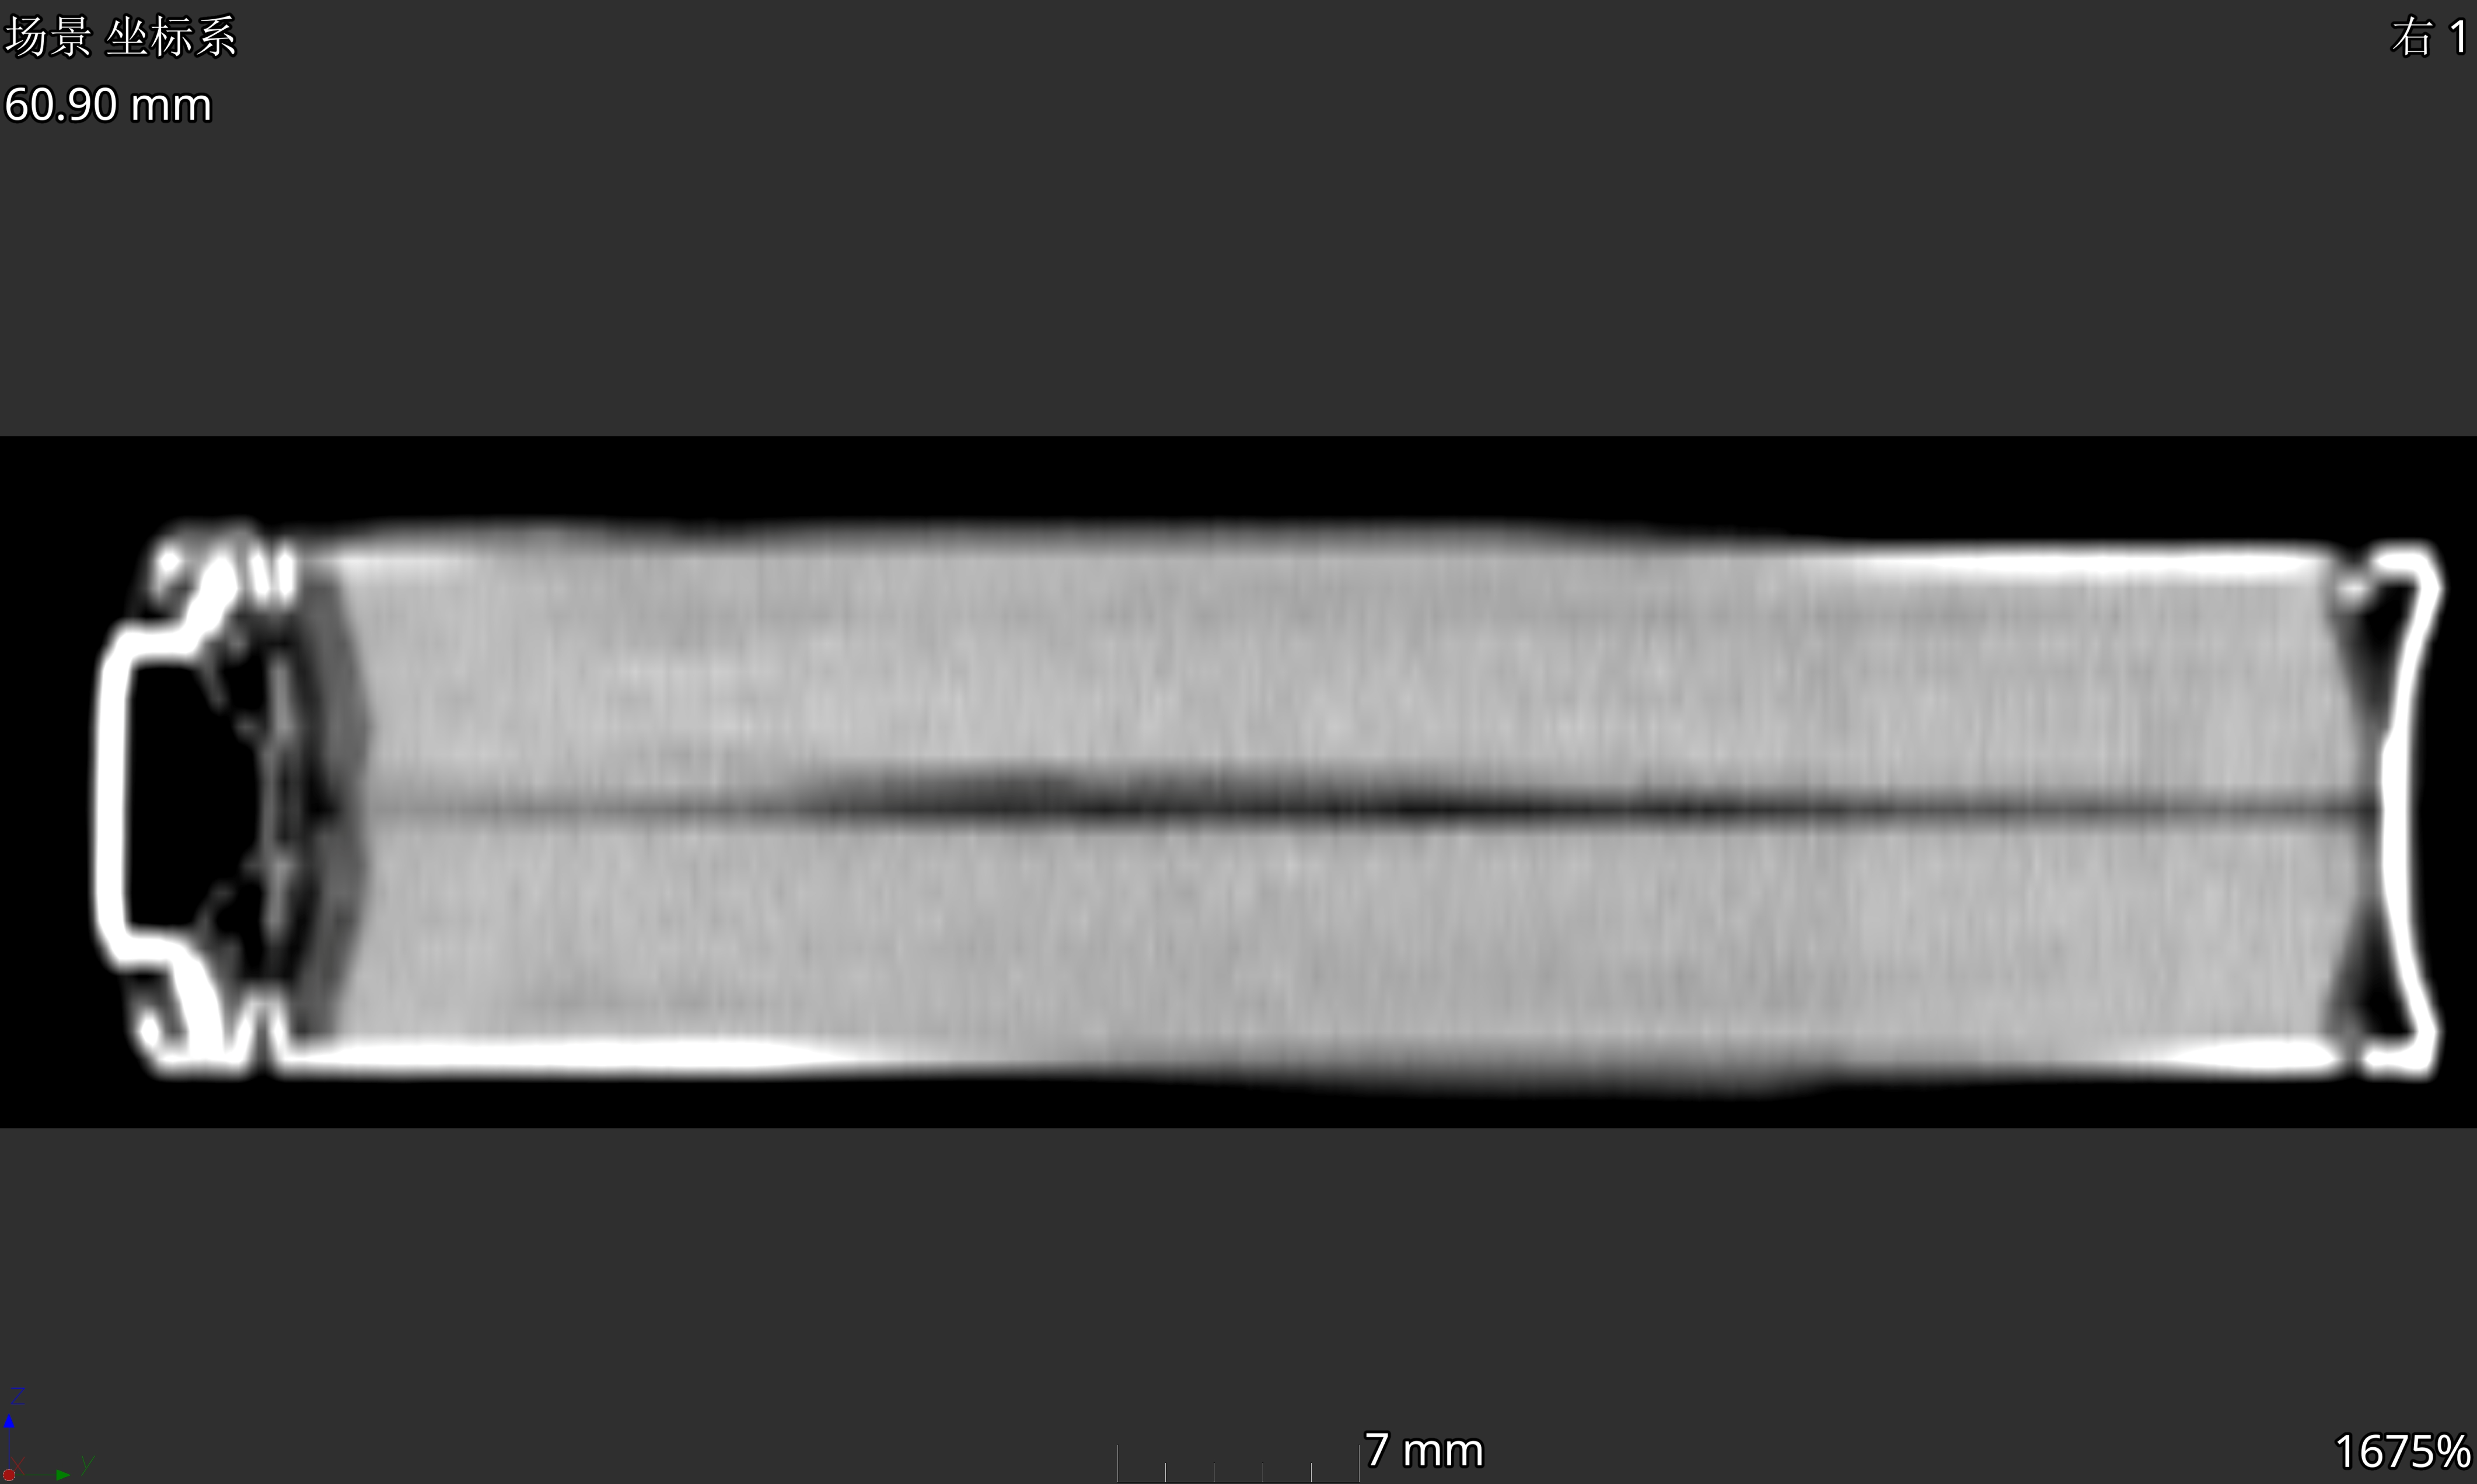
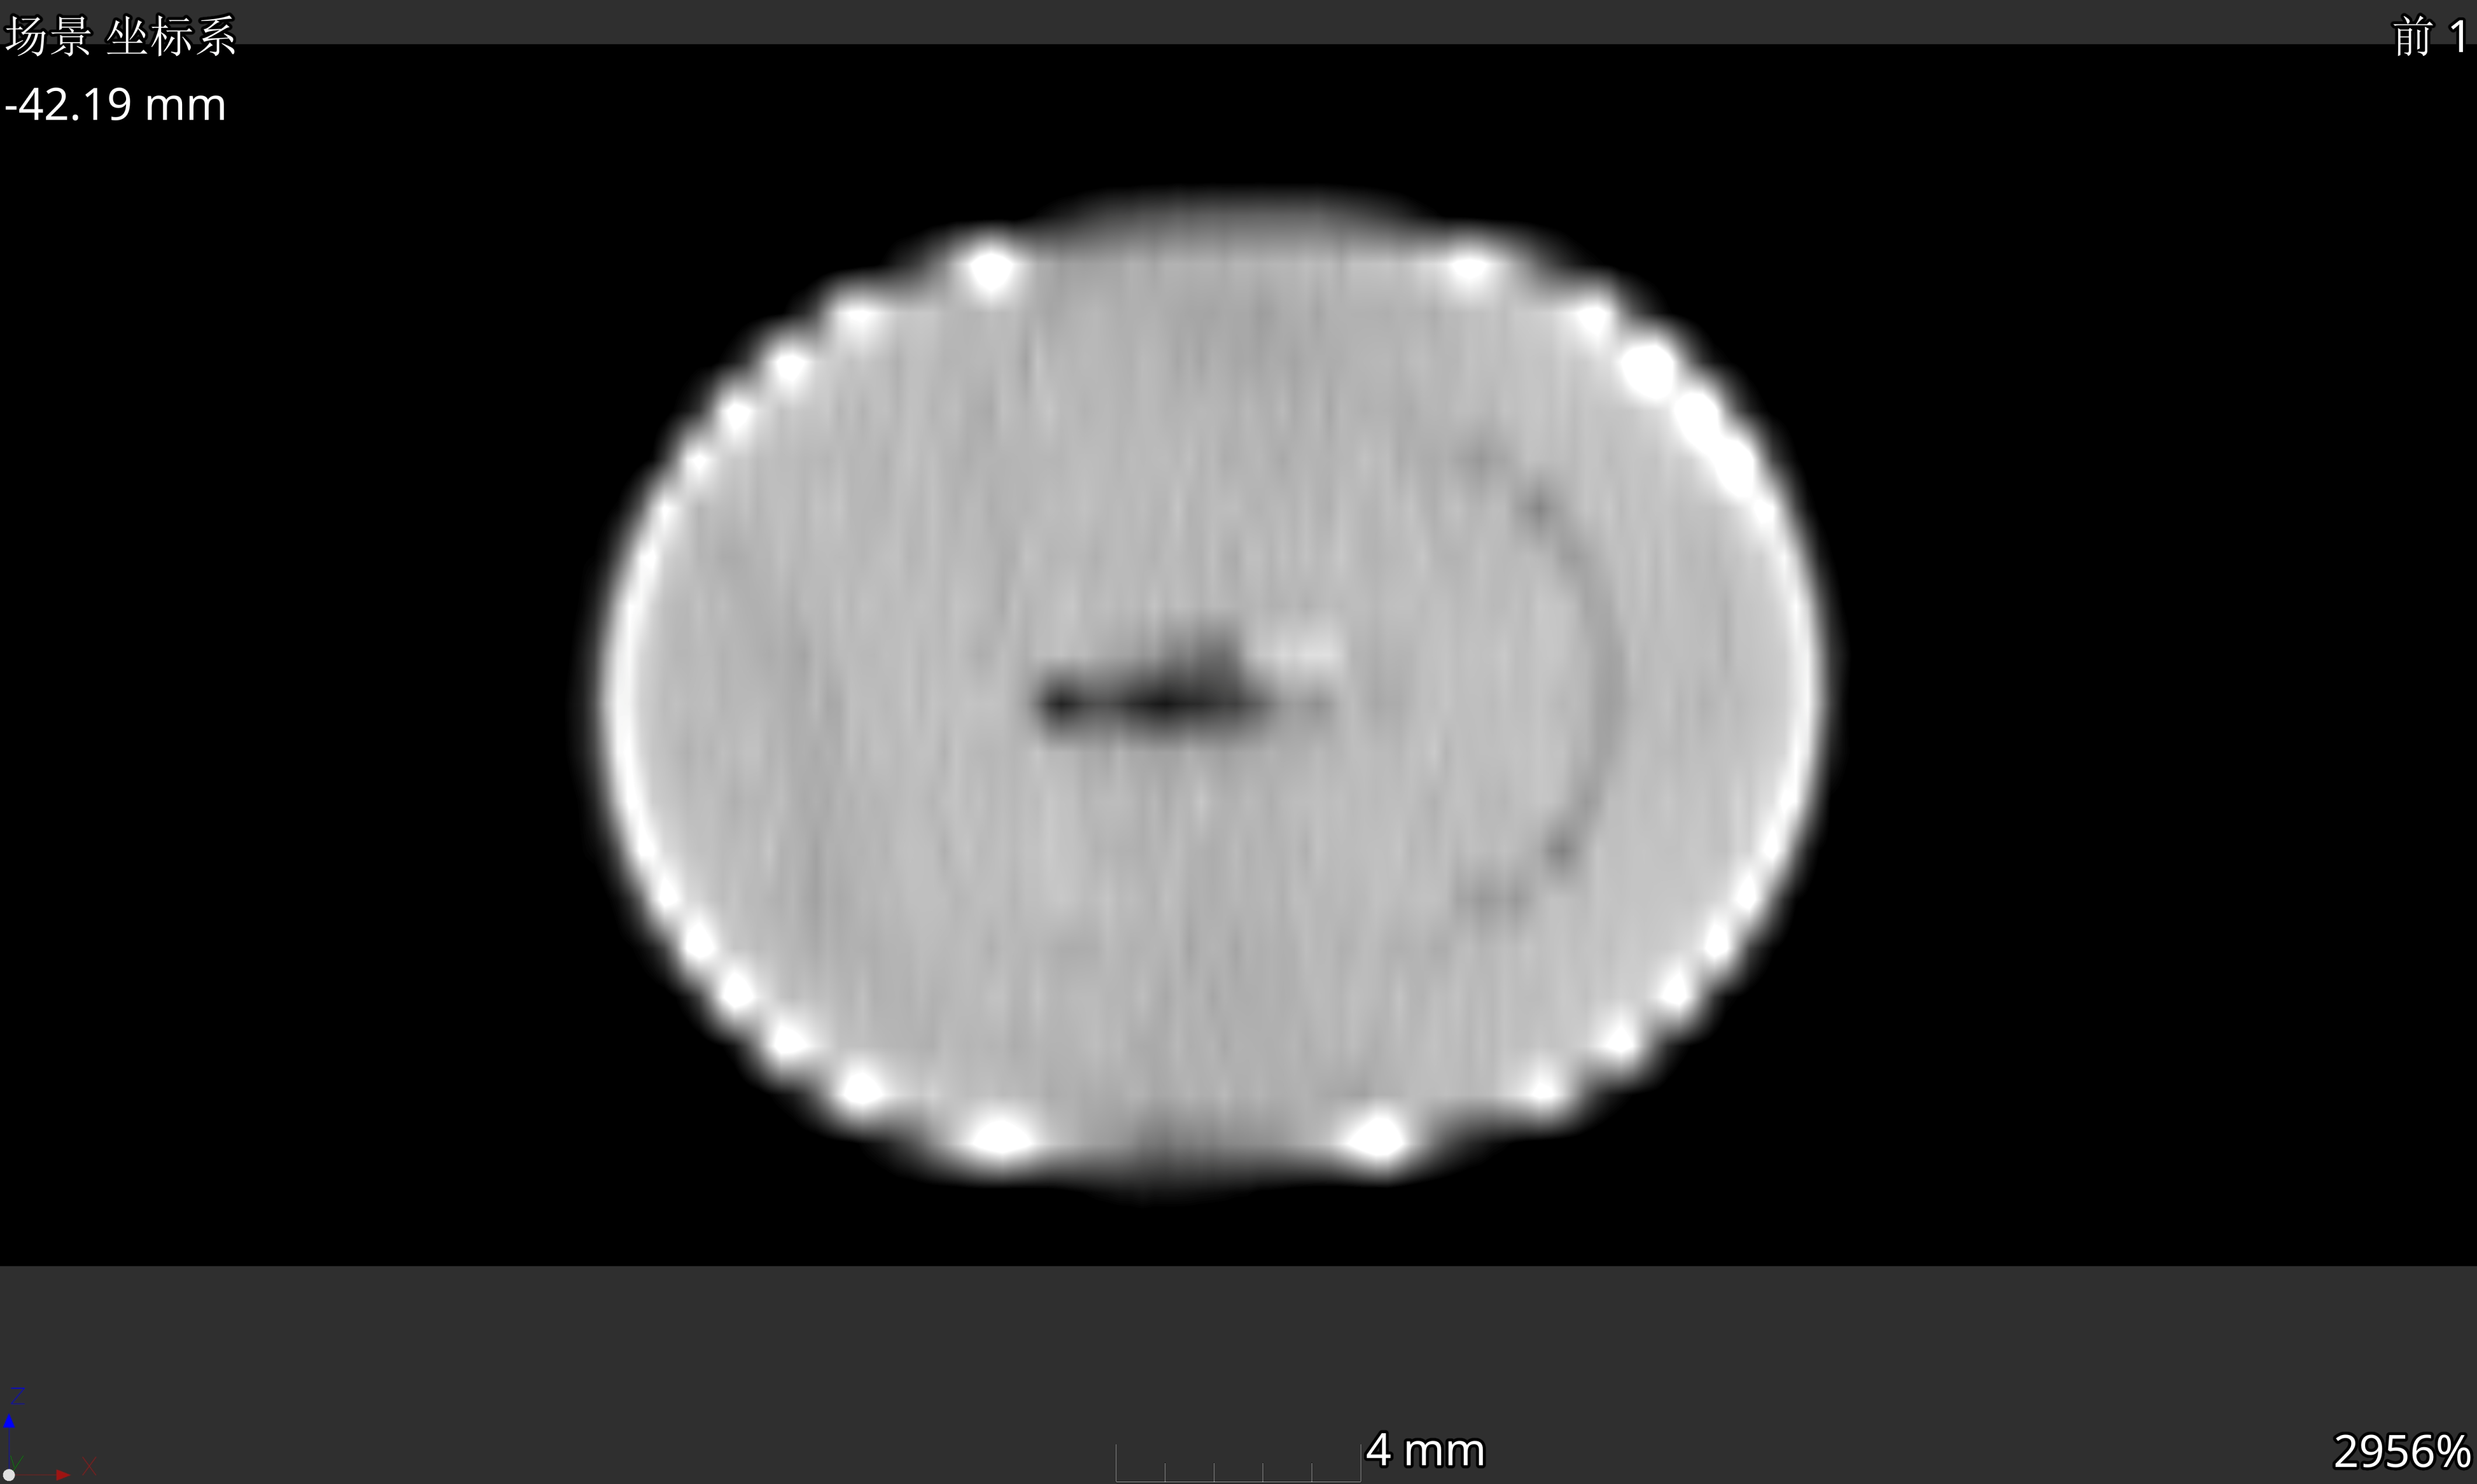
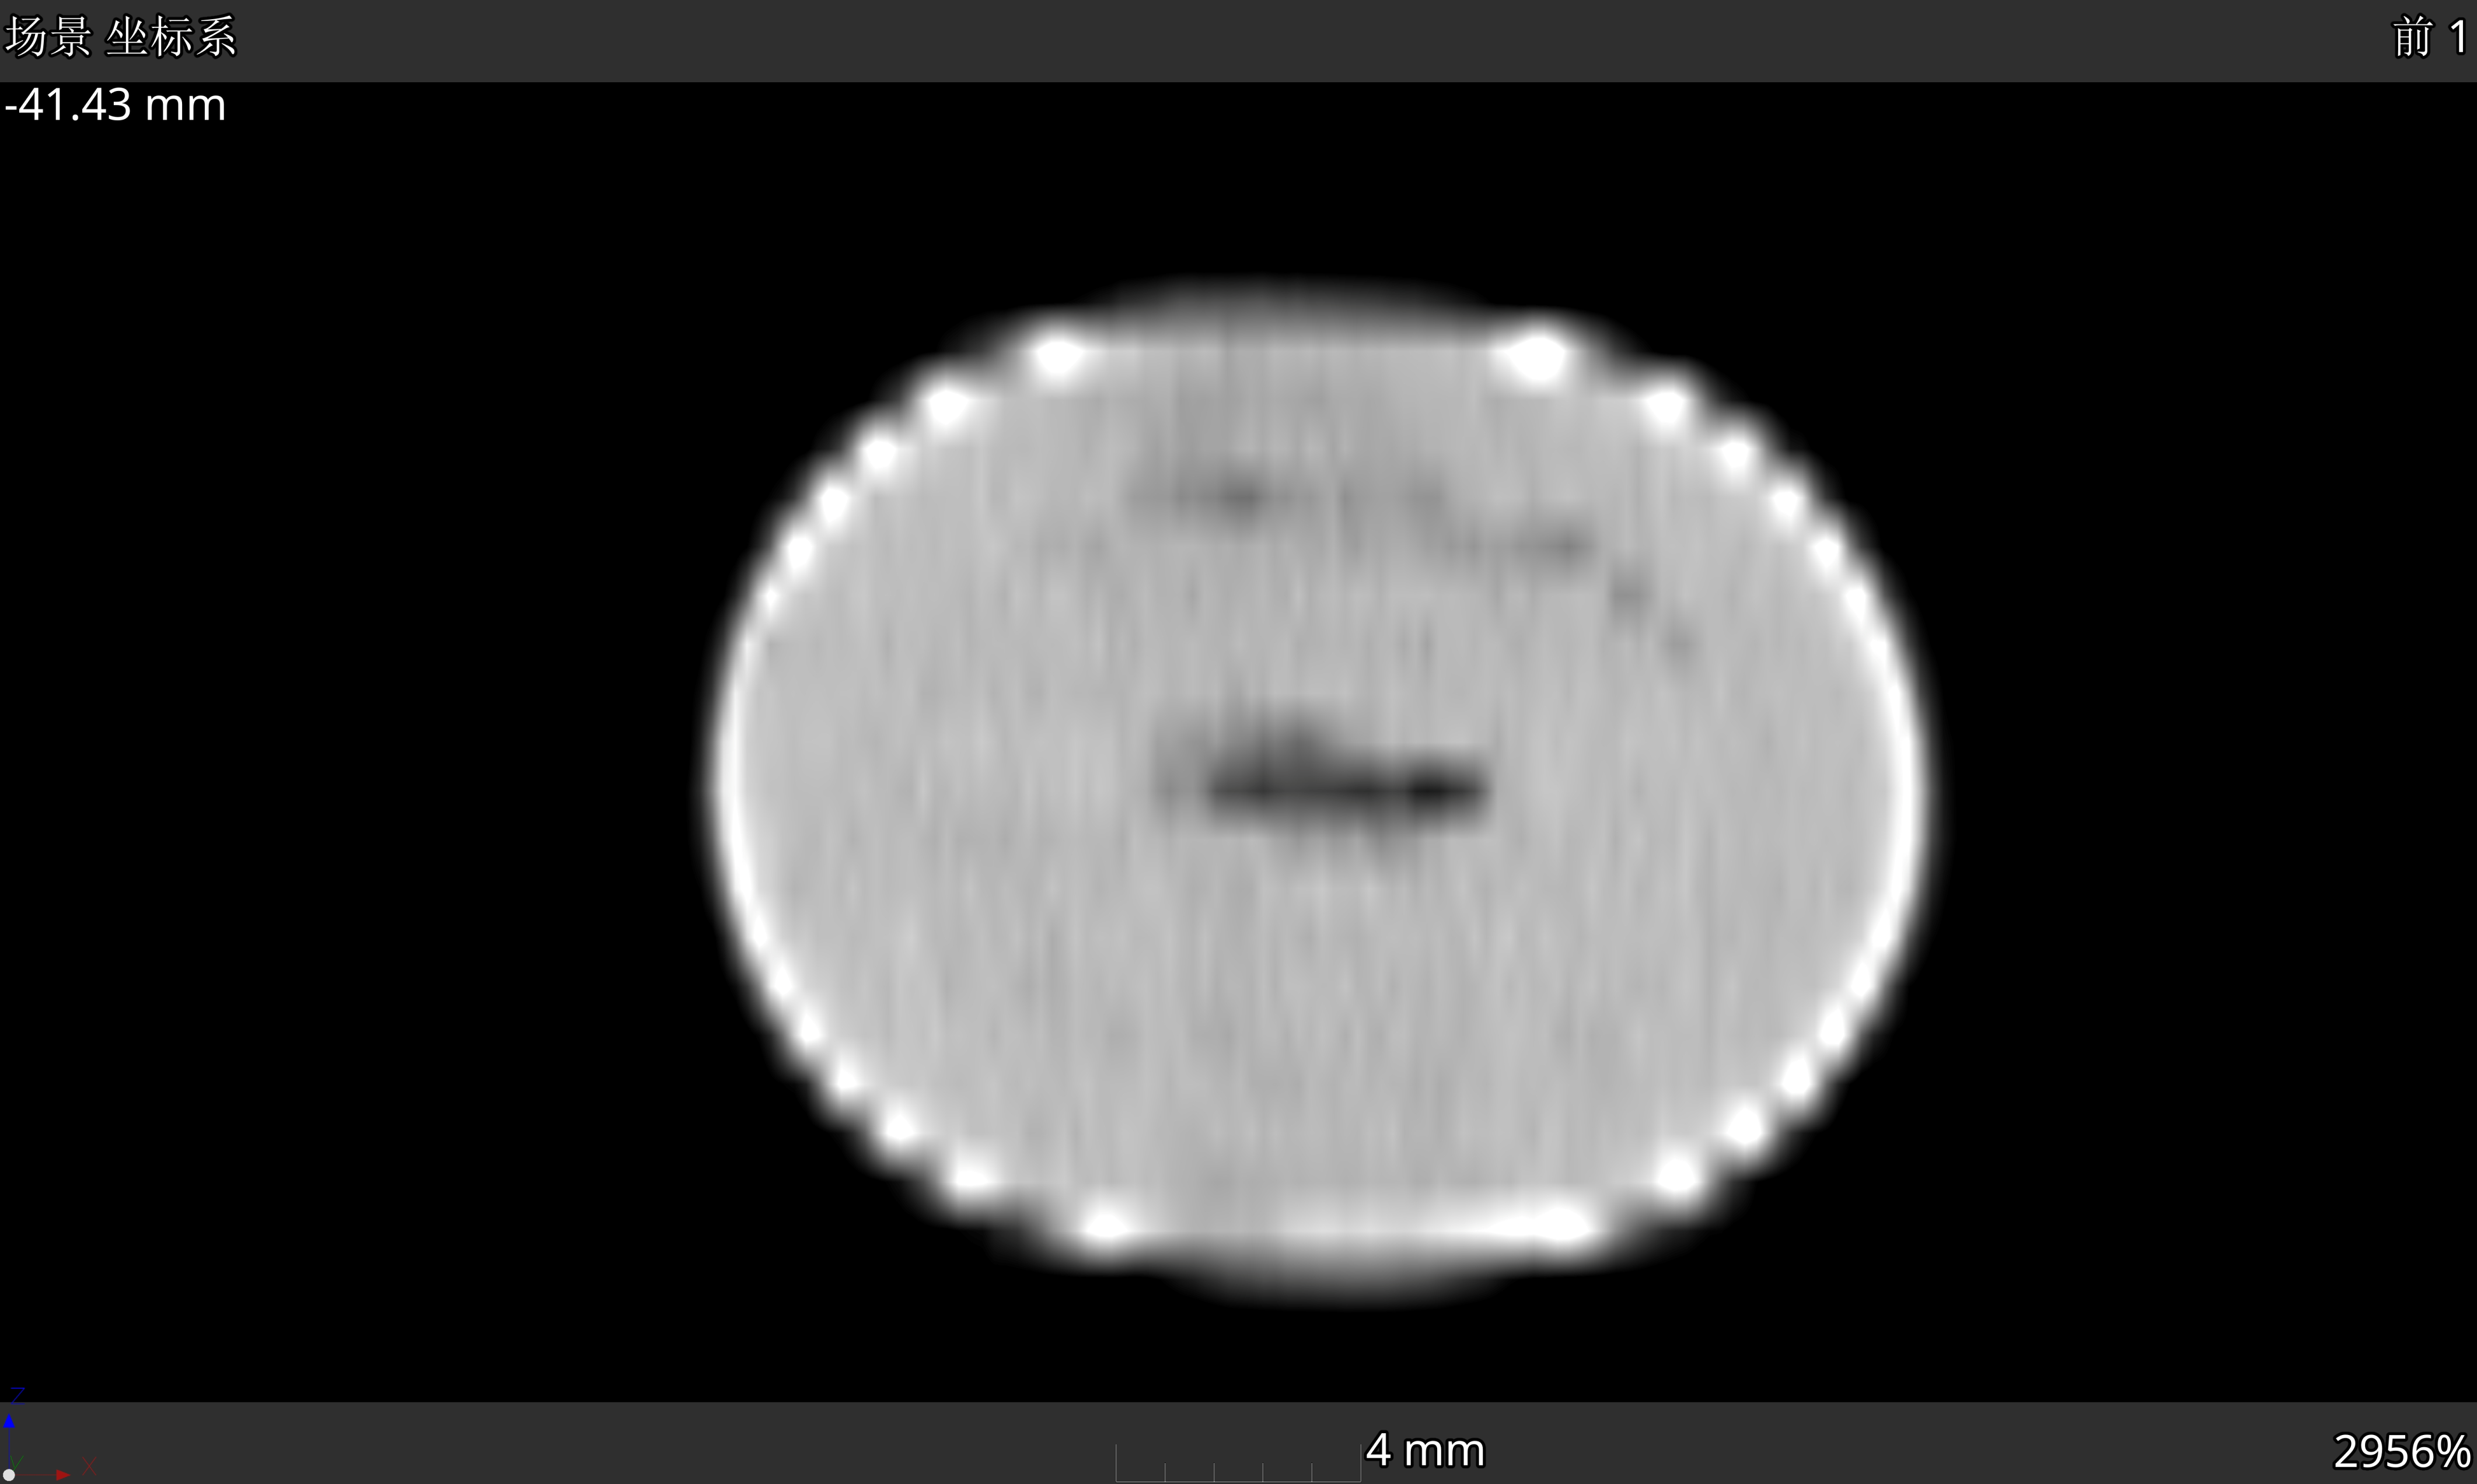
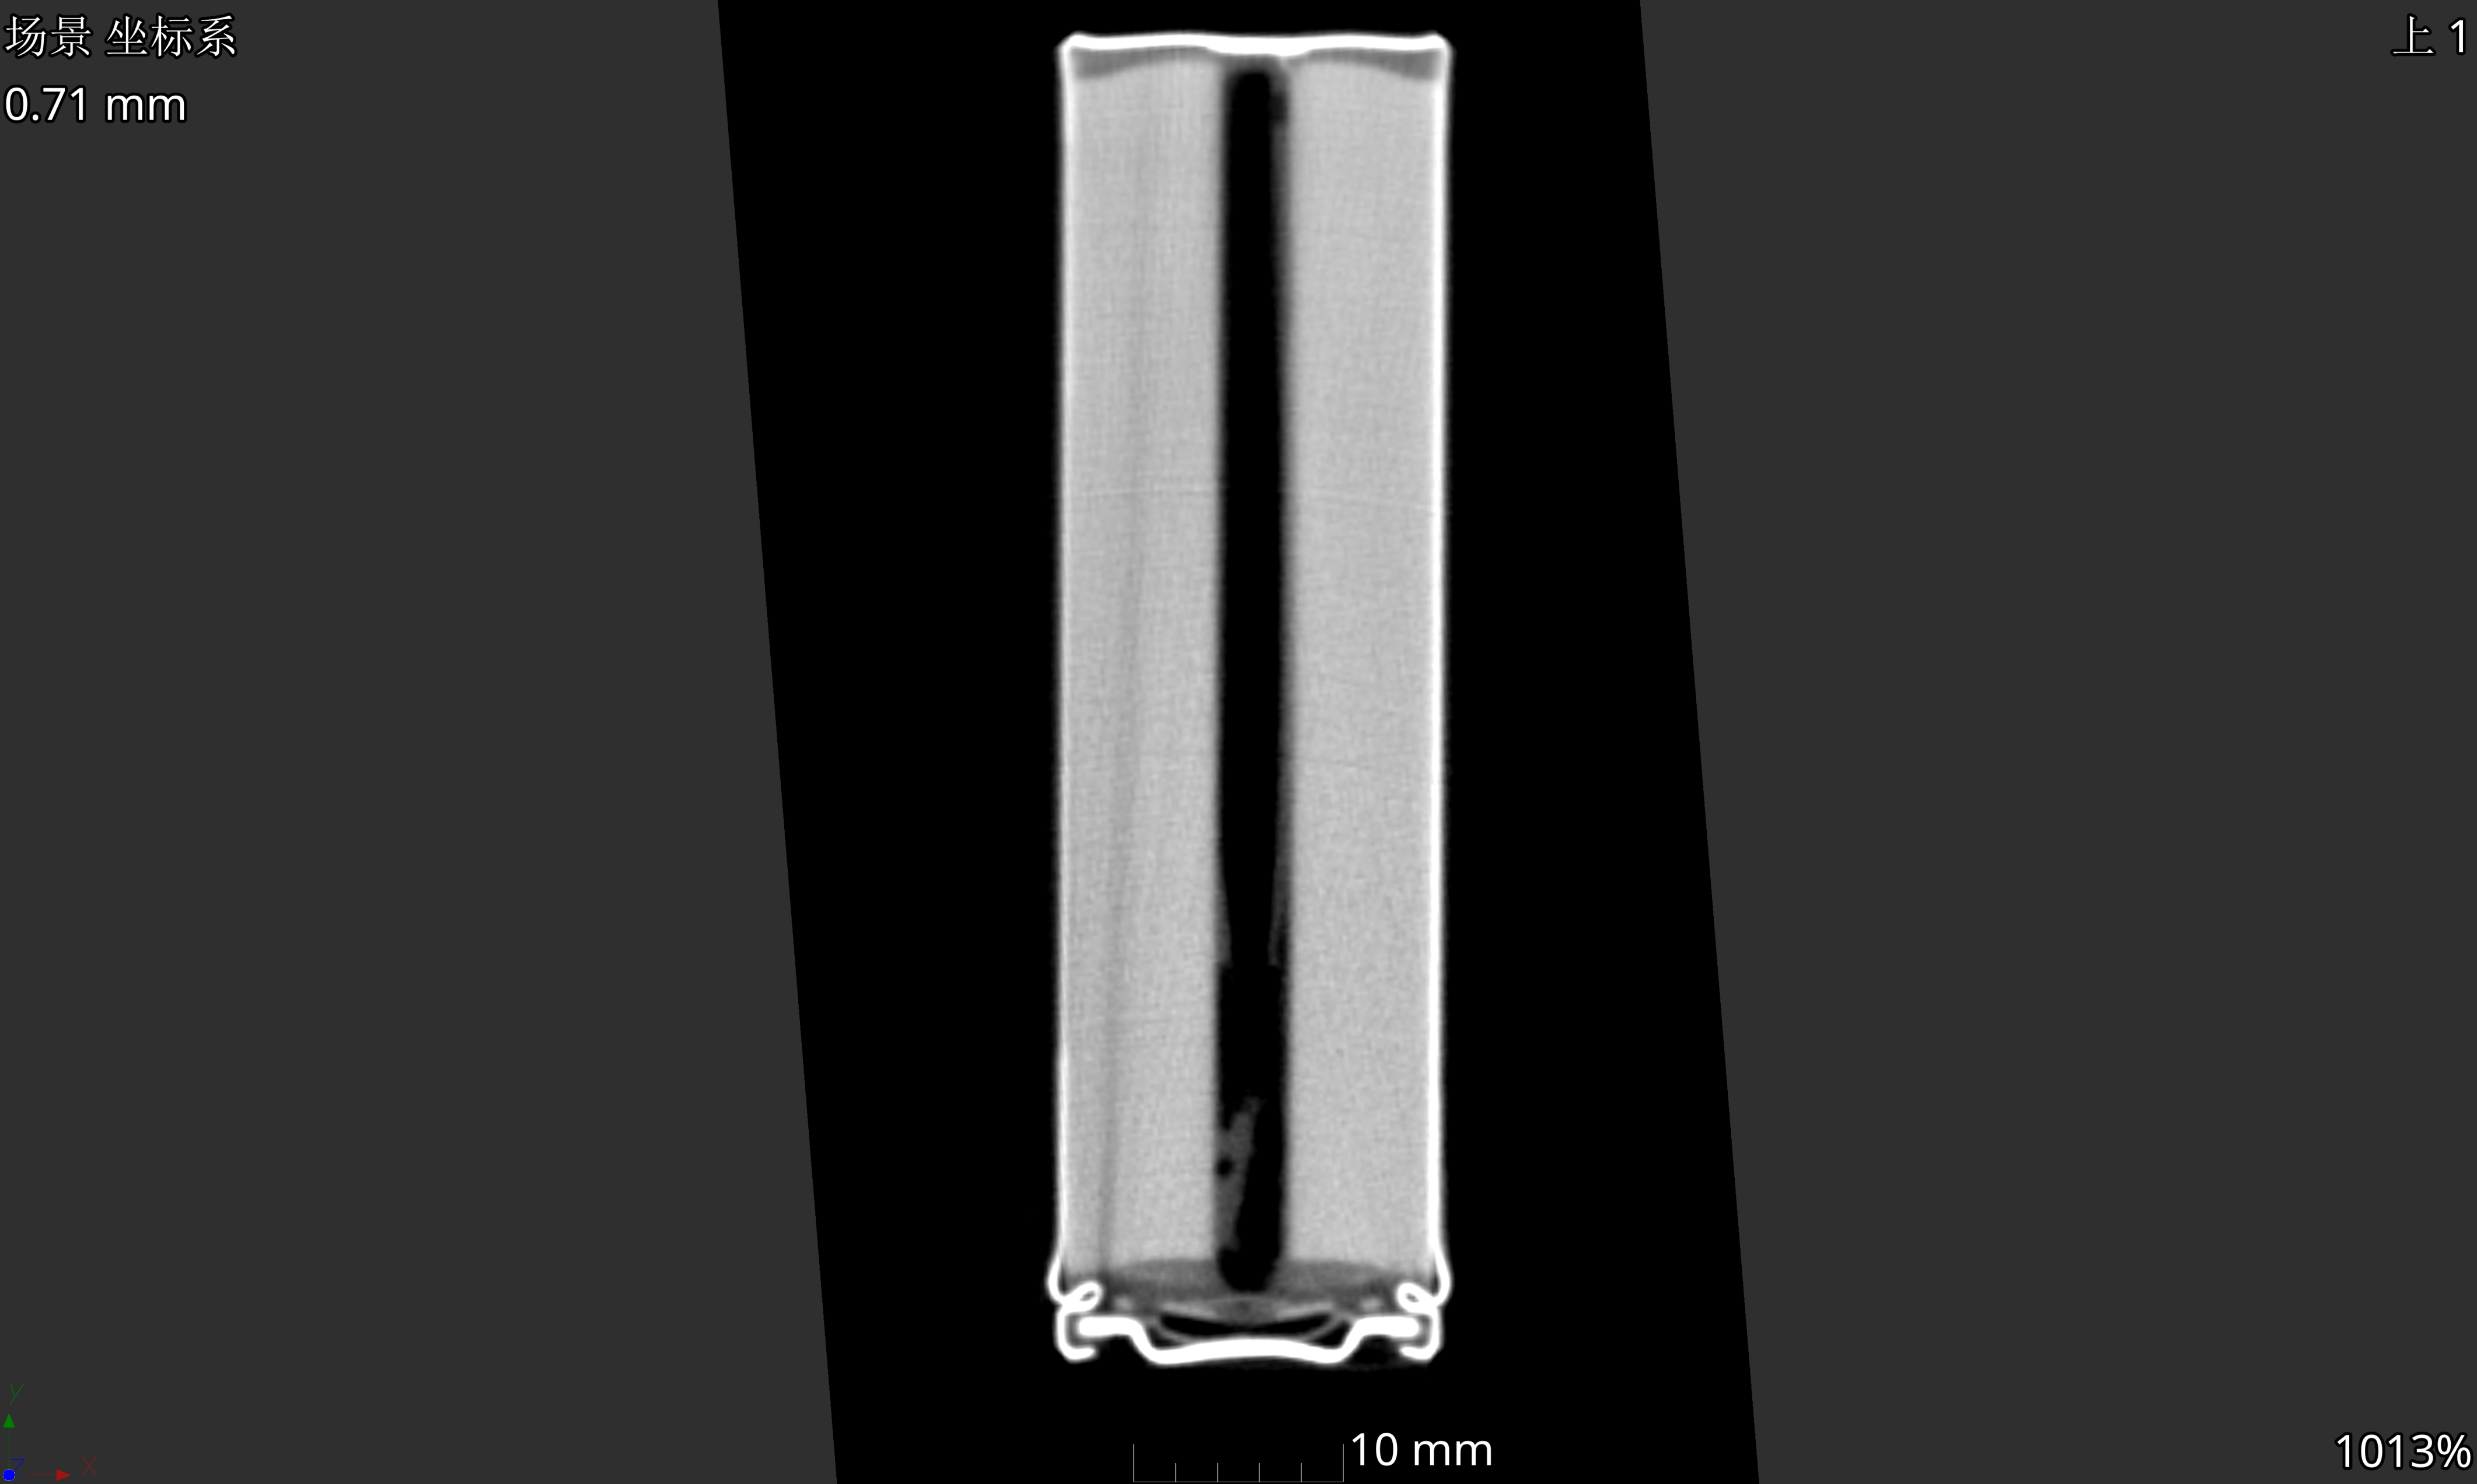
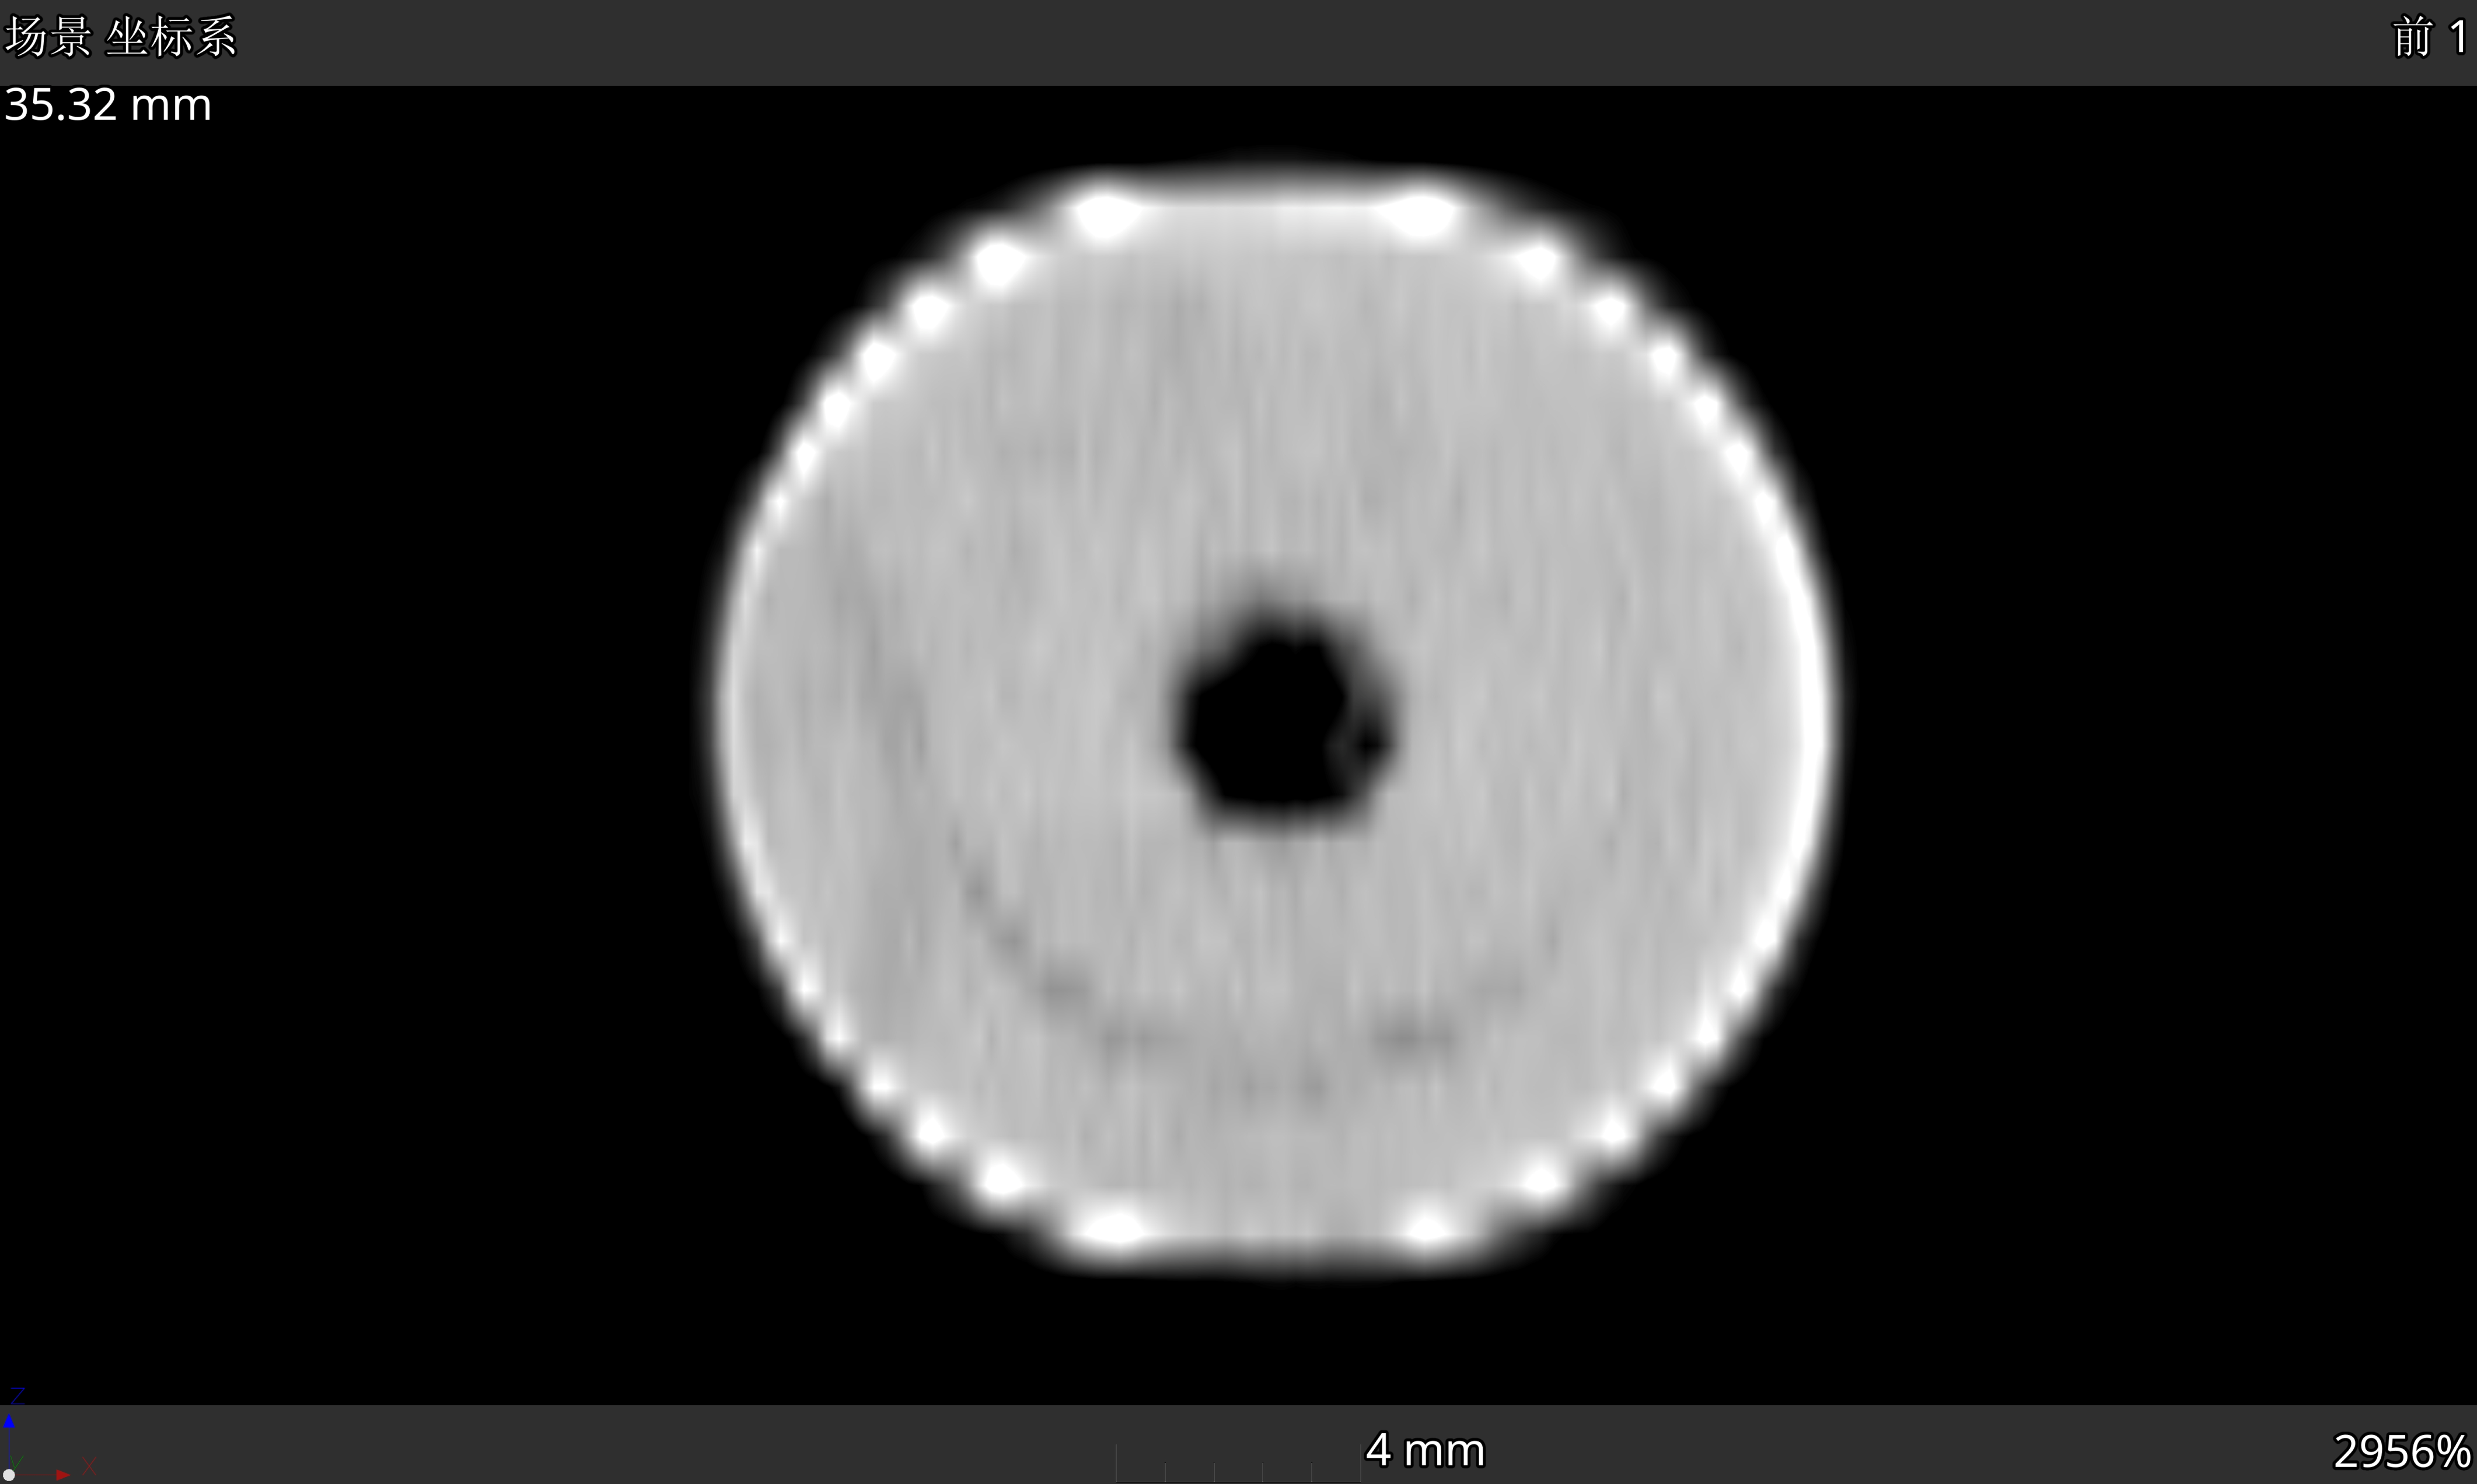
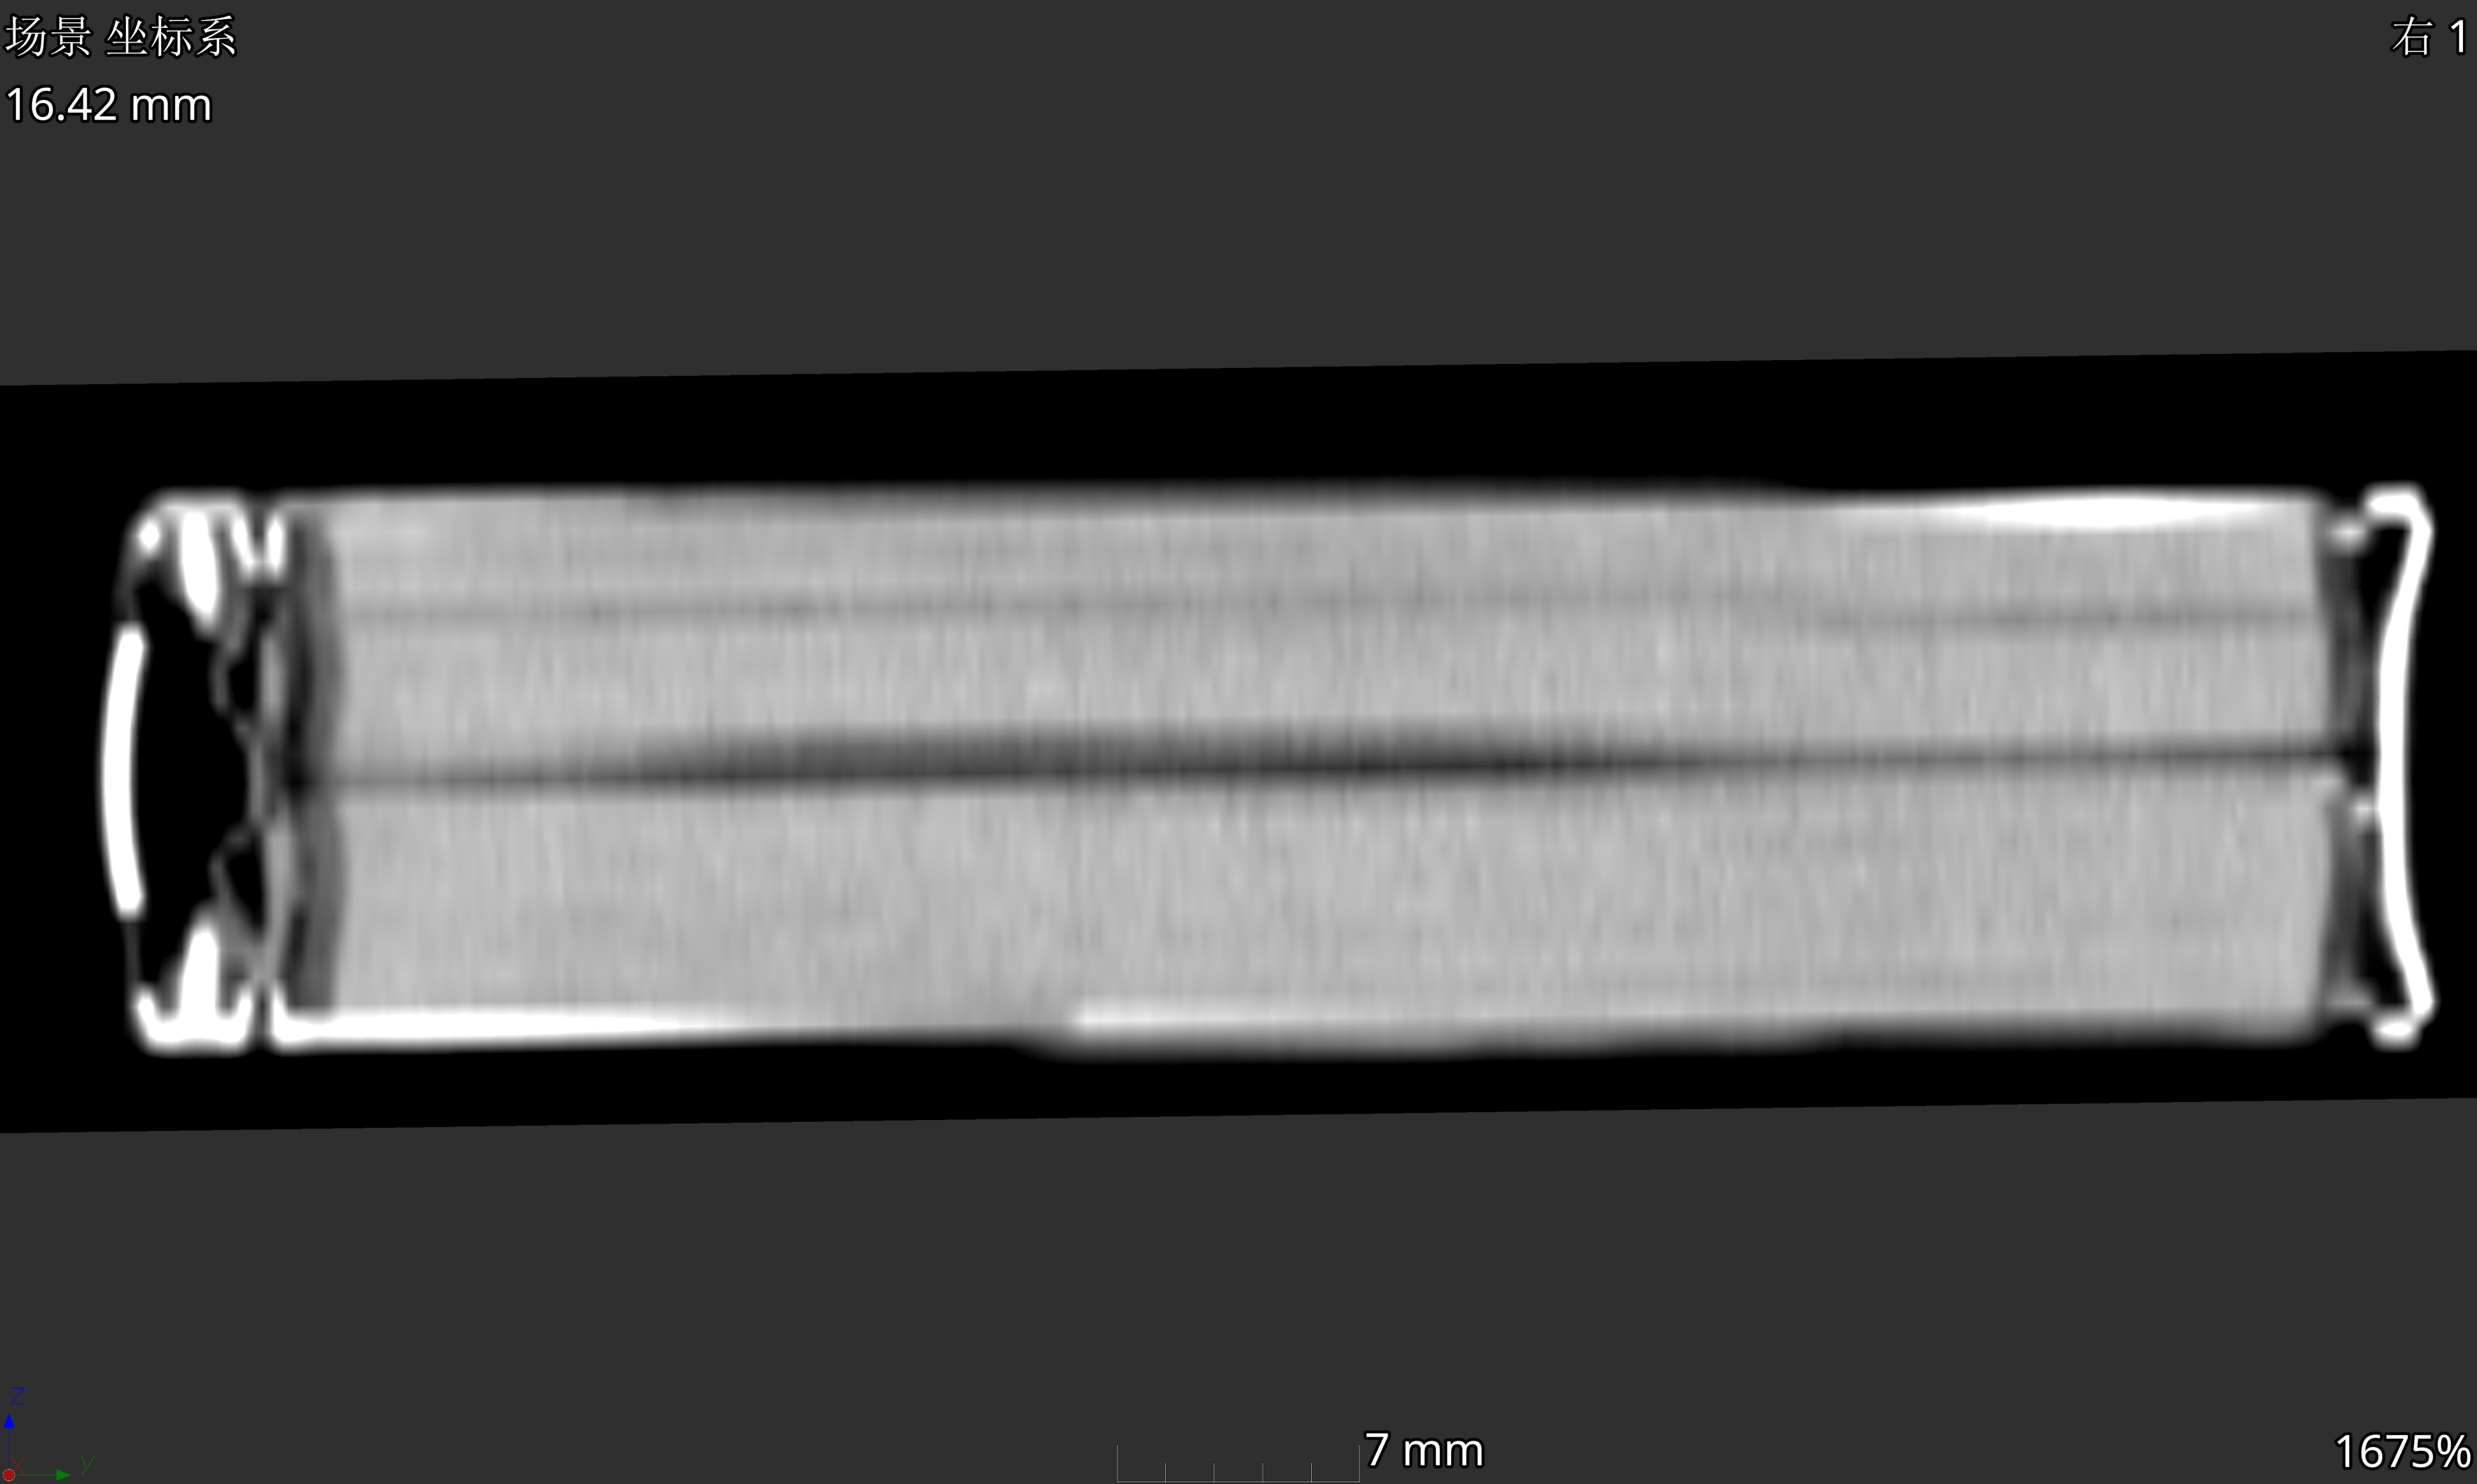
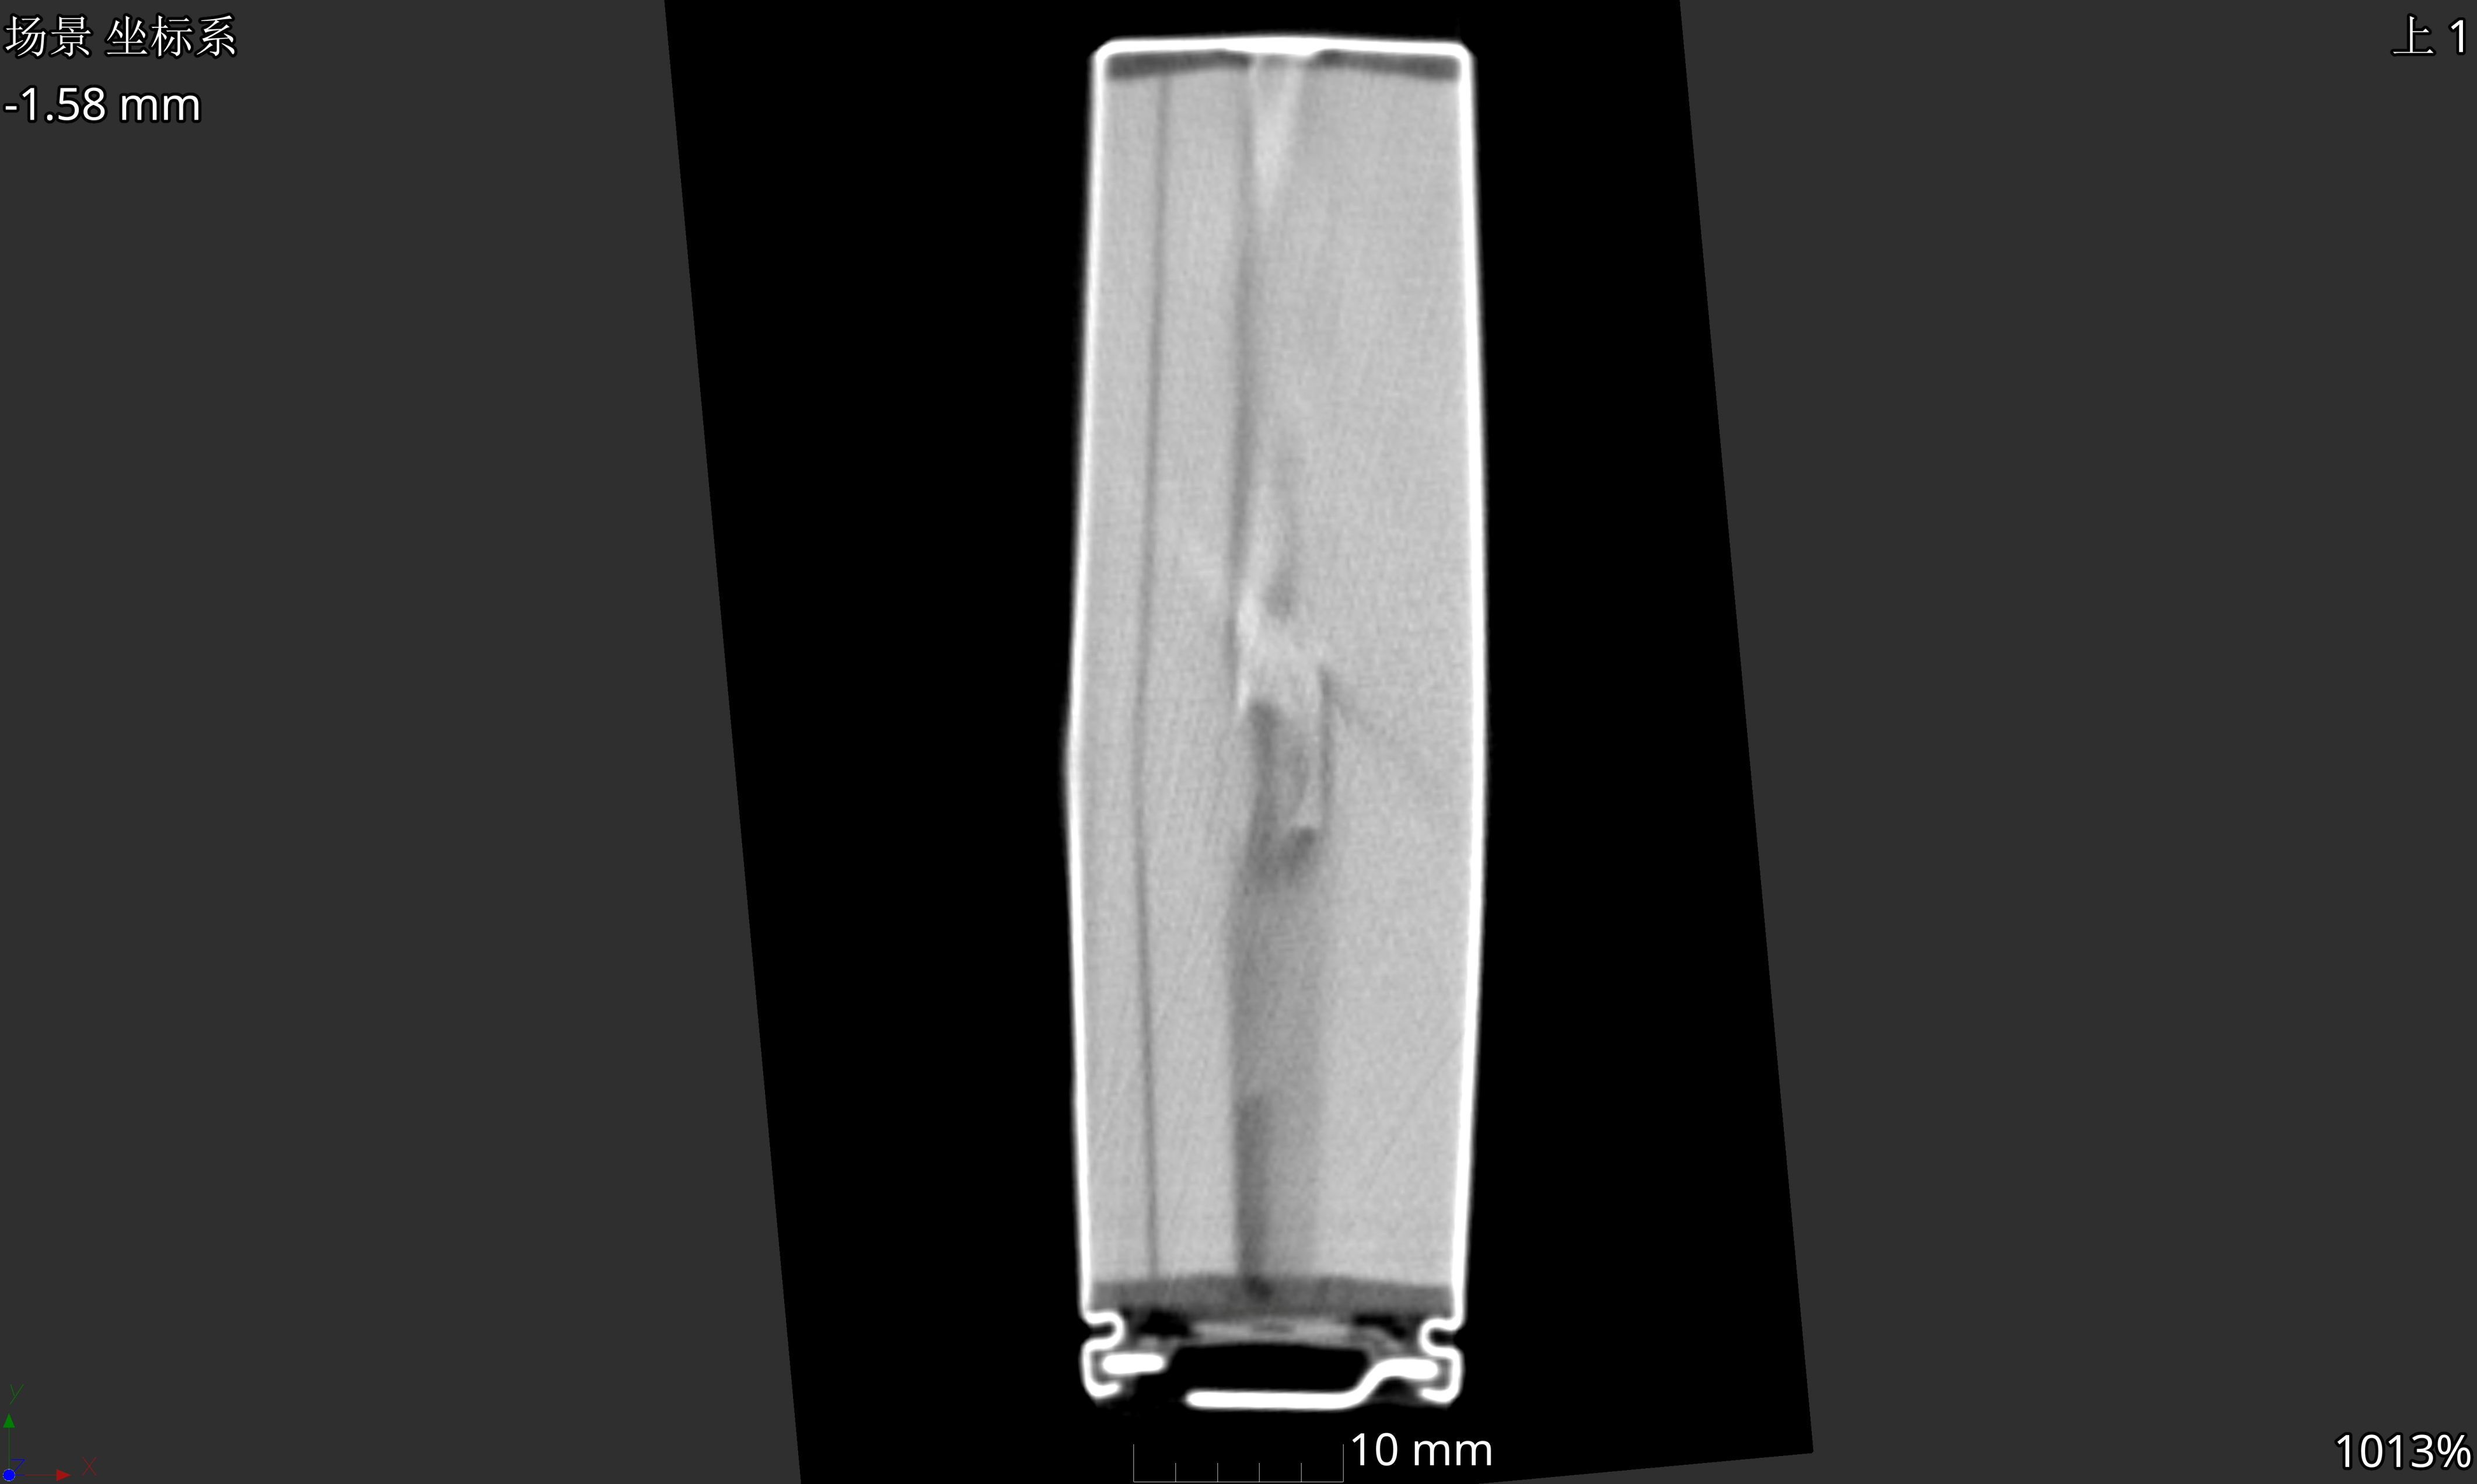
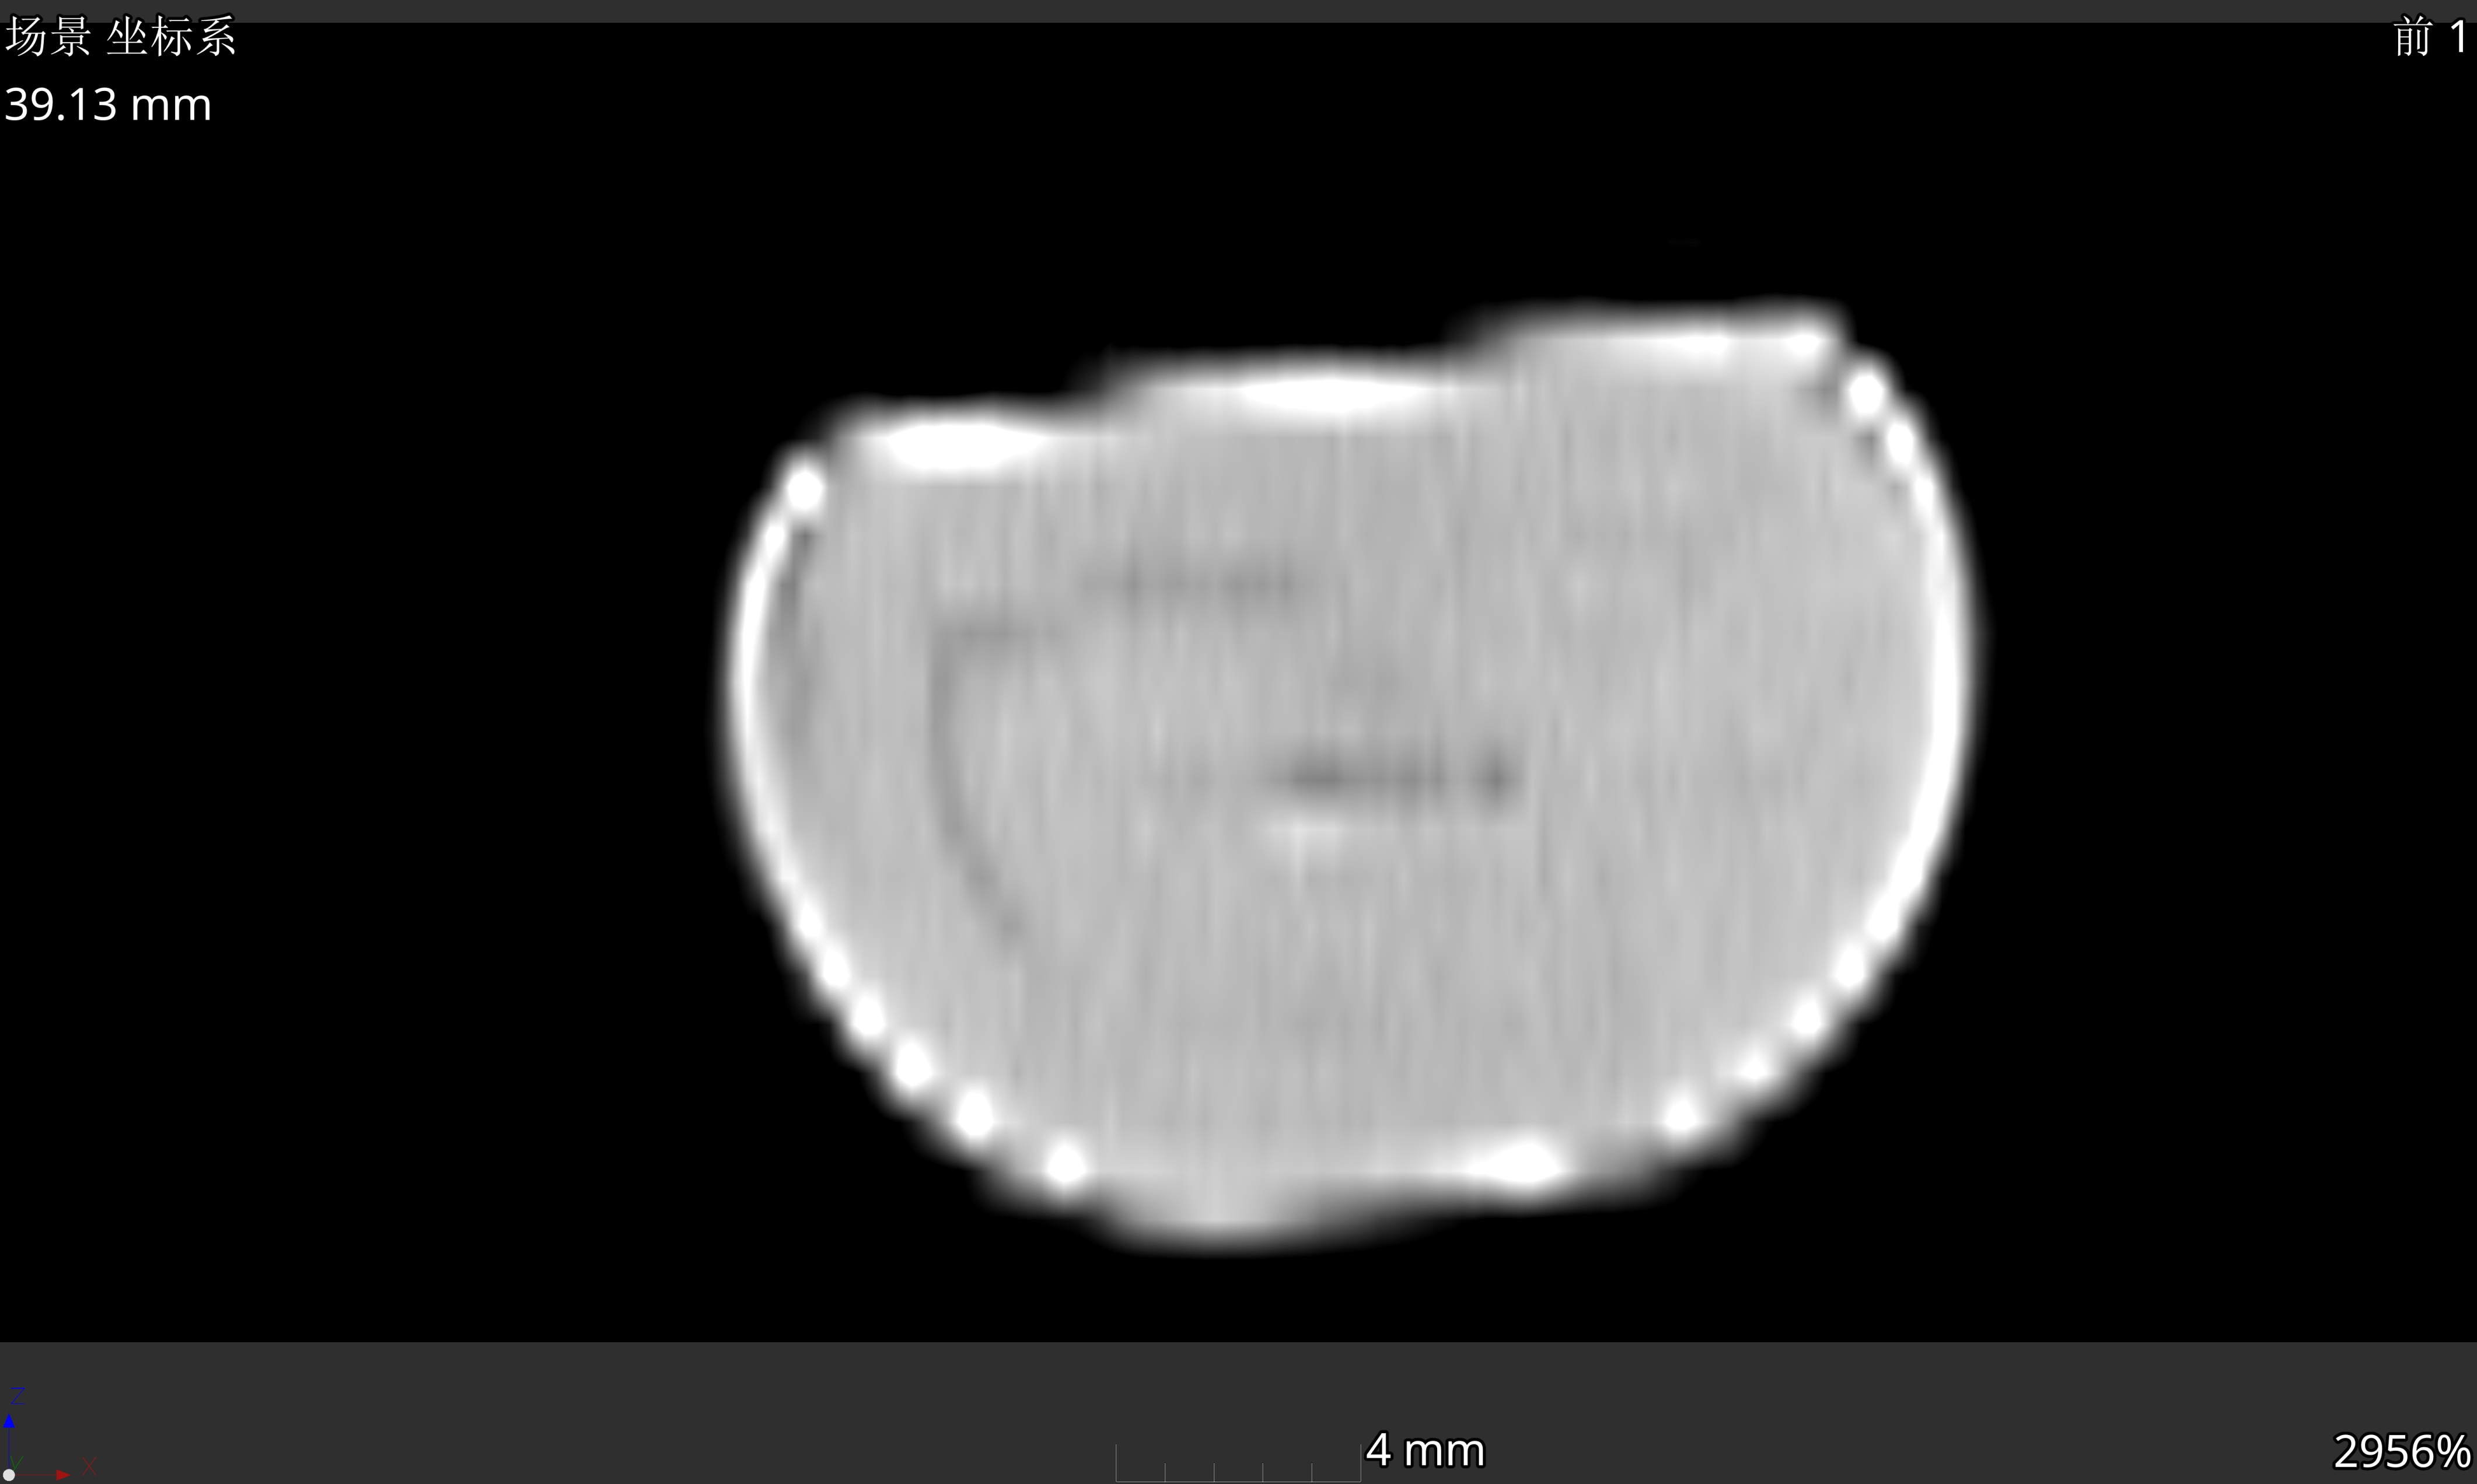
The 3D reconstruction image and cross-sectional slices of the battery’s industrial CT scan are shown in Figure 6. A three-dimensional coordinate system (XYZ) was established with the geometric center of the battery as the origin, and the cross-sectional views in the XY, YZ, and XZ directions were observed.

Figure 6.
Schematic diagram of the coordinate system of the 3D reconstruction model and the three-directional cross sections of XY, YZ, and XZ.
The deformation percentage of the battery was measured by longitudinal sectioning of the minimum diameter of the battery. The minimum longitudinal diameter and porosity measurements are shown in Figure 7 and Figure 8, respectively, and the deformation rates and porosities are presented in Table 6.

Figure 7.
Minimum longitudinal diameter of the battery.

Figure 8.
Measurement of battery porosity.

Table 6.
The deformation rates and porosities of the battery.
Table 7 presents CT-scan cross-sectional images showing the internal structure of the battery at different SOCs. According to the scan results, as the SOC increased, the internal voids within the battery gradually decreased, indicating a reduction in the internal compression degree. This phenomenon further suggests that the battery’s impact resistance improved, with a corresponding decrease in the extent of deformation.

Table 7.
CT-scan cross-sectional images.
3.2.2. Different Impact Force Groups
In this experimental group, the SOC was set at 50%, the impact surface was planar, the impact direction was radial, and the impact heights were 200, 500, and 1000 mm (see Figure 9 and Figure 10).

Figure 9.
Post-experimental batteries in the negative-electrode direction.

Figure 10.
Post-experimental batteries in the positive-electrode direction.
The degree of battery deformation increased significantly as the impact height increased, and leakage frequently occurred during the deformation process. Furthermore, the extent of leakage escalated with the increasing impact energy. Figure 11 illustrates how the compression length of the impacted surface of each battery varied with the height of the falling hammer. According to Figure 11, the battery deformation was not directly proportional to the impact force; as the height of the falling hammer increased, the growth trend of the compression amount gradually slowed down, indicating that the battery’s ability to resist impact deformation was gradually enhancing [16].
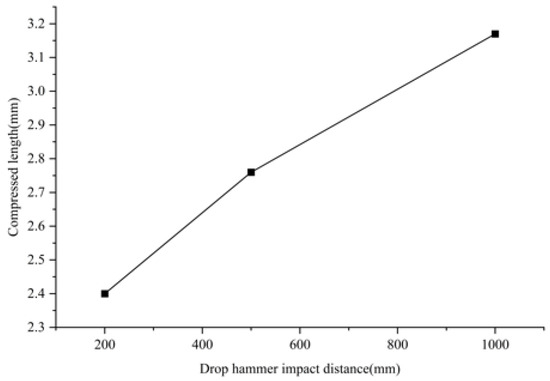
Figure 11.
Compression length–drop-hammer height curve.
Figure 12 presents the voltage–time curve, where the green dotted line, red solid line, and blue solid line represent the impact test with drop heights of 200, 500, and 1000 mm, respectively. As the impact force increased, the voltage fluctuation also intensified. It can be inferred that when voltage fluctuations exceed a certain threshold, irreversible structural or electrochemical changes may occur within the battery, potentially leading to performance degradation or failure. Although the battery exhibits increased resistance to deformation under higher impact forces, the degree of deformation still increases. When the external load surpasses the mechanical limits of the electrode or separator materials, failure phenomena such as internal short circuits may be triggered. In more severe cases, heat accumulation can initiate thermal runaway, potentially resulting in fire hazards. Therefore, it is essential to minimize the impact energy experienced by the battery in order to enhance the voltage stability and ensure reliable energy output. Strategies to reduce impact energy include the use of energy-absorbing materials in the battery pack casing, gap-filling materials within the pack, and vehicle body structures designed for energy absorption. These measures not only enhance the safety of the battery system, but also contribute to improved driving comfort for the entire vehicle [17].

Figure 12.
Voltage–time curve.
Table 8 presents a comparison of CT-scan cross-sectional images obtained after applying different impact forces. Labels 2, 4, and 5 correspond to the experimental results associated with impact heights of 200, 500, and 1000 mm, respectively. As indicated in Table 8, increasing the impact height resulted in the more pronounced deformation of the battery’s internal structure, as evidenced by the increased number of wrinkles and enhanced structural compaction. These structural alterations may have a significant influence on the battery performance. Additionally, the positive terminal exhibited outward bulging, while the battery became flattened and expanded laterally on both sides.

Table 8.
Comparison of CT-scan cross-sectional images after different impact forces.
A car may be subjected to various degrees of external impacts during driving including minor vibrations, more severe jolts, and collisions. The long-term accumulation of minor impacts may cause the loosening of connection components and an increase in the contact resistance between the battery modules, thereby affecting the overall performance and service life of the battery. Minor collisions may cause slight deformation of the battery cells and local damage to the separator, increasing the risk of internal short circuits, which, in turn, leads to an increase in the self-discharge rate and capacity decline. In the event of a severe collision, it may result in damage to the battery pack structure, significant deformation or rupture of the battery cells, and even electrolyte leakage, thereby causing short circuits, fires, explosions, and other serious consequences.
3.2.3. Different Impact Direction Groups
In this experimental group, the SOC was set at 50%, the impact height was 200 mm, and the impact directions were axial and radial. The battery conditions after the experiments are shown in Figure 13, where the battery subjected to radial impact is shown on the left and the one subjected to axial impact is shown on the right. The battery subjected to radial impact exhibited a flattened morphology, with protrusion of the electrodes and concurrent electrolyte leakage. Although voltage fluctuations were observed, they were minor, and the voltage quickly returned to stability; no permanent short-circuit failures occurred. In contrast, the battery subjected to axial impact experienced compression along the electrode direction without electrolyte leakage. However, the voltage rapidly declined to 1.96 V immediately after the impact, gradually decreased to 0.51 V, and subsequently increased slightly to 0.62 V. This abrupt voltage drop suggests the potential occurrence of internal structural damage. After a 24 h rest period, the voltage demonstrated a slight recovery but remained significantly below the initial value of 3.65 V, indicating the presence of irreversible damage. The overall voltage variation trend is illustrated in Figure 14.

Figure 13.
Comparison of batteries under different impact directions.

Figure 14.
Changes in battery voltage under different impact directions.
Table 9 presents a comparison of the CT-scan cross-sectional images obtained after applying different impact directions. As shown in Table 9, the battery subjected to radial impact experienced significant horizontal compression, which considerably reduced its internal space. In contrast, the variation in space within the electrode region was comparatively minor. The battery that underwent axial impact suffered severe deformation in the electrode area, leading to compromised electrode contact, ultimately resulting in irreversible battery failure.

Table 9.
Comparison of CT-scan cross-sectional images under different impact directions.
3.2.4. Different Impact Surface Groups
In this experimental group, the SOC was set at 50%, the impact height was 200 mm, and only the impact surface was varied to conduct comparative impact tests. The experimental results are presented in Figure 15. The impact surface had a significant influence on the degree of battery deformation. Under planar impact conditions, the overall deformation of the battery was relatively small, while under cylindrical surface impact, the battery deformed more obviously, with severe compression in the middle, upward bending at both ends, and a sudden voltage drop. However, the voltage recovered to 3.65 V after the system stabilized.

Figure 15.
Comparison of batteries with different impact surfaces.
Table 10 presents a comparison of the CT-scan cross-sectional images obtained after applying different impact surfaces. The results indicate that under planar impact, the battery as a whole experienced a uniform compressive state. In contrast, under local convex surface impact, significant localized deformation occurred, particularly at the impact center, where the electrodes and separator were subjected to intense compression, resulting in pronounced wrinkling. Under the same impact force, a smaller contact area led to a higher concentration of local stress, increasing the likelihood of separator rupture and potential electrode fracture. This can cause irreversible damage to the battery’s internal structure, leading to short circuits and heat accumulation and potentially triggering thermal runaway, which may result in fire hazards and pose serious threats to the safety of drivers and passengers. Therefore, in the design process of automotive battery packs, the rigidity of the battery casing can be enhanced to prevent the stress concentration caused by the contact of the convex surface of the separator; buffer materials can be used to fill the gaps between batteries; and the stacking direction of the battery cells can be reasonably arranged to prevent them from bearing the axial impact force from cylindrical lithium-ion batteries as much as possible, thereby effectively protecting the electrode structure and reducing the risk of battery failure due to electrode damage.

Table 10.
Comparison of the CT-scan cross-sectional images with different impact surfaces.
4. Conclusions
In this study, a heavy-object impact testing machine was employed to perform impact experiments on 18650 lithium-ion batteries. The study systematically investigated the effects of different SOCs, impact load intensities, impact directions, and surfaces on the structural deformation and electrochemical performance of the batteries. Integrating non-destructive computed tomography (CT) detection technology, the failure behavior of the lithium-ion batteries was thoroughly analyzed at both the macro- and microscopic levels, thereby further elucidating the mechanisms through which impact conditions influence the structural integrity and functional stability of power batteries. The experimental results demonstrated that impact events can induce internal structural damage, which, in turn, affects the electrochemical and safety performance of the batteries. The findings of this study indicate the following:
- (1)
- As the SOC increases, the internal structural stiffness of the battery is enhanced, contributing to improved overall impact resistance. However, at high SOC, the electrolyte exhibits increased activity, which makes the battery more vulnerable to external mechanical shocks.
- (2)
- As the impact force increases, the stability of the battery’s voltage gradually diminishes. Although the resistance to deformation is enhanced, the extent of deformation continues to rise, potentially leading to irreversible structural or electrochemical alterations. These changes may compromise the battery’s performance and even precipitate thermal runaway.
- (3)
- In terms of the impact direction, an axial impact is more likely to result in permanent battery failure than a radial impact. The abrupt voltage drop suggests the potential occurrence of severe internal damage.
- (4)
- Cylindrical surface impacts tend to induce higher pressure on the central region of the battery and upward deformation at both ends compared with planar impacts, thereby significantly increasing the likelihood of internal short circuits.
It should be pointed out that this study only covered the low-and medium-energy impact range of 19.6–98 J, and the failure mechanisms under high-speed (>1000 J) and multi-axis repeated impact require further investigation.
Author Contributions
J.L.: Writing—review and editing, methodology, investigation, formal analysis. B.W.: Data curation, analysis. Y.X.: Writing. H.W. (Hao Wen): High-resolution industrial CT scanning technology. D.C.: CT scanning. C.C.: Impact analysis. H.W. (Hai Wang): Battery-charging technology. All authors have read and agreed to the published version of the manuscript.
Funding
This research was funded by financial support from the Ministry of Education’s Collaborative Education Project, grant number 220603950174204, and the Innovation and Entrepreneurship Projects for College Students, grant numbers S202410580053 and X202510580098.
Institutional Review Board Statement
Not applicable.
Informed Consent Statement
Not applicable.
Data Availability Statement
The original contributions presented in this study are included in the article, and further inquiries can be directed to the corresponding author.
Conflicts of Interest
The authors declare no potential conflicts of interest concerning this research, the authorship, and/or the publication of this article.
References and Note
- Chen, Z.; Xiong, R.; Sun, F. Research Status and Analysis for Battery Safety Accidents in Electric Vehicles. J. Mech. Eng. 2019, 55, 93–104+116. [Google Scholar]
- Sahraei, E.; Campbell, J. Modeling and short circuit detection of 18650 Li-ion cells under mechanical abuse conditions. J. Power Sources 2012, 220, 360–372. [Google Scholar] [CrossRef]
- Gilaki, M.; Avdeev, I. Impact modeling of cylindrical lithium-ion battery cells: A heterogeneous approach. J. Power Sources 2016, 328, 443–451. [Google Scholar] [CrossRef]
- Wierzbicki, T.; Sahraei, E. Homogenized mechanical properties for the jellyroll of cylindrical lithium-ion cells. J. Power Sources 2013, 241, 467–476. [Google Scholar] [CrossRef]
- Meier, J.D. Material Characterization of High-Voltage Lithium-Ion Battery Models for Crashworthiness Analysis. Doctoral’s Thesis, Massachusetts Institute of Technology, Cambridge, MA, USA, 2013. [Google Scholar]
- Olivares, G. FAA sUAS COE Task A3 UAS Airborne Collision Hazard Severity Evaluation. Washington, DC, USA, 2017
- Xu, J.; Wang, L.; Liu, B. Review for mechanical integrity of lithium-ion battery. J. Automot. Saf. Energy 2017, 8, 15–29. [Google Scholar]
- Huang, S.; Xu, H.; Wang, Q.; Song, L.; Zhao, L. Study on the response characteristics of cylindrical power lithium-ion batteries under impact load. Energy Storage Sci. Technol. 2024, 13, 3642–3652. [Google Scholar]
- Yao, Y. Mechanical Characteristic and Short-Circuit Behavior of 18650 Lithium ion Battery Under Quasi-Static and Impact Loads in Packing Condition. Master’s Thesis, Chang’an University, Xi’an, China, 2022. [Google Scholar]
- Gu, L.; Wang, J.; Zhang, X.; Huang, Z.; Qi, W.; Zhang, Y. Analysis of Influencing Factors of Failure for Cylindrical Lithium-lon Batteries under Compression/Impact Conditions. Chin. J. High Press. Phys. 2024, 38, 156–165. [Google Scholar]
- Zhang, X.C.; Zhang, T.; Liu, N.N.; Yin, X.; Wu, X.; Han, H.; Wang, Q.; Zhang, Y. Dynamic crushing behaviors and failure of cylindrical lithium-ion batteries subjected to impact loading. Eng. Fail. Anal. 2023, 154, 107653. [Google Scholar] [CrossRef]
- Wang, L.B.; Li, J.P.; Chen, J.Y.; Duan, X.; Li, B.; Li, J. Revealing the internal short circuit mechanisms in lithium-ion batteries upon dynamic loading based on multiphysics simulation. Appl. Energy 2023, 351, 121790. [Google Scholar] [CrossRef]
- Zhang, X.; Wang, J.; Wang, Y.; Huang, Z.; Wang, K.; Qin, J. Impact Responses of Prismatic Lithium-Ion Battery Based on the Membrane Factor Method. Appl. Math. Mech. 2022, 43, 1203–1213. [Google Scholar]
- Guo, Y.; Liu, X.; Bai, C.; Jia, P.; Guo, B. Mechanical/Electrochemical Coupling Failure Characteristics Tests of Light and Small UAVs Lithium Battery under Impact Load. Sci. Technol. Eng. 2022, 22, 14002–14010. [Google Scholar]
- GB 38031-2020; Electric Vehicles Traction Battery Safety Requirements. State Administration for Market Regulation of the People’s Republic of China: Beijing, China, 2020.
- Hao, X.; Du, J.; Liang, H.; Yang, S.; Tu, R.; Zhang, R. A review of the safety characteristics of lithium ion batteries after impact extrusion. Fire Sci. Technol. 2021, 40, 963–967. [Google Scholar]
- Huang, L. Impact Response Analysis and Safety Evaluation of the Bottom of EV Battery Pack. Master’s Thesis, South China University of Technology, Guangzhou, China, 2021. [Google Scholar]
Disclaimer/Publisher’s Note: The statements, opinions and data contained in all publications are solely those of the individual author(s) and contributor(s) and not of MDPI and/or the editor(s). MDPI and/or the editor(s) disclaim responsibility for any injury to people or property resulting from any ideas, methods, instructions or products referred to in the content. |
© 2025 by the authors. Licensee MDPI, Basel, Switzerland. This article is an open access article distributed under the terms and conditions of the Creative Commons Attribution (CC BY) license (https://creativecommons.org/licenses/by/4.0/).
