Article

Comprehensive Efficiency Analysis of Ethanol–Gasoline Blends in Spark Ignition Engines

by
Ádám István Szabó
,
Zaid Tharwat Mursi
,
Anna Wégerer
and
Gábor Nagy
*
Department Propulsion Technology, Széchenyi István University, Egyetem tér 1., H-9026 Győr, Hungary
*
Author to whom correspondence should be addressed.
Eng 2025, 6(10), 256; https://doi.org/10.3390/eng6100256
Submission received: 30 June 2025 / Revised: 29 August 2025 / Accepted: 28 September 2025 / Published: 2 October 2025

Abstract

This paper investigates the effects of using 10% v/v (E10) and 30% v/v (E30) ethanol–gasoline blends on spark ignition (SI) engine fuel consumption, brake-specific fuel consumption, brake thermal efficiency, combustion parameters and exhaust gas temperature. The 30% v/v ethanol–gasoline blend was designed not to exceed the octane number (RON and MON) of the regular commercially available reference fuel (E10); therefore, the knock resistance of the reference and research fuel does not differ significantly. The tests were conducted on an AVL internal combustion engine test cell using a four-stroke, four-cylinder, turbocharged SI engine with direct injection and a compression ratio of 12.2:1. The engine was manufactured in 2022, and it is the latest commercially available version currently in production. Engine tests were conducted under stoichiometric conditions (when possible) at loads ranging from 2–20 bar brake mean effective pressure and engine speeds ranging from 1000–6000 rpm, and the fuel consumption, brake-specific fuel consumption, combustion parameters, exhaust gas temperature and brake thermal efficiency were measured using the two different ethanol–gasoline blends. Test results showed that the higher concentration ethanol–gasoline blend—due to its lower density, lower heating value and higher latent heat of vaporization—had increased fuel consumption, brake-specific fuel consumption and decreased brake thermal efficiency, while exhaust gas temperature also decreased (at 2500 rpm 12 bar BMEP, the differences were 11%, 6.6%, −0.78% and −3.7%, respectively). Peak combustion pressures were identical under the same operating conditions, but the peak combustion temperature of E30 was on average 3% lower.

1. Introduction

The automotive industry continuously explores alternative fuels to mitigate environmental concerns and reduce reliance on fossil fuels [1,2]. Bioethanol is a promising renewable alternative due to its favorable physicochemical properties, including a high octane number and oxygen content, which can enhance combustion and reduce emissions in spark ignition (SI) engines [1,2,3,4,5,6]. This review provides a comprehensive efficiency analysis of ethanol–gasoline blends, with a particular focus on E30 (30% ethanol content by volume) in comparison to E10 (10% ethanol content by volume) as a baseline, and other high-ethanol fuel blends, examining their effects on volumetric fuel consumption (fuel consumption by volume), brake-specific fuel consumption (BSFC), brake thermal efficiency (BTE), and exhaust gas temperature (EGT).
Ethanol possesses several properties advantageous for SI engines, such as a higher octane number, which enhances anti-knocking performance and allows for higher compression ratios, leading to increased power output [2,3,4,5]. Its higher latent heat of vaporization contributes to a cooler intake charge, potentially improving volumetric efficiency in port-injected engines [2,3]. Furthermore, the oxygen content in ethanol promotes a more complete combustion process, which can reduce emissions of certain pollutants [2,3,4,5]. However, ethanol also has a lower energy content than gasoline, which typically results in a penalty in terms of fuel economy [2,3,5]. High ethanol content, with its increased latent heat of evaporation, could cause cold start issues and misfires. Ethanol could be produced from renewable sources in the near future, making it a more sustainable fuel alternative [6]. Also, other studies suggest that the higher ethanol content of the fuel blend contributes to a faster heat release, which could improve efficiency and reduce the risk of knocking [7,8].
Brake-specific fuel consumption is a critical parameter for evaluating engine efficiency, indicating the fuel consumed per unit of power produced. Ethanol has a lower energy density compared to gasoline, meaning that a larger mass or volume of fuel is required to produce the same amount of energy [1,5]. Studies generally indicate that increasing ethanol in gasoline blends increases BSFC [3,9,10]. This is primarily attributed to ethanol’s lower heating value compared to gasoline, meaning more mass of ethanol-blended fuel is required to produce the same energy output and engine power [2,5]. The ethanol has a 27 MJ/kg lower heating value (LHV) than gasoline’s 44 MJ/kg [11]. Consequently, an increase in ethanol content in fuel blends generally leads to higher BSFC values when comparing the same power output [5,10,12].
For fuels that contain up to 10% ethanol by volume, the effect of ethanol on BSFC can vary, with some studies suggesting minimal impact or even a slight reduction compared to pure gasoline, while others show a slight increase [3,9]. When considering higher ethanol blends like E30 and beyond, the trend of increased BSFC becomes more pronounced due to the further reduction in the overall energy content of the fuel blend. For example, studies have shown that blends with higher ethanol content require more fuel mass to achieve the same power output [9]. Indeed, other studies have shown that ethanol addition increases specific fuel consumption compared to pure gasoline [10]. While ethanol offers environmental benefits, the higher BSFC of ethanol–gasoline blends, especially with increasing ethanol content, necessitates a greater volume of fuel to cover the same distance, which can impact the fuel economy [5].
While specific data comparing E30 directly to E10 for BSFC is limited in published studies, general trends indicate that, as ethanol concentration increases beyond E10, BSFC tends to rise [10]. Other studies observed that ethanol–gasoline blends of 0, 10, 20, 30%, or pure ethanol increased fuel consumption [10,13]. Despite the general trend of increased BSFC with higher ethanol content, some research suggests that modifications to the engine’s control unit, such as adjusting the fuel-injection strategy or changing the ignition timing, can help optimize performance and potentially mitigate this BSFC increase [4,14]. While ethanol addition generally increases BSFC, studies have shown that specific blends, such as those with acetone additives (e.g., A10, 10% acetone in 90% gasoline), can reduce BSFC [15]. Brake thermal efficiency (BTE) measures how efficiently the fuel’s chemical energy is converted into effective work [16].
B T E = 1 B S F C · L H V  
In addition, the spray patterns of different ethanol–gasoline blends differ from those of gasoline, which may affect mixture formation and combustion efficiency [17,18].
The impact of ethanol blends on brake thermal efficiency is generally positive, with an increasing trend as the ethanol content in the blend increases [3,10,19]. This improvement can be attributed to several factors:
  • Higher octane number: Ethanol’s higher octane rating provides greater resistance to knocking, allowing the engine to operate at higher compression ratios and/or more advanced ignition timings, thereby improving combustion efficiency [4,5]. This directly contributes more efficient conversion of the fuel’s chemical energy into useful work [3,4,5].
  • Oxygen content: Ethanol contains oxygen, contributing to a more complete combustion process, particularly under certain operating conditions [3,10]. This leads to better combustion efficiency and potentially higher BTE [3,4]. The flame quenching distance for E10 is greater than the flame quenching distance of E30; therefore, more of the introduced fuel can participate in the combustion process, thus increasing the fuel conversion rate and the BTE [20,21]. The combustion efficiency of any fuel is based on the work of the combustion divided by the mass and the heating value of the fuel [22]. The oxygen content within ethanol’s molecular structure also promotes a more complete combustion process, which is beneficial for achieving higher combustion efficiency and, subsequently, better thermal efficiency [1].
  • Cooling effect: The high latent heat of vaporization of ethanol leads to a cooling effect, decreasing the starting temperature of combustion, reducing the risk of knocking, and lowering peak combustion temperature [3,23]. This can contribute to improved power output and BTE [3,4].
For E10, studies have shown a slight improvement in BTE compared to pure gasoline [3]. For E30 and other higher ethanol blends, the BTE generally improves with increasing ethanol proportion [3,10]. Several studies have reported increased BTE with increasing ethanol content in fuel blends [1,10]. It has been seen that, with the increasing proportion of ethanol in the blend, the overall thermal efficiency, heat release rate, engine volumetric efficiency and cylinder gas pressure increase [3]. Some research has indicated slight improvements in engine brake torque and thermal efficiency (up to 1.7%) with bioethanol content increased to 70%. An overall conclusion from some studies is that higher ethanol content in SI engines correlates with improved thermal efficiency [10]. Studies involving blends up to E70 and E100 have reported 0.6–15% of improvement in thermal efficiency [10,12,24,25].
Exhaust gas temperature (EGT) indicates the combustion temperature within the cylinder and the energy carried out with the exhaust gases. Generally, adding ethanol to gasoline decreases peak combustion temperature and EGT [3,15,26]. This reduction is primarily due to ethanol’s higher latent heat of vaporization and the cooling effect it imparts to the intake charge [3,5]. EGT reduction is also influenced by the faster burning of ethanol [27], allowing for a greater expansion ratio after the combustion heat release is finished. A lower peak combustion temperature can have several implications, including reduced NOx emissions and lower heat loss through exhaust gases [5,28,29]. For E30 and higher ethanol blends, the cooling effect and lower combustion temperatures can become more pronounced. This generally translates to lower EGTs as the ethanol content increases [3]. Reducing EGT is considered beneficial for engine durability as it reduces thermal stress on engine components [5]. A decrease in EGT can also be observed when adding alcohol contents, impacting the overall efficiency and emissions profile [12,30].
The test setups have primarily involved various types of internal combustion engines, including single-cylinder, multi-cylinder, and optical engines, modified for testing different ethanol–gasoline blends. Experiments were conducted under a range of conditions, such as varying engine speeds, loads, temperatures, and altitudes, with some studies utilizing chassis dynamometers. Key measurements included engine performance parameters like power, torque, fuel consumption, exhaust emissions and in-cylinder combustion characteristics.
Ethanol fuel blends, notably higher ethanol concentrations like E30, present a viable alternative fuel for spark ignition engines, with notable impacts on efficiency parameters. While higher ethanol content generally leads to an increase in brake-specific fuel consumption due to its lower heating value, this is often compensated by improved brake thermal efficiency. The enhanced BTE is attributed to ethanol’s higher octane number, allowing for increased compression ratios, and its higher latent heat of vaporization, which cools the intake charge and the more complete combustion that ethanol can promote. Additionally, ethanol blends tend to lower exhaust gas temperatures, contributing to reduced NOx emissions. Compared to E10, E30 and other high-ethanol blends demonstrate the potential for improved combustion efficiency and reduced emissions, although engine modifications may be necessary for optimal performance and durability with higher blend ratios.
This research uniquely investigates E10 and E30 ethanol–gasoline fuel blends, specifically designed to have an identical motor octane number (MON) of 85, with corresponding research octane numbers (RON) of 96.5 and 93.9, respectively. This deliberate approach contrasts with much of the existing literature, where octane numbers of ethanol blends are often either not reported or not standardized, or where increased ethanol content naturally leads to a higher octane number.
The novelty of this study lies in its focus on isolating the effect of increased ethanol content (from 10% to 30% v/v) on spark ignition (SI) engine performance parameters, such as fuel consumption, brake-specific fuel consumption (BSFC), brake thermal efficiency (BTE), and exhaust gas temperature (EGT), without the confounding influence of an increased octane number. By adjusting the E30 blend to match the MON of the reference E10 fuel according to the EN228 standard [31], this study directly addresses the underexplored question of whether the inherent advantages of ethanol blends, beyond their typical octane-boosting effect, can still improve BTE.
The expected outcomes are as follows:
  • BSFC of E30 is anticipated to increase due to its reduced lower heating value (LHV) compared to E10.
  • BTE is not expected to significantly increase because the potential benefits of ethanol (such as enhanced anti-knocking performance and quicker combustion) cannot be fully utilized if the overall octane number is not higher than that of the reference fuel.
  • EGT and peak combustion temperature are expected to decrease due to the higher latent heat of vaporization of ethanol, which effectively reduces the combustion temperature.
  • A comprehensive combustion analysis will also be conducted to evaluate in-cylinder pressure, flame development duration and combustion duration, providing deeper insights into the combustion process of E30 compared to E10.

2. Materials and Methods

In order to measure the BSFC, power output, BTE, EGT and combustion parameters of different ethanol–gasoline blends, tests were carried out on an internal combustion engine test bench using an inline 4-cylinder turbocharged SI engine with direct injection. The test took place in the internal combustion engine laboratory of Széchenyi István University at the Department of Propulsion Technology building in Győr, Hungary. Firstly, the E10 tests were completed, and after thorough cleaning and rinsing of the fuel system, the exact measurements were taken using E30. The engine was brought to its optimal operating temperature until the oil temperature in the oil pan reached 90 °C. This preconditioning ensured that all engine components attained thermal stability before the start of experimental runs. During the subsequent stabilization phase, a minimum duration of 120 s was maintained, or alternatively, the exhaust gas temperature (EGT) was monitored to ensure it did not fluctuate by more than ±2 °C per minute. This approach guaranteed consistent and reliable operating conditions for accurate monitoring and assessment. A comprehensive series of steady-state measurements was conducted across 115 operating points, spanning an engine speed range of 1000 to 6000 rpm and a brake mean effective pressure (BMEP) range of 2 to 20.3 bar.

2.1. Measurement Methodology—Steady-State Measurement

Throughout the experiments, the air–fuel ratio strategy maintained a constant lambda value of 1 whenever possible. Boost pressure at all operating points was managed by the engine control unit (ECU), while the emissions control system remained in its stock configuration and was continuously enabled.
The steady-state measurement sequence was performed as follows: The engine speed was initially set to the desired value (e.g., 1000 rpm), followed by applying the load point (e.g., 2 bar BMEP). After the speed and load were set, the ignition timing was modified to find the best efficiency while maintaining the engine speed and load. The load (BMEP) was held constant as the ignition timing was modified by letting the engine control how much air and fuel entered the combustion chamber. As the ignition was advanced, the energy conversion efficiency of the engine improved, thus less air and fuel were required to achieve the same BMEP. Throttle position, charge air pressure and fuel injection strategy (start of injection, end of injection, injection pressure) were controlled by the ECU (engine control unit).
The limiting factors of increasing ignition advance were exhaust gas temperature before the turbocharger (980 °C), peak combustion pressure (123 bar) and knock. No further ignition timing change occurred once one of the limits was reached, and the stabilization period began. After a stabilization period (until steady-state operating conditions were achieved), a 30-s measurement was initiated, during which all the measured values were recorded continuously. Upon completion of the measurement, the engine speed was maintained while the load was incrementally increased by 2 bar BMEP, if possible, and the measurement process was repeated. This process continued until the maximum load of the engine (wide open throttle or 20.3 bar BMEP) was attained at that specific engine speed. Subsequently, the engine was allowed to cool down at a low speed, low load operating point before the engine speed was incremented to the next higher value (e.g., 1250 rpm after completing measurements at 1000 rpm full load). The engine was then allowed to reach its operating temperature at the new speed and 2 bar BMEP load, and the measurement sequence was repeated. This measurement sequence was continued until full load operation at the maximum engine speed (6000 rpm) was achieved.
Key engine operating parameters, including engine speed and torque, fuel consumption, intake air temperature, coolant temperature, exhaust gas temperature, and in-cylinder pressure values, were measured during the test. Upon completing the tests with E10, the fuel system was thoroughly drained and flushed before being filled with E30, and the identical test procedure was repeated to ensure a direct comparison of engine behavior under identical operating conditions for both fuels.

2.2. Experimental Setup

2.2.1. Test Case

The test case examined a 2.0 inline 4-cylinder engine currently in mass production and used in various passenger cars. Detailed engine specifications are shown in Table 1. The objective of the test was to study the effects of different ethanol–gasoline blends on emissions, fuel efficiency, and overall performance of the engine compared to the standard ethanol–gasoline (E10).

2.2.2. Test Bench Properties and Measurement Environment

An AVL Dyno Spirit 450 high dynamic test bench (AVL List GmbH, Graz, Austria) was used to conduct the test. The engine’s crankshaft was connected to the dyno via an HBM T12HP 2 kNm torque measurement flange with a specified measurement uncertainty of 0.003% of nominal value (rated maximum speed 12,000 rpm, maximum torque 2000 Nm), as illustrated in Figure 1.
To guarantee measurement accuracy and repeatability, the test cell temperature was controlled, and the charge air temperature after the charge air cooler and the engine coolant temperature at the engine coolant inlet were conditioned to 30 °C and 60 °C, respectively. Intake air temperature and humidity were set to 25 °C and 50% relative humidity, as shown in Table 2 below.

2.2.3. In-Cylinder Pressure Measurement

During the tests, in-cylinder pressure measurement and combustion analysis were performed to identify key properties of the combustion process. Using the AVL IndiCom combustion analysis system with Kistler 6045B (Kistler Instrumente AG, Winterthur, Switzerland) high-temperature pressure sensor (±35 pC/bar sensitivity, ≤±1% thermal stability across −20 °C to 350 °C) and AVL 365C angle encoder, the precise crank angle-based pressure monitoring was recorded, and combustion properties were calculated using AVL’s GCA software (IndiCom Version 2.7, Hotfix: 6, Build: 286). Before the measurement was carried out, ignition timing was set in a way that provided the best efficiency possible (and that correlated with a mass fraction burned 50% (MFB50) value at around 6–8 crank angle degrees (CA°) after top dead center (aTDC), when neither knock, temperature, nor pressure limit was reached). MFB10 and MFB90 were also used to calculate a combustion’s rapid burning phase duration. The rapid burning phase is the crank angle rotation required to burn the bulk of the charge. It is defined as the interval between the end of the flame development stage (mass fraction burned of 10% (MFB10)) and the end of the flame propagation process (mass fraction burned of 90% (MFB90)).
The cylinder pressure signal was filtered and rectified to identify knocking combustion and the knock peak of each cycle. The knocking event was determined to be severe if the knock peak (measured in bar) was higher than 0.1% of the engine speed (measured in rpm) or if more than 5% of the knock peaks exceeded 0.05% of the engine speed during the last 50 cycles.

2.3. Fuels

In this study, commercially available gasoline, with a maximum 10% ethanol blend (E10), served as the baseline fuel due to its widespread availability and established use in internal combustion engines. The alternative fuel, E30, comprising approximately 30% ethanol and 70% gasoline, was produced especially for these measurements. It is important to note that the base fuels for E10 and E30 are not identical. E10 consists of 13.9% olefins and 29.4% aromatic hydrocarbons, from which 4.2% is toluene, a common component that improves octane ratings (see Table 3). The base fuel for E30 consists almost entirely of paraffins; therefore, it does not have octane rating increasing components, except for ethanol. Therefore, the octane rating (MON and RON) of E30 does not exceed the octane rating of E10.
This enables direct comparison between a standard petroleum-based fuel and a renewable alternative with similar knock resistance properties. The difference in BTE can be attributed to the effect of additional ethanol instead of the increased RON and MON values.
The distinct chemical and physical properties of E30, particularly the higher oxygen content and latent heat of vaporization of ethanol, are expected to influence combustion characteristics, engine efficiency and exhaust emissions.
Table 3 presents a comparative analysis of the key properties of two gasoline blends, E10 and E30, with varying ethanol content. As expected, the E30 blend, containing 30.6% v/v ethanol, exhibits a higher oxygen content (11.7 m/m%) and hydrogen content (14.79 m/m%) compared to the E10 blend (3.41 m/m% and 13.32 m/m%, respectively). This increase in oxygen and hydrogen content is attributed to the molecular structure of ethanol (C2H5OH). On the other hand, the E30 blend shows a lower carbon content (73.5 m/m%) and heating value (40.23 MJ/kg) than E10 (83.27 m/m% and 42.04 MJ/kg, respectively), which can be attributed to the lower energy density of ethanol compared to conventional gasoline hydrocarbons. While the RON is slightly lower for E30 (93.9) than for E10 (96.5) and the MON values are identical, both blends fall within the acceptable range for use in modern spark ignition engines.
The data highlights the trade-offs associated with increasing ethanol content in gasoline, particularly the impact on energy density and carbon emissions.
The stoichiometric air–fuel ratio (AFR) was calculated according to Equation (2), where 28.965 g/mol is the molar weight of dry air, 0.2093 is the molar ratio of oxygen in dry air, α is the molar ratio of hydrogen to carbon, and β is the molar ratio of oxygen to carbon in the fuel. The molar mass of carbon is 12.011, 1.008 is the molar mass of atomic hydrogen, and 16 is the molar mass of atomic oxygen.
A F R = 28.965 0.2093 · 1 + α 4 β 2 12.011 + 1.008 · α + 16 · β ,
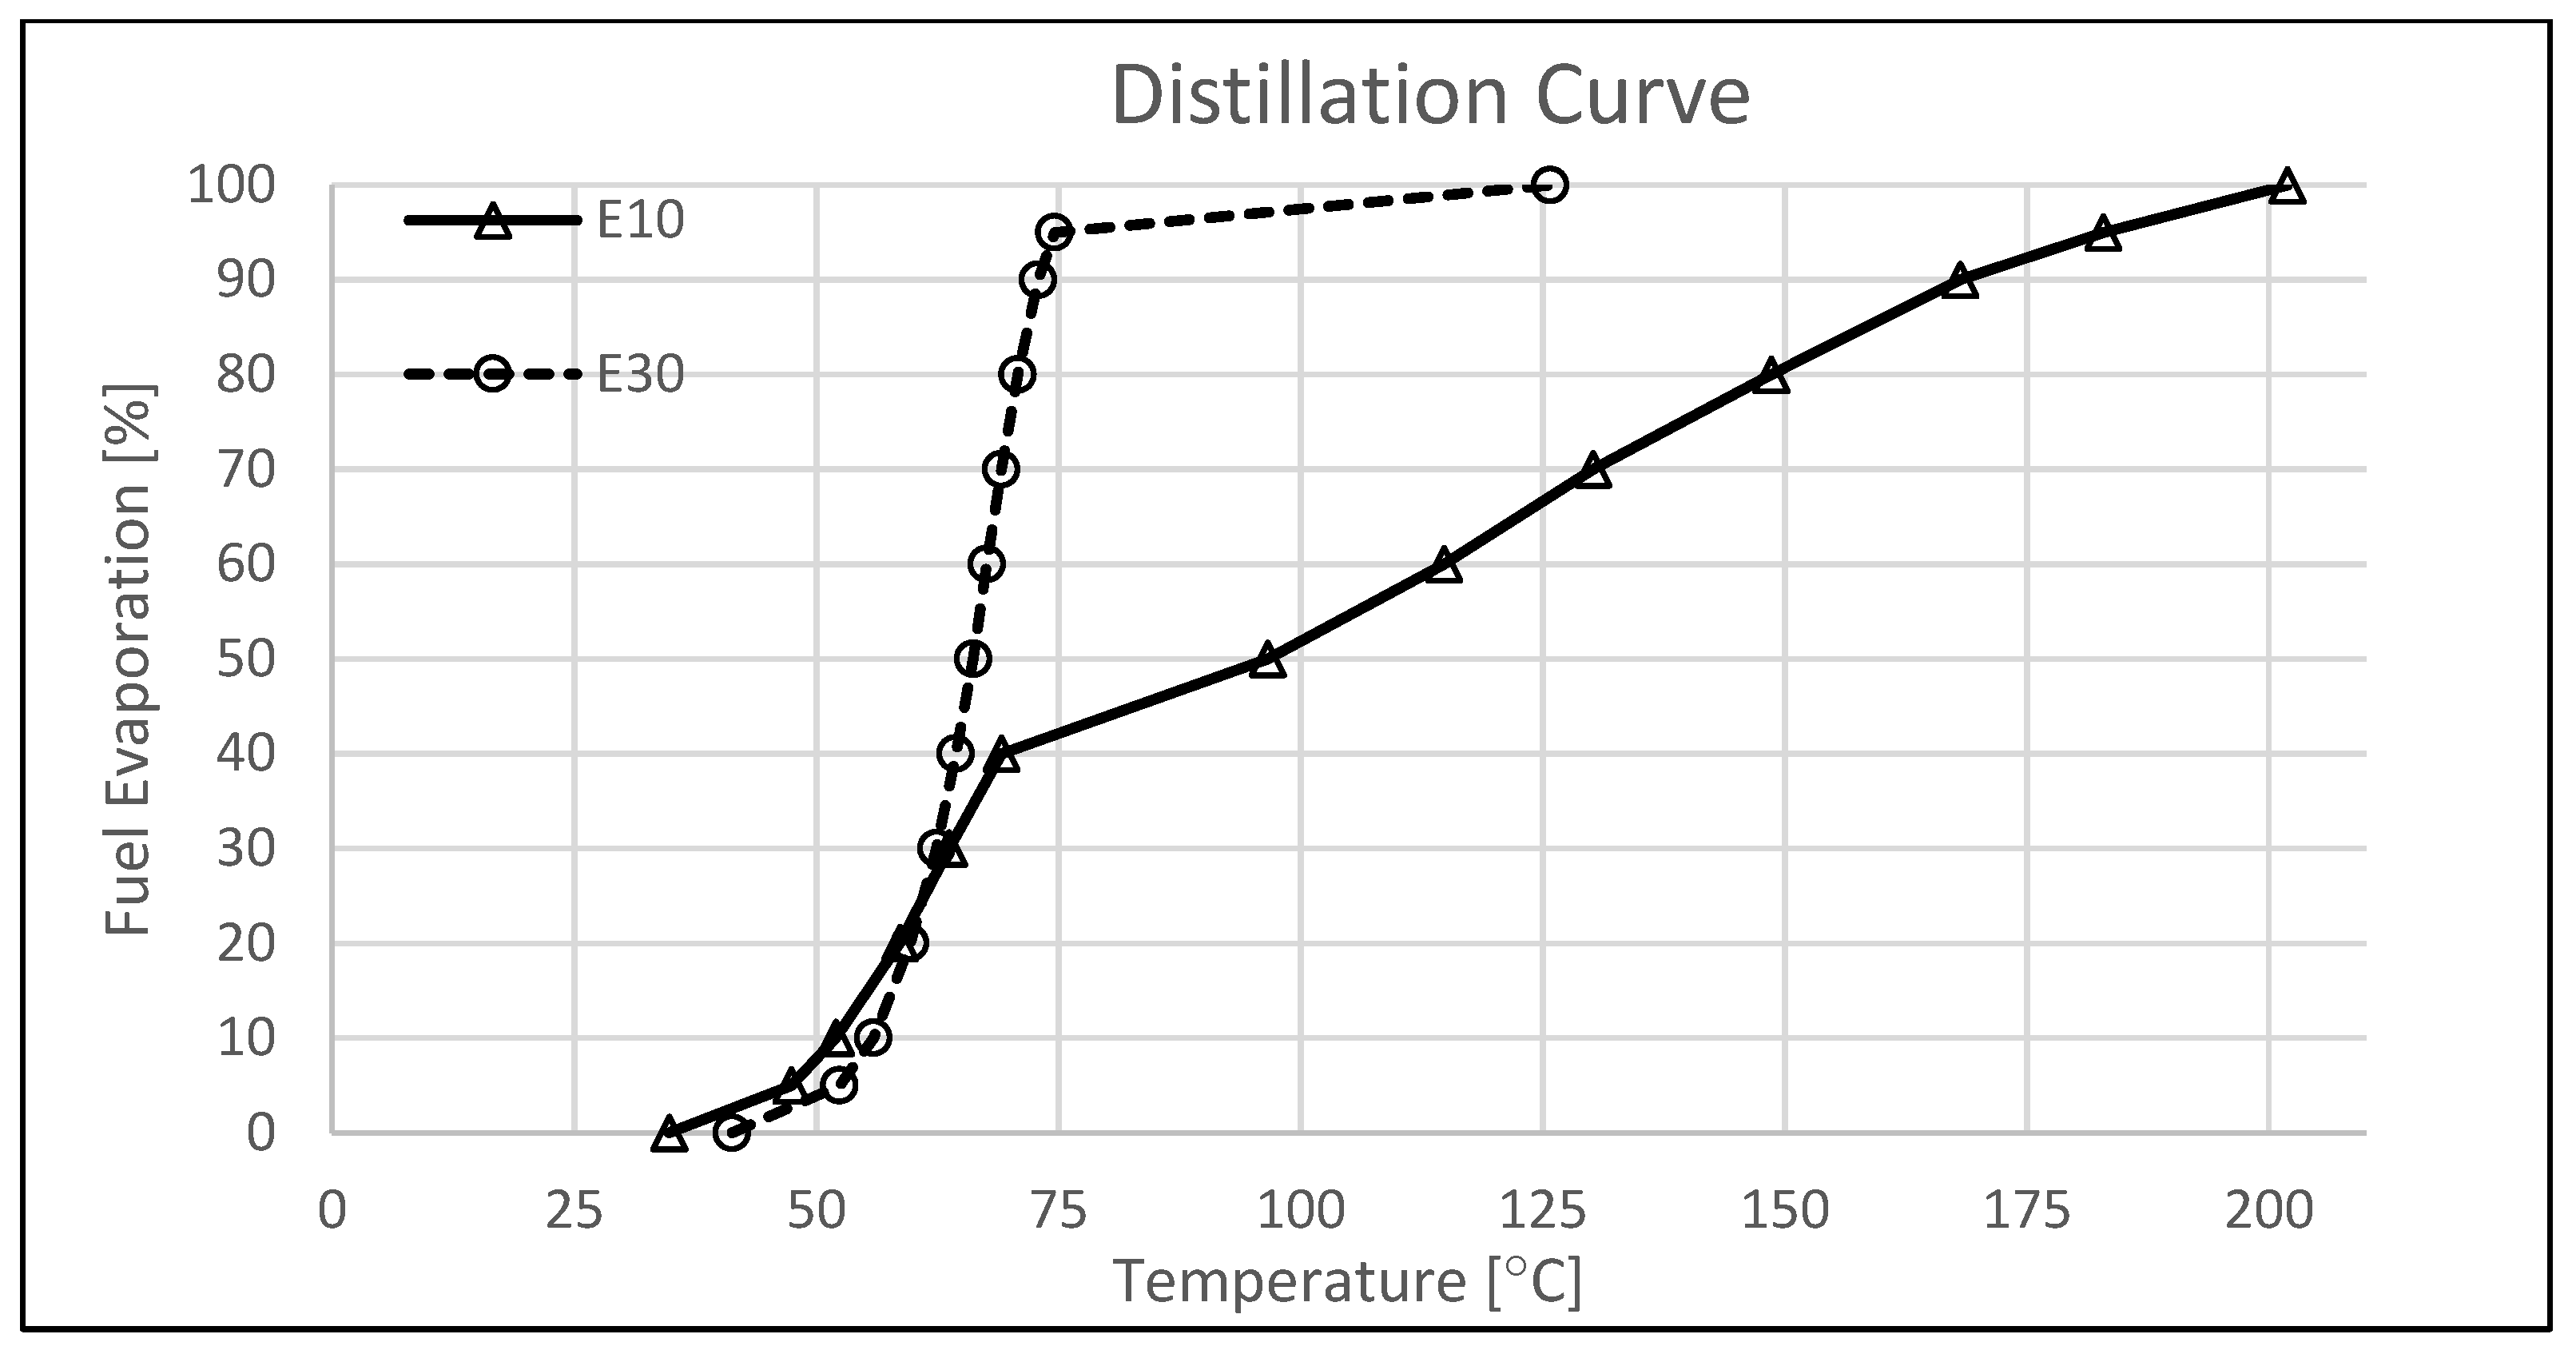
Due to the different chemical compositions of E10 and E30 (as shown in Table 3), the distillation curves (Figure 2) of the two fuels are significantly different. The initial boiling point of E10 is lower than that of E30, and at approximately 55 °C, a greater percentage of E10 evaporates than E30. As the temperature increases, the evaporation of E30 shows a higher rate. More than 95% is evaporated at 75 °C compared to E10’s evaporation percentage of approximately 42% at the same temperature. The final boiling point of E30 is much lower than that of E10, (125.8 °C and 201.9 °C, respectively). The good evaporation quality of E30 at lower temperatures could improve the fuel atomization and mixture formation, which could lead to more complete combustion.

3. Results

The engine was tested in steady-state conditions throughout a wide operating range between 1000 and 6000 rpm, between loads of 1 bar BMEP and full load BMEP (20.3 bar). Temperatures and pressures were measured at different engine points, including the exhaust gas temperature upstream of the turbocharger (EGT), between the turbocharger and the catalytic converter and downstream of the catalytic converter. Instantaneous fuel consumption was measured by a combination of a mass flow sensor and a fuel density sensor with a 10 Hz frequency, and the average value over a 30-s measurement period was taken in kg/h and l/h units (measurement uncertainty: 0.1% of measured value +0.002 kg/h). Engine torque was continuously recorded with an HBM T12HP torque flange, and engine power was calculated using the torque value and engine speed.
P = M · ω
Brake-specific fuel consumption (BSFC) and brake thermal efficiency were calculated during the steady-state measurement and saved with the rest of the measured and calculated values.
The operating points at 2500 rpm between 2 bar BMEP and full load (20.3 bar BMEP) were chosen for detailed examination because, at this engine speed, the engine displayed the most efficient operating point for both test fuels (see with red line in Figure 3).

3.1. Fuel Consumption

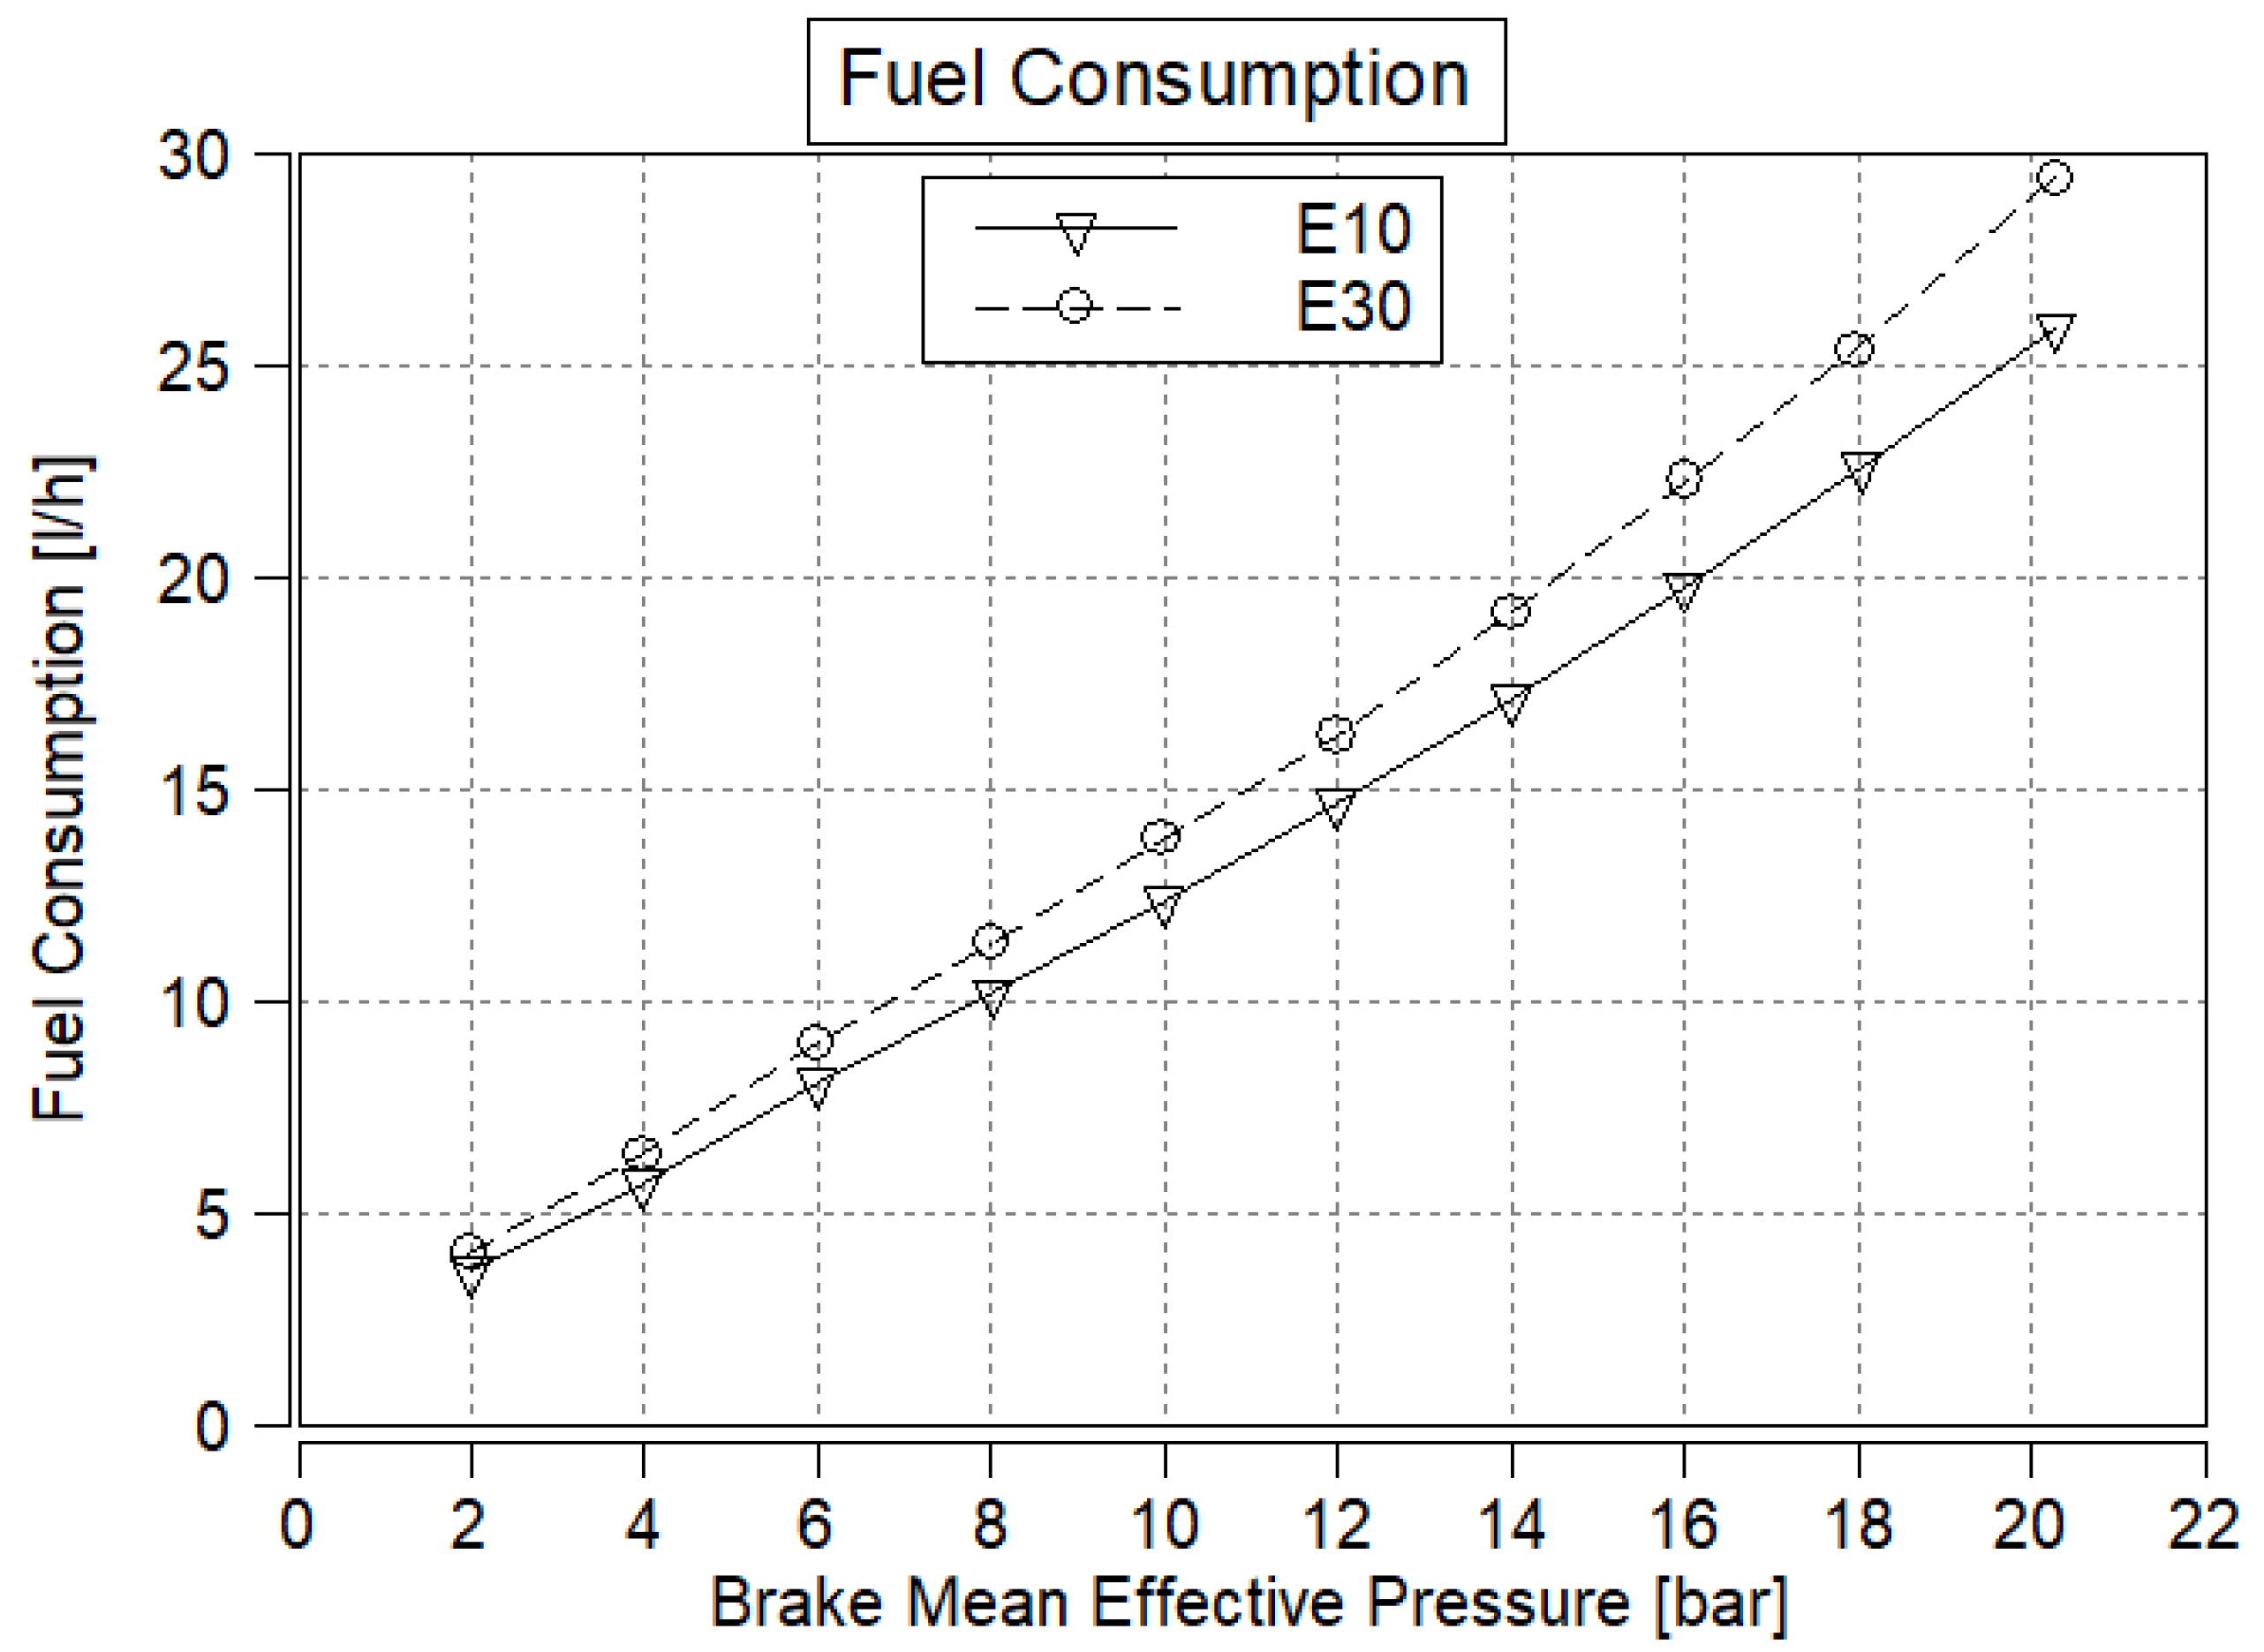
The volumetric fuel consumption measured in l/h was compared between E10 and E30 at 2500 rpm, starting from 2 bar BMEP, with 2 bar increments up to 18 bar BMEP and 20.3 bar BMEP (visualized in Figure 4). The volumetric fuel consumption of the high ethanol content fuel was always higher than that of the reference fuel by about 11.73%. This could be partly explained by the lower density and energy content of this fuel, but other factors may also exist. The volumetric energy densities of E10 and E30 are 31.68 MJ/l and 29.07 MJ/l, which means that the volumetric energy density of E30 is approximately 9% lower than that of E10. A stoichiometric air–fuel ratio was maintained at all operating points investigated.

3.2. Brake-Specific Fuel Consumption

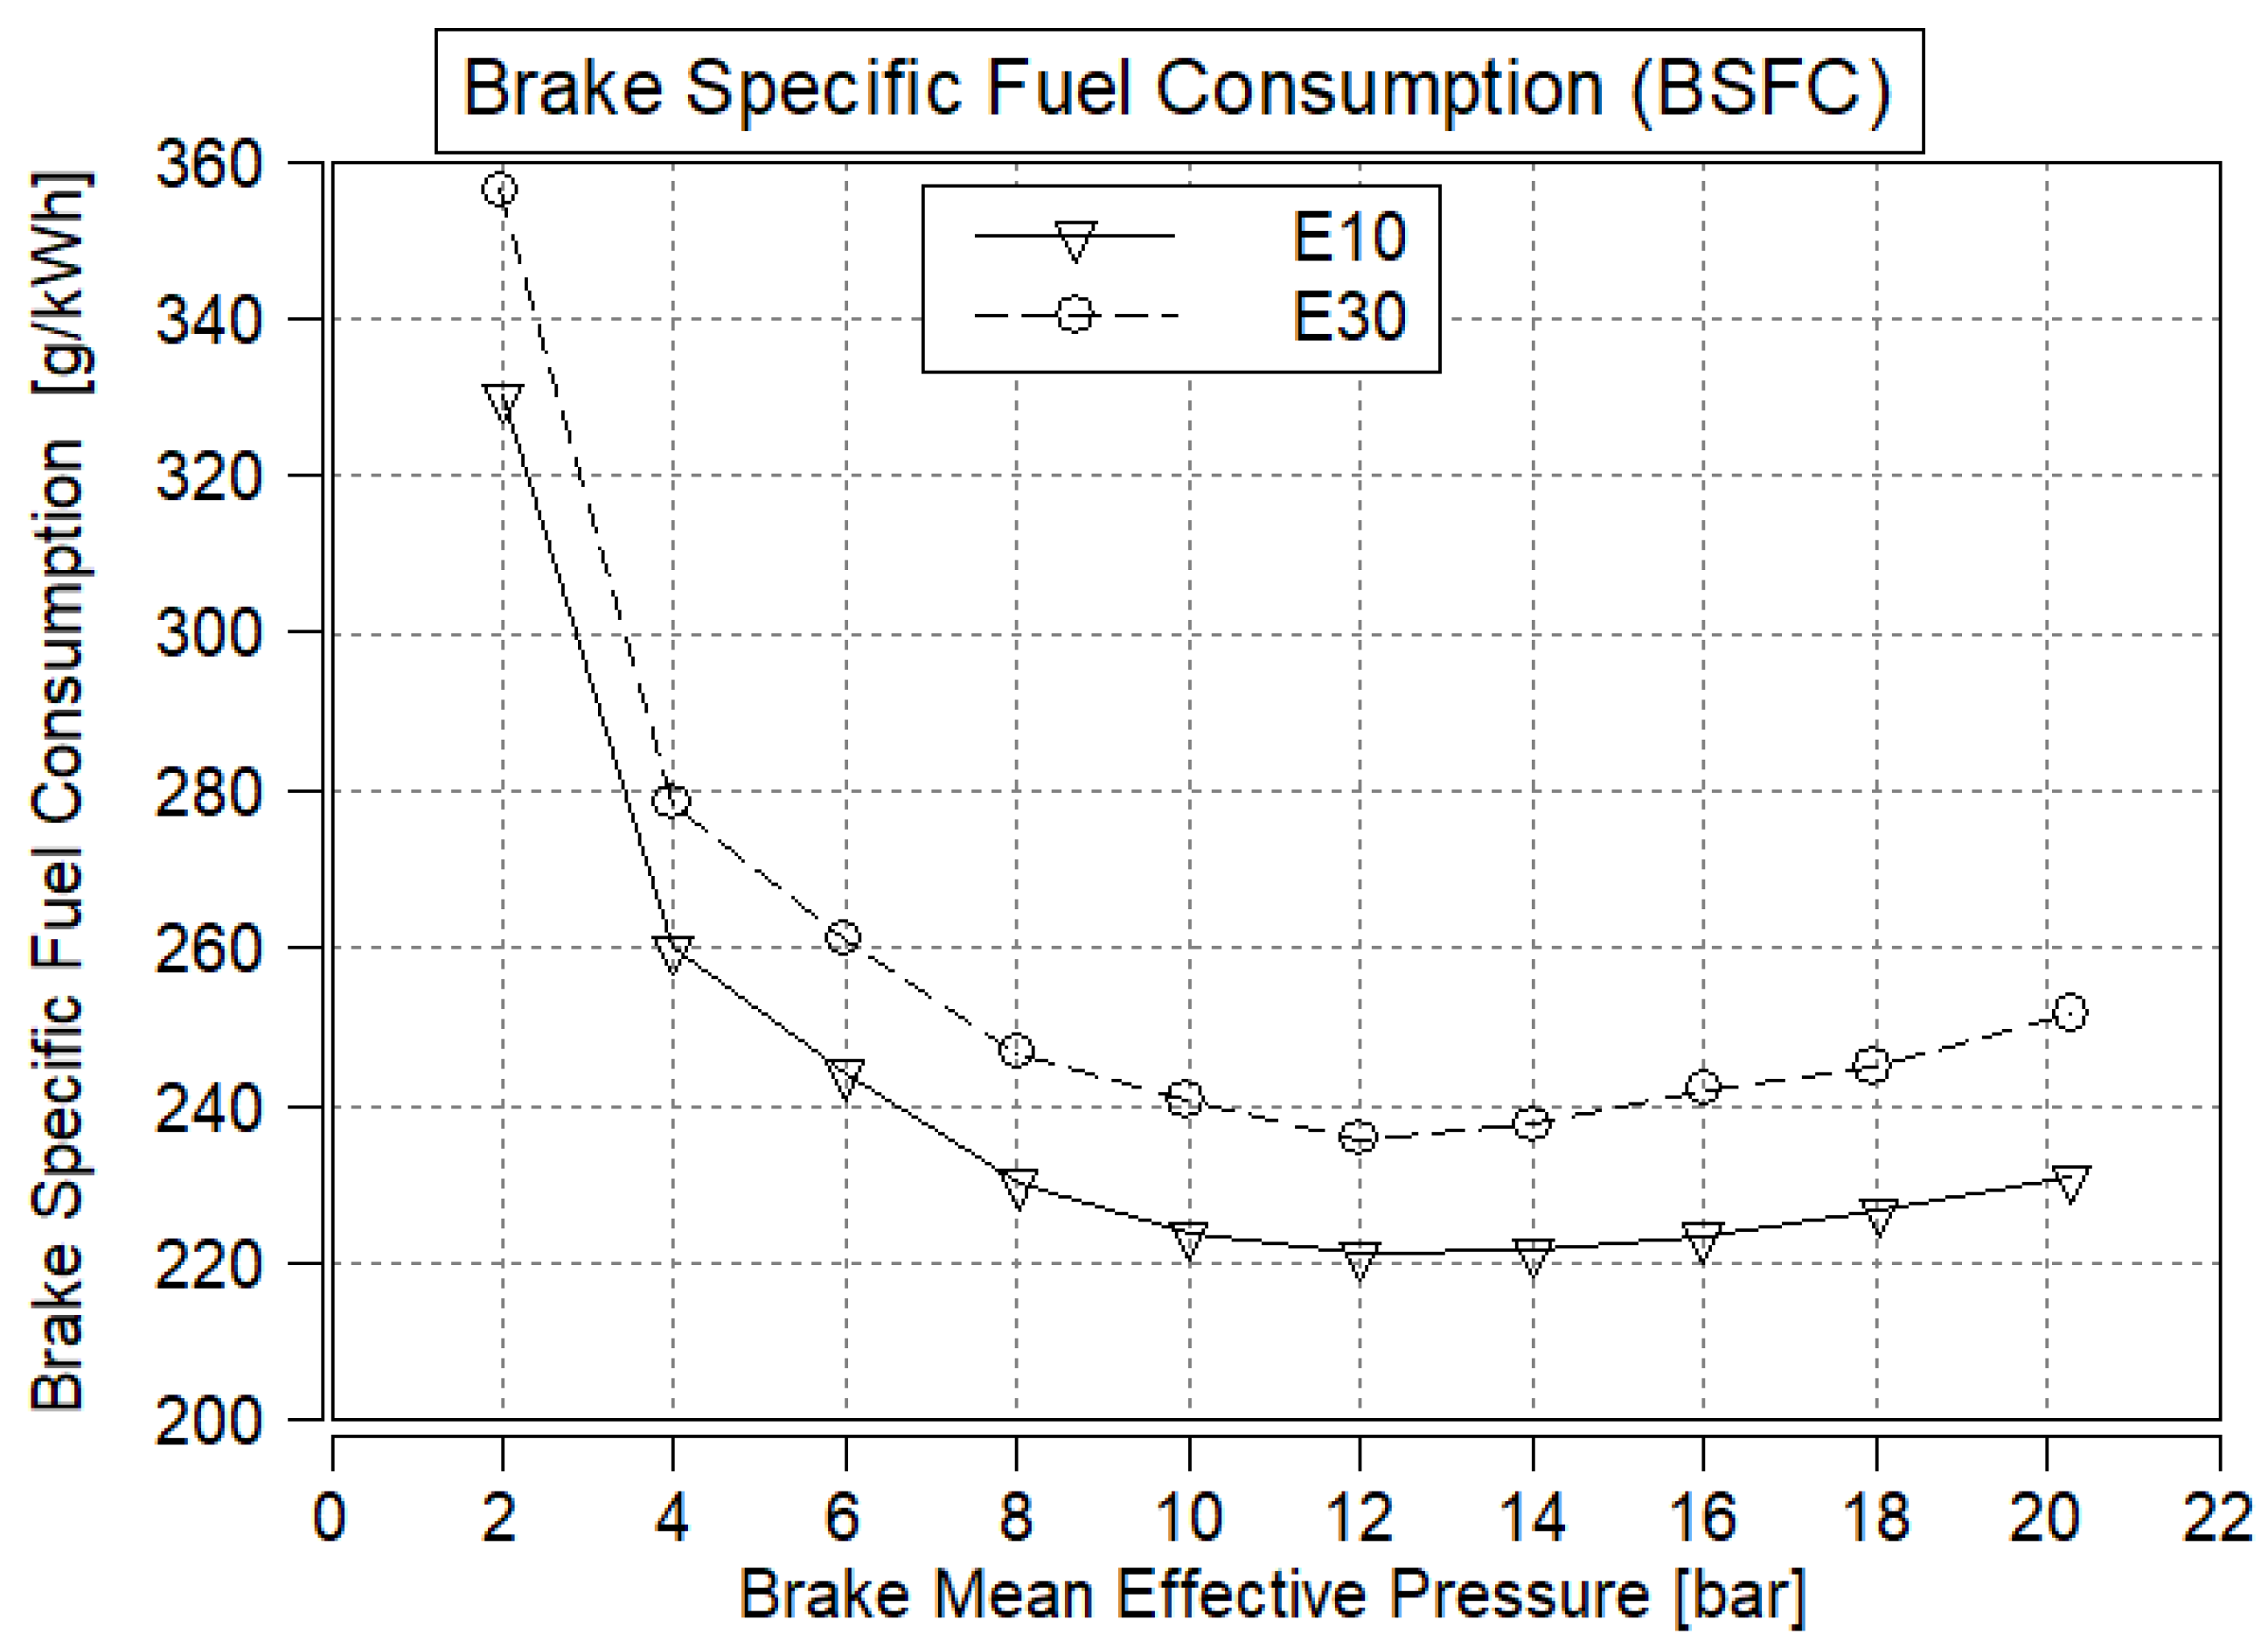
Brake-specific fuel consumption provides a better comparison between E10 and E30 as it excludes the difference in density of the tested fuel blends (as shown in Figure 5). For both fuel blends, BSFC improved as BMEP increases, until 12 bar. At 12 bar BMEP, E10 and E30 produced the lowest BSFC of 221 g/kWh and 235.7 g/kWh, respectively, demonstrating a 6.6% higher value for E30 at 12 bar BMEP; on average, E30 had 7.5% higher BSFC overall. For fuels above 12 bar BMEP, the BSFC increased slightly. This is due to the ignition retard required to avoid severe knock. Up to 12 bar BMEP, it was possible to advance the ignition timing until the best possible BSFC was reached. The best BSFC operating point was reached when 50% of the fuel was burned (MFB50) at around 6–8 CA° aTDC. As the engine load increased above 12 bar BMEP, the ignition timing was limited by knocking combustion. Knocking started to occur at around the same engine load for E10 and E30, due to their similar RON and especially MON ratings, but it impacted E30 more severely because, due to the lower energy density of E30, a larger mass had to be introduced into the combustion chamber. The higher charge mass and pressure create higher pressure inside the combustion chamber by the start of the combustion process, and increase the risk of knock.
The findings confirm that using E30 leads to a consistent increase in volumetric fuel consumption and BSFC compared to E10 across all tested operating points. Specifically, E30 exhibited an average of 7.5% higher BSFC, with the difference peaking at 6.6% at the most efficient operating point (12 bar BMEP, 2500 rpm). This outcome aligns with the established understanding that ethanol’s lower heating value (LHV) necessitates a greater fuel mass to deliver equivalent power output, as reported in multiple prior studies [1,3,5,10]. The observed increase in volumetric fuel consumption (approximately 11.7%) also closely matches the difference in volumetric energy density between the blends (with E30 being about 9% lower than E10), reinforcing the direct relationship between fuel energy content and consumption.

3.3. Brake Thermal Efficiency

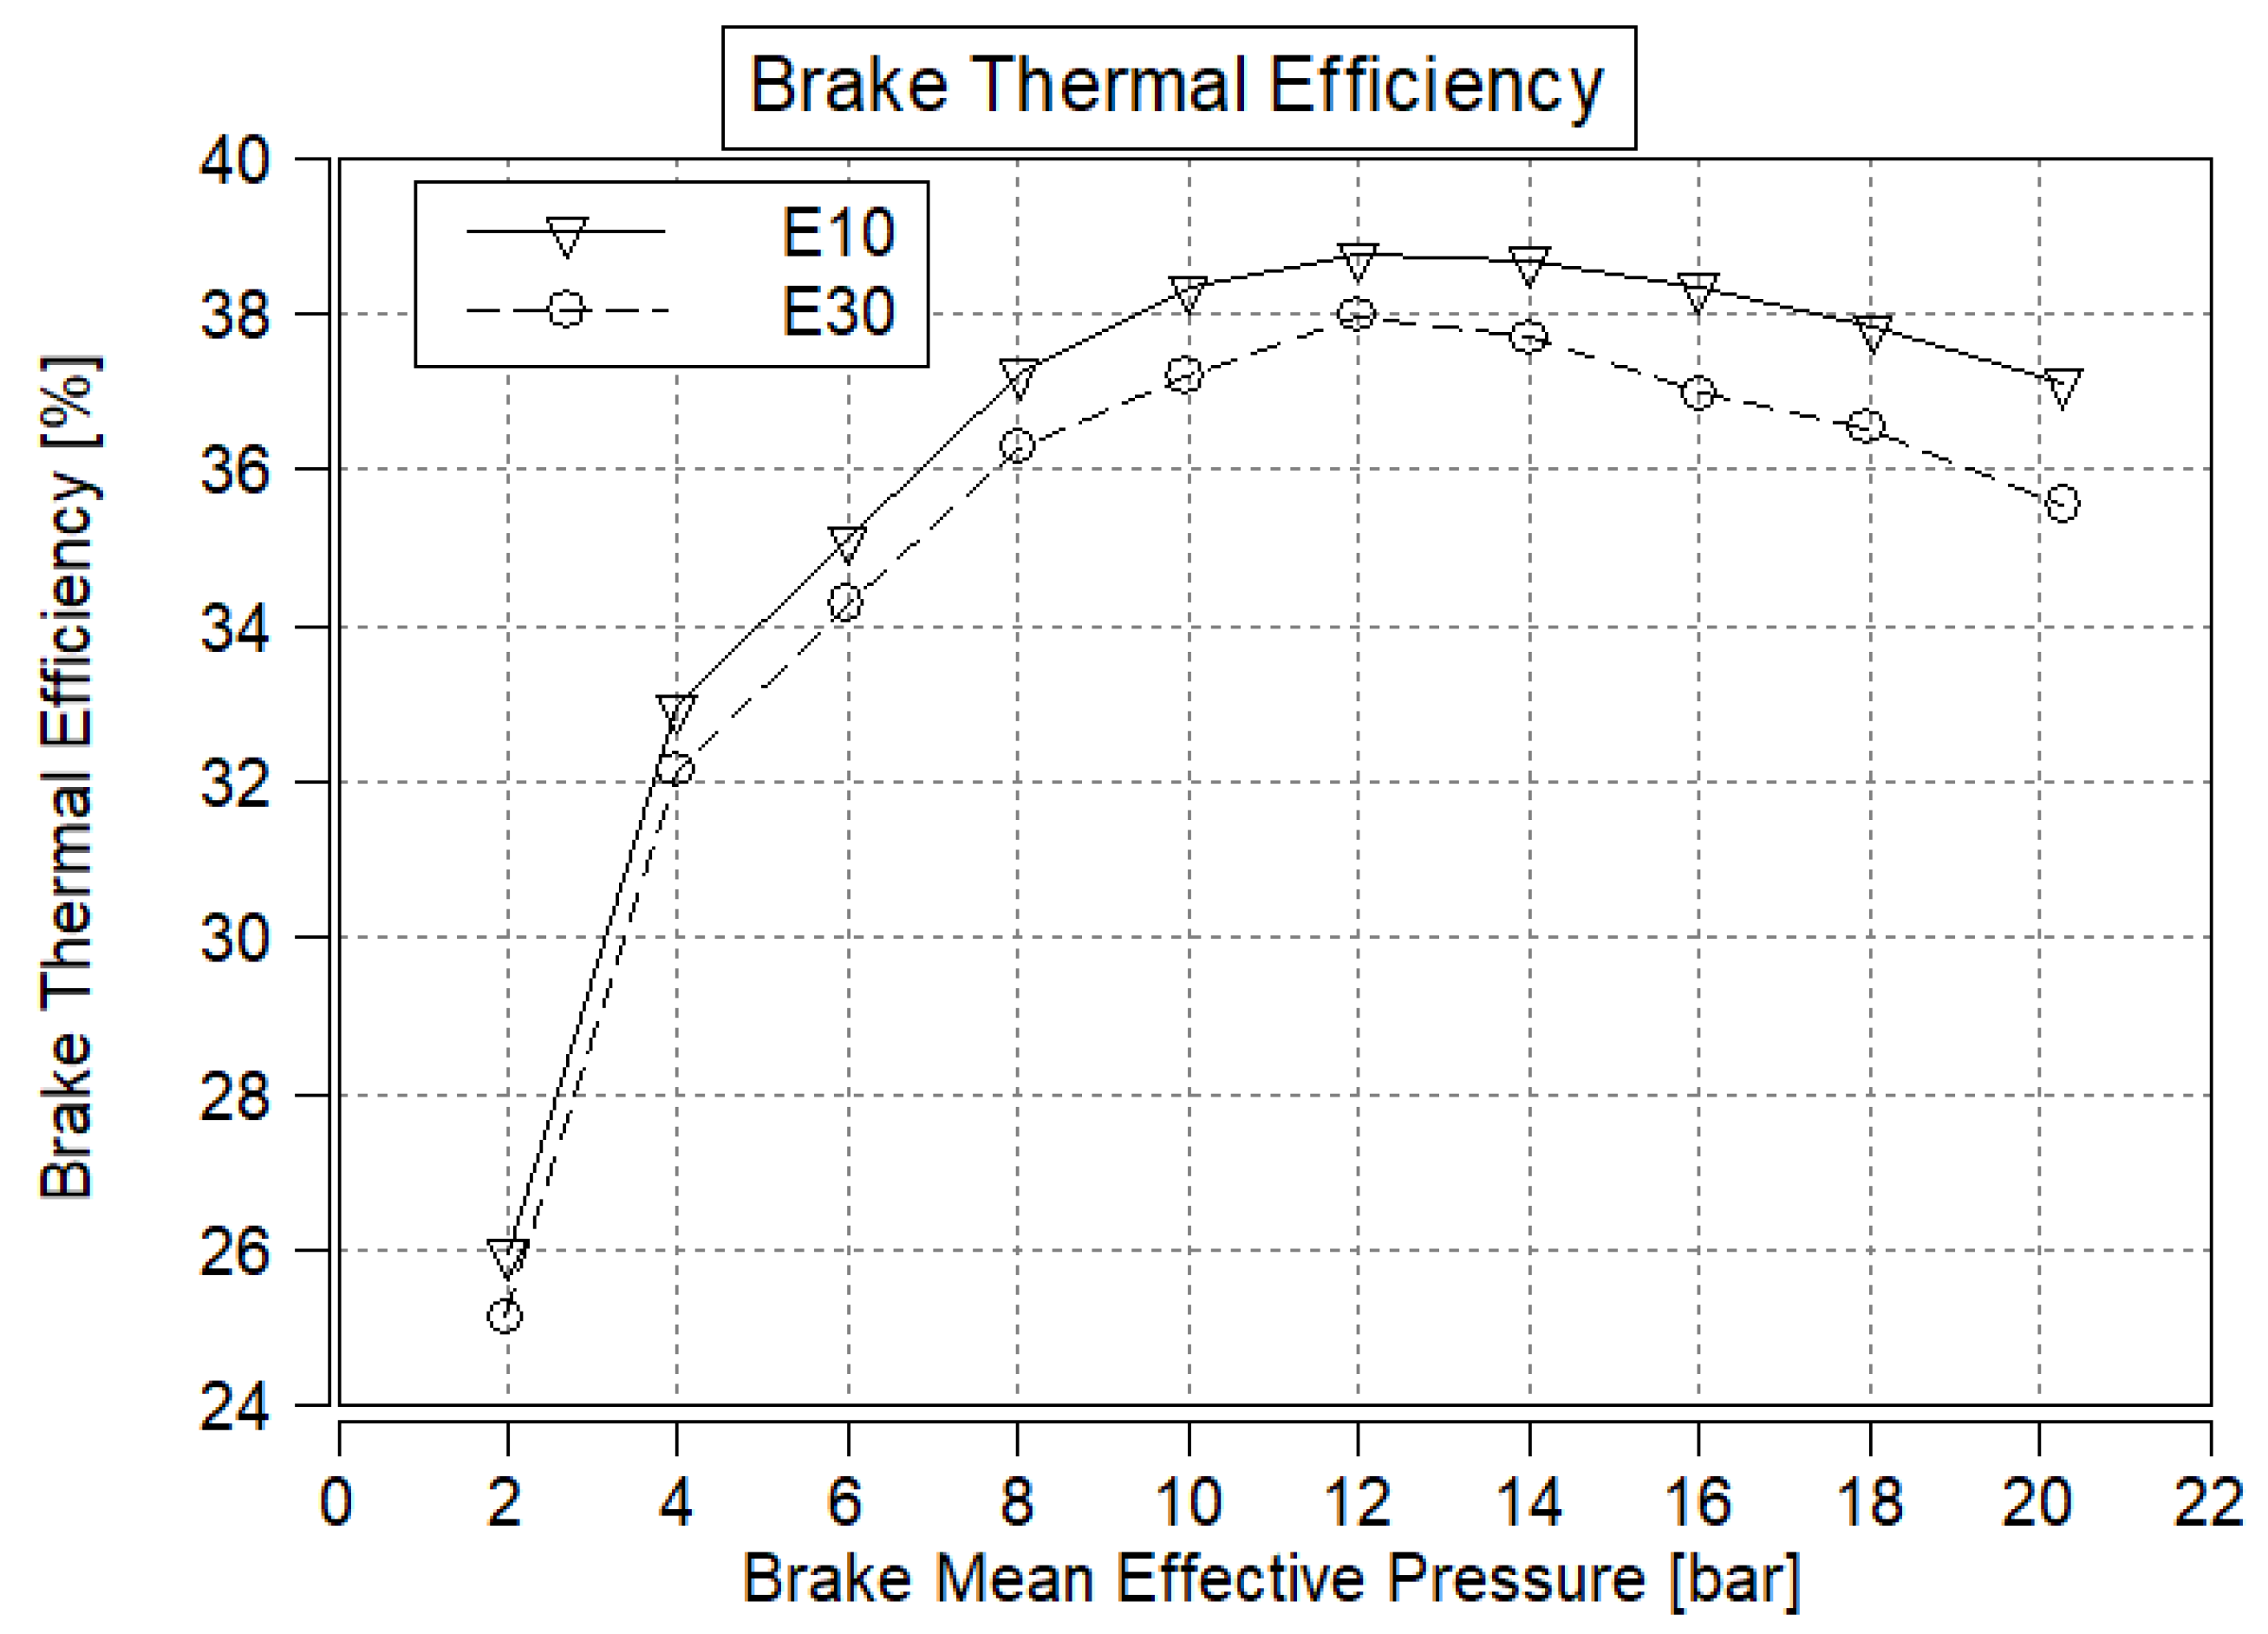
Brake-specific fuel consumption does not consider the difference in the lower heating value of different fuel blends. The ratio between the total energy input and total energy output is required to approximate the energy conversion efficiency in the engine. Brake thermal efficiency measures how efficiently the fuel’s chemical energy is converted into useful work. Brake thermal efficiency increases with engine load until 12 bar BMEP and reaches peaks of 38.75% for E10 and 37.97% for E30 (see in Figure 6). At the peak thermal efficiency operating point, E30 is 0.78% less efficient compared to E10 and, on average, E30 is 1.06% less efficient at 2500 rpm. The highest absolute efficiency difference is 1.56% at full load (20.3 bar BMEP). This difference in efficiency is not attributed to the different density or lower heating values, as these were all considered during the calculation of brake thermal efficiency. Brake thermal efficiency declines above 12 bar BMEP because ignition timing has to be retarded to avoid knocking combustion.
Contrary to some literature that suggests higher ethanol content can improve BTE due to increased octane rating, oxygen content and latent heat of vaporization [3,10,19], this study found that E30 resulted in slightly lower BTE than E10 at all operating points. The maximum observed BTE for E30 was 37.97%, compared to 38.75% for E10—an absolute difference of 0.78% at peak efficiency, and up to 1.56% at full load. This outcome directly supports the working hypothesis: since the octane numbers (RON and MON) of the E30 blend were matched to those of E10, the engine could not accomplish ethanol’s higher knock resistance to advance ignition timing or increase compression ratio. At loads above 12 bar BMEP, E30 suffered from more severe knock than E10, despite their similar octane numbers, because a larger charge mass was needed from E30 to achieve the same power output. As a result, the potential thermodynamic efficiency gains typically associated with higher ethanol blends were not realized. This finding highlights a critical nuance: ethanol’s efficiency benefits depend on its elemental properties and the extent to which engine calibration and fuel formulation allow those properties to be leveraged [11,23].

3.4. Mass Fraction Burned 50%

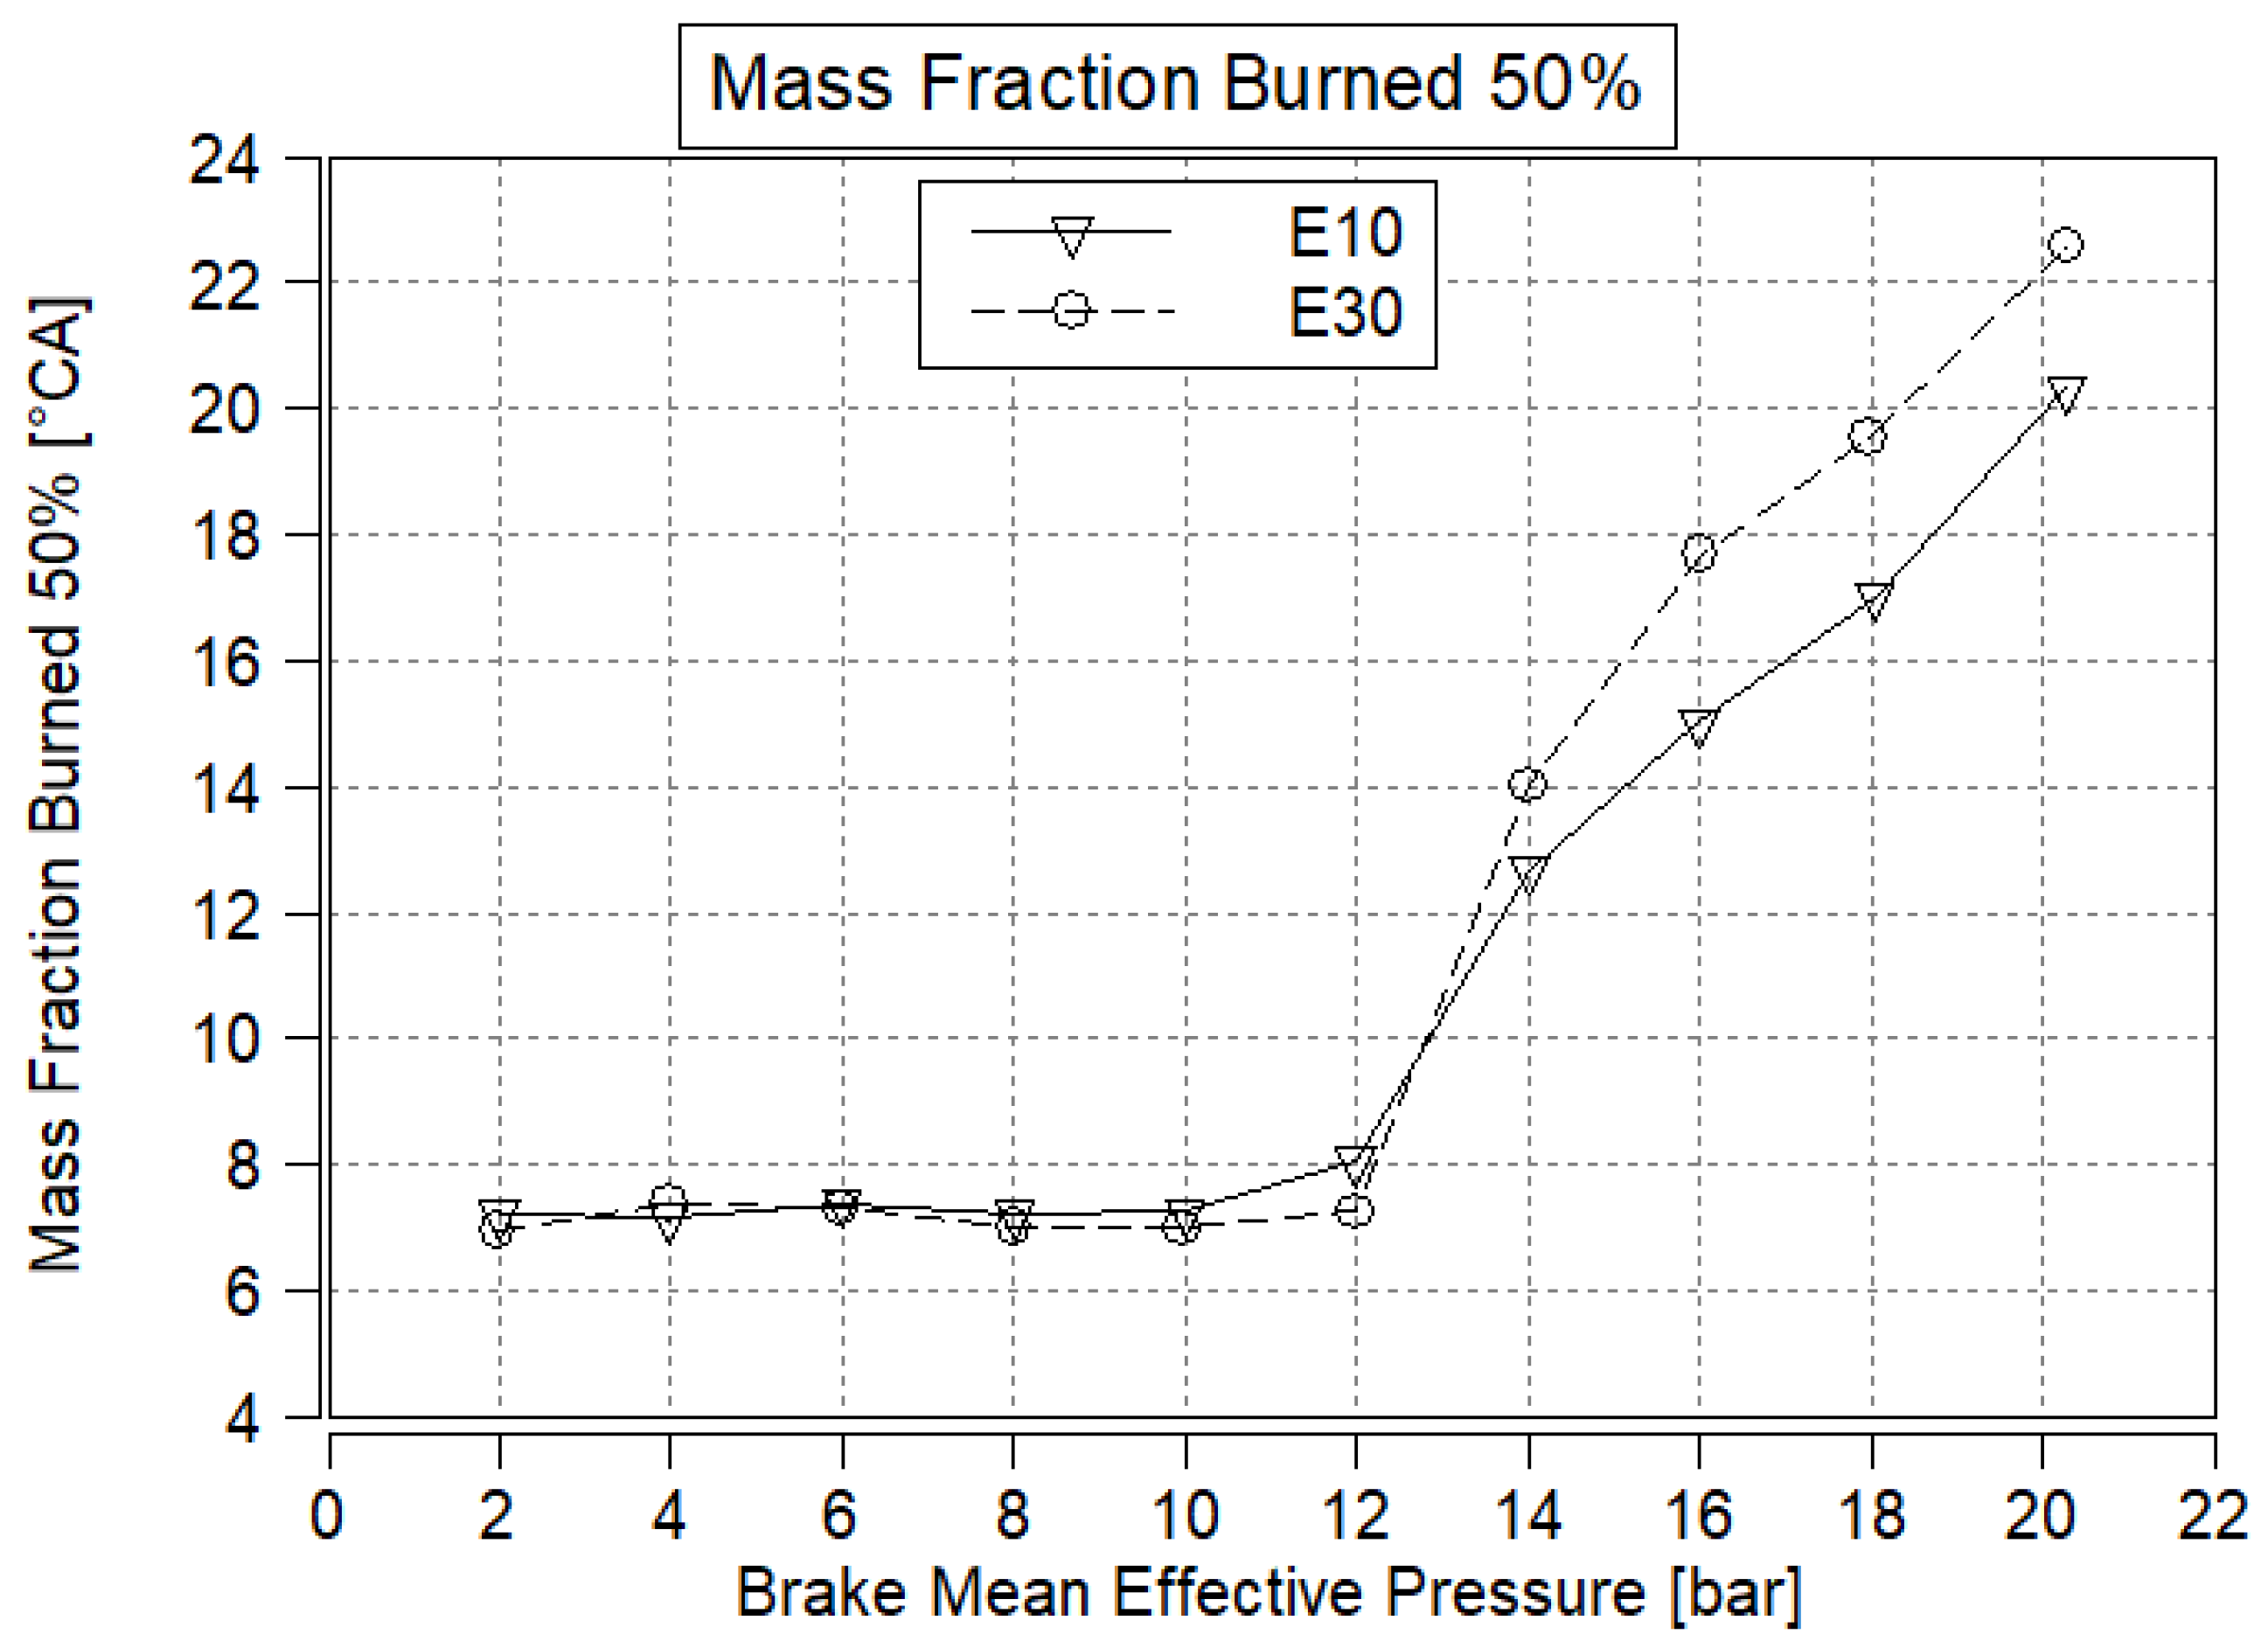
Figure 7 shows the crank angle degree aTDC when 50% of the fuel mass is burned (MFB50) relative to engine load (BMEP) at 2500 rpm engine speed. At low engine loads, the ideal MFB50 of 6–8 CA° aTDC was achievable when neither knock, exhaust gas temperature, nor cylinder pressure were limiting factors. As the engine load increased above 12 bar BMEP, maintaining MFB50 within the 6–8 CA° aTDC range was no longer possible. The combustion process had to be retarded to avoid knocking. The MFB50 was further retarded as engine load increased, which led to lower brake thermal efficiency. Even though knock started to influence the combustion of both fuels above 12 bar BMEP, E30 suffered more from knock. Due to the lower energy density of E30, more fuel and air were required to create the same power output. This could only be achieved by increasing the charge pressure and mass compared to E10. By the end of the compression stroke (start of combustion), the higher initial pressure and charge mass created higher pressure and temperature inside the combustion chamber, increasing the risk of knock. Because of this, the tested E30 is more prone to knock at the same load compared to E10, and this is one of the main reasons why the efficiency deficit of E30 increases above 12 bar BMEP.
Both fuel blends reached their optimal combustion phasing (MFB50 at 6–8 CA° aTDC) up to 12 bar BMEP, beyond which ignition timing had to be retarded to avoid knocking. The onset of knock occurred at similar loads for both fuels, as expected from their close octane ratings, but E30 required more ignition retard due to its lower RON. This further supports the interpretation that the knock resistance advantage of ethanol was neutralized by the fuel formulation, preventing any efficiency gain from more advanced combustion phasing.

3.5. Flame Development

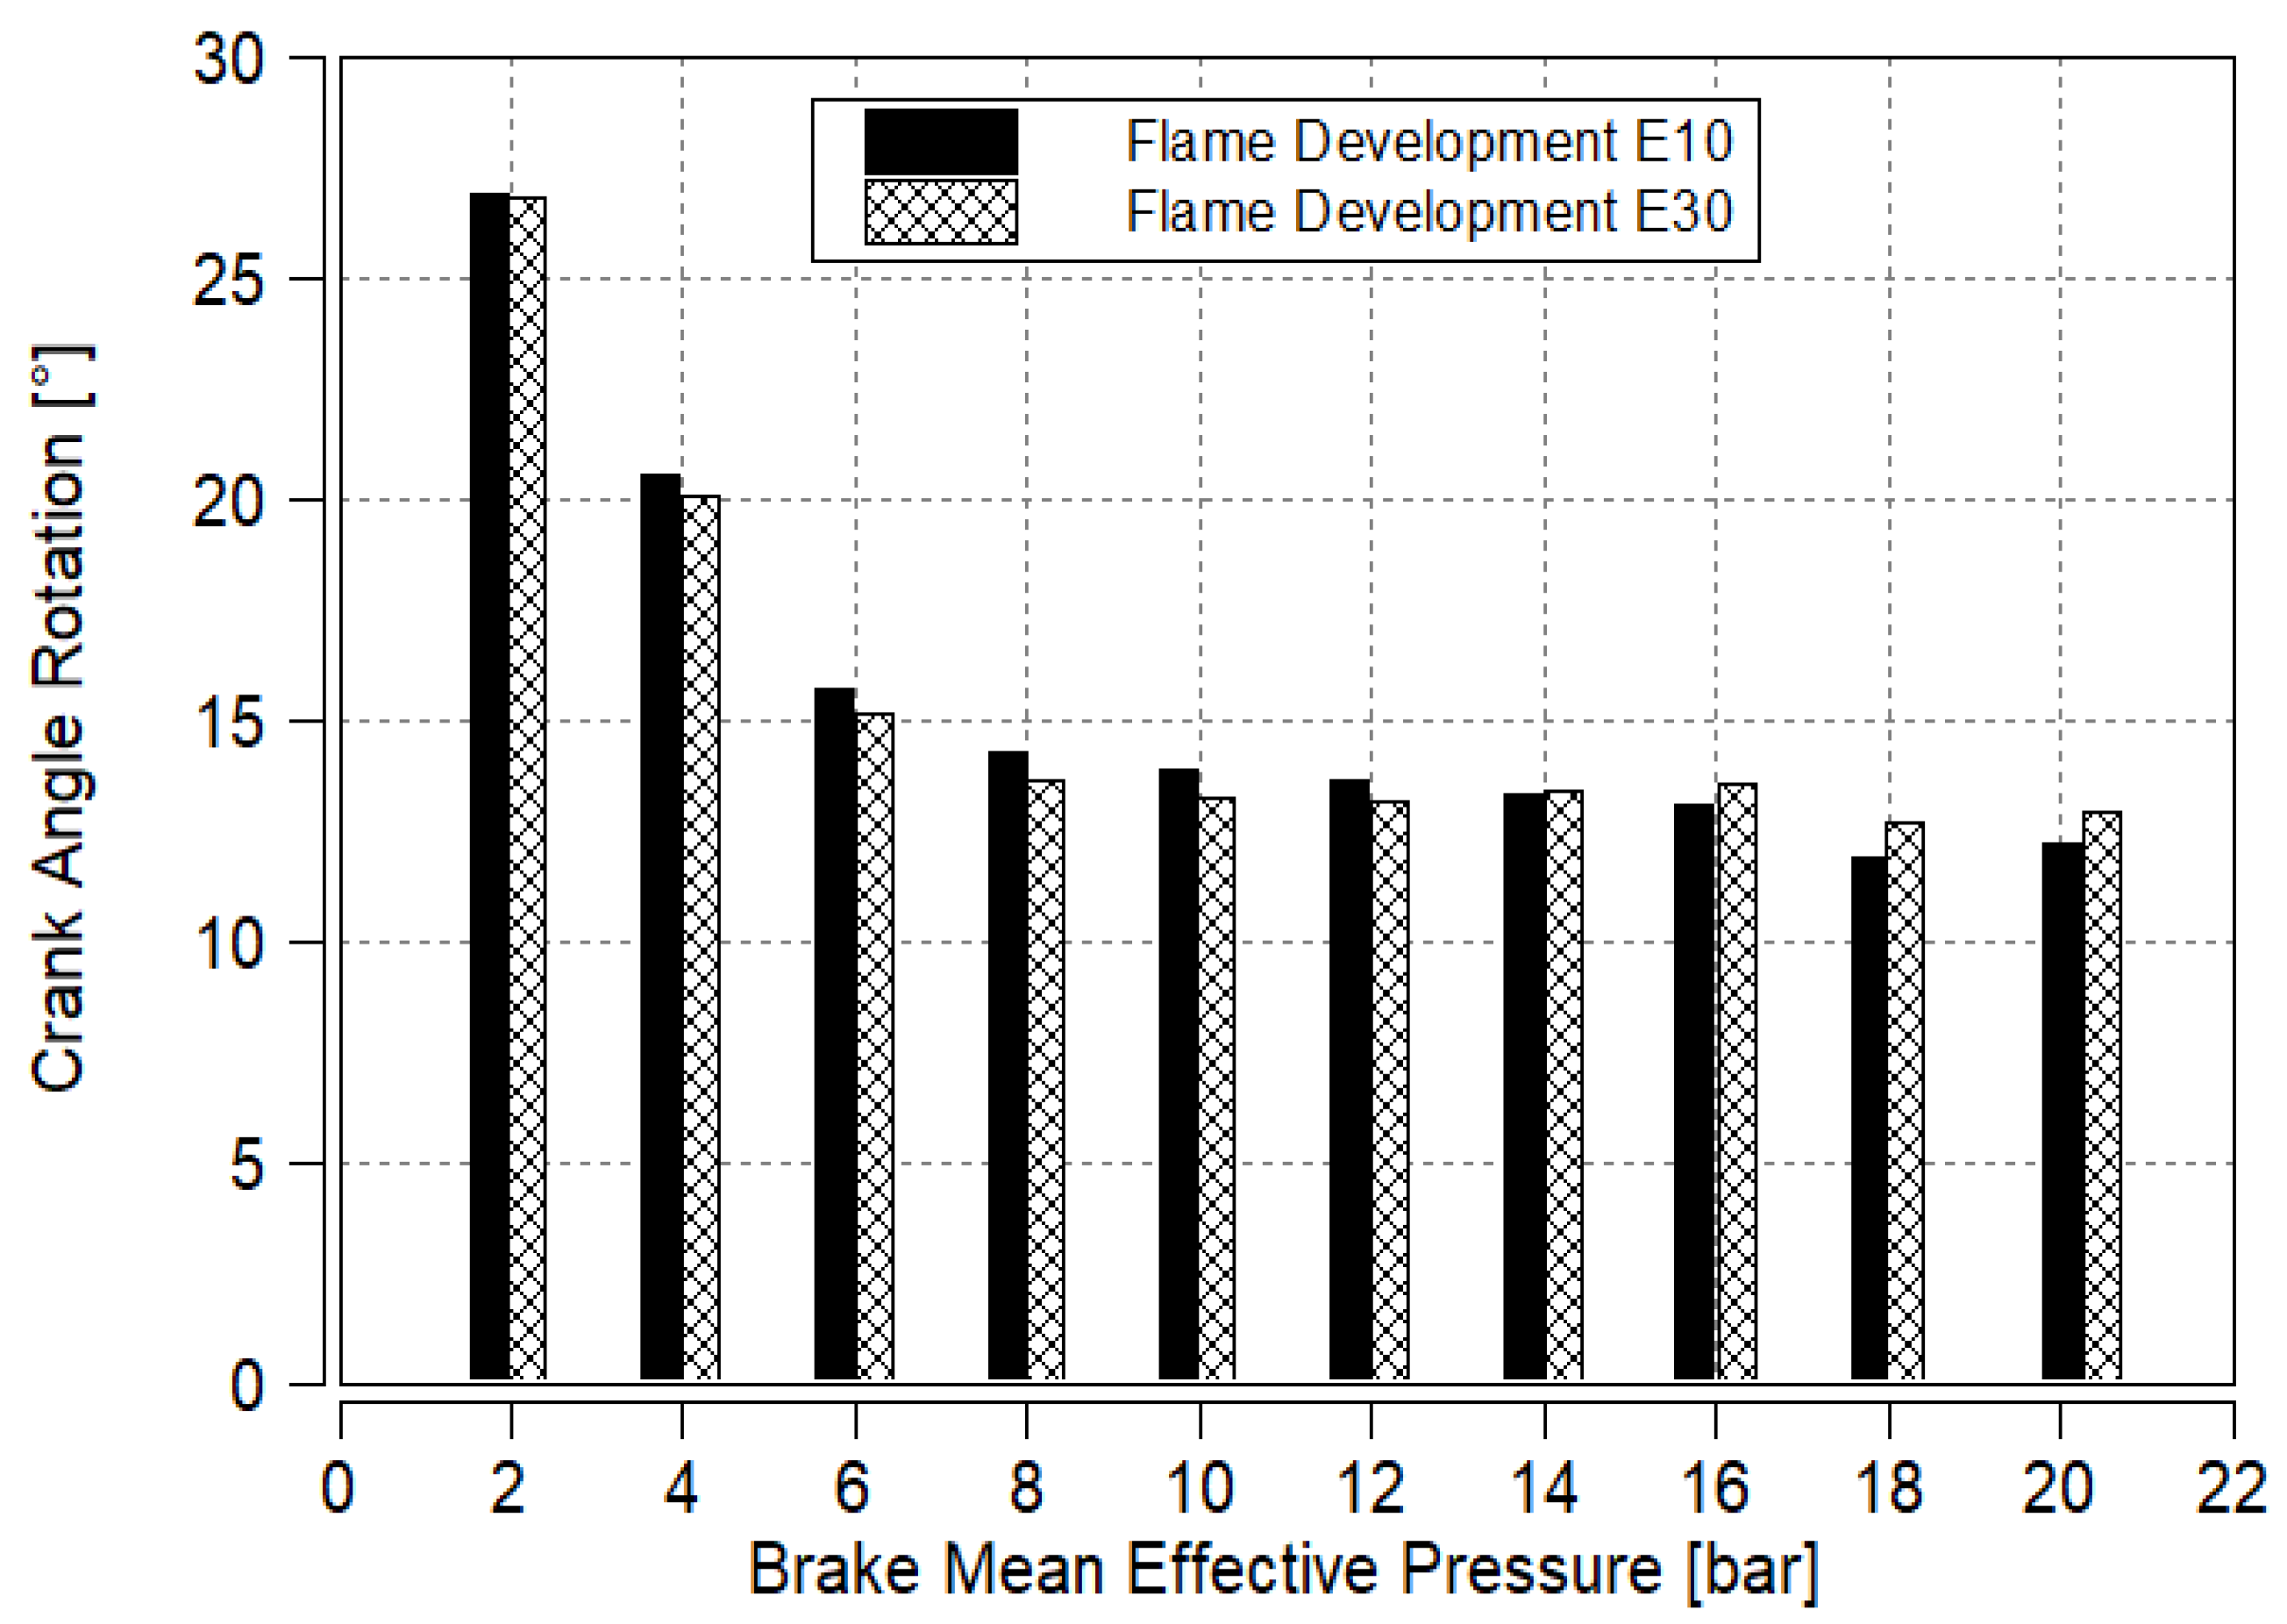
Flame development refers to the crankshaft rotation between ignition and MFB10. Figure 8 shows the average flame development over 200 cycles of E10 and E30 relative to engine load (BMEP) at 2500 rpm engine speed.
The required crankshaft rotation for flame development generally decreases with engine load for both fuel types. Up to 12 bar BMEP, E30 has an average 3.1% shorter flame development phase than E10, but as the load increases above 12 bar BMEP, E30 has, on average, 4.33% longer flame development. The optimal ignition angle for a BMEP above 12 bar was impossible due to severe knock; therefore, the flame development and combustion process started later. This affected E30 more severely as it required more ignition retard than E10 (see MFB50).
Under identical combustion timing (where MFB50 does not differ more than 1 CA°), E30 flame development is faster because the shorter ethanol molecule lengths and the hydroxyl group of ethanol make it easier for reactions to start [32]. However, as the load increases and knock occurs, the additional ignition retard required for E30 negates this benefit, and the flame development of E10 becomes faster.

3.6. Rapid Burning Phase

The rapid burning phase refers to the crankshaft rotation between MFB10 and MFB90, during which the majority of the usable heat release occurs. Figure 9 shows the average rapid burning phase over 200 cycles of E10 and E30 relative to engine load (BMEP) at 2500 rpm engine speed.
The rapid burning phase of E30 is, on average, 2.3% shorter at loads below 18 bar BMEP, except for 12 bar BMEP. This advantage could be attributed to ethanol’s higher flame speed [7,8,31]. At 18 bar BMEP and above, the E30 rapid burning phase is slightly longer (1.7%) because of the different combustion timing due to knock. However, the first half of the rapid burning phase (from MFB10 to MFB50) is always shorter for E30, thus creating a faster heat release at the beginning of the combustion process.

3.7. Peak Combustion Pressure

Peak combustion pressure was measured and averaged over 200 cycles, and Figure 10 shows the values for E10 and E30. Peak combustion pressure linearly increased with load until 12 bar BMEP because maintaining the ideal combustion timing was possible. Peak combustion pressure values of E10 and E30 are virtually identical at these load points, and both fuels produced the peak values at around 12 CA° aTDC. Above 12 bar, the additional ignition retard required to avoid knock shifted the combustion process later by a few degrees of crankshaft rotation, lowering the increase of peak combustion pressure for E10 and even decreasing the peak combustion pressure for E30. The difference in peak combustion pressure between E10 and E30 above 12 bar BMEP can be explained by the more retarded combustion process of E30 (as the corresponding MFB50 values suggest).
Under identical combustion circumstances, both fuels produced identical peak combustion pressures, but due to the additional ignition retard, E30 produced lower pressures above 12 bar BMEP because the combustion happens at a later crankshaft position.

3.8. Peak Combustion Temperature

Peak combustion temperature was calculated using the universal gas law (Equation (4)), where p and V are the pressure and volume of the cylinder at a given crankshaft position, R is the specific gas constant for 25 °C, 50% relative humidity air (289.33 J/kg/K) and m is the calculated mass of the charge inside the cylinder (based on intake manifold pressure, temperature and volumetric efficiency).
T = p · V m · R       ,
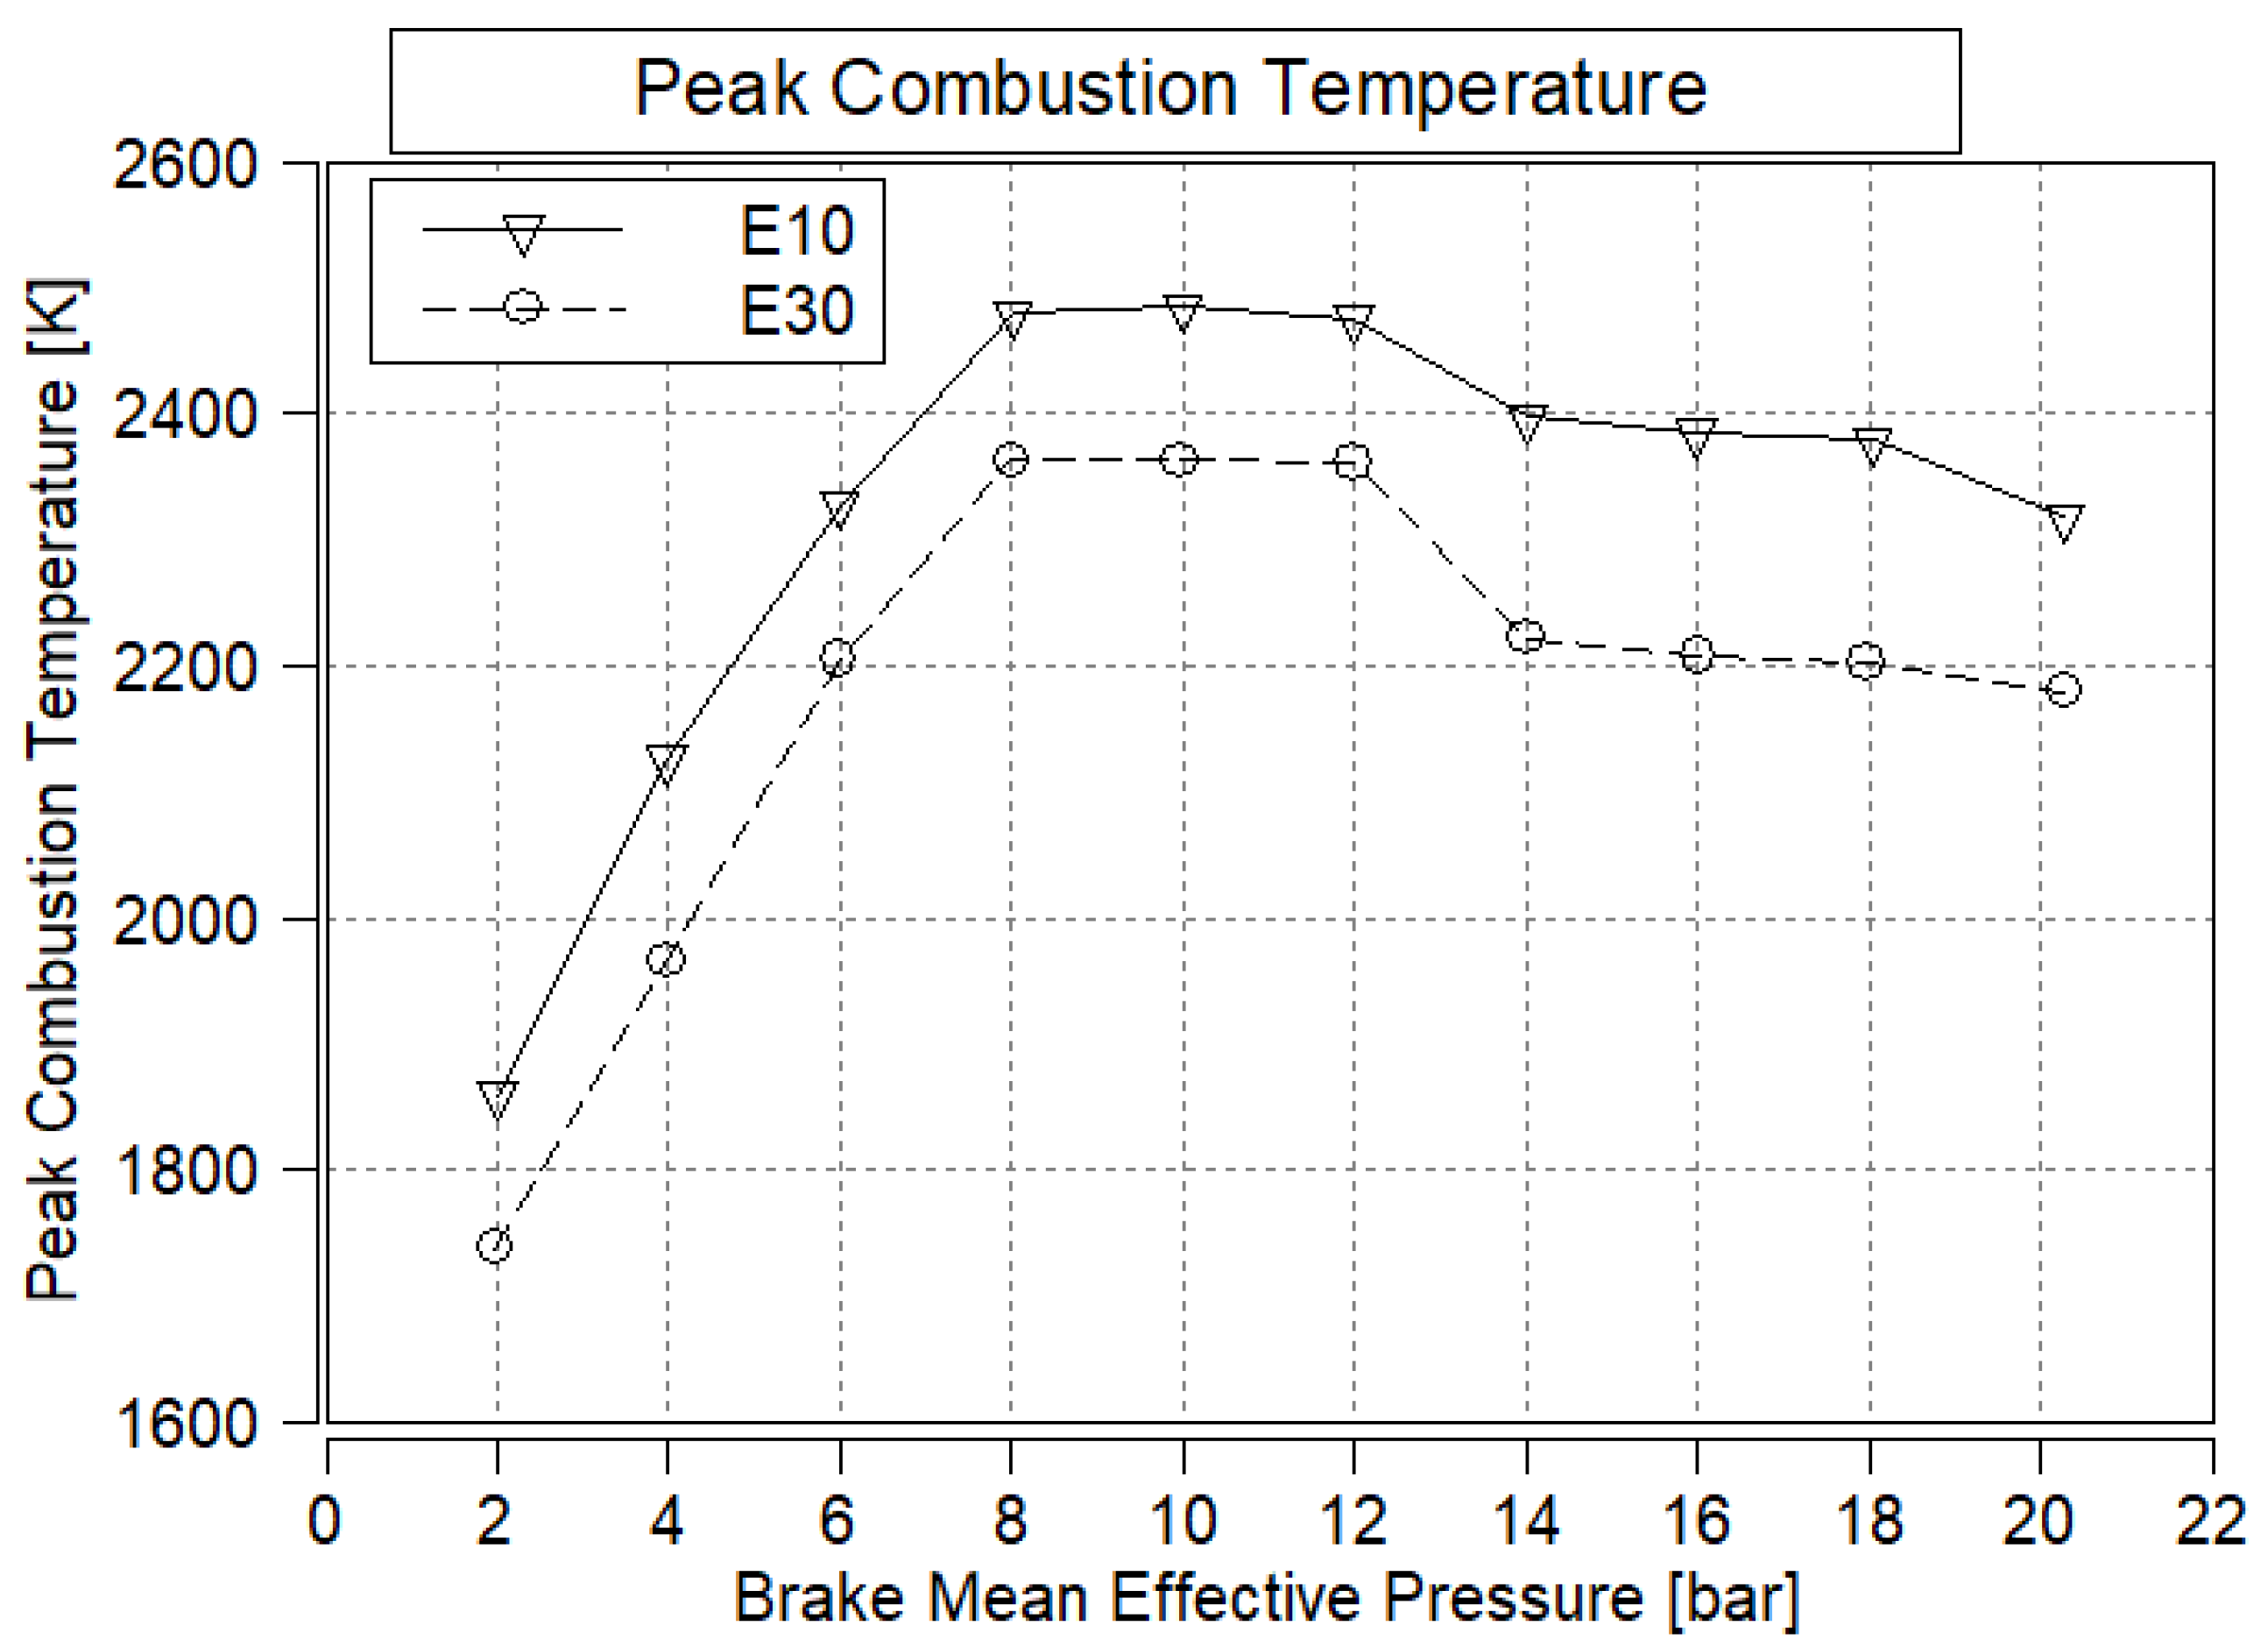
The average peak combustion temperature over 200 cycles of E10 and E30 can be seen in Figure 11.
E30 consistently produced lower peak combustion temperatures at every operating point by over 120 K. The most significant difference was between 14 and 18 bar BMEP, where the E30 peak combustion temperature was lower by 175 K. Peak combustion temperature decreases for both fuels above 12 bar BMEP. Due to the later combustion process, the expansion stroke starts to cool down the combustion when the peak combustion temperature is reached. The generally lower peak combustion temperature of E30 can be attributed to ethanol’s higher latent heat of evaporation [2,3] and the increased mass of cylinder charge.

3.9. Exhaust Gas Temperature

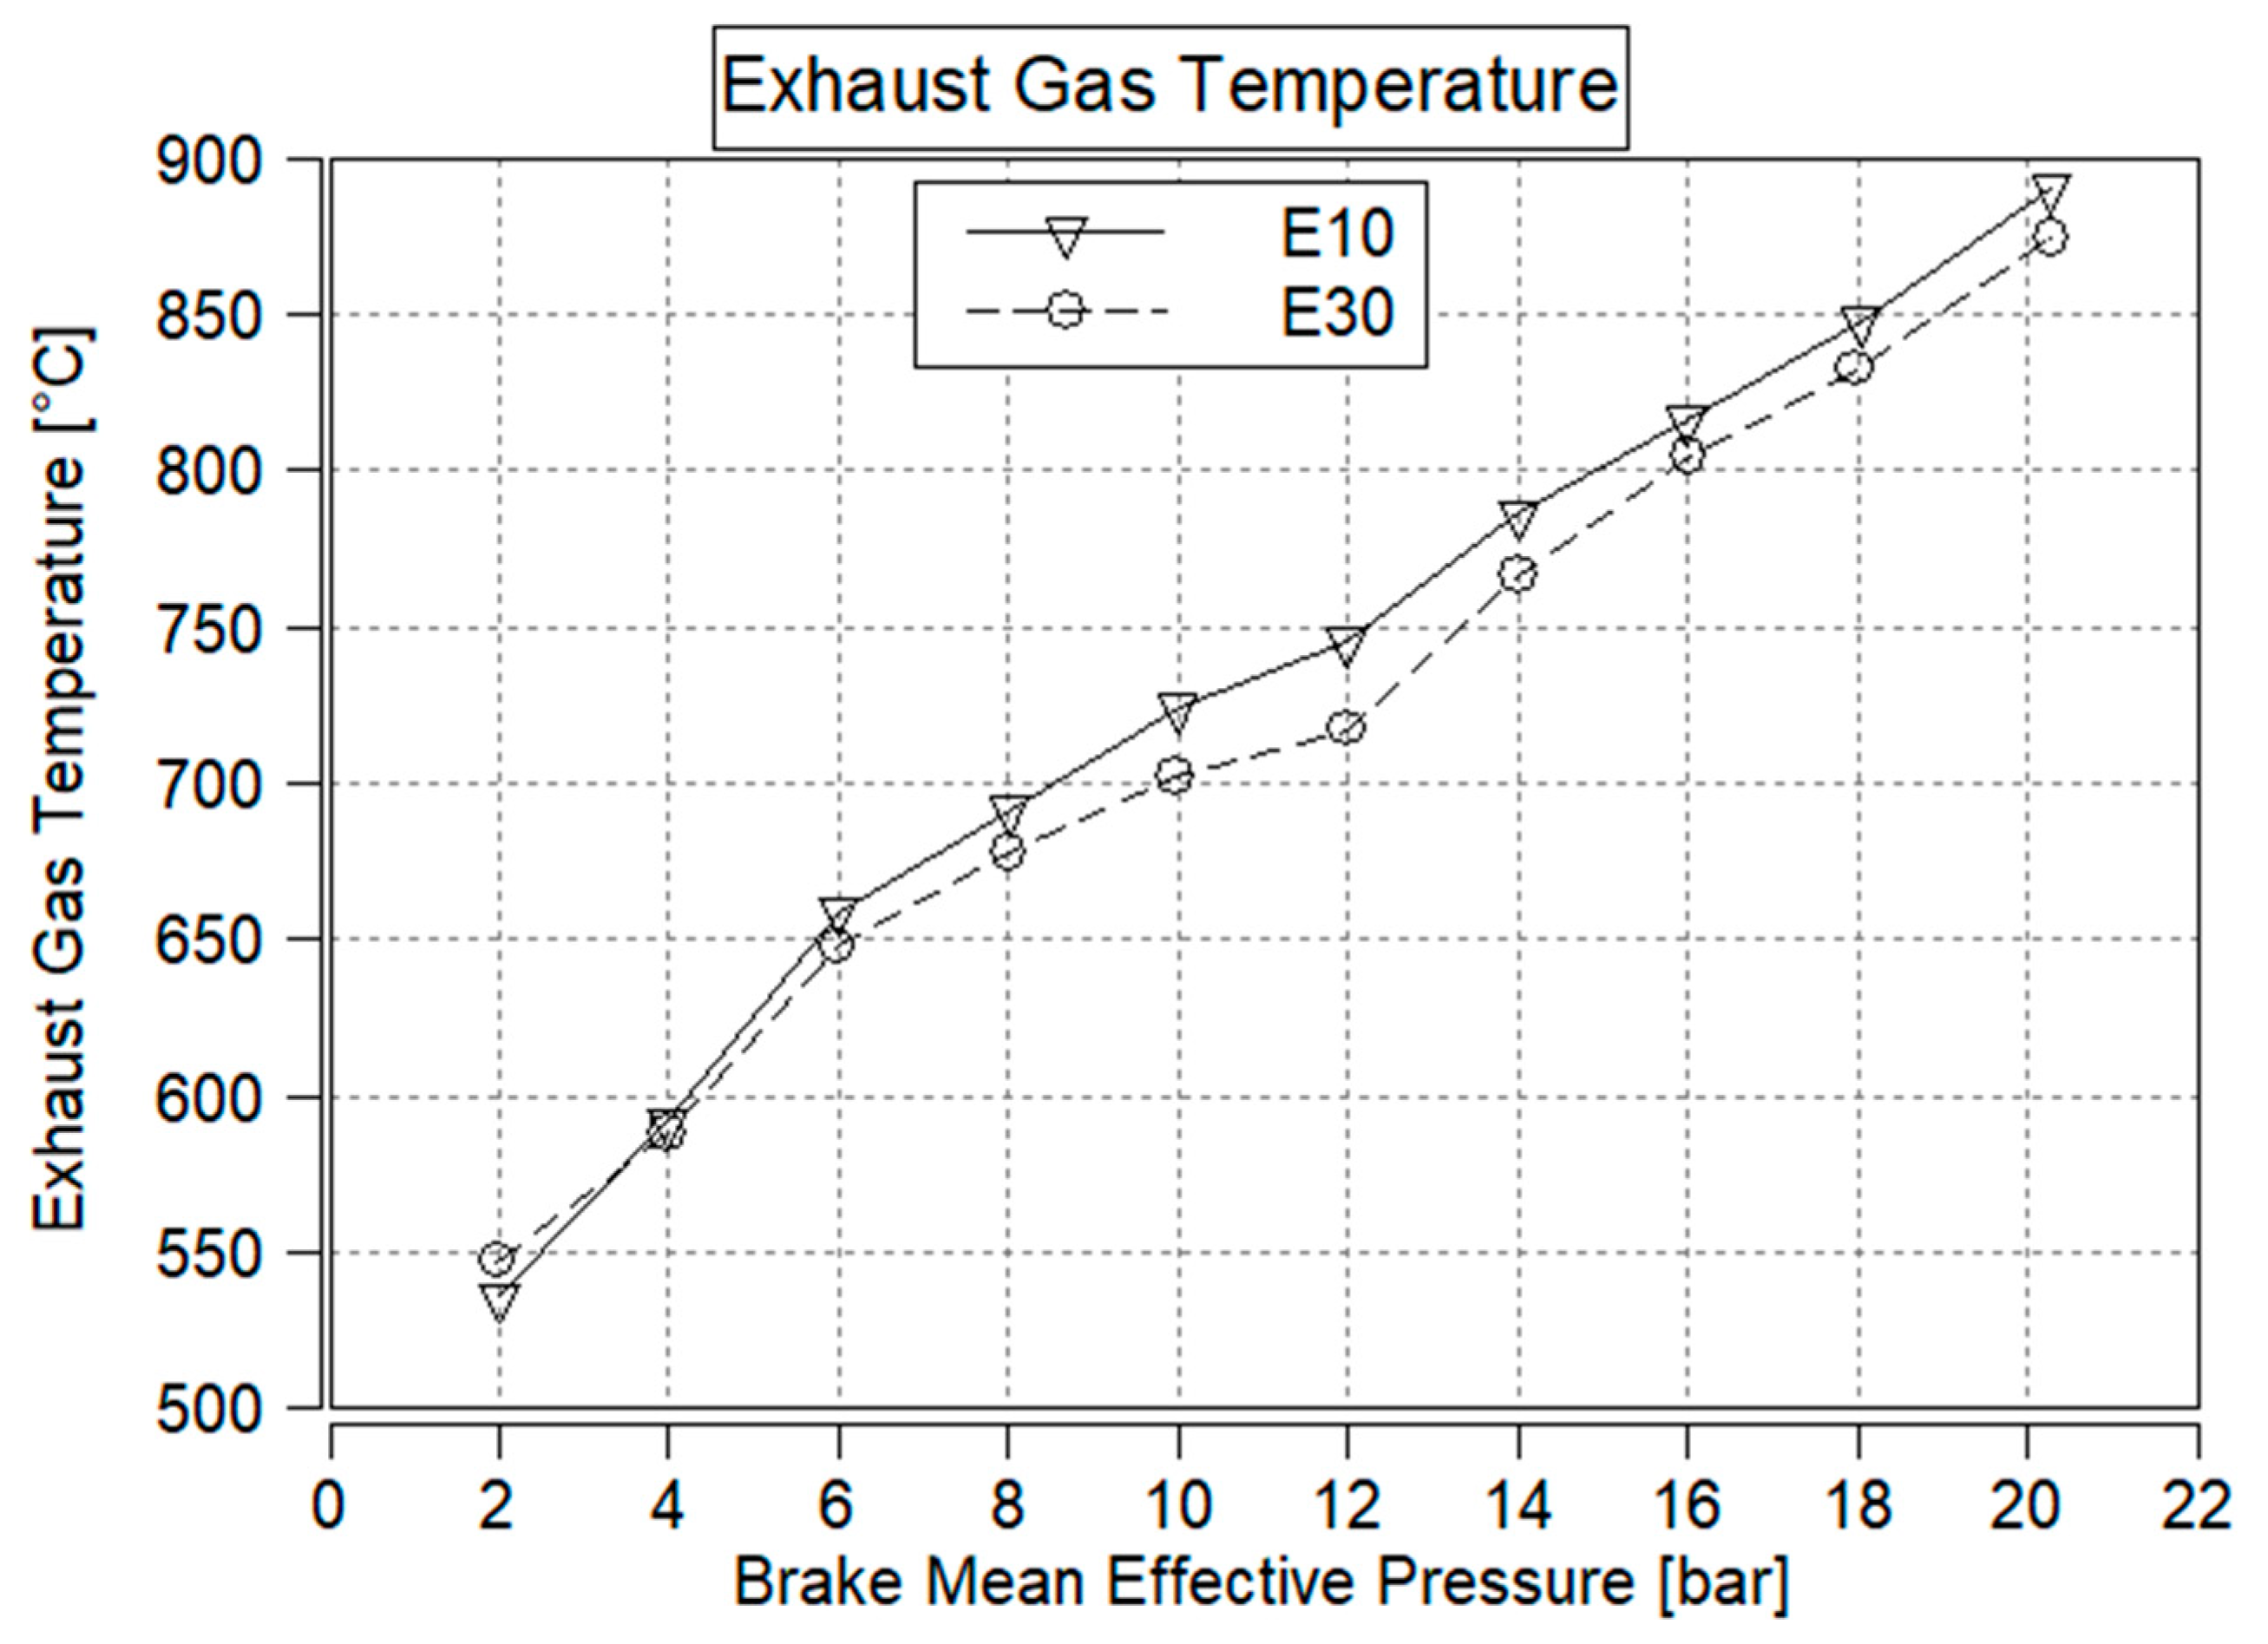
Exhaust gas temperature continuously increased with engine load, as expected. The exhaust gas temperature produced by E30 was always colder than that produced by E10, except for the operating point at 2 bar BMEP (see Figure 12). The most considerable difference was at 12 bar BMEP, where the exhaust gas temperature of E30 was 717 °C, while the exhaust gas temperature of E10 was 745 °C (3.7% lower than E10). On average, E30 produced about 2% lower exhaust gas temperature. This may not seem significant, but thanks to the colder exhaust gas, no fuel enrichment was needed for E30 at maximum engine power (150 kW between 5000 rpm and 6000 rpm) to stay within the temperature limit of 980 °C before the catalytic converter. When running the engine with E10, a slightly rich air–fuel ratio was needed to avoid too high exhaust gas temperature.
The results show that E30 consistently produced lower exhaust gas temperatures than E10, with an average reduction of about 2% and a maximum difference of 28 °C at 12 bar BMEP. This is attributed to ethanol’s higher latent heat of vaporization, which cools the intake charge and reduces combustion temperature [3,5,22]. The lower EGTs observed with E30 are consistent with those reported in previous studies and have important implications for engine durability and emissions, particularly regarding reduced thermal loading and potentially lower NOx formation [25,28].

4. Conclusions

This study comprehensively evaluated the efficiency and combustion characteristics of E10 and E30 ethanol–gasoline blends in a modern, turbocharged SI engine, analyzing critical parameters such as peak combustion pressure, peak combustion temperature, rapid burning phase, flame development and fuel consumption.
A key finding, which addresses a notable gap in previous research, is that, when the octane number of the ethanol blend was held constant, the anticipated efficiency benefits of higher ethanol content were not fully realized. In this controlled scenario, the efficiency penalty stemming from ethanol’s smaller lower heating value (LHV) became dominant, and theoretical improvements in efficiency were not observed. This contrasts with most prior studies, where improved brake-specific fuel consumption (BSFC) and increased brake thermal energy (BTE) with higher ethanol content were often reported, primarily because the higher octane number of the ethanol blend allowed for more advanced combustion timing.
The findings indicate that, while E30 consistently exhibited higher volumetric fuel consumption and BSFC compared to E10, primarily due to its lower energy density, it also presented several combustion-related advantages. The reduction in exhaust gas temperature (EGT) with increasing ethanol content, especially for E30, suggests lower in-cylinder combustion temperatures, which are beneficial for engine durability by mitigating thermal stress on components. Furthermore, the analysis of flame development and the rapid burning phase suggests improved combustion characteristics of E30, attributed to ethanol’s chemical composition and high flame speed.
These results have significant implications for both fuel formulation policy and engine design. They underscore that simply increasing ethanol content in gasoline blends will not inherently yield efficiency benefits unless the engine and fuel are co-optimized to exploit ethanol’s combustion-improving quality and high octane potential. Without such optimization, higher ethanol blends may result in increased fuel consumption and only marginal changes in engine efficiency, despite environmental advantages such as reduced carbon content and lower EGTs. Overall, the research highlights the trade-offs associated with higher ethanol blends and the importance of integrated engine and fuel strategies to balance performance, efficiency, and environmental considerations.

Future Research Directions

  • Analyze the exhaust gas emissions of different ethanol–gasoline fuel blends under steady-state operating conditions to assess ethanol’s potential emission reduction effect in SI engines.
  • Detailed combustion analysis under identical operating points to investigate cycle variation and rate of heat release.
  • Measure fuel consumption and cumulated emission output under dynamic engine operations that resemble real driving conditions.
In summary, this study demonstrates that the efficiency gains commonly attributed to higher ethanol content in SI engines are not automatic but depend critically on fuel formulation and engine calibration. When the octane number is held constant, ethanol’s lower energy density leads to increased fuel consumption and slightly reduced thermal efficiency, despite beneficial effects on exhaust gas temperature. These insights should inform policymakers and engineers in the ongoing transition toward higher biofuel utilization in transportation.

Author Contributions

Conceptualization, G.N.; methodology, G.N.; software, G.N. and Z.T.M.; validation, G.N.; formal analysis, G.N. and Z.T.M.; investigation, G.N. and Z.T.M.; resources, G.N. and Á.I.S.; data curation, G.N.; writing—original draft preparation, G.N., Z.T.M., A.W. and Á.I.S.; writing—review and editing, Á.I.S.; visualization, G.N.; supervision, Á.I.S.; project administration, G.N.; funding acquisition, G.N. and Á.I.S.; All authors have read and agreed to the published version of the manuscript.

Funding

This research received no external funding.

Institutional Review Board Statement

Not applicable.

Informed Consent Statement

Not applicable.

Data Availability Statement

The data presented in this study are available on request from the corresponding author. The data are not publicly available because they were generated within the framework of the industrial project: Fuel selective optimum research of internal combustion engines with high alternative content fuel blends, 250_2023_UGN.

Acknowledgments

This article is published in the framework of the project: Fuel selective optimum research of internal combustion engines with high alternative content fuel blends, 250_2023_UGN. The authors would like to thank Péter Raffai, Máté Tóth and Gábor Schmerl for their support in the research.

Conflicts of Interest

The authors declare no conflicts of interest.

Abbreviations

The following abbreviations are used in this manuscript:
AFRAir–Fuel Ratio
aTDCAfter Top Dead Center
AVL(Brand name, not spelled out, refers to AVL List GmbH)
BMEPBrake Mean Effective Pressure
BSFCBrake-Specific Fuel Consumption
BTEBrake Thermal Efficiency
CA°Crank Angle Degree
E10Gasoline with 10% ethanol by volume
E30Gasoline with 30% ethanol by volume
EGTExhaust Gas Temperature
HBM(Brand name, not spelled out, refers to Hottinger Brüel & Kjær)
HCCIHomogeneous Charge Compression Ignition
LHVLower Heating Value
MFB10Mass Fraction Burned 10%
MFB50Mass Fraction Burned 50%
MFB90Mass Fraction Burned 90%
MONMotor Octane Number
RONResearch Octane Number
SISpark Ignition Engine

References

  1. García, M.A.; Villalba, J.; Castaño, M.R.; Bailera, M. Performance and Emissions of Spark-Ignition Internal Combustion Engine Operating with Bioethanol-Gasoline Blends at High Altitudes Under Low- and High-Speed Conditions. Energies 2025, 18, 1401. [Google Scholar]
  2. Maurya, R.K.; Agarwal, A.K. Experimental study of combustion and emission characteristics of ethanol fuelled port injected homogeneous charge compression ignition (HCCI) combustion engine. Appl. Energy 2011, 88, 1169–1180. [Google Scholar] [CrossRef]
  3. Chansauria, P.; Mandloi, R.K. Effects of Ethanol Blends on Performance of Spark Ignition Engine—A Review. Mater. Today Proc. 2018, 5, 4066–4077. [Google Scholar]
  4. Doğan, B.; Erol, D.; Yaman, H.; Kodanli, E. The effect of ethanol-gasoline blends on performance and exhaust emissions of a spark ignition engine through exergy analysis. Appl. Therm. Eng. 2017, 120, 433–443. [Google Scholar] [CrossRef]
  5. Tibaquirá, J.E.; Huertas, J.I.; Ospine, S.; Quirama, L.F.; Nino, J.E. The Effect of Using Ethanol-Gasoline Blends on the Mechanical, Energy and Environmental Performance of In-Use Vehicles. Energies 2018, 11, 221. [Google Scholar]
  6. Goldember, J.; Coelho, S.T.; Guardabassi, P. The sustainability of ethanol production from sugarcane. Energy Policy 2008, 36, 2086–2097. [Google Scholar] [CrossRef]
  7. Schifter, I.; Diaz, L.; Rodriguez, R.; Gómez, J.P.; Gonzalez, U. Combustion and emission behaviour for ethanol-gasoline blends in a single cylinder engine. Fuel 2011, 90, 3586–3592. [Google Scholar]
  8. Johansen, L.C.R.; Hemdal, S.; Denbratt, I. Comparison of E10 and E85 spark ignited stratified combustion and soot formation. Fuel 2017, 205, 11–23. [Google Scholar] [CrossRef]
  9. Ye, Y.; Hu, J.; Zhang, Z.; Zhong, W.; Zhao, Z.; Zhang, J. Effect of Different Ratios of Gasoline-Ethananol Blend Fuels on Combustion Enhancement and Emission Reduction in Electronic Fuel Injection Engine. Polymers 2023, 15, 3932. [Google Scholar] [CrossRef]
  10. Iodice, P.; Langella, G.; Amoresano, A. Ethanol in gasoline fuel blends: Effect on fuel consumption and engine out emissions of SI engines in cold operating conditions. Appl. Therm. Eng. 2018, 130, 1081–1089. [Google Scholar] [CrossRef]
  11. Anderson, J.E.; DiCicco, D.M.; Ginder, J.M.; Kramer, U.; Leone, T.G.; Rayne-Pablo, H.E.; Wallington, T.J. High octane number ethanol-gasoline blends: Quantifying the potential benefits in the United States. Fuel 2012, 97, 585–594. [Google Scholar]
  12. Al-Hasan, M. Effect of ethanol-unleaded gasoline blends on engine performance and exhaust emission. Energy Convers. Manag. 2003, 44, 1547–1561. [Google Scholar]
  13. Chhalotre, S.; Baredar, P.V.; Soni, S. Investigation of the Effects of Gasoline—Ethanol Fuel Blend on Throttle Response and Intake Air Temperature in a Naturally Aspirated S.I. Engine. Int. J. Mech. Prod. Eng. Res. Dev. 2018, 8, 445–454. [Google Scholar]
  14. Turner, J.W.G.; Lewis, A.G.J.; Akehurst, S.; Brace, C.J.; Verhelst, S.; Vancoillie, J.; Sileghem, L.; Leach, F.C.P.; Edwards, P.P. Alcohol Fuels for Spark-Ignition Engines: Performance, Efficiency, and Emission Effects at Mid to High Blend Rates for Ternary Mixtures. Energies 2020, 13, 6390. [Google Scholar] [CrossRef]
  15. Graham, L.A.; Belisle, S.L.; Baas, C.-L. Emissions from light duty gasoline vehicles operating on low blend ethanol gasoline and E85. Atmos. Environ. 2008, 42, 4498–4516. [Google Scholar]
  16. Gumus, M.; Sayin, C.; Canakci, M. The impact of fuel injection pressure on the exhaust emissions of a direct injection diesel engine fueled with biodiesel-diesel fuel blends. Fuel 2012, 95, 486–494. [Google Scholar] [CrossRef]
  17. Gao, J.; Jiang, D.; Huang, Z. Spray properties of alternative fuels: A comparative analysis of ethanol-gasoline blends and gasoline. Fuel 2007, 86, 1645–1650. [Google Scholar] [CrossRef]
  18. Phuangwongtrakul, S.; Wechsatol, W.; Sethaput, T.; Suktang, K.; Wongwises, S. Experimental study on sparking ignition engine performance for optimal mixing ratio of ethanol-gasoline blended fuels. Appl. Therm. Eng. 2016, 100, 869–879. [Google Scholar]
  19. Turner, D.; Xu, H.; Cracknell, R.F.; Natarajan, V.; Chen, X. Combustion performance of bio-ethanol at various blend ratios in a gasoline direct injection engine. Fuel 2011, 90, 1999–2006. [Google Scholar] [CrossRef]
  20. Suckart, D.; Linse, D.; Schutting, E.; Eichlseder, H. Experimental and simulative investigation of flame–wall interactions and quenching in spark–ignition engines. Automot. Engine Technol. 2017, 2, 25–38. [Google Scholar]
  21. Yang, Q.; Liu, Z.; Hou, X.; Sjörberg, M.; Villeumier, D.; Liu, C.; Liu, F. Measurement of laminar flame speeds and flame instability analysis of E30-air premixed flames at elevated temperatures and pressures. Fuel 2020, 259, 116223. [Google Scholar] [CrossRef]
  22. Heywood, J.B. Internal Combustion Engine Fundamentals, 1st ed.; McGraw-Hill, Inc.: New York, NY, USA; St. Louis, MO, USA; San Francisco, CA, USA; Auckland, New Zealand, 1988; p. 85. [Google Scholar]
  23. Szybist, J.P.; Busch, S.; McCormick, R.L.; Pihl, J.A.; Splitter, D.A.; Ratcliff, M.A.; Kolodziej, C.P.; Storey, J.M.E.; Moses-DeBusk, M.; Vuilleumier, D.; et al. What fuel properties enable higher thermal efficiency in spark-ignited engines? Prog. Energy Combust. Sci. 2021, 82, 100876. [Google Scholar] [CrossRef]
  24. Farooq, S.; Kumar, D.V. Experimental Study on Performance, Emissions and Combustion Characteristics of PFI Spark Ignition Engine Fueled with E30 Equivalent Binary and Ternary GEM Blends. INCAS Bull. 2020, 12, 101–112. [Google Scholar] [CrossRef]
  25. Rimkus, A.; Pukalskas, S.; Mejeras, G.; Nagurnas, S. Impact of Bioethanol Concentration in Gasoline on SI Engine Sustainability. Sustainability 2024, 16, 2397. [Google Scholar] [CrossRef]
  26. Schifter, I.; Diaz, L.; Gómez, J.P.; Gonzalez, U. Combustion characterization in a single cylinder engine with mid-levels hydrated ethanol-gasoline blended fuels. Fuel 2013, 103, 292–298. [Google Scholar] [CrossRef]
  27. Yeliana, W.J.; Michalek, D.; Naber, J. Property Determination For Ethanol-Gasoline Blends With Application to Mass Fraction Burn Analysis In a Spark Ignition Engine. J. KONES Powertrain Transp. 2008, 15, 553–561. [Google Scholar]
  28. Morey, F.; Seers, P. Comparison of cycle-by-cycle variation of measured exhaust-gas temperature and in-cylinder pressure measurements. Appl. Therm. Eng. 2010, 30, 487–491. [Google Scholar] [CrossRef]
  29. Pandey, V.; Gupta, V.K. Technical Assessment of Performance & Emission Characteristics of an SI Engine using Ethanol-Gasoline Blended Fuel. Int. J. Eng. Res. Technol. 2016, 5, 422–426. [Google Scholar]
  30. Doğan, B.; Yeşilyurt, M.K.; Erol, D.; Çakmak, A. A Study Toward Analyzing the Energy, Exergy and Sustainability Index Based on Performance and Exhaust Emission Characteristics of a Spark-Ignition Engine Fueled with the Binary Blends of Gasoline and Methanol or Ethanol. Int. J. Eng. Res. Dev. 2020, 12, 529–548. [Google Scholar] [CrossRef]
  31. EN 228:2025; Automotive Fuels—Unleaded Petrol—Requirements and Test Methods. European Committee for Standardization (CEN): Brussels, Belgium, 2025.
  32. Hellier, P.; Talibi, M.; Eveleigh, A.; Ladommatos, N. An overview of the effects of fuel molecular structure on the combustion and emission characteristics of compression ignition engines. J. Automob. Eng. 2017, 232, 90–105. [Google Scholar] [CrossRef]
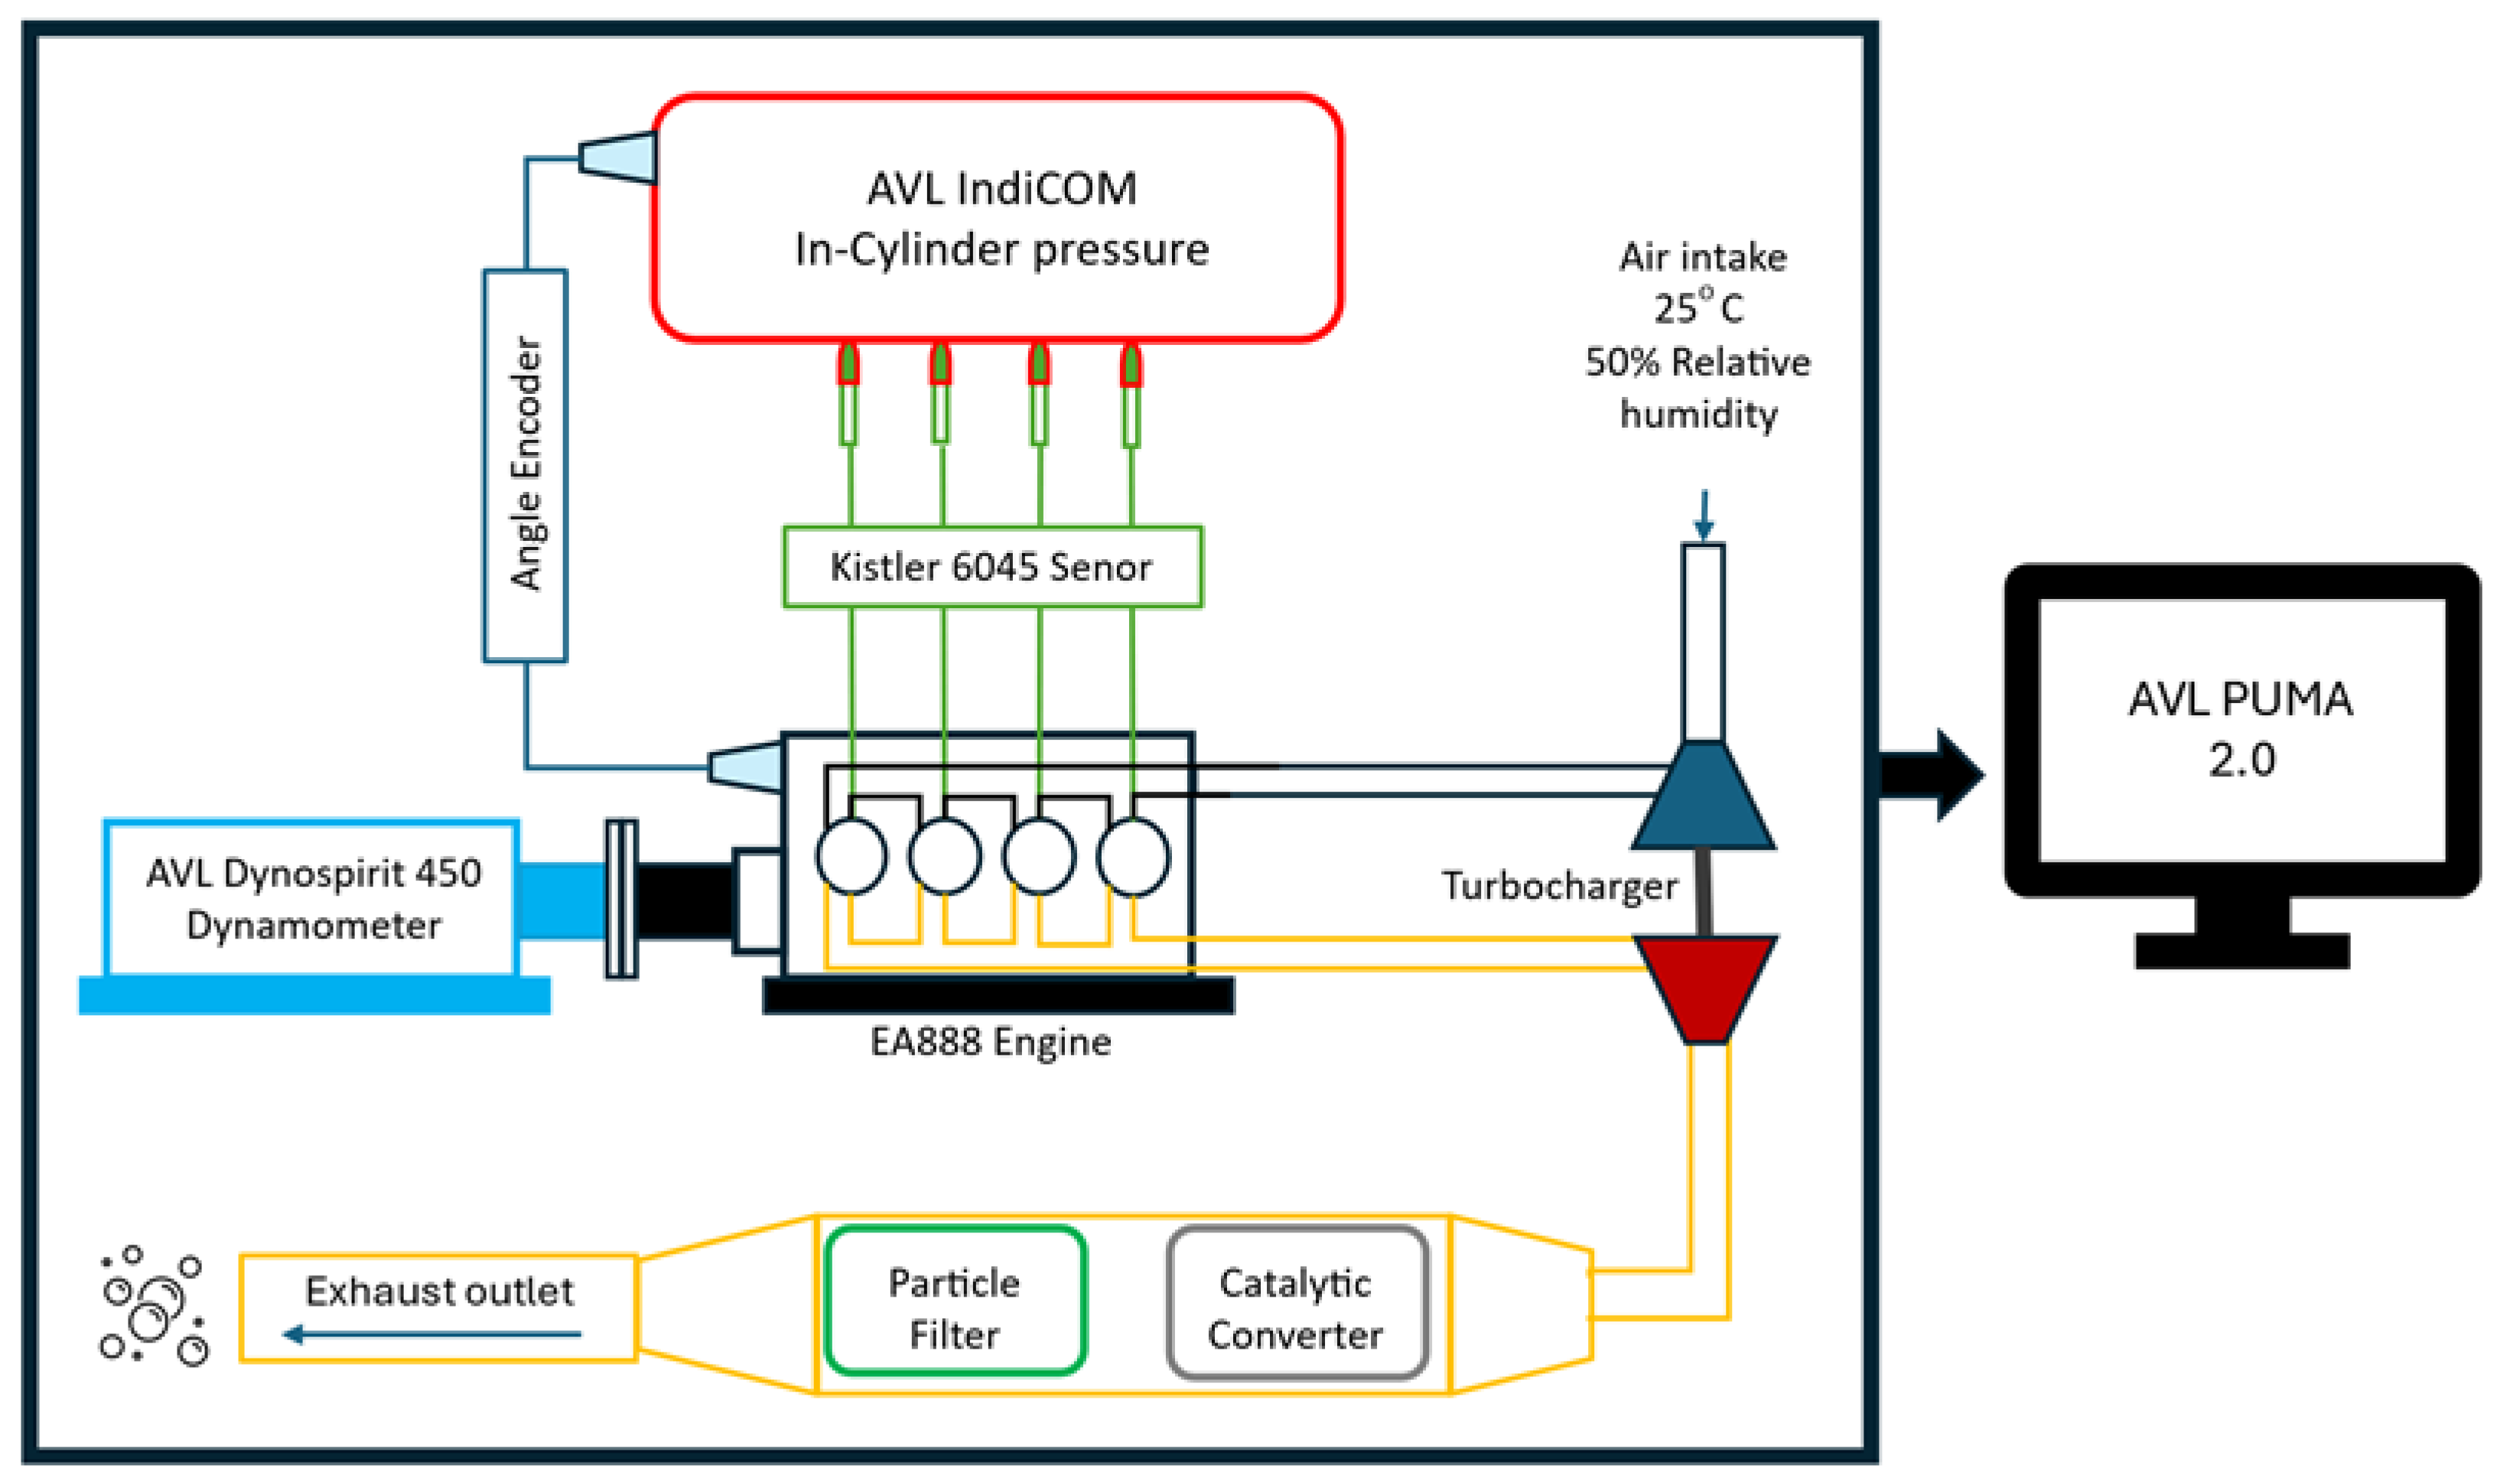
Figure 1. Test bench schematic diagram.
Eng 06 00256 g001
Figure 2. Distillation curve of the tested E10 and E30 fuels.
Eng 06 00256 g002
Figure 3. E10 brake-specific fuel consumption engine map as a function of engine speed and BMEP. The triangles indicate the measurement points, while only the operating points along the red line at 2500 rpm are discussed in this study.
Eng 06 00256 g003
Figure 4. Measured volumetric fuel consumption curves at 2500 rpm engine speed.
Eng 06 00256 g004
Figure 5. Measured brake-specific fuel consumption curves at 2500 rpm engine speed.
Eng 06 00256 g005
Figure 6. Measured brake thermal efficiency curves at 2500 rpm engine speed.
Eng 06 00256 g006
Figure 7. Crank angle degree aTDC for MFB50 at 2500 rpm engine speed.
Eng 06 00256 g007
Figure 8. Measured flame development phase at 2500 rpm engine speed.
Eng 06 00256 g008
Figure 9. Measured rapid burning phase at 2500 rpm engine speed.
Eng 06 00256 g009
Figure 10. Measured peak combustion pressures of E10 and E30 at 2500 rpm engine speed.
Eng 06 00256 g010
Figure 11. Calculated peak combustion temperature of E10 and E30 at 2500 rpm engine speed.
Eng 06 00256 g011
Figure 12. Measured exhaust gas temperature upstream of the turbocharger at 2500 rpm engine speed.
Eng 06 00256 g012
Table 1. The tested engine’s specifications.
SpecificationDetails
ConfigurationInline 4-cylinder (Audi Hungaria Zrt., Győr, Hungary)
Displacement1984 cm3
Valvetrain16 valves, dual overhead camshaft, variable valve lift and timing
Fuel SystemDirect injection
AspirationTurbocharged with electronically controlled wastegate
Bore82.5 mm
Stroke92.8 mm
Compression ratio12.2:1
Maximum power output150 kW @ 5000–6000 rpm
Maximum torque320 Nm @ 2000–4000 rpm
Table 2. Test bench conditions and requirements.
Test cell temperature22 °C
Intake air temperature25 °C
Intake air relative humidity50%
Charge air temperature after the intercooler30 °C
Coolant temperature at the inlet to the engine60 °C
Table 3. Measured properties of tested fuel blends.
PropertyE10E30
Research octane number [-]96.593.9
Motor octane number [-]85.185.0
Density [kg/m3]753.6722.6
Lower heating value [MJ/kg]42.0440.23
Stoichiometric air–fuel ratio [-]14.0213.04
Calorific value of stoichiometric mixture [MJ/kg]2.802.87
Carbon content [m/m%]83.2773.50
Hydrogen content [m/m%]13.3214.79
Oxygen content [m/m%]3.4111.70
Ethanol content [v/v%]8.930.6
Olefin content [v/v%]13.90.1
Aromatic content [v/v%]29.41.6
Initial boiling point [°C]34.841.3
Final boiling point [°C]201.9125.8
Vapor pressure [kPa]63.057.9
Disclaimer/Publisher’s Note: The statements, opinions and data contained in all publications are solely those of the individual author(s) and contributor(s) and not of MDPI and/or the editor(s). MDPI and/or the editor(s) disclaim responsibility for any injury to people or property resulting from any ideas, methods, instructions or products referred to in the content.