Article

Edge Computing: Performance Assessment in the Hybrid Prediction Method on a Low-Cost Raspberry Pi Platform

by
Dhyogo Piovesan
1,2,
Joylan Nunes Maciel
1,2,3,*,
Willian Zalewski
1,2,
Jorge Javier Gimenez Ledesma
2,
Marco Roberto Cavallari
3,4 and
Oswaldo Hideo Ando Junior
1,2,3,5
1
Applied Computing Laboratory (LACA), Federal University of Latin American Integration—UNILA, Foz do Iguaçu 85867-000, PR, Brazil
2
Interdisciplinary Postgraduate Program in Energy & Sustainability (PPGIES), Federal University of Latin American Integration—UNILA, Foz do Iguaçu 85867-000, PR, Brazil
3
Research Group on Energy & Energy Sustainability (GPEnSE), Postgraduate Program of Mechanical Engineering (DEME), Technology Center (CT), Federal University of Paraiba (UFPB), Jardim Universitário, s/n, João Pessoa 58051-900, PB, Brazil
4
Faculdade de Engenharia Elétrica e de Computação (FEEC), Universidade Estadual de Campinas (UNICAMP), Av. Albert Einstein 400, Campinas 13083-852, SP, Brazil
5
Center for Alternative and Renewable Research (CEAR), Federal University of Paraiba (UFPB), João Pessoa 58051-900, PB, Brazil
*
Author to whom correspondence should be addressed.
Eng 2025, 6(10), 255; https://doi.org/10.3390/eng6100255
Submission received: 21 August 2025 / Revised: 12 September 2025 / Accepted: 28 September 2025 / Published: 2 October 2025

Abstract

The predictive models performance on embedded devices represents a significant technical challenge for applications for real-time Predicting of Photovoltaic Solar Energy Generation (PPSEG). This study evaluated the computational feasibility of the Hybrid Prediction Method (HPM), focusing on the extraction of nine visual features extracted from 180° hemispheric all-sky images, processed on the Raspberry Pi 4 Model B microcomputer. The experiment, conducted with 100 images at different resolutions, demonstrated that the proposed pipeline is operationally feasible in all tested configurations. Processing times were significantly reduced with decreasing resolution, remaining compatible with embedded applications. However, an increase in normalized absolute error of up to 8% was observed at 25% resolution, especially in the measurement of cloud motion, which is sensitive to the loss of spatial detail. The other measurements remained stable and had low error levels. The main contribution of this work lies in the validation of a pipeline and measurement of embedded computer vision performance for HPM, enabling its actual implementation and promoting advances in the development of short-term PPSEG solutions.

1. Introduction

The growing demand for energy has been increasingly met by renewable sources, such as wind and photovoltaic, with significant investments in solar energy installations, particularly in China, Japan, the United States, Brazil, Germany, and India [1]. In Brazil, prominent trend in the current energy landscape is the generation of electricity from clean sources, especially Wind [2] and solar power [3,4], with solar energy being regarded as particularly promising due to its high potential for scalability and technological advancement [5,6,7].
The adoption of photovoltaic solar energy has stimulated research into methods of predicting solar irradiation, a key factor in energy production [8]. The main challenge in generating solar energy is the intermittency caused by atmospheric variations such as the movement, height and thickness of clouds, temperature, intensity and duration of solar radiation, air humidity, among others, especially cloud cover [9,10]. In this context, the Predicting of Photovoltaic Solar Energy Generation (PPSEG) has become an important, current and useful topic for optimizing the control and dispatch of energy resources, and consequently mitigating the variation in power injected into the electricity system [11].
One of the techniques for dealing with the issue of generation intermittency is energy leveling, with particular emphasis on the use of energy storage systems with batteries, which make it possible to mitigate generation intermittency within predefined limits. [12,13]. The short-term PPSEG methods contribute to the optimized development of these systems of photovoltaic modules coupled to batteries, since future forecasting makes it possible to anticipate actions to overcome (smooth out) intermittencies during the generation of photovoltaic solar energy [14]. This optimization of the control and dispatch of electricity allows for a balance between supply and demand, as well as facilitating the mitigation of variations in the injection of energy into the electricity system [11]. Due to all these reasons, the issue of PPSEG has gained international relevance [9,10,15].
Since 2017, there has been a more significant increase in publications on PPSEG [9], mainly with the use of Machine Learning (ML) and Deep Learning (DL) techniques from Artificial Intelligence (AI) [10,16]. In addition, recent advances in computing power, together with DL models, promote even more studies applying images of the all-sky [17,18,19], including the availability of new datasets [20].
A research group from the Federal University of Latin American Integration (UNILA) has developed scientific studies on the short-term PPSEG [9,18,21,22,23,24]. Based on this line of research, the study of [18] proposed and evaluated a new hybrid approach to predicting solar irradiance, applying Image Processing (IP) techniques [25] Machine Learning algorithms [26]. Named the Hybrid Prediction Method (HPM), this approach was developed from a dataset containing historical information of full-sky (180°), meteorological and solar irradiance images, created with controlled quality and samples collected every minute over a full 3-year period (2014 to 2016) [27].
The HPM extracts from each all-sky image (180°) a set of measurements that are used in the short-term PPSEG. The extraction of these measurements is carried out on the Raspberry Pi 4 Model B device [28], with limited processing power. In this context, the aim of this study is to investigate the following research hypothesis: “Does the Raspberry Pi 4 Model B have sufficient computing power to perform the all-sky image processing measurement set in less than 1 min on the HPM?”. Therefore, this research will experimentally measure and compare, in a homogeneous and controlled environment, the computational processing time required to extract the set of measurements from the all-sky images in the HPM, considering the use of the Raspberry Pi 4.
This paper therefore investigates the feasibility of running HPM on a low-cost Raspberry Pi 4 Model B embedded system. Through controlled experiments with 100 images at different resolutions, the processing time of nine visual features extracted from the images was evaluated and their suitability for the operational time required for real-time applications.
The results validate the HPM’s pre-processing computational pipeline on an embedded device, making the following contributions to the advancement of affordable solutions for photovoltaic solar energy prediction: (1) Operational validation of the HPM on Raspberry Pi 4 embedded hardware for real-time applications. (2) Analysis of the impact and relationship between the resolution of all-sky images and execution time in image processing. (3) Identification of computational bottlenecks in the measurements used in the pipeline, with a view to possible optimizations. (4) Analysis of the impact of reducing the resolution of all-sky images on the quality, or error, of the extracted measurements.
The next section describes the theoretical background and architecture of the HPM. Section 3 describes the experimental methodological design and the materials used to evaluate the performance of the measurements. Section 4 presents and discusses the results and, finally, Section 5 presents the conclusions, findings, contributions and future work.

2. Related Works, Concepts and Architecture

2.1. Conceptual Foundations and Related Works

Edge Computing represents a paradigm shift from centralized cloud computing, transferring part of the processing to devices close to the data source. This approach provides benefits such as reduced latency, lower bandwidth consumption and greater privacy [29], and is especially suitable for real-time applications that rely on fast response and local processing, such as in the renewable energy sector.
In the Prediction of Photovoltaic Solar Energy Generation (PPSEG) context, the variability of solar irradiance is strongly influenced by atmospheric factors such as cloud cover, air humidity and solar position. This compromises the stability of electricity generation [8,11]. To mitigate these effects, various methods using Edge Computing devices have been proposed, ranging from statistical models to Machine Learning (ML) and Deep Learning (DL) approaches [10,16], which have a greater capacity to model non-linear patterns and benefit from high temporal and spatial resolution databases.
Recent studies explore the use of Raspberry Pi and other low-cost edge devices in real-time data processing and forecasting applications. Karthikeyan et al. [30] present a systematic analysis of prototyping with Raspberry Pi, highlighting the uses, benefits, challenges, and limitations of this platform in Internet of Things (IoT) applications. Chen and Liu [31] evaluate the performance of Machine Learning algorithms (SVM and Random Forest) and Big Data operations on Raspberry Pi, considering both execution time and the impact of the data storage mechanism (MySQL) on the processing cycle. The results highlight the influence of algorithm choice and database configurations on computational efficiency in edge devices.
In the study by Šukić and Štumberger [32], a low-cost IoT system was proposed for intra-minute prediction of cloud passage, aiming to smooth the output power of photovoltaic plants. The method, implemented on a Raspberry Pi with a camera and optical filters, identifies and tracks clouds near the solar disk, allowing for gradual adjustments in power generation. Despite its effectiveness for the proposed objective, the solution does not consider a broad set of visual attributes nor does it evaluate in detail the computational cost of each step. Similarly, Venitourakis et al. [33] developed a solar irradiance prediction model based on convolutional and recurrent neural networks (XceptionLSTM), applicable to all-sky images and designed to run on devices such as Raspberry Pi 4 and Raspberry Pi Zero 2W. The study proves the feasibility of real-time inference but does not analyze the processing cost at different resolutions.
Mysiuk [34] presents a systematic evaluation of the performance of classic image processing metrics on low-cost devices, comparing the Raspberry Pi 4 to the Jetson Nano. The study focuses on quantifying execution times, resource consumption, and the efficiency of basic computer vision algorithms, offering a comparative analysis of the practical feasibility of each platform. Greco et al. [35] investigate the applicability of four classical computer vision algorithms for the task of box detection and localization in pallet depalletizing using a Raspberry Pi 4. The experimental analysis focuses on metrics such as accuracy, robustness to variations, detection sensitivity, processing time, and computational resource consumption. The main objective is to identify which techniques are most suitable for small-scale industrial automation systems, where hardware is constrained in terms of memory and processing power, but rapid and reliable performance is required.
More recently, the use of all-sky hemispheric images has established itself as a promising alternative for short-term solar forecasting, as it allows direct capture of atmospheric characteristics such as cloud movement and density [17,19,20]. In this context, the Hybrid Prediction Method (HPM) [18] was proposed, combining image processing techniques [25] and machine learning algorithms [26] to estimate solar irradiance based exclusively on all-sky images.
Unlike previous studies, the present study validates the preprocessing stage of the HPM on a low-cost edge device, with an emphasis on the individualized extraction of nine visual attributes. This approach makes it possible to identify computational bottlenecks and quantify the impact of resolution reduction on each attribute, providing direct support for optimizations in image resolution and attribute selection according to cost-benefit criteria.

2.2. Evaluated Solution Architecture

The application evaluated in this study consists of an embedded solar generation prediction pipeline based on the HPM (Figure 1), implemented on the Raspberry Pi 4 Model B microcomputer [28]. The architecture is made up of two main modules:
  • Explicit Extraction of Visual Features: application of image processing algorithms on each captured image, resulting in nine (9) visual features (set f of measures). These features are detailed in the next section;
  • Prediction via ML Models: use of ML models previously trained to estimate solar irradiance over short-term horizons, based on the historical set f of measures captured by the HPM. For this purpose, the HPM originally employs a ML algorithm based on an Artificial Neural Network (ANN) with a MultiLayer Perceptron architecture, which is then used as a comparative baseline.
The HPM data flow follows these steps: (i) capture of the all-sky image; (ii) pre-processing and correction of radial distortion (flattening); (iii) calculation of the nine visual measurements (f1 to f9); (iv) sending the measurements to the ML model to predict irradiance.
This architecture was designed to run in an edge computing environment on the Ras-pberry Pi 4 Model B, enabling continuous, real-time operation and integration with Internet of Things (IoT) solutions and remote monitoring systems. It is therefore important to measure the processing time in the Explicit Visual Measurement Extraction module to ensure that the HPM is viable to run on the device.

2.3. HPM Features Description

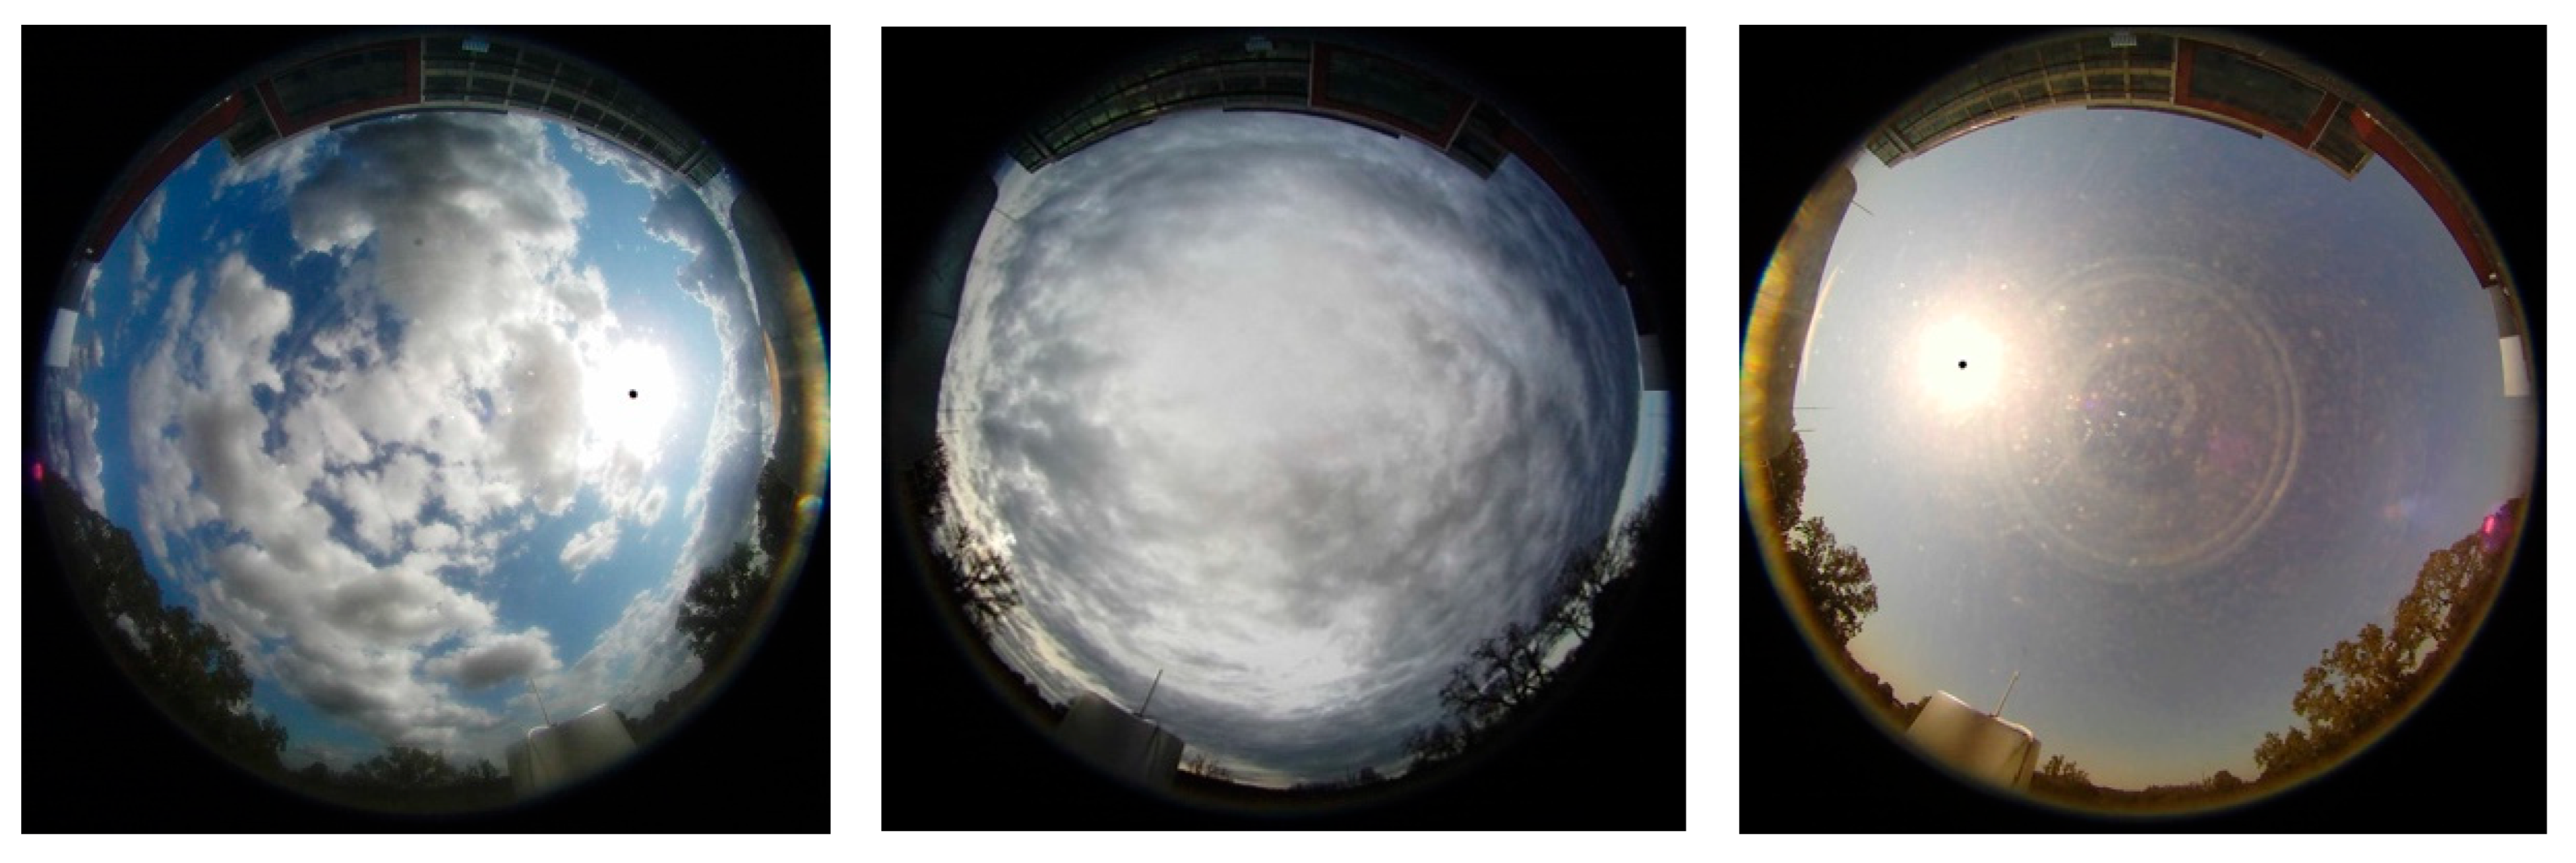
The HPM uses nine measurements derived from all-sky (180°) hemispherical images to represent critical atmospheric conditions for PPSEG [18]. This study used a set of standardized, quality-controlled images acquired in the city of Folsom, California, USA, between 2014 and 2016 [27]. Figure 2 shows examples of the all-sky images used in this study.
From each all-sky image, a set of nine f features is calculated in the HPM. Initially, pre-processing was carried out to correct the radial distortion of the fisheye lens (180°), using the flattening method proposed by [36], which converts the hemispherical projection to a linear format with the same field of view. The corrected images maintained their original resolution, dimensions and format (1536 × 1536 pixels, 96 DPI, 256 colors, RGB format) and served as the basis for calculating the following measurements (f1 to f9) [18]:
(f1) Clouds Movement: quantification of the variation between consecutive images via Mean Square Error (MSE) per pixel;
(f2) Clouds Coverage: sky/cloud segmentation in four stages—(i) resizing to 30% (460 × 460 px); (ii) conversion to Red-Blue Ratio (RBR) index [37]; (iii) Otsu thresholding [38]; (iv) computation of the fraction of coverage corrected for obstacles;
(f3) Clouds Around Sun: computation of the fraction of clouds in the vicinity of the sun, identified via the red channel (value > 240) and processed with RBR and Otsu; if not located, 100% coverage is assumed;
(f4) Clear Sky Global Horizontal Irradiance (GHI): estimated according to the Ineichen-Perez model [39] via PVlib [40], considering atmospheric turbidity, solar position and altitude;
(f5) Sun Luminance: luminous intensity in an area of 40 × 40 pixels around the sun, according to ITU-R BT.709-6 [41], where the luminance Y of a pixel p is given by Equation (1):
Y   =   0.2126 × R lin   +   0.7152 × G lin   +   0.0722 × B lin
where, Y represents the relative luminance of p pixel and R lin , G lin , B lin are the linear values of the red, green and blue (RGB) color components of p ;
(f6) Sun Luminance Adjusted: normalization of Y by the daily Clear Sky GHI:
f hr ,   min = clearSkyGHI hr , min max clearSkyGHI
where, clearSkyGHI hr , min is the clear sky GHI irradiance value h r , m i n , provided by the Ineichen-Perez synthetic model and, max clearSkyGHI is the maximum daily clear sky irradiance value. The adjusted sun luminance ( Y a d j ) is computed with Equation (3):
Y a d j = Y hr , min × f hr ,   min
where, Y hr , min is the luminance of the sun in the image captured at time hr , min and, f hr , min is an adjustment factor relative to the clear sky irradiance ( clearSkyGHI hr , min ) as a function of the hour and minute;
(f7) Sun Located: binary detection (0/1) by thresholding in the red channel (>240);
(f8) White Pixel Ratio: fraction of pixels with RGB values greater than 240, indicative of dense clouds;
(f9) Season: seasonal classification (summer, fall, winter, spring) based on date and location.
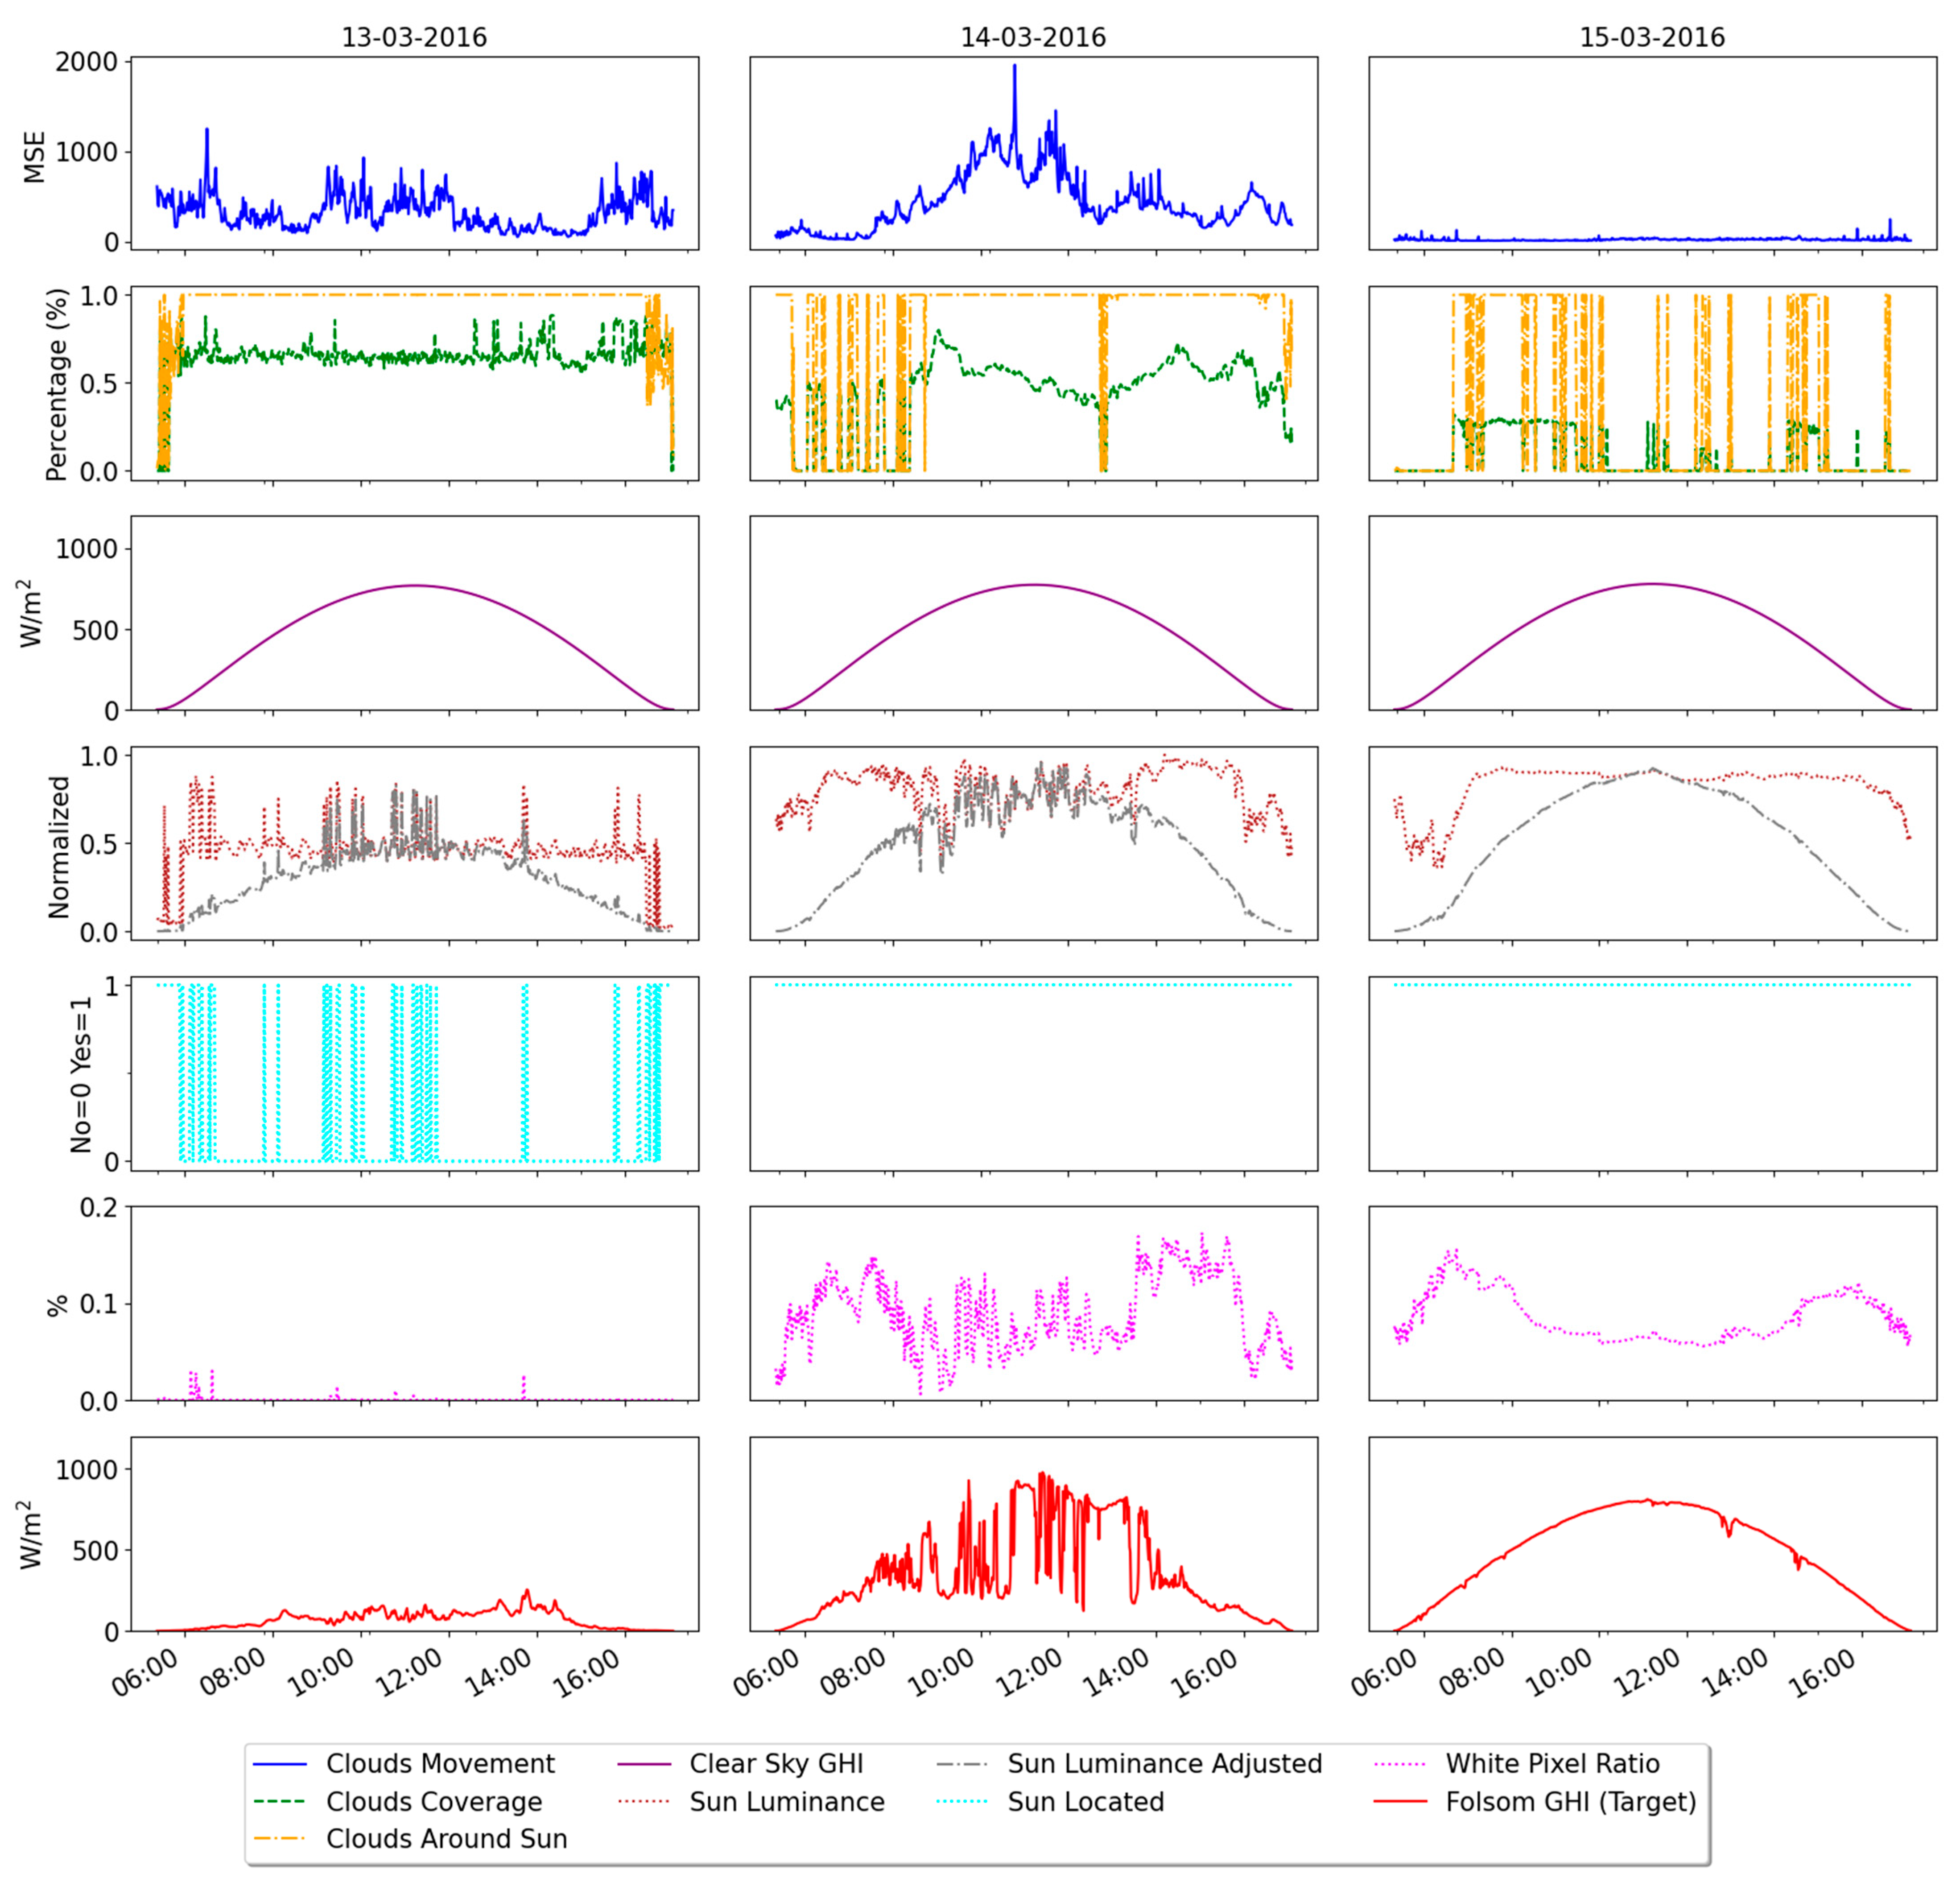
A didactic example of the measurements processed over three days (13–15 March 2016), under different weather conditions (rainy, cloudy, and clear sky), is presented in Figure 3. The source code used to compute these measurements is available in [22].

2.4. Raspberry Pi 4 Model B

The Raspberry Pi 4 Model B processes the environment evaluated in this study and is a low-cost ARM architecture microcomputer that is widely used in embedded computing applications, automation and edge Machine Learning projects [42]. Developed by the Raspberry Pi Foundation, the 4B model offers connectivity and memory capacity, while maintaining affordability and a compact format (85.6 mm × 56.5 mm) [28].
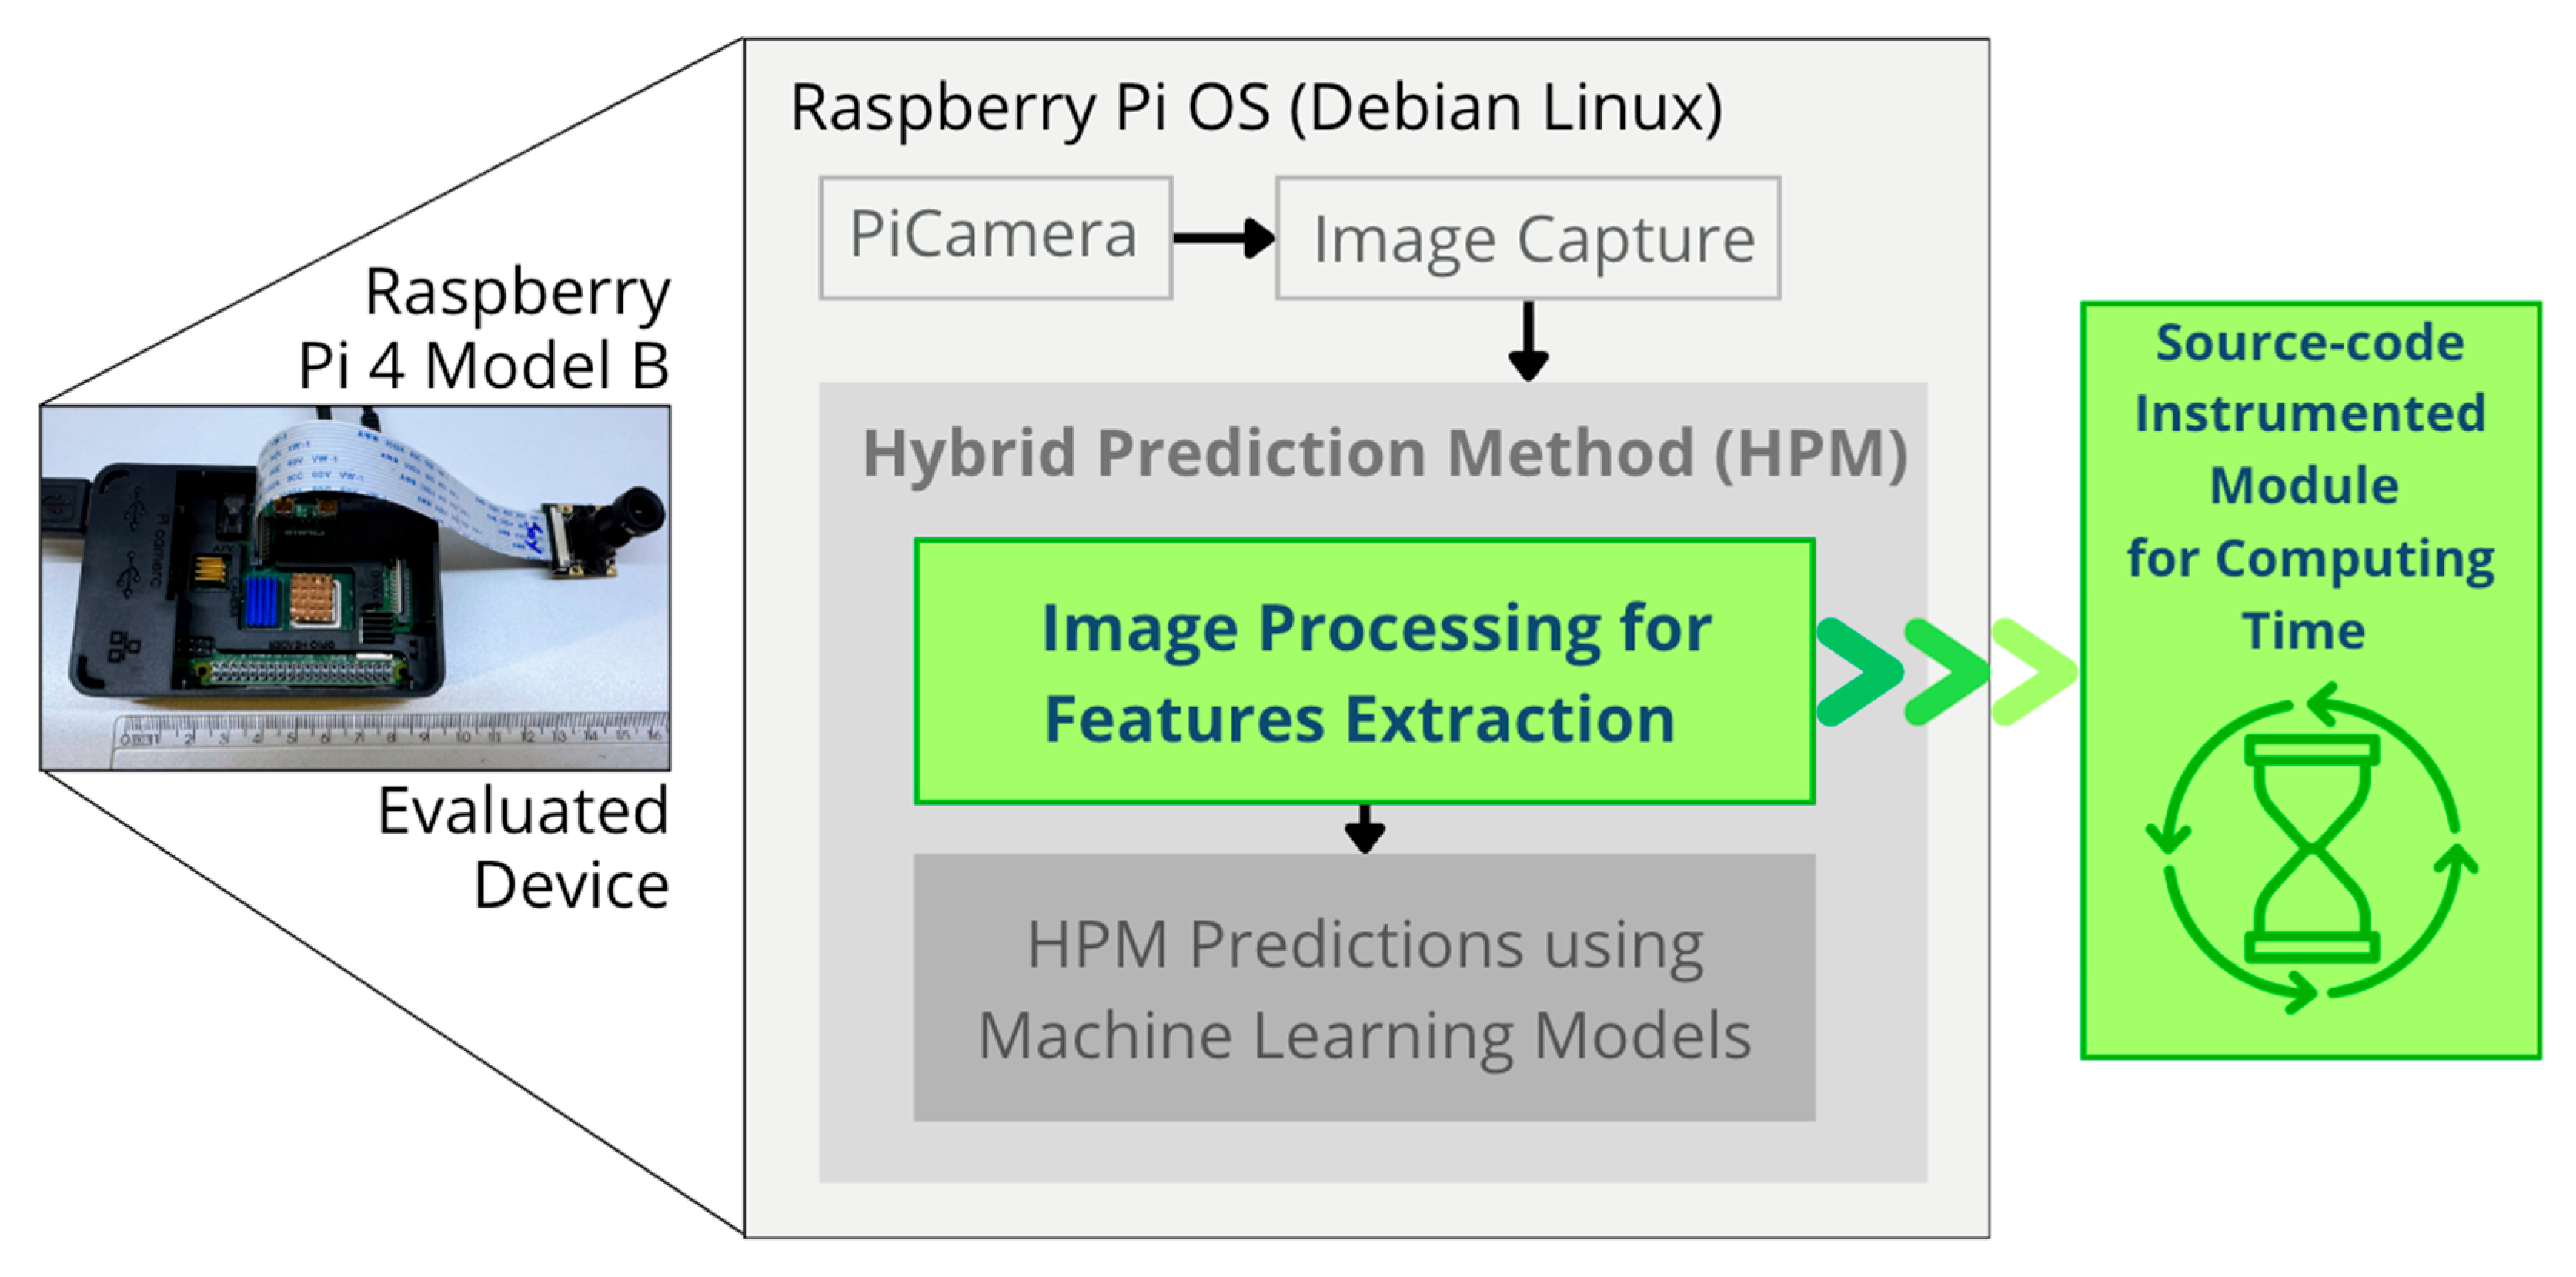
This device has limited processing power and is equipped with a Broadcom BCM2711 processor (Broadcom Inc., Irvine, CA, USA), a System-on-Chip (SoC) with ARM Cor-tex-A72 architecture (quad-core 64-bit 1.5 GHz, ARM Holdings, Cambridge, United Kingdom). The device used in this study has 4 GB of onboard LPDDR4 RAM, 64GB of Micro SD Class A1 storage (Kingston Canvas 128GB, Kingston Technology, Fountain Valley, CA, USA) [42]. In scientific research, this device has been successfully exploited in environmental monitoring applications, pattern recognition, predictive control and rapid prototyping of autonomous systems [43]. Figure 4 shows the device used and the architectural components of the experimental evaluation.
The implemented architecture is based on the HPM. The central aspect of the evaluation is the Computation Time Module, which contains the source code instrumentation that measures and records the computational time taken to process the HPM’s all-sky images. This involves extracting a set of m relevant numerical measures from HPM all-sky images, which are used as input for ML models.

3. Materials and Method

The present section details the experimental analysis method and the technologies and tools used to evaluate the HPM’s image processing performance on the Raspberry Pi 4 Model B embedded device.

3.1. Experimental Design

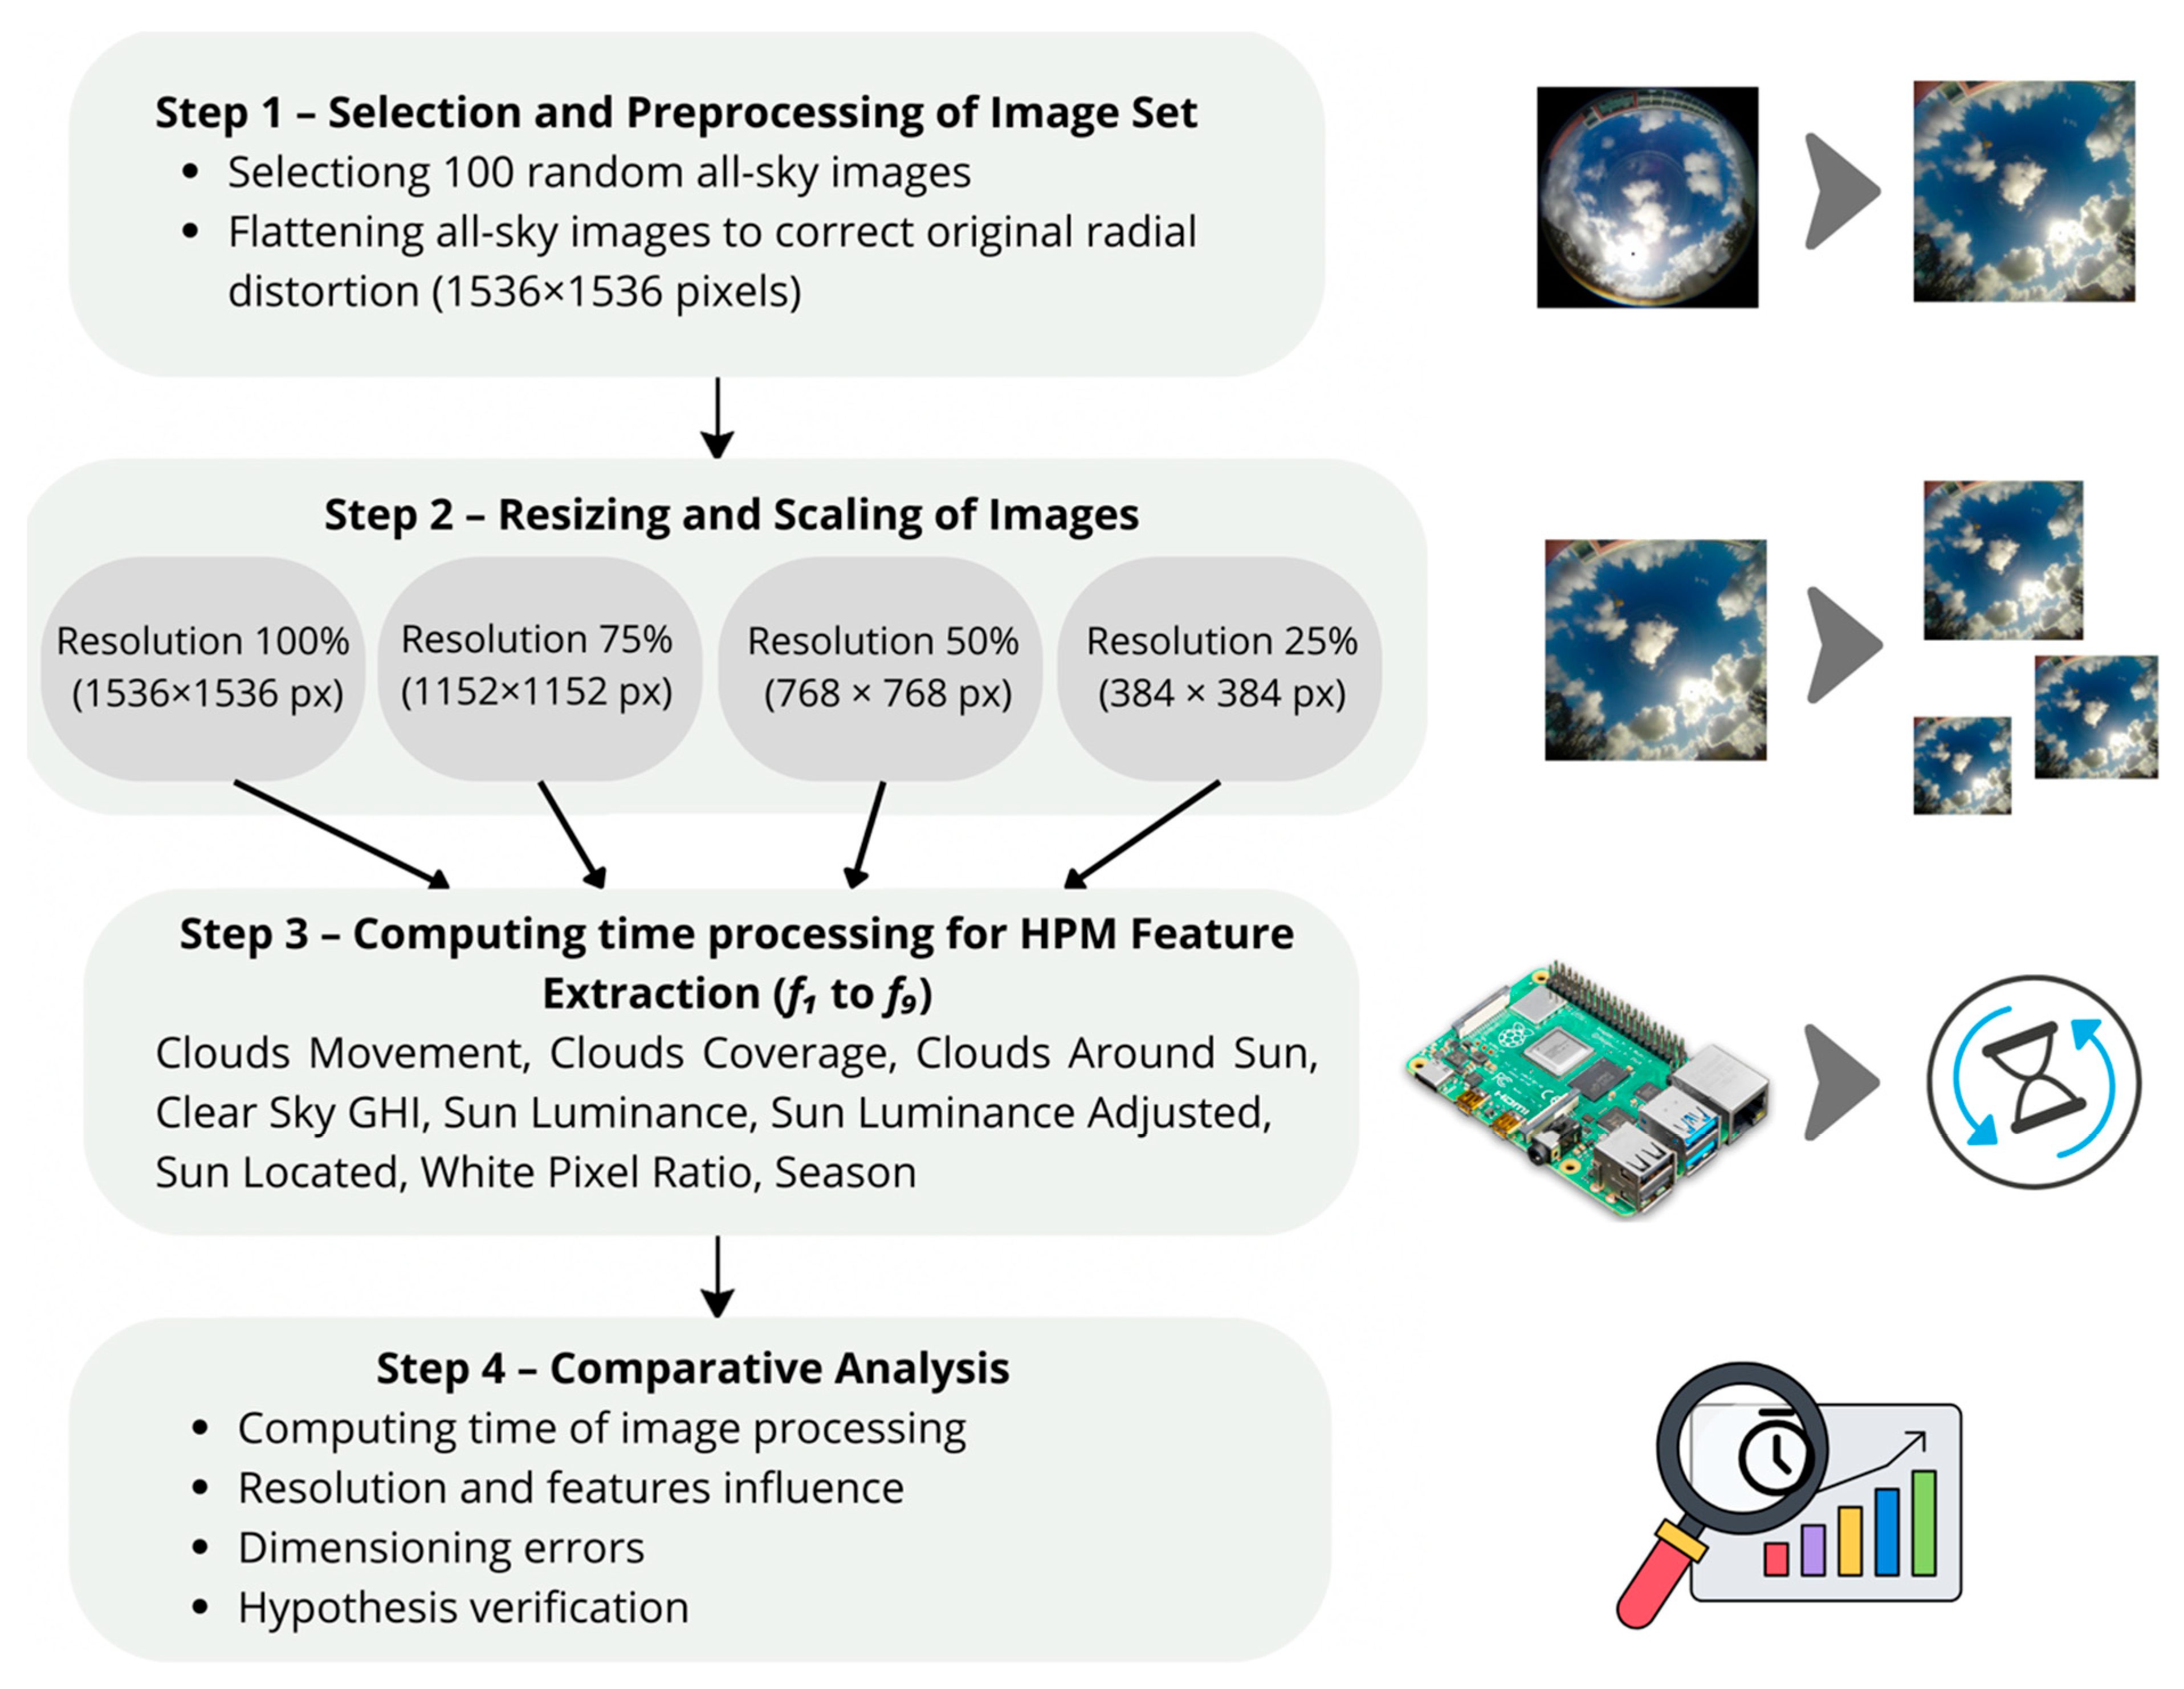
The experimental design of this study was conceived with the aim of assessing the feasibility of using the Raspberry Pi 4 Model B to carry out, in real time, the feature extraction stage of the hybrid prediction method (HPM), applied to the prediction of photovoltaic solar energy generation (PPSEG). To this end, a controlled experiment was developed, described in Figure 5, which simulates the practical application of the HPM, testing different image resolutions and measuring, in detail, the processing time for each of the measurements used.
Step 1—Selection and Pre-processing of the Image Set: The all-sky (180°) image base used consists of more than 770,000 samples captured every minute between 2014 and 2016 in Folsom, California (USA). For the analysis, a sample of 100 images covering varying weather conditions (sunny, cloudy and rainy) was randomly selected. The images were pre-processed to correct the radial distortion caused by the fisheye lens by applying the algorithm from [36] which performs flattening to an apartment perspective while preserving the original dimension (1536 × 1536 pixels)
Step 2—Resizing and Scaling the Images: To assess the impact of image size on processing time, the 100 images were converted to four different resolution scales: (i) 100% of the original resolution: 1536 × 1536 pixels; (ii) 75% of the resolution: 1152 × 1152 pixels; (iii) 50% of the resolution: 768 × 768 pixels; and (iv) 50% of the resolution: 384 × 384 pixels. These resolutions made it possible to analyze the computational cost associated with reducing the resolution, simulating different optimization strategies without compromising the quality of the extracted measurements.
Step 3—Processing and Measuring the Computational Time of the HPM Features: Each image, in its three resolutions, was subjected to the extraction of the nine measures (denoted as f1 to f9), which represent visual features obtained via image processing, as described in the previous section. The measures extracted are Cloud Movement, Cloud Cover, Clouds Around the Sun, Clear Sky Irradiance, Sun Luminance, Adjusted Sun Luminance, Sun Location, White Pixel Ratio, Season. It was run on the Raspberry Pi 4 Model B with Raspberry Pi OS Rev 1.2 (64-bit), Debian GNU/Linux 12 kernel (bookworm) with graphical interface enabled. The execution time was monitored individually for each measurement, as well as the total processing time per image.
Step 4—Comparative Analysis: For each resolution, the total execution time of the feature extraction of 100 images was analyzed, calculating the average and total processing times per image and per measurement. The aim of the analysis was to quantify the percentage contribution of each measure to the total time, identifying potential bottlenecks and opportunities for optimization. The results were organized in tables and comparative graphs, showing the average and standard deviation for each scenario. Finally, the study’s hypothesis was evaluated: to see if the Raspberry Pi 4 is capable of processing all the measurements (f1 to f9) in less than 60 s per image, a threshold considered viable for the HPM to work.

3.2. Tools and Technologies

The experimental evaluation used the Python 3.8.8 language, the time, pandas, os and numpy modules, and the PyCharm 2024 Professional integrated development environment.

4. Results and Discussion

This section presents and discusses the results obtained after executing the method described in Figure 5. The analysis is divided into three main axes: the processing times on the Raspberry Pi 4 Model B in relation to the measurements and resolutions, the errors associated with the decrease in resolution and the verification of the hypothesis of this study.

4.1. Computer Processing Performance

The first analysis aimed to measure the computer processing time required to compute all nine HPM measurements on the Raspberry Pi 4 Model B device. Using a set of 100 selected all-sky images, all the measurements were run for each of the four resolutions defined: 100%, 75%, 50% and 25%.
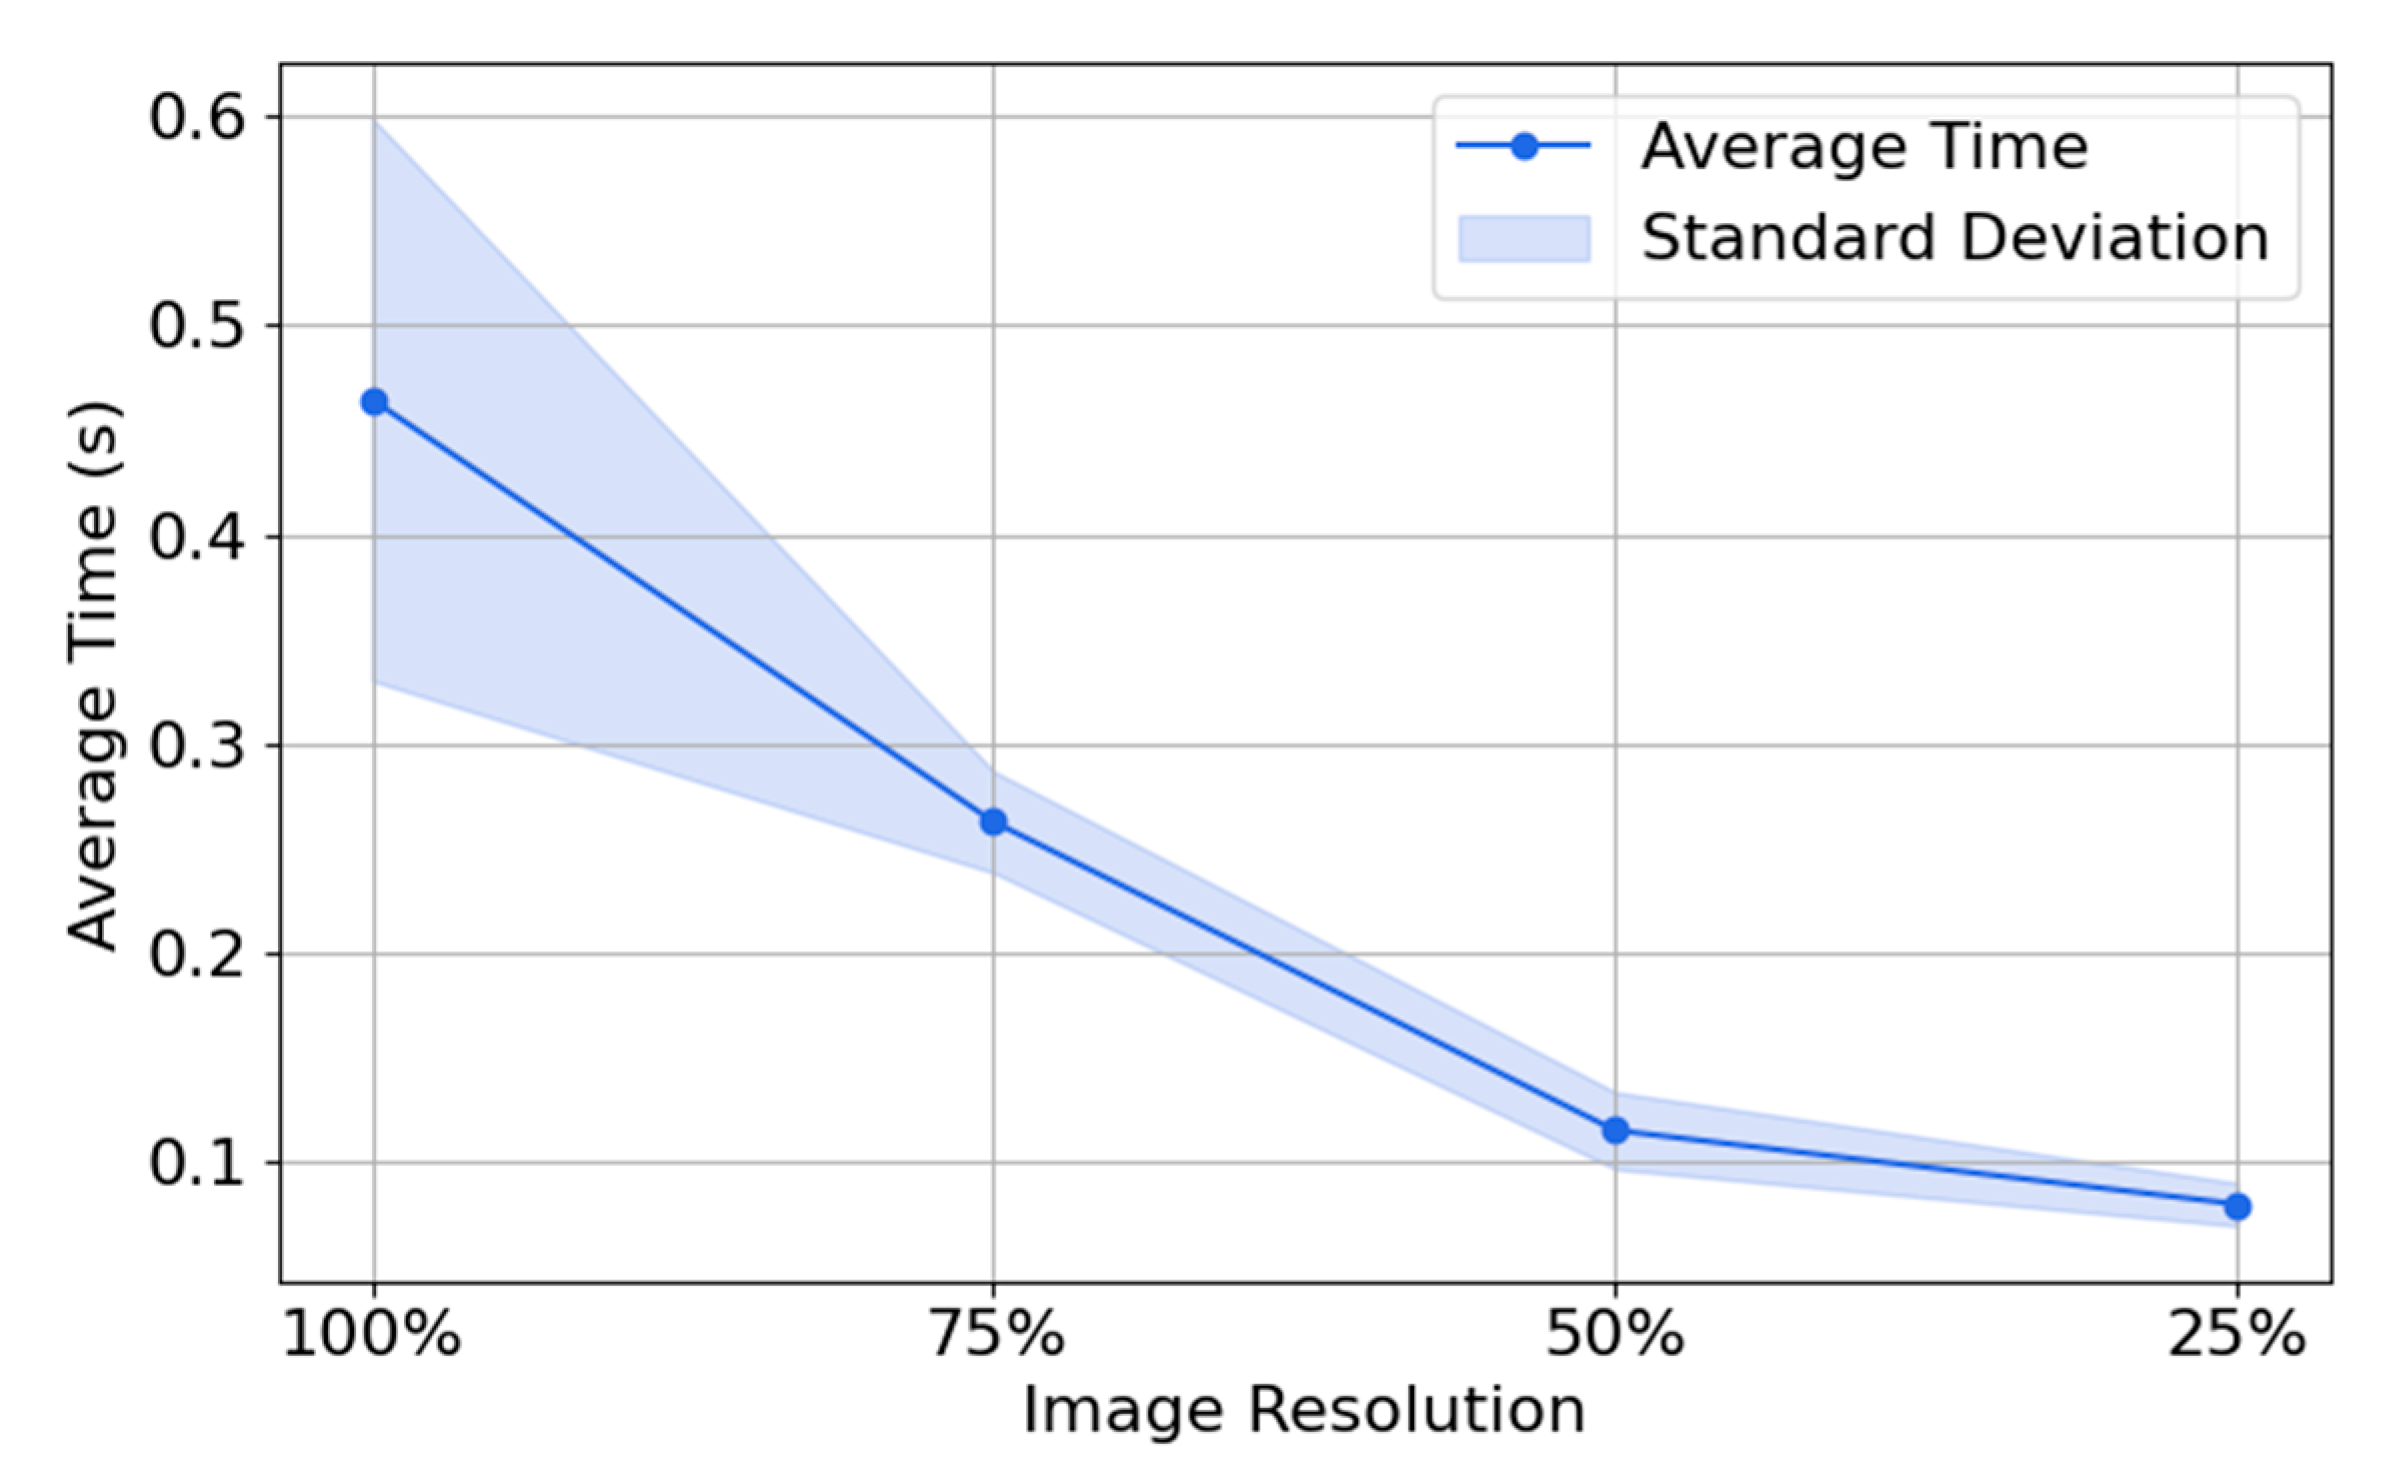
As shown in Table 1, the total execution time for the 100 images at maximum resolution (100%) was 46.47 s, corresponding to an average time of 0.4647 s per image. The total time includes overhead, i.e., time spent on operations other than those measured, such as image resizing and reading operations. Another observation is that the times decreased progressively as the resolution was reduced, reaching 7.95 s (0.0795 s/image) at 25% resolution (Figure 6).
The average processing time for all the measurements for each image, even at 100% resolution, was 0.46 s. Although the image was reduced to 25% of the original image, the processing time at this resolution corresponded to 17% of the original image (0.0795 s). Therefore, the decrease in resolution is not proportional to the decrease in processing time. The standard deviation decreased with resolution.
It is noteworthy that the proposed pipeline exhibits deterministic behavior and a stable per-image processing cost, with an average execution time below 0.5 s. This enables linear scalability with the number of images, as confirmed by tests involving datasets larger than those used in the present study. The main bottlenecks when scaling are not related to CPU time per image, but rather to Input/Output (IO) operations, storage, and data transmission, which fall outside the scope of this evaluation. Therefore, the feasibility of using the Raspberry Pi 4 Model B for implementing the HPM remains valid within the minimum forecasting horizon of 1 min.
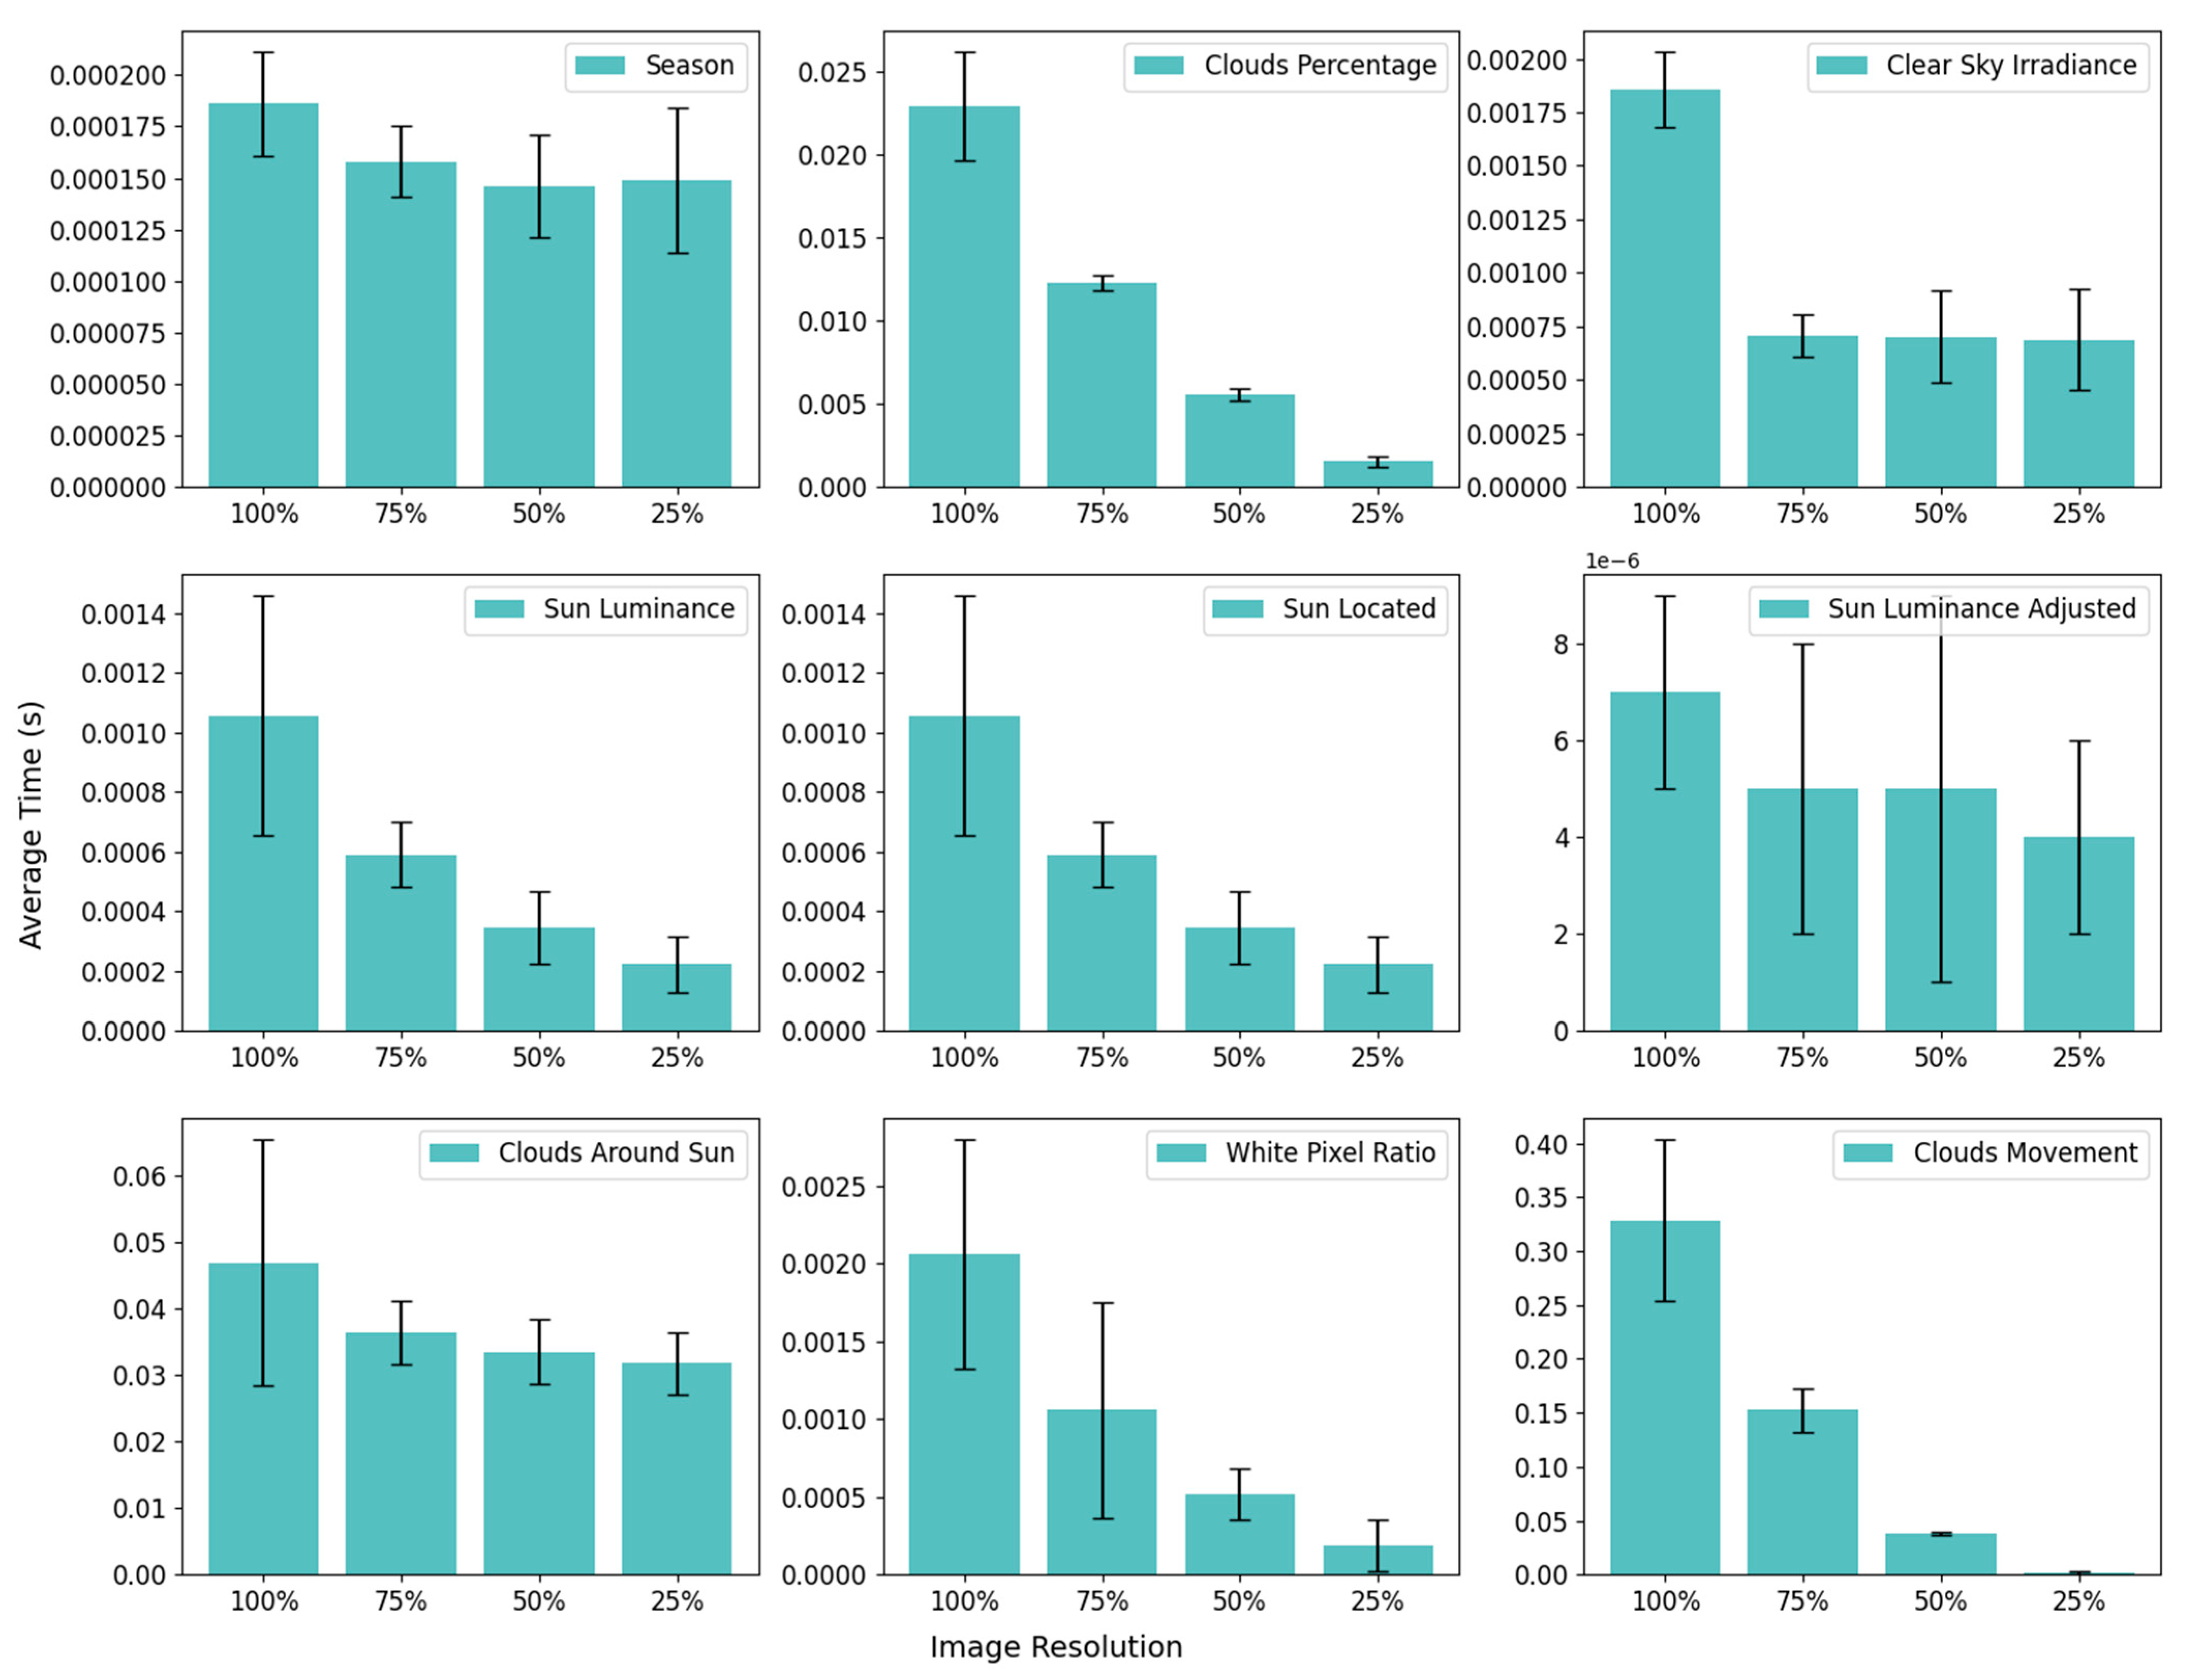
Table 2 and Figure 7 show the results of the average execution time, in seconds, for each measurement computed in the system, considering four different input re-solutions (100%, 75%, 50% and 25%). Each individual graph represents the average of a specific measure, accompanied by the standard deviation which shows the variability of the 100 runs.
In general, it can be seen that reducing the resolution of the images results in a significant drop in the average processing time for most of the measurements. This trend confirms the positive correlation between the volume of image data (resolution) and the computational cost of the operations, reinforcing the feasibility of running the system on embedded platforms with limited processing power.
In the case of the Sun Luminance, Localized Sun, Cloud Cover, Clear Sky Ir-radiance and Cloud Movement measurements, the reduction in resolution leads to a consistent and proportional reduction in average times. The Cloud Movement measure, in particular, has the highest absolute average execution time of all those analyzed (0.32 s), with a reduction of more than 80% when comparing the 100% and 25% resolutions. This reinforces the high computational cost of temporal analysis between frames, which can compromise real-time execution if not properly optimized.
Measurements such as Adjusted Sun Luminance and Clear Sky Irradiance showed average times in the order of microseconds, with very low variability, as they are computed with data processed in other measurements, indicating excellent performance and stability. This behavior makes these measurements compatible with embedded applications that require fast and continuous execution.
The Clouds Around the Sun graph has a relatively high average time, although it is less sensitive to resolution compared to other measurements. The persistence of a significant computational cost even at low resolution suggests that the approach adopted for this measure may be intrinsically costly, and is a candidate for future optimization in the HPM.
In summary, Figure 7 shows that reducing image resolution is an effective strategy for minimizing the execution time of the measurements in the HPM, although the behaviour is not homogeneous between the measurements. The Cloud Movement and White Pixel Rate measures should be carefully evaluated as to their relevance in the model, considering the possibility of re-implementation or replacement by more efficient approaches.
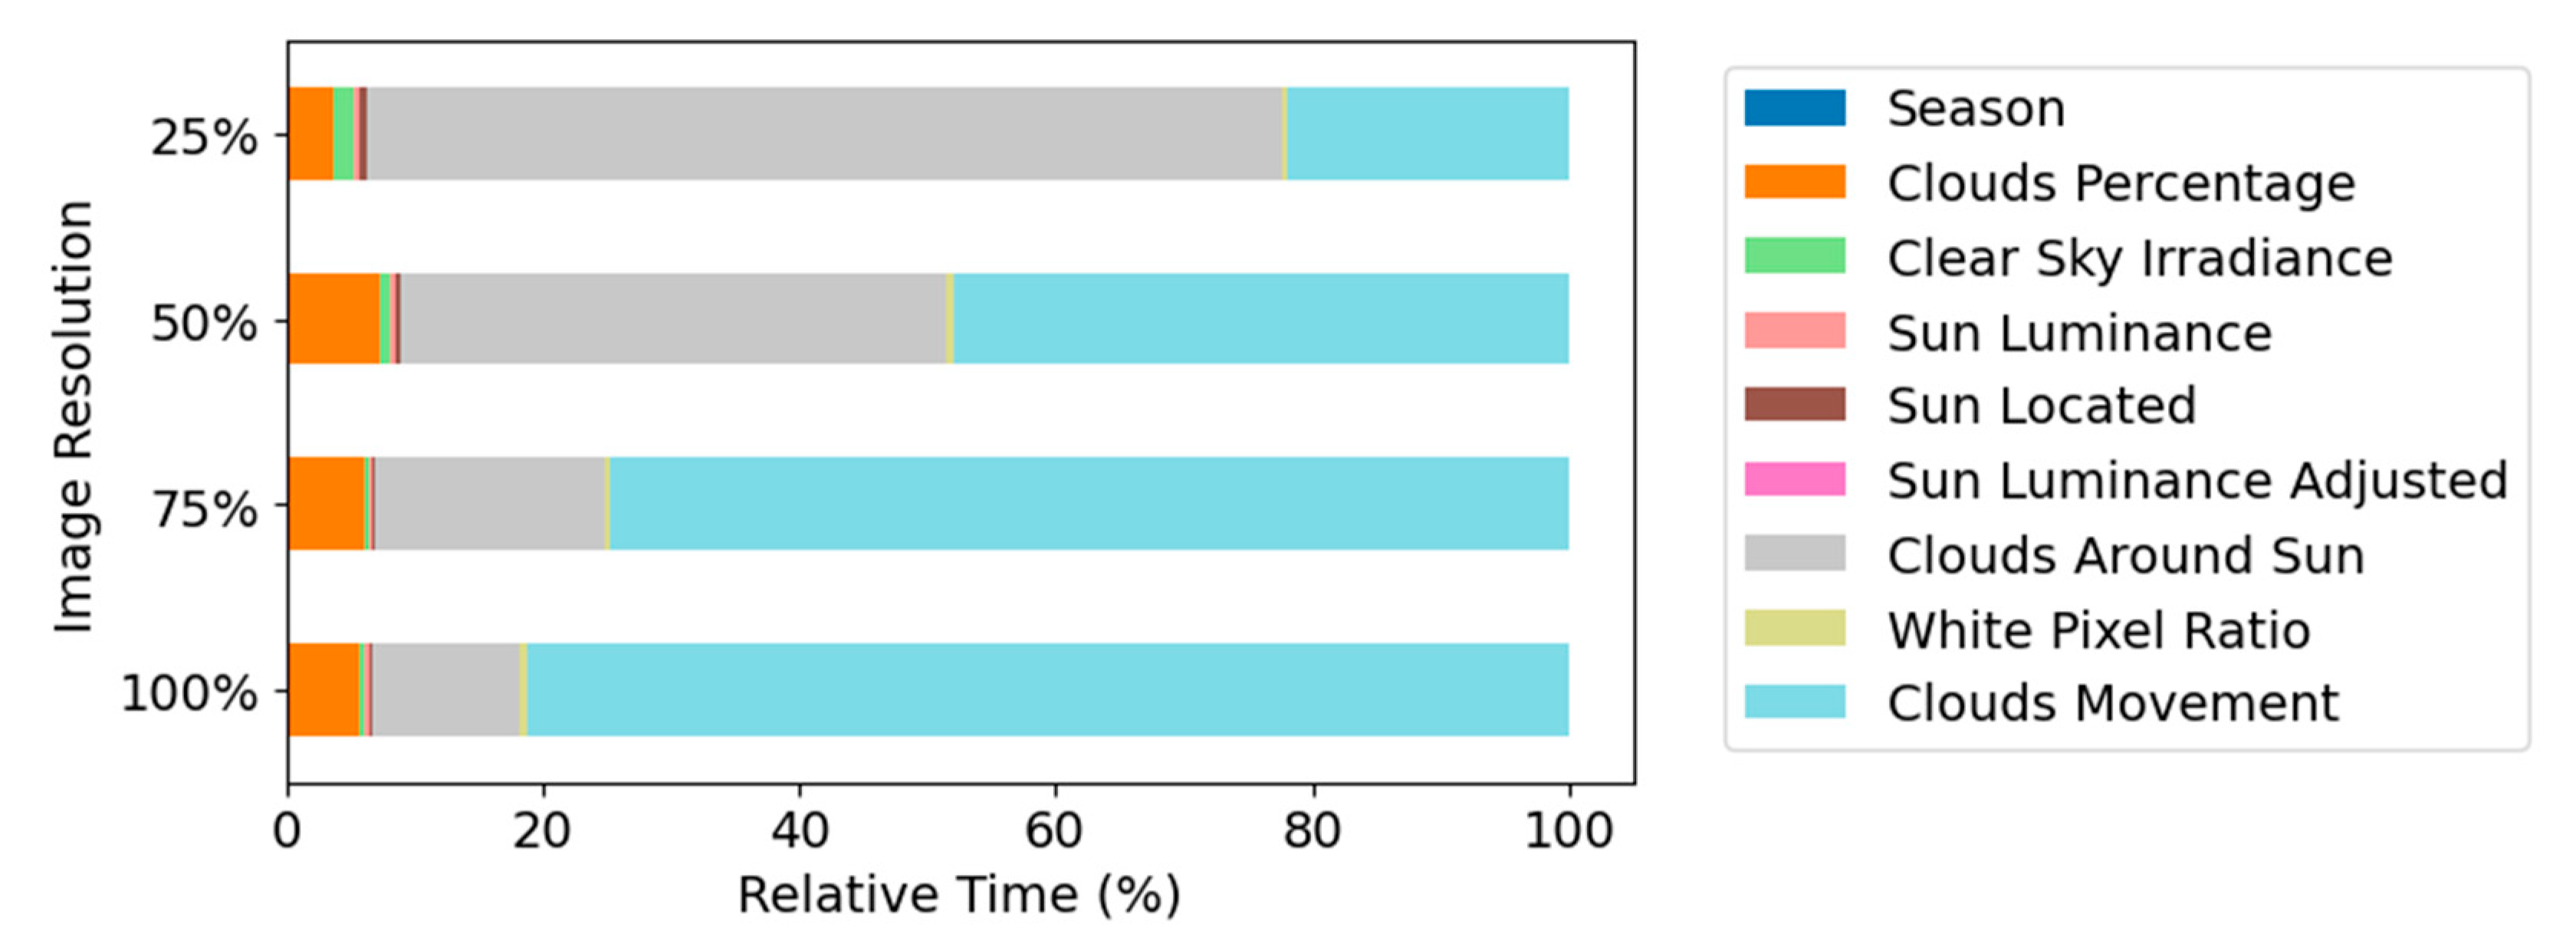
Table 3 shows the total execution time for each measure, considering the four resolutions. The Cloud Movement measure alone accounted for almost 80% of the computational processing load at 100% and 75% resolutions, making it the system’s main computational bottleneck at these resolutions. This predominance highlights the high computational cost associated with temporal analysis between successive frames. However, as the resolution is reduced, this measure suffers a notable proportional decrease, coming to represent a much smaller fraction of the total time at lower resolutions.
On the other hand, the measure of Clouds Around the Sun increases its computational demand as the resolution decreases, reaching more than 70% of the total processing at 25% resolution. This suggests that, despite the reduction in total execution time, the decrease in resolution redistributes the computational cost between the measurements, causing some to become more representative in relative terms. Measurements such as Adjusted Sun Luminance and Season had total times of less than 0.02 s, indicating that their computational cost is negligible (Figure 8).
The detailed profiling of HPM features revealed Cloud Movement as a computationally intensive yet highly informative component, consistent with its established relevance in minute-ahead forecasting using sky-imagers and optical flow techniques. Its predictive importance has been further validated through feature selection studies [21]. Despite the high cost, several optimization paths exist, including parallelizable alternatives such as Particle Swarm Optimization [44], sparse optical flow restricted to regions of interest, and sun-centered pixel reduction strategies demonstrated in low-cost IoT implementations [32,45]. These findings support future work on substituting or optimizing Cloud Movement within the HPM pipeline to balance accuracy and efficiency.
The processing time of less than 0.5 s per image refers specifically to the feature extraction stage of the HPM pipeline. Prior tests have shown that both image acquisition and model inference using TensorFlow Lite on Raspberry Pi 4 also operate independently below 1 s each. When combined, these components leave a substantial margin within the 1-min prediction horizon adopted by HPM. Since data is stored locally and no external transmission is required, the system avoids typical I/O bottlenecks. Literature on real-time deep learning inference on Raspberry Pi 4 supports the feasibility of continuous vision pipelines on edge devices [33], provided that asynchronous design and task orchestration are properly implemented.
In summary, the results show that image resolution has a direct impact on the distribution of processing time between measurements, as well as influencing the overall performance of the system. Reducing resolution is effective in reducing total execution time, but requires attention to possible noise caused by the resizing process, which can result in different values being calculated for each measurement and introduce errors. Therefore, the next section analyzes the impact of reducing image dimensionality on measurement results.

4.2. Resolutions and Associated Errors

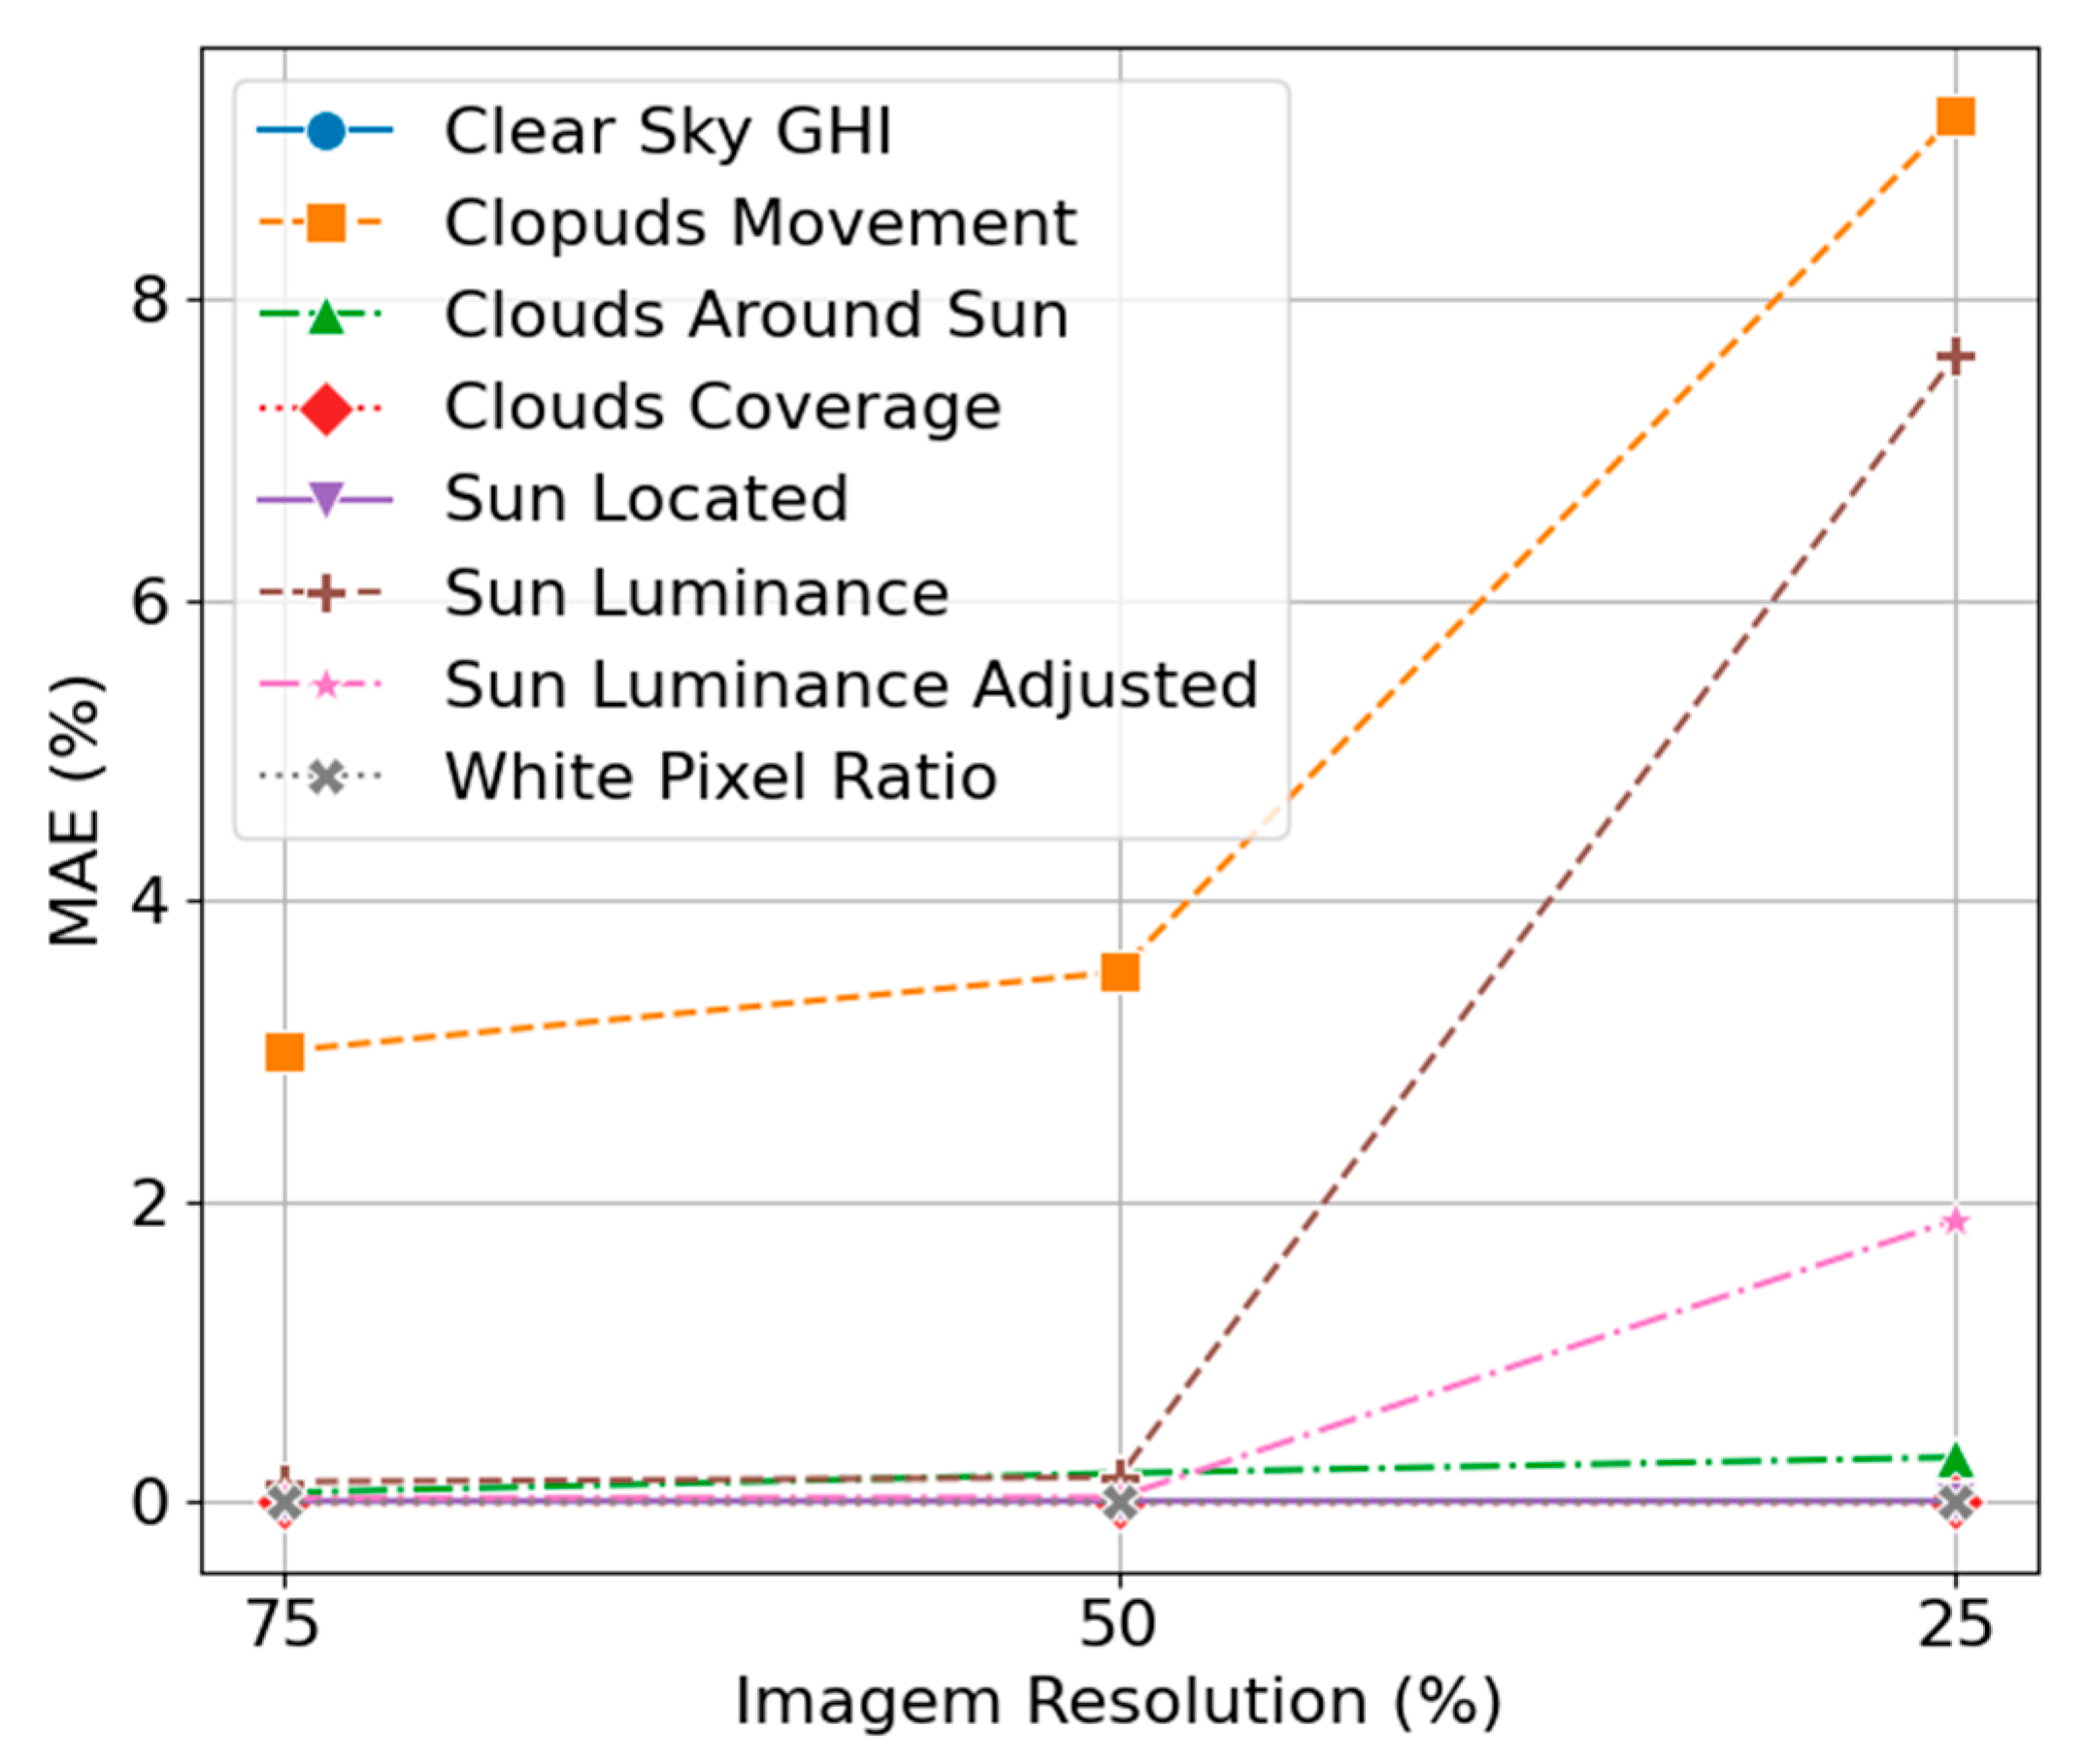
In order to evaluate and mitigate the influence that reducing the size of the images may have on the operation of the HPM, Table 4 shows a relative comparison of the processing times considered ideal (100% resolution) and values from the lower resolutions (75%, 50% and 25%). These are presented with the Mean Absolute Error (MAE) metric for each of the MH measurements. On the right is a graph showing the evolution of the percentage error as a function of resolution, showing the impact of reducing the image size on the results of the measurements (Figure 9).
The results show that reducing the resolution of the images has a non-uniform effect on the performance of the measurements. In general, when the resolution is reduced to 25%, especially from the 50% there is a significant increase in prediction errors, with the exception of the Clouds Movement measure, which at 75% resolution shows 3% error and, 25% show more than 9% error. It can be seen that as the resolution decreases, although the processing times decrease, the measurements that use the entire useful area of the image (Clouds Movement) or are based on the quality of the spatial detail of the images (Sun Luminance and Sun Luminance Adjusted) are the most affected, reflecting the progressive increase in their errors. On the other hand, variables such as Clear Sky GHI and Sun Located maintained constant and zero error values throughout all the resolutions, showing the robustness of the predictive models for these variables, or even the absence of relevant variation in the images for these parameters.
Based on the observed trade-off between processing time and error rates, we recommend using 50% image resolution as a practical balance point. At this level, the average processing time per image drops from approximately 0.46 s to 0.11 s, while the error for the most sensitive feature, Cloud Movement, remains below 4%. This resolution preserves predictive reliability while significantly improving computational efficiency. As shown in Figure 6, Cloud Movement is the most critical feature in terms of both processing cost and sensitivity to resolution, reinforcing the need for careful resolution selection in embedded deployments. Regarding the practical implementation of HPM, this study provides subsidies for its optimization and validation for execution on low-cost hardware with limited processing capacity, such as the Raspberry Pi 4 Model B.
Finally, the results show that reducing resolution is a valid strategy for reducing processing time, but should be applied with caution in image features that are sensitive to specific spatial characteristics, as Clouds Movement and Sun Luminance. The loss of accuracy was severe for measures such as Sun Luminance and Sun Luminance Adjusted, which can compromise their reliability at lower resolutions. This type of analysis guides decisions in the design of embedded computer vision systems, balancing computational performance and predictive accuracy.

4.3. Hypothesis Verification

The third axis of the analysis consisted of assessing the operational feasibility of running HPM on the Raspberry Pi 4 model B, with a focus on edge computing applications and real-time operation. The results show that the device is fully capable of performing the complete extraction of HPM measurements in less than 0.5 s per image, regardless of resolution. This time is considerably less than the 60-s limit adopted as a feasibility benchmark. Thus, the study’s central hypothesis was validated.

5. Conclusions

This study investigated the computational feasibility of running the Hybrid Prediction Method (HPM) for predicting photovoltaic solar energy generation (PPSEG) in a low-cost embedded environment. To this end, the processing time required to extract nine visual features from all-sky images was systematically and homogeneously evaluated using a Raspberry Pi 4 Model B at different image resolutions. The results showed that, even with limited computational resources, it is possible to run the complete proposed HPM pipeline efficiently, especially when the image resolution is properly adjusted. The suitability of Raspberry Pi for edge computing has also been corroborated by other recent studies in the scientific literature, which additionally report improvements in power quality [32,33,35,46,47].
The central contribution of this work lies in the practical validation of a hybrid method for on-board solar forecasting, demonstrating its operationalization on accessible devices, as well as providing a derived data set with high reuse potential. Although there are studies on the processing performance of the Raspberry Pi 4 in the literature, in the context of HPM, this is the first study to evaluate the image processing performance of the Raspberry Pi 4 in different image processing techniques, including results related to different image resolutions, enabling the optimization of HPM. In addition, this study fills a relevant gap in the literature by addressing not only predictive performance, but also the computational constraints of the execution environment, which is a critical aspect for the advancement of edge computing solutions applied to renewable energy. According to the results, in addition to validating the use of the Raspberry Pi 4 Model B in HPM, it is recommended to use a resolution of 50% as the best cost-benefit ratio between processing and accuracy.
However, some limitations were identified, such as the absence of a complete predictive evaluation of the on-board HPM, the use of data restricted from a single region, the absence of multi-device and real-time flow tests, the failure to consider concurrent executions, combined with the absence of other studies using the HPM for comparison. As future prospects, it is proposed to evaluate the final predictive performance of the embedded HPM model using images with lower resolutions, as well as optimizations in the processing of the original HPM measurements, mainly the Clouds Movement, and the complete HPM pipeline, including image capture in real time, processing, and inference with machine learning models.

Author Contributions

Conceptualization: W.Z., J.N.M., D.P. and O.H.A.J.; methodology: D.P. and J.N.M.; validation: D.P., W.Z., J.N.M. and J.J.G.L.; investigation and simulation: D.P. and J.N.M.; writing—original draft preparation: D.P. and J.N.M.; writing—review and editing: J.N.M., J.J.G.L., M.R.C. and O.H.A.J.; project administration: J.N.M., M.R.C. and O.H.A.J. All authors have read and agreed to the published version of the manuscript.

Funding

This research was partially supported by Pro-Reitoria of Research and Graduate Studies of Federal University of Latin America Integration (PRPPG-UNILA), and the FACEPE agency (Fundação de Amparo a Pesquisa de Pernambuco) throughout the project with references APQ-0616-9.25/21 and APQ-0642-9.25/22. O.H.A.J. was funded by the Brazilian National Council for Scientific and Technological Development (CNPq), grant numbers 407531/2018-1, 303293/2020-9, 405385/2022-6, 405350/2022-8 and 406662/2022-3.

Institutional Review Board Statement

Not applicable.

Informed Consent Statement

Not applicable.

Data Availability Statement

Data are contained within the article.

Acknowledgments

The authors would like to thank the Federal University of Latin American Integration (UNILA), the Pro-Rectory for Research and Graduate Studies (PRPPG), and the Applied Computing Laboratory (LACA) for their financial support and facilities. The authors would like to thank [27] or the provided dataset [18] for the source code made available.

Conflicts of Interest

The authors declare no conflict of interest.

References

  1. International Energy Agency. Global Energy Review 2025; IEA: Paris, France, 2025; p. 43. [Google Scholar]
  2. Li, Y.; Wang, R.; Li, Y.; Zhang, M.; Long, C. Wind Power Forecasting Considering Data Privacy Protection: A Federated Deep Reinforcement Learning Approach. Appl. Energy 2023, 329, 120291. [Google Scholar] [CrossRef]
  3. ABSOLAR. Brasil Ultrapassa Marca de 42 GW de Potência Instalada; Associação Brasileira de Energia Solar: São Paulo, Brazil, 2024. [Google Scholar]
  4. ANEEL. Sistema de Informações de Geração da ANEEL—SIGA. Available online: https://bit.ly/2IGf4Q0 (accessed on 20 July 2022).
  5. ABSOLAR. Energia Solar Fotovoltaica No Brasil—Infográfico ABSOLAR. Available online: https://www.absolar.org.br/mercado/infografico (accessed on 20 July 2022).
  6. Da Rosa, A.R.O.; Gasparin, F.P. Panorama da Energia Solar Fotovoltaica no Brasil. Rev. Bras. Energ. Sol. 2016, 7, 140–147. [Google Scholar]
  7. Rezende, J.O. (Ed.) A Importância Da Energia Solar Para o Desenvolvimento Sustentável; Atena Editora: Ponta Grossa, Brazil, 2019; ISBN 978-85-7247-616-4. [Google Scholar]
  8. Antonanzas, J.; Osorio, N.; Escobar, R.; Urraca, R.; Martinez-de-Pison, F.J.; Antonanzas-Torres, F. Review of Photovoltaic Power Forecasting. Sol. Energy 2016, 136, 78–111. [Google Scholar] [CrossRef]
  9. Maciel, J.N.; Ledesma, J.J.G.; Ando Junior, O.H. Forecasting Solar Power Output Generation: A Systematic Review with the Proknow-C. IEEE Lat. Am. Trans. 2021, 19, 612–624. [Google Scholar] [CrossRef]
  10. Ying, C.; Wang, W.; Yu, J.; Li, Q.; Yu, D.; Liu, J. Deep Learning for Renewable Energy Forecasting: A Taxonomy, and Systematic Literature Review. J. Clean. Prod. 2023, 384, 135414. [Google Scholar] [CrossRef]
  11. Das, U.K.; Tey, K.S.; Seyedmahmoudian, M.; Mekhilef, S.; Idris, M.Y.I.; Van Deventer, W.; Horan, B.; Stojcevski, A. Forecasting of Photovoltaic Power Generation and Model Optimization: A Review. Renew. Sustain. Energy Rev. 2018, 81, 912–928. [Google Scholar] [CrossRef]
  12. Du, P.; Lu, N. Energy Storage for Smart Grids: Planning and Operation for Renewable and Variable Energy Resources (VERs); Elsevier: Amsterdam, The Netherlands, 2014; ISBN 978-0-12-409543-4. [Google Scholar]
  13. Torres, N.N.S.; Diaz, V.N.S.; Ando Junior, O.H.; Ledesma, J.J.G. Analysis of the Technical Feasibility of Using Artificial Intelligence for Smoothing Active Power in a Photovoltaic System Connected to the Power System. Braz. Arch. Biol. Technol. 2021, 64, e2021210196. [Google Scholar] [CrossRef]
  14. Ellis, A.; Schoenwald, D.; Hawkins, J.; Willard, S.; Arellano, B. PV Output Smoothing with Energy Storage. In Proceedings of the 2012 38th IEEE Photovoltaic Specialists Conference, Austin, TX, USA, 3–8 June 2012; pp. 1523–1528. [Google Scholar] [CrossRef]
  15. Barhmi, K.; Heynen, C.; Golroodbari, S.; Van Sark, W. A Review of Solar Forecasting Techniques and the Role of Artificial Intelligence. Solar 2024, 4, 99–135. [Google Scholar] [CrossRef]
  16. Mayer, M.J. Benefits of Physical and Machine Learning Hybridization for Photovoltaic Power Forecasting. Renew. Sustain. Energy Rev. 2022, 168, 112772. [Google Scholar] [CrossRef]
  17. Dev, S.; Savoy, F.M.; Lee, Y.H.; Winkler, S. Estimating Solar Irradiance Using Sky Imagers. Atmos. Meas. Tech. 2019, 12, 5417–5429. [Google Scholar] [CrossRef]
  18. Maciel, J.N.; Ledesma, J.J.G.; Ando Junior, O.H. Hybrid Prediction Method of Solar Irradiance Applied to Short-Term Photovoltaic Energy Generation. Renew. Sustain. Energy Rev. 2024, 192, 114185. [Google Scholar] [CrossRef]
  19. Rajagukguk, R.A.; Kamil, R.; Lee, H.-J. A Deep Learning Model to Forecast Solar Irradiance Using a Sky Camera. Appl. Sci. 2021, 11, 5049. [Google Scholar] [CrossRef]
  20. Nie, Y.; Li, X.; Scott, A.; Sun, Y.; Venugopal, V.; Brandt, A. SKIPP’D: A SKy Images and Photovoltaic Power Generation Dataset for Short-Term Solar Forecasting. Sol. Energy 2023, 255, 171–179. [Google Scholar] [CrossRef]
  21. Maciel, J.N.; Campoi, G.d.S.; Zalewski, W.; Ledesma, J.J.G.; Ando Junior, O.H. Optimizing Solar Irradiance Prediction: Feature Selection for All-Sky Image Processing Using a Hybrid Prediction Method. IEEE Lat. Am. Trans. 2025, 23, 50–57. [Google Scholar] [CrossRef]
  22. Maciel, J.N.; Ledesma, J.J.G.; Ando Junior, O.H. Dataset for Machine Learning: Explicit All-Sky Image Features to Enhance Solar Irradiance Prediction. Data 2024, 9, 113. [Google Scholar] [CrossRef]
  23. Serrano Ardila, V.M.; Maciel, J.N.; Ledesma, J.J.G.; Ando Junior, O.H. Fuzzy Time Series Methods Applied to (In)Direct Short-Term Photovoltaic Power Forecasting. Energies 2022, 15, 845. [Google Scholar] [CrossRef]
  24. Wentz, V.H.; Maciel, J.N.; Gimenez Ledesma, J.J.; Ando Junior, O.H. Solar Irradiance Forecasting to Short-Term PV Power: Accuracy Comparison of ANN and LSTM Models. Energies 2022, 15, 2457. [Google Scholar] [CrossRef]
  25. Chityala, R.; Pudipeddi, S. Image Processing and Acquisition Using Python; Chapman & Hall/CRC Mathematical and Computational Imaging Sciences Series; CRC Press: Boca Raton, FL, USA, 2014; ISBN 978-1-4665-8376-4. [Google Scholar]
  26. Russell, S.; Norvig, P. Artificial Intelligence: A Modern Approach, 4th ed.; Pearson Education: London, UK, 2020; Volume 1, ISBN 978-1-292-40113-3. [Google Scholar]
  27. Pedro, H.T.C.; Larson, D.P.; Coimbra, C.F.M. A Comprehensive Dataset for the Accelerated Development and Benchmarking of Solar Forecasting Methods. J. Renew. Sustain. Energy 2019, 11, 036102. [Google Scholar] [CrossRef]
  28. Kurniawan, A. Getting Started with Raspberry Pi 4; PE Press: Berkeley, USA, 2019. [Google Scholar]
  29. Khan, W.Z.; Ahmed, E.; Hakak, S.; Yaqoob, I.; Ahmed, A. Edge Computing: A Survey. Future Gener. Comput. Syst. 2019, 97, 219–235. [Google Scholar] [CrossRef]
  30. Karthikeyan, S.; Raj, R.A.; Cruz, M.V.; Chen, L.; Vishal, J.L.A.; Rohith, V.S. A Systematic Analysis on Raspberry Pi Prototyping: Uses, Challenges, Benefits, and Drawbacks. IEEE Internet Things J. 2023, 10, 14397–14417. [Google Scholar] [CrossRef]
  31. Chen, T.; Liu, D. Machine Learning and Big Data on Raspberry Pi: A Performance Evaluation. In Proceedings of the 23rd ACM Conference on Embedded Networked Sensor Systems, Irvine, CA, USA, 6–9 May 2025; pp. 648–649. [Google Scholar]
  32. Sukič, P.; Štumberger, G. Intra-Minute Cloud Passing Forecasting Based on a Low Cost IoT Sensor—A Solution for Smoothing the Output Power of PV Power Plants. Sensors 2017, 17, 1116. [Google Scholar] [CrossRef]
  33. Venitourakis, G.; Vasilakis, C.; Tsagkaropoulos, A.; Amrou, T.; Konstantoulakis, G.; Golemis, P.; Reisis, D. Neural Network-Based Solar Irradiance Forecast for Edge Computing Devices. Information 2023, 14, 617. [Google Scholar] [CrossRef]
  34. Mysiuk, R. Analysis of Effective Image Processing Metrics on Raspberry Pi and Nvidia Jetson Nano. ELIT 2024, 28, 774. [Google Scholar] [CrossRef]
  35. Greco, D.; Fasihiany, M.; Ranjbar, A.V.; Masulli, F.; Rovetta, S.; Cabri, A. Computer Vision Algorithms on a Raspberry Pi 4 for Automated Depalletizing. Algorithms 2024, 17, 363. [Google Scholar] [CrossRef]
  36. Pereira, E.d.S. Defisheye. Available online: https://github.com/duducosmos/defisheye (accessed on 30 July 2022).
  37. Shields, J.E.; Johnson, R.W.; Koehler, T.L. Automated Whole Sky Imaging Systems for Cloud Field Assessment. In Proceedings of the Fourth Symposium on Global Change Studies of the American Meteorological Society, Boston, MA, USA, 17–22 January 1993. [Google Scholar]
  38. Otsu, N. A Threshold Selection Method from Gray-Level Histograms. IEEE Trans. Syst. Man Cybern. 1979, 9, 62–66. [Google Scholar] [CrossRef]
  39. Ineichen, P.; Perez, R. A New Airmass Independent Formulation for the Linke Turbidity Coefficient. Sol. Energy 2002, 73, 151–157. [Google Scholar] [CrossRef]
  40. Holmgren, W.F.; Hansen, C.W.; Mikofski, M.A. Pvlib Python: A Python Package for Modeling Solar Energy Systems. J. Open Source Softw. 2018, 3, 884. [Google Scholar] [CrossRef]
  41. ITU. Parameter Values for the HDTV Standards for Production and International Programme Exchange; International Telecommunication Union (ITU): Geneva, Switzerland, 2015; pp. 1–17. [Google Scholar]
  42. Gay, W. Raspberry Pi Hardware Reference; Apress: Berkeley, CA, USA, 2014; ISBN 1-4842-0800-5. [Google Scholar]
  43. Kurniawan, A. Programming on Raspbian OS. In Raspbian OS Programming with the Raspberry Pi: IoT Projects with Wolfram, Mathematica, and Scratch; Kurniawan, A., Ed.; Apress: Berkeley, CA, 2019; pp. 79–96. ISBN 978-1-4842-4212-4. [Google Scholar]
  44. Zuo, H.-M.; Qiu, J.; Li, F.-F. An Improved Cross-Correlation Method for Efficient Clouds Forecasting. Theor. Appl. Climatol. 2024, 155, 6491–6505. [Google Scholar] [CrossRef]
  45. Wood-Bradley, P.; Zapata, J.; Pye, J. Cloud Tracking with Optical Flow for Short-Term Solar Forecasting. In Proceedings of the 50th Conference of the Australian Solar Energy Society, Hawthorn, Australia, 6–7 December 2012. [Google Scholar]
  46. Junior, O.H.A.; Bretas, A.S.; Leborgne, R.C. Methodology for Calculation and Management for Indicators of Power Quality Energy. IEEE Lat. Am. Trans. 2015, 13, 2217–2224. [Google Scholar] [CrossRef]
  47. Gimenes, T.K.; Silva, M.P.C.; Ledesma, J.J.G.; Junior, O.H.A. Impact of Distributed Energy Resources on Power Quality: Brazilian Scenario Analysis. Electr. Power Syst. Res. 2022, 211, 108249. [Google Scholar] [CrossRef]
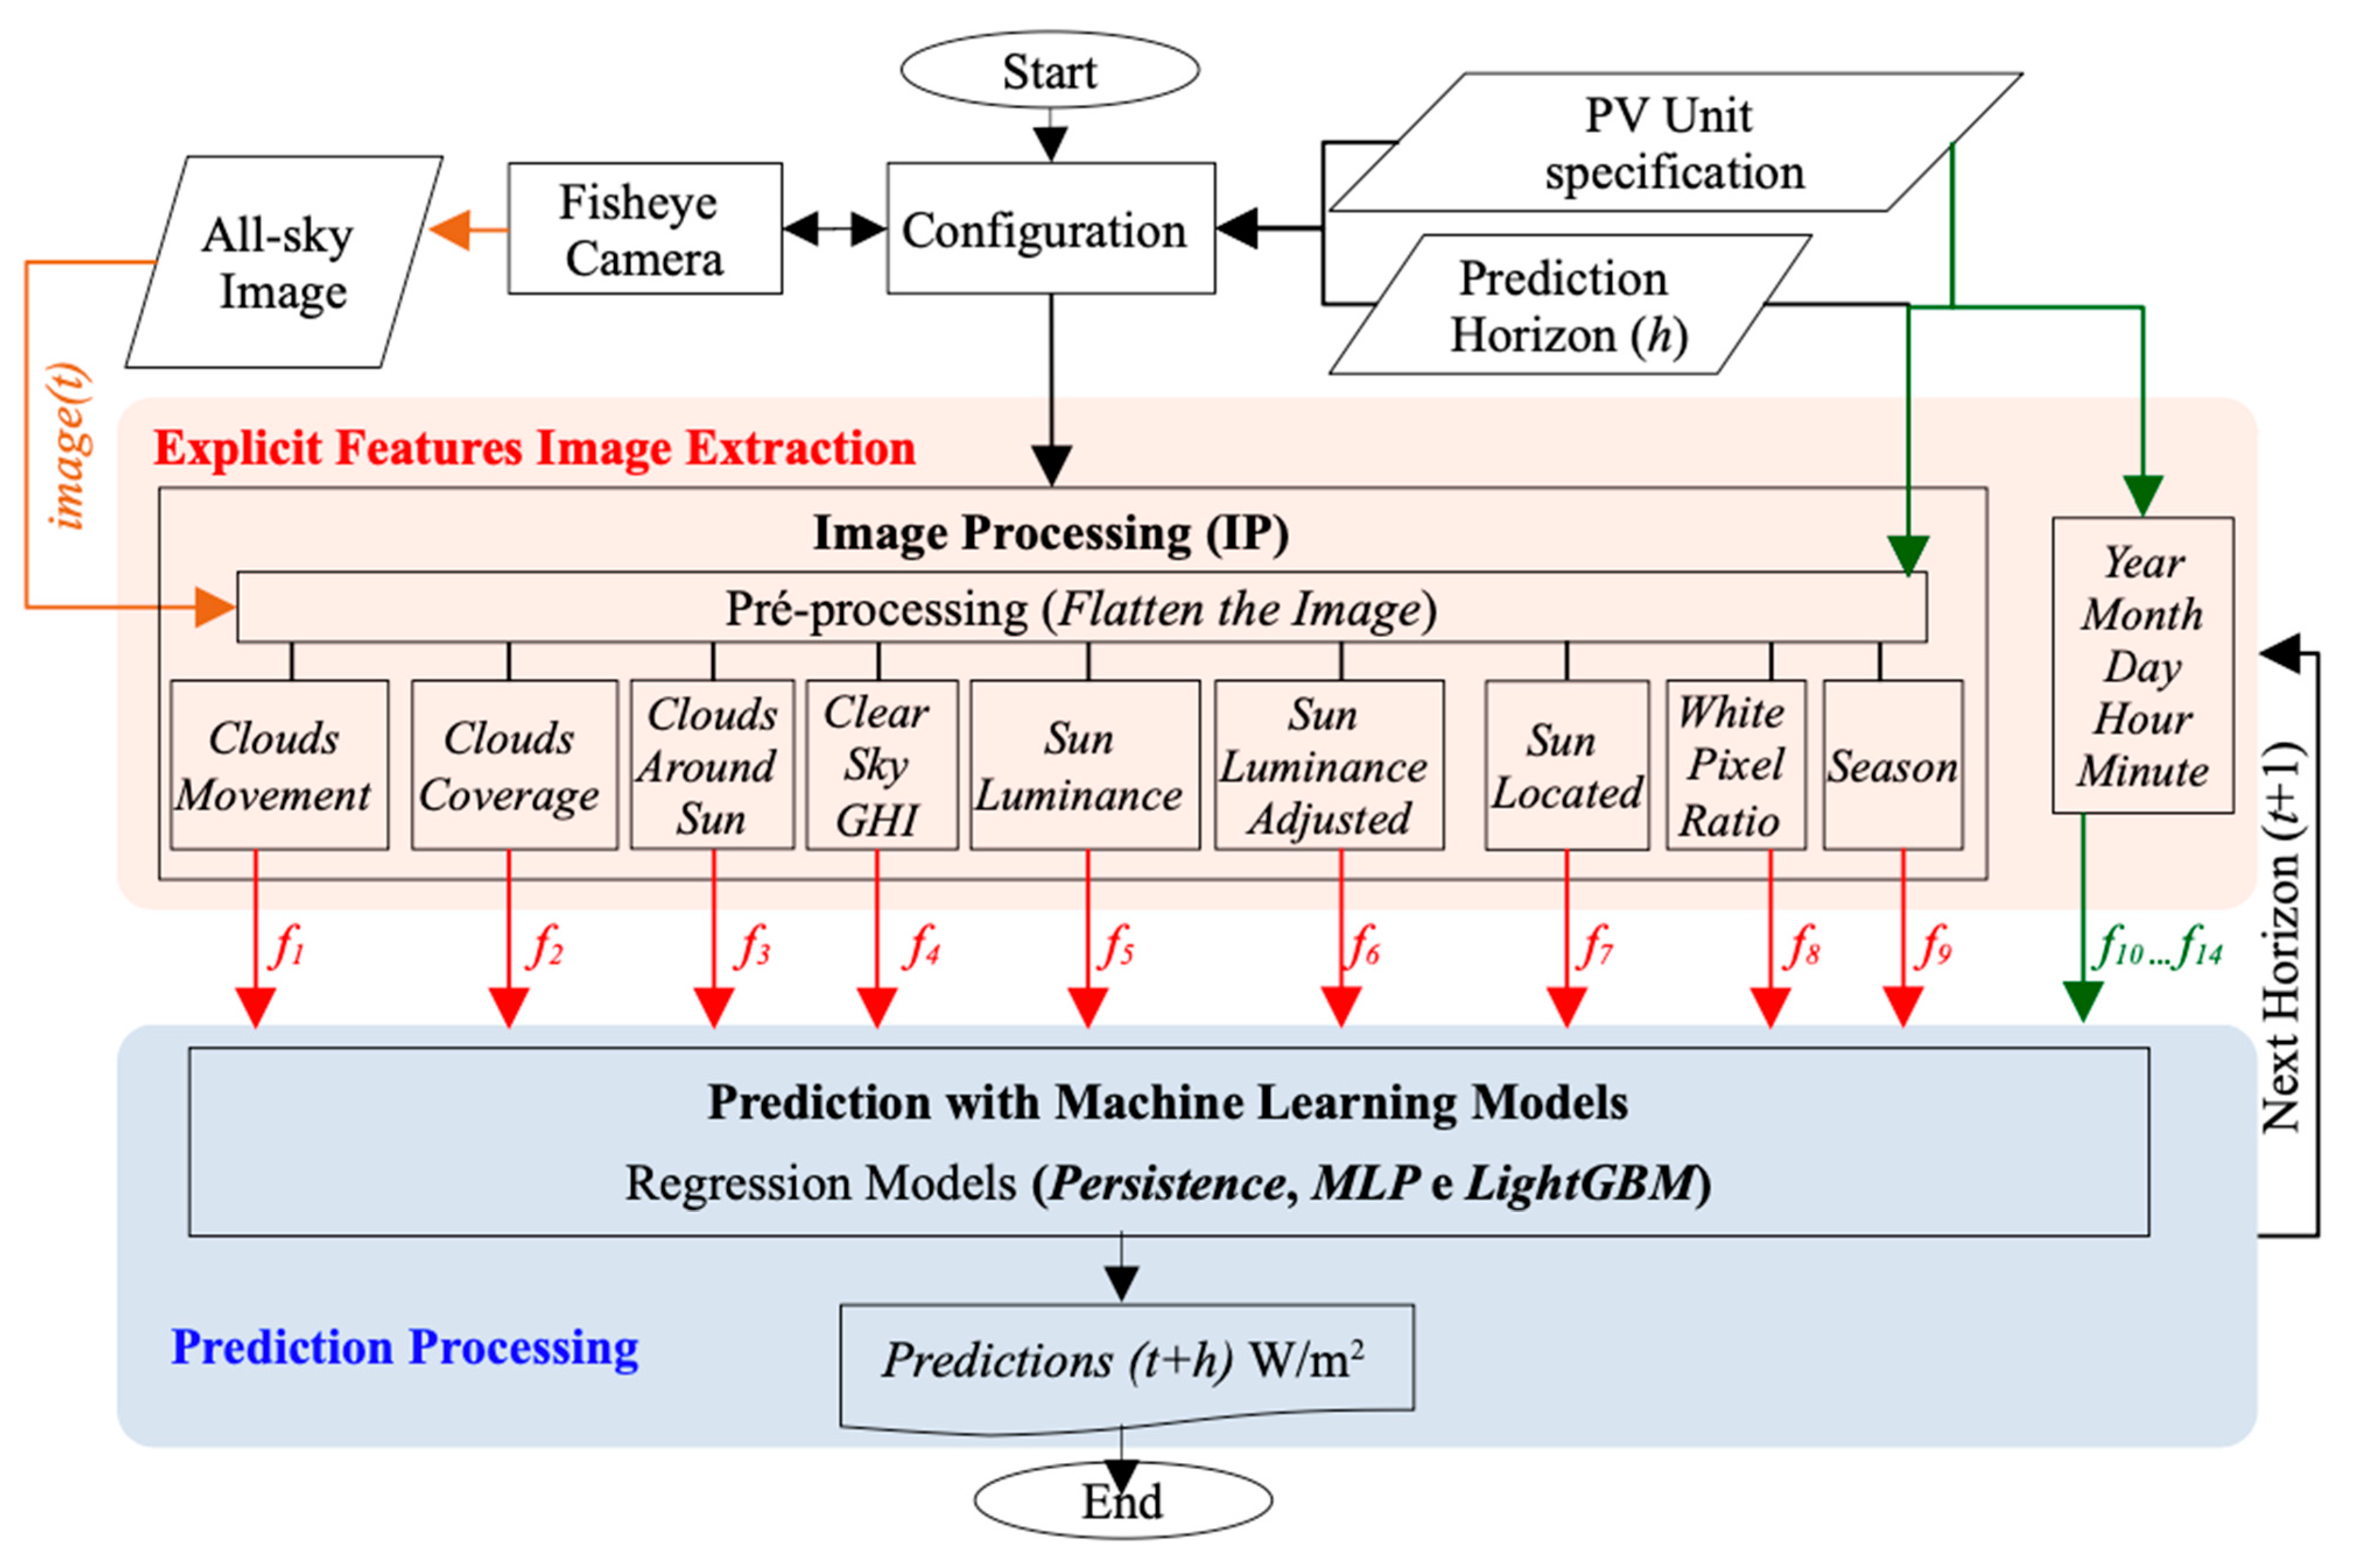
Figure 1. Hybrid Prediction Method (HPM) architecture. Source: [18].
Eng 06 00255 g001
Figure 2. All-sky image examples extracted from [27].
Eng 06 00255 g002
Figure 3. Measures extracted from all-sky images by the HPM and the target global horizontal irradiance for three consecutive days (13–15 March 2016). From top to bottom: Clouds Movement, Clouds Coverage, Clouds Around Sun, Clear-Sky GHI, Sun Luminance, Sun Luminance Adjusted, Sun Located, White Pixel Ratio, and Folsom GHI (target prediction).
Eng 06 00255 g003
Figure 4. Used device and evaluated system architecture.
Eng 06 00255 g004
Figure 5. Stages of the adopted experimental method.
Eng 06 00255 g005
Figure 6. Visual representation of all processing times.
Eng 06 00255 g006
Figure 7. Average individual processing time (seconds) of the each HPM features per resolution.
Eng 06 00255 g007
Figure 8. Relative processing time of the features per image resolution.
Eng 06 00255 g008
Figure 9. Relative error rates from 100% image resolution.
Eng 06 00255 g009
Table 1. Processing time of all measurements for all images.
Resolution (%)Overall Time (s)Average Time Per Image
(s)
Standard Deviation (s)
10046.470.46470.1345
7526.250.26240.0242
5011.480.11480.0184
257.950.07950.0103
Table 2. Total and relative execution time (in seconds) per feature of HPM and image resolution.
Resolution SeasonClouds
Coverage
Clear Sky
GHI
Sun
Luminance
Sun LocatedSun Luminance AdjustedClouds Sun AroundWhite Pixel
Ratio
Clouds
Movement
100% x ¯ 0.0001860.0228860.0018530.0010560.0010560.0000070.0468780.0020590.328674
σ 0.0000250.0032340.0001760.0004010.0004010.0000020.0184050.0007350.074285
75% x ¯ 0.0001580.0122380.0007080.0005890.0005890.0000050.0364460.0010570.152672
σ 0.0000170.0004610.0000970.0001090.0001090.0000030.0047410.0006920.020495
50% x ¯ 0.0001460.0055460.0007010.0003450.0003450.0000050.0335210.0005150.037913
σ 0.0000250.0003790.0002150.0001220.0001220.0000040.0047950.0001640.001190
25% x ¯ 0.0001490.0015500.0006870.0002220.0002220.0000040.0317290.0001860.001910
σ 0.0000350.0003190.0002380.0000930.0000930.0000020.0046130.0001630.000997
Table 3. Execution time (in seconds) per feature and resolution for all (100) images.
HPM Computed FeaturesResolution 100%Resolution 75%Resolution 50%Resolution 25%
Clouds Movement32.86715.2673.7910.997
Clouds Around Sun4.6883.6453.3523.236
Clouds Coverage2.2891.2240.5550.155
White Pixel Ratio0.2060.1060.0510.019
Clear Sky GHI0.1850.0710.0700.069
Sun Luminance0.1060.0590.0340.022
Sun Located0.1060.0590.0340.022
Sun Luminance Adjusted0.0010.0010.00050.0005
Season0.0190.0160.0150.015
Table 4. Execution time relative to 100% of the resolution.
HPM FeaturesMean Absolute Error (MAE)
75%50%25%
Clouds Movement2.99793.52299.2122
Clouds Coverage0.00030.00040.0005
Clear Sky GHI0.00000.00000.0000
Sun Luminance 013400.16367.6157
Sun Luminance Adjusted0.02580.03231.8763
Sun Located0.00000.00000.0000
Clouds Sun Around0.06280.19110.2971
White Pixel Ratio0.00020.00010.0005
Disclaimer/Publisher’s Note: The statements, opinions and data contained in all publications are solely those of the individual author(s) and contributor(s) and not of MDPI and/or the editor(s). MDPI and/or the editor(s) disclaim responsibility for any injury to people or property resulting from any ideas, methods, instructions or products referred to in the content.