3.2. X-Ray Diffraction (XRD)
X-ray diffraction (XRD) patterns provide valuable insights into the crystalline phases present, allowing an assessment of the composition within hydrated cementitious materials. Typically, peak height correlates with the degree of crystallinity and is indicative of the quantity of crystal components. In standard practice, peaks around 2θ ≈ 18° (001) and 34° (101) are often attributed to calcium hydroxide (CH). C-S-H is an amorphous/low-order phase, usually appearing only as a broad diffuse peak (‘hump’) in the range of 20–38°, and does not show sharp diffraction peaks; the sharp peaks appearing around 28–32° are more likely to come from other crystalline phases (such as residual/generated calcium silicate or quartz).
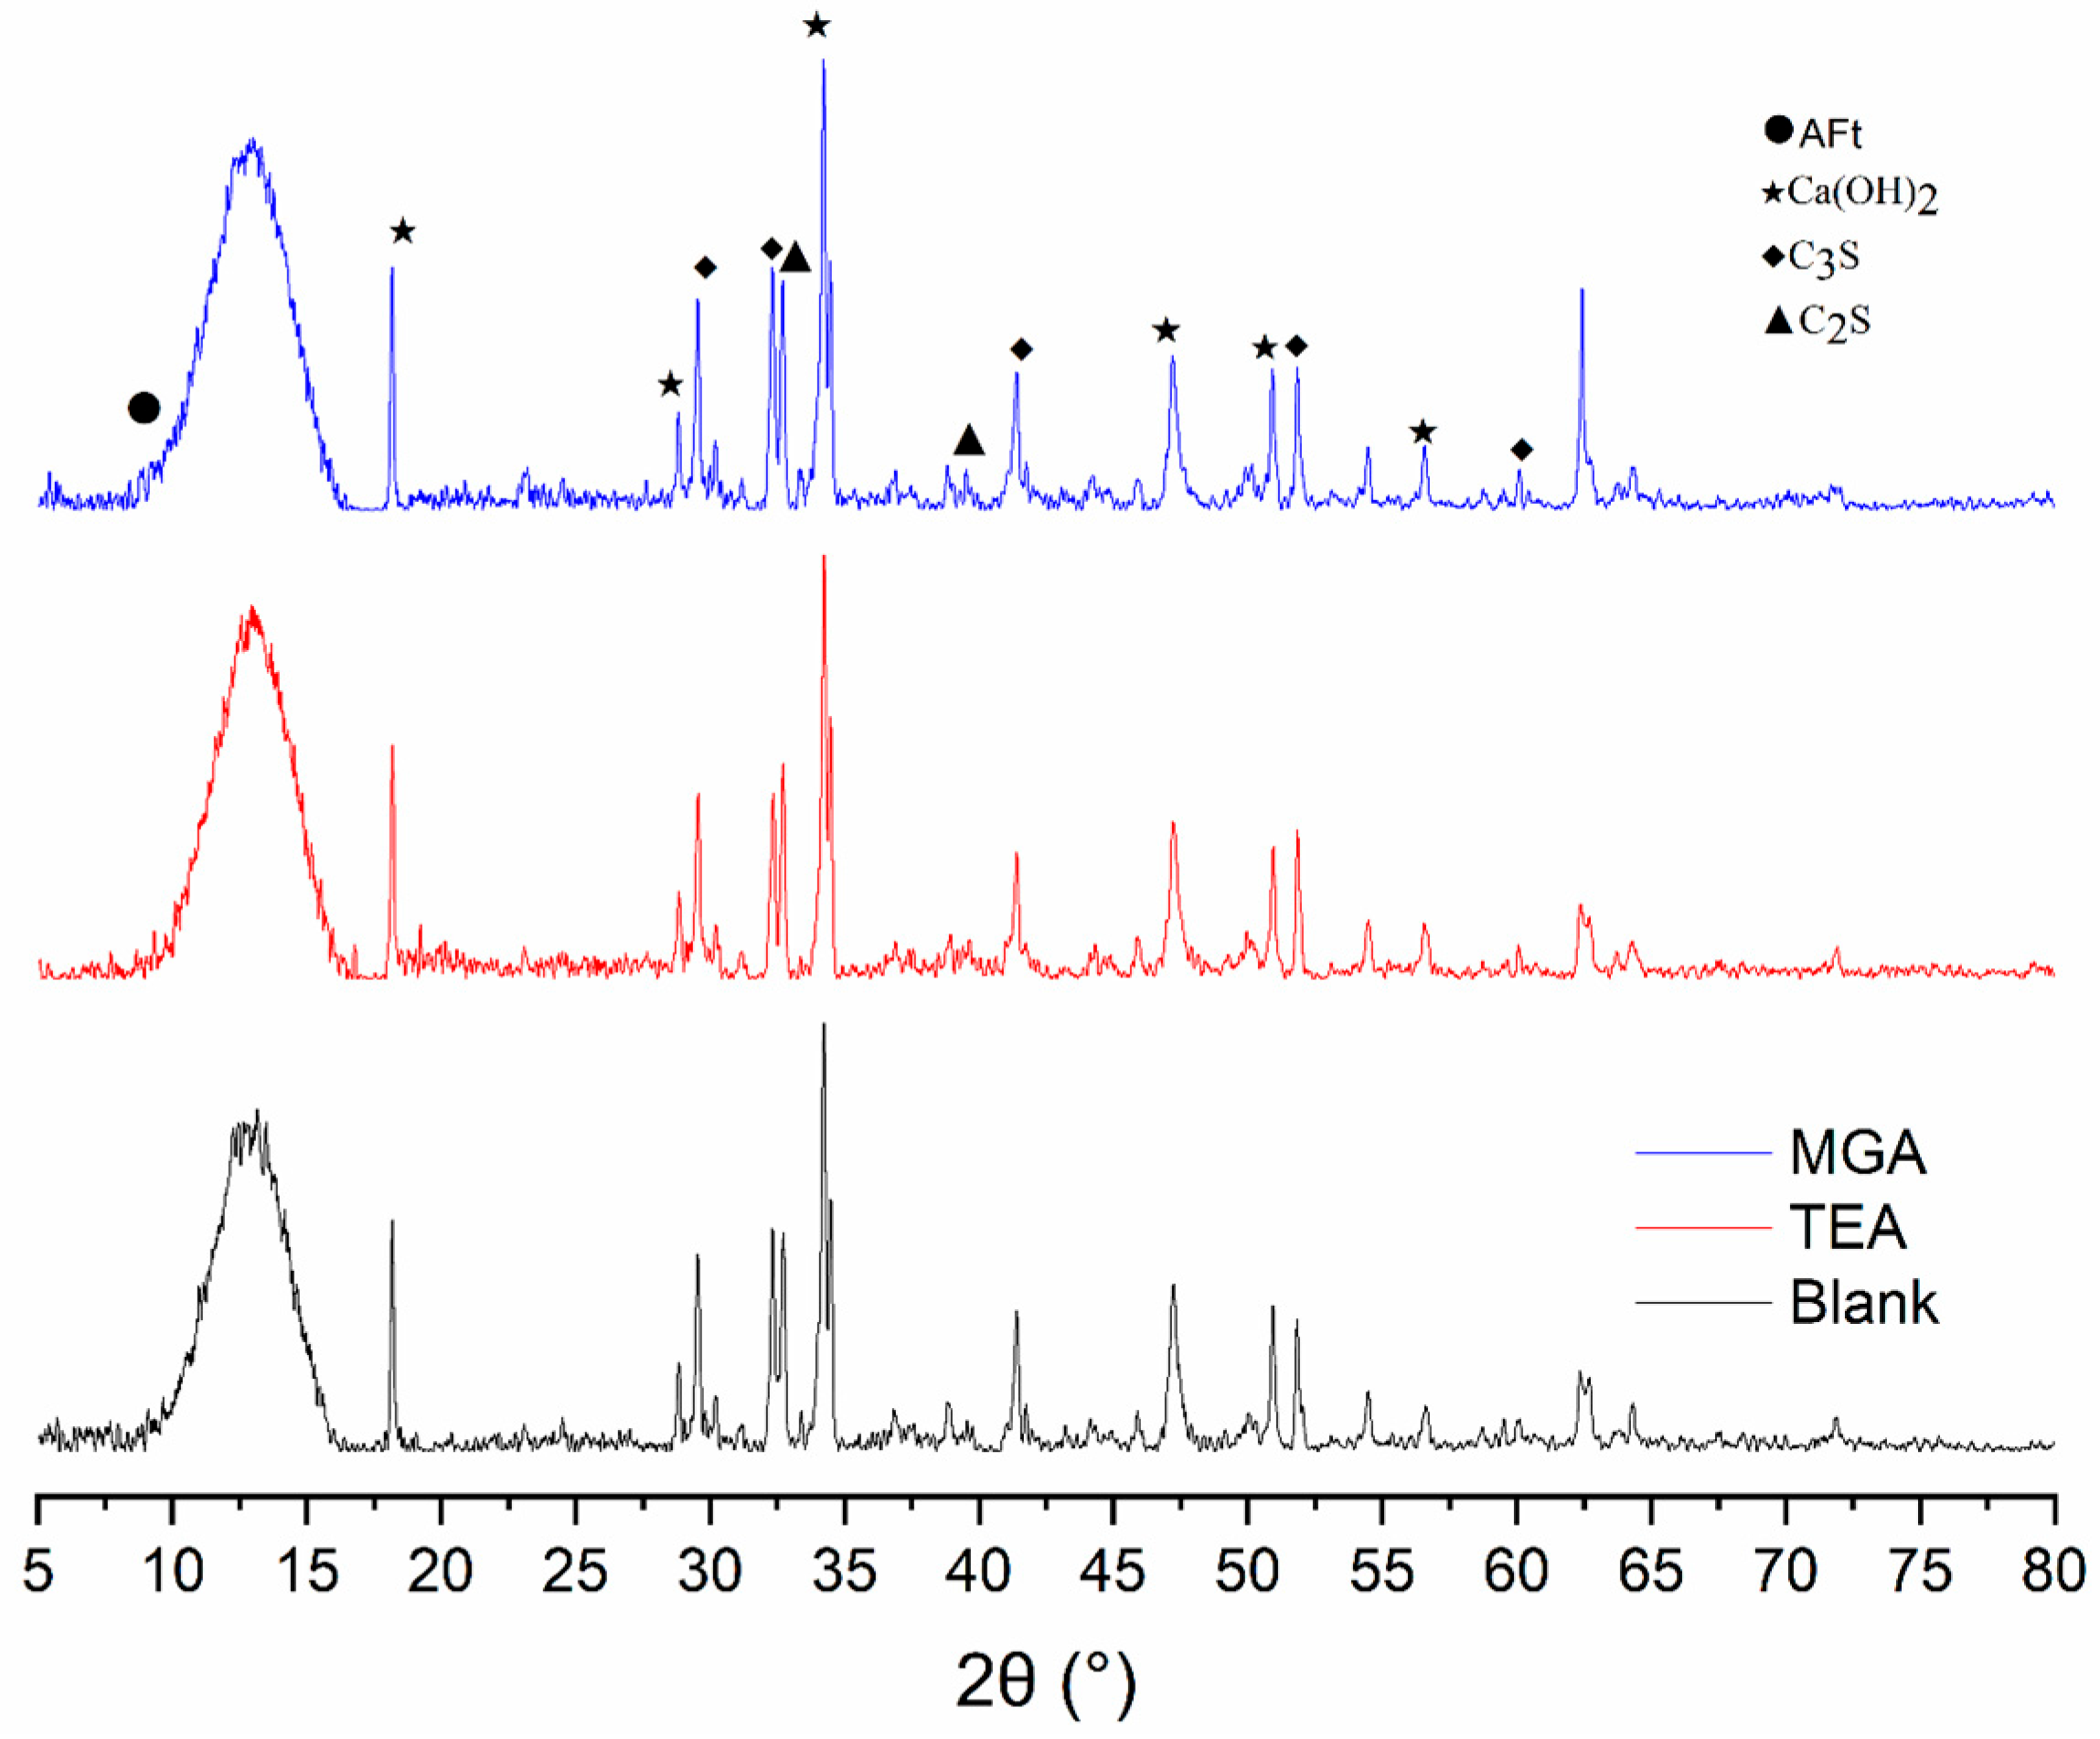
Figure 2 and
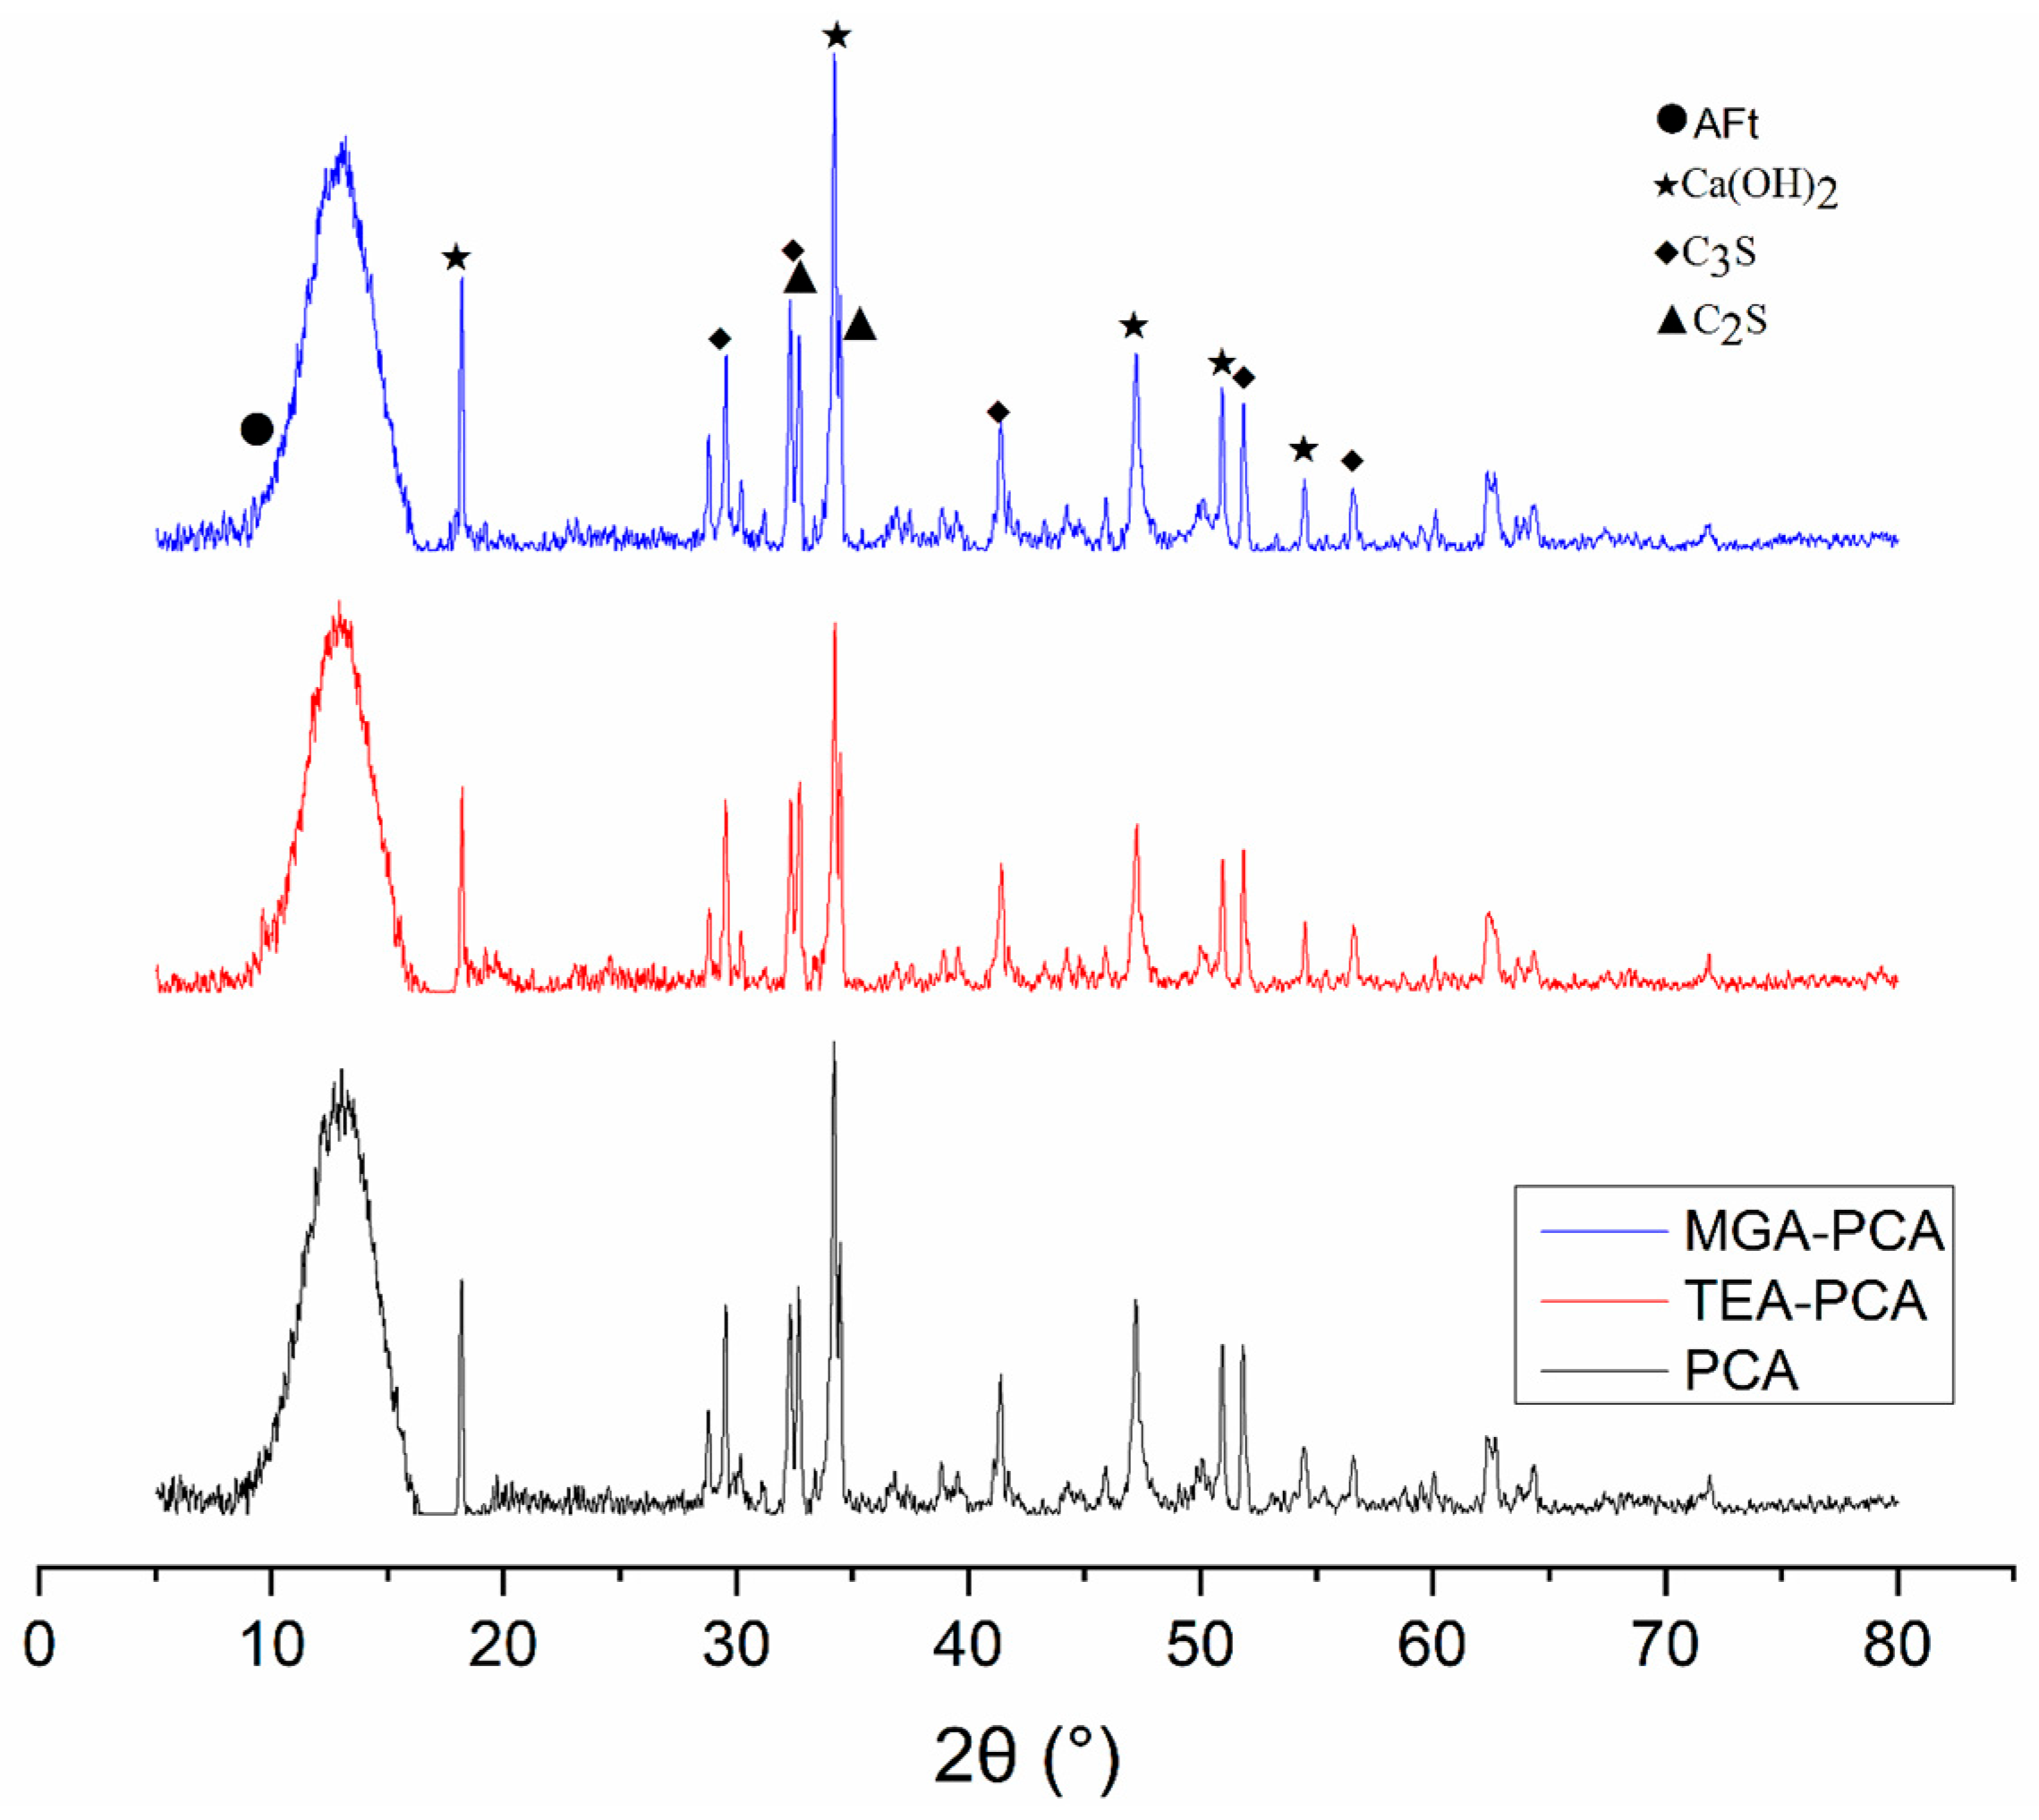
Figure 3 illustrate the XRD patterns of cement pastes at a 7-day hydration period, compared across different conditions: without superplasticizers and with 0.15% PCA superplasticizer.
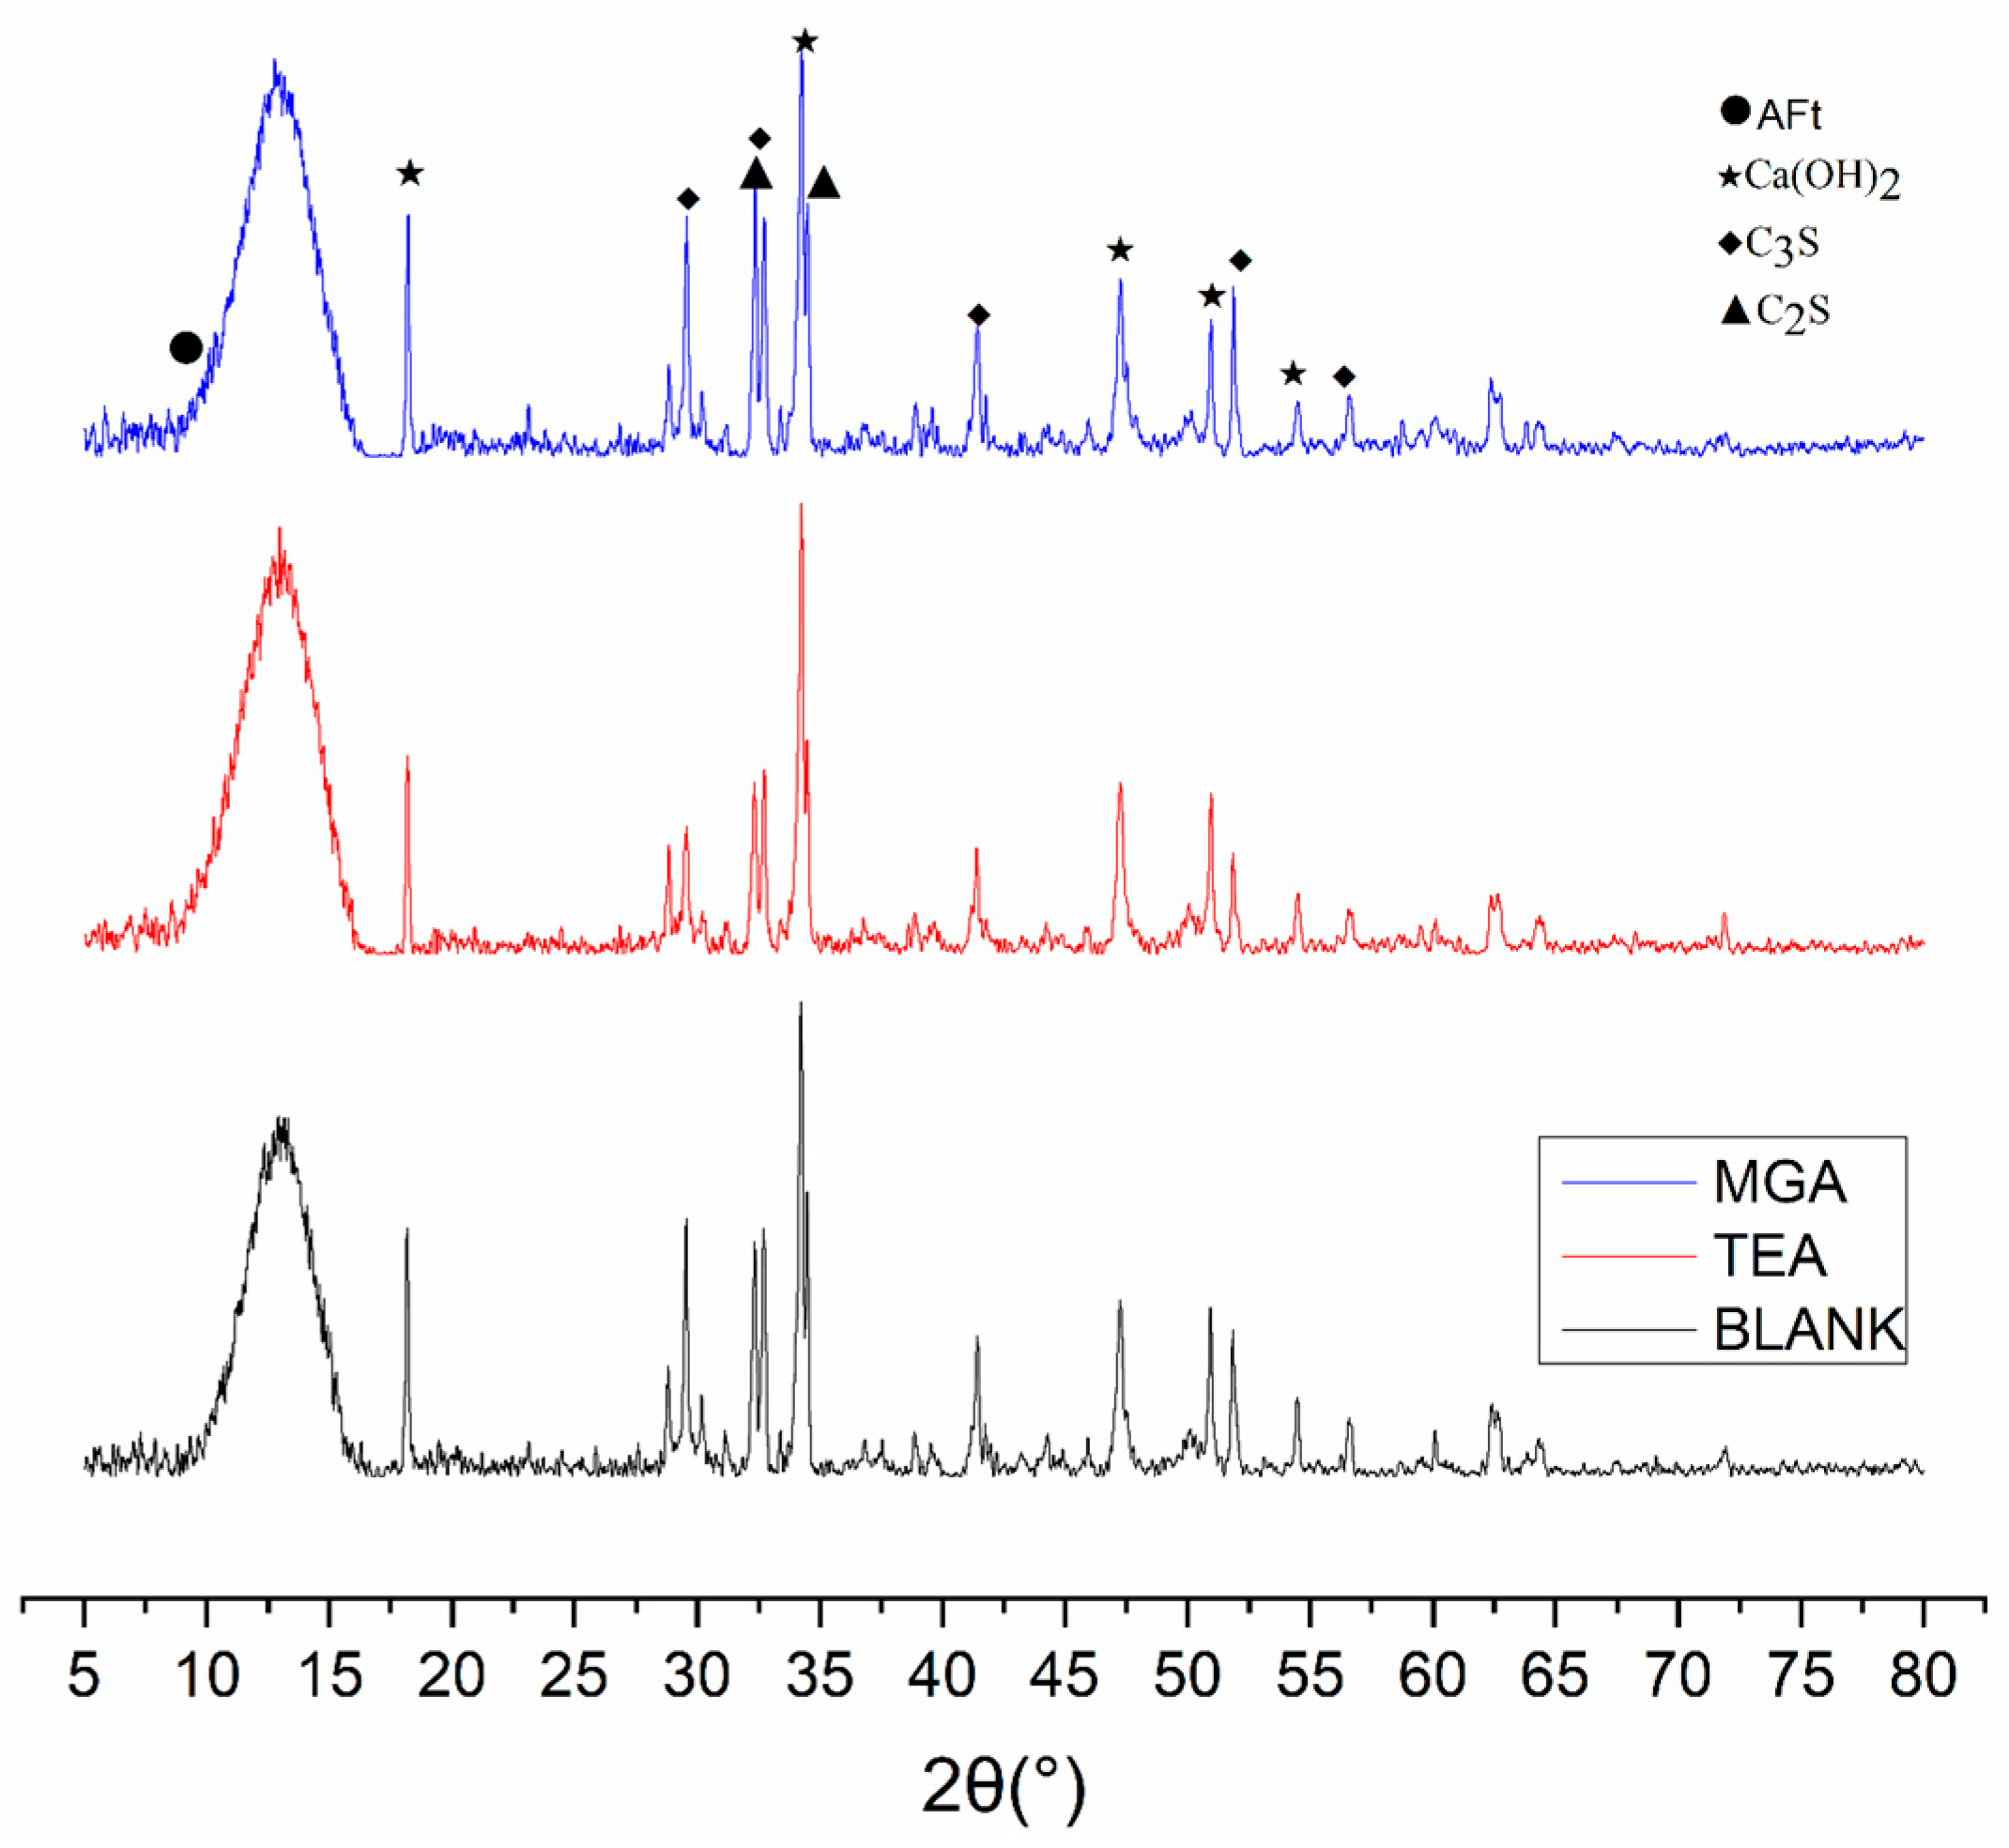
Figure 4 and
Figure 5 present the same comparison at a 28-day hydration period.
The XRD analysis for the 7-day samples demonstrates that the major hydration products comprise calcium silicate hydrate (C-S-H, amorphous), calcium hydroxide (Ca(OH)2 at around 18°), calcium aluminate hydrate (AFt, characterized by distinctive peaks roughly at 11–13°), and traces of unhydrated clinker phases, such as C2S and C3S. In samples without superplasticizer, the inclusion of MGA in cement paste significantly heightened the intensity of Ca(OH)2 and AFt peaks compared to the Blank group, suggesting MGA’s effective enhancement of the early hydration process of silicate and aluminate minerals. The greater prominence of C2S peaks further indicates MGA’s ability to refine cement particle fineness and increase specific surface area, potentially through mechanisms like Ca2+ complexation and pH regulation, thereby facilitating C3S conversion to C-S-H and Ca(OH)2, while accelerating C3A’s reaction with gypsum to produce more AFt. This hydration promotion leads to a denser initial structural framework, supporting early mechanical strength developments.
With the addition of 0.15% PCA superplasticizer, the intensity of the Ca(OH)
2 peaks was notably higher at both 7 and 28 days, being especially prominent at 28 days. This suggests that PCA enhances the dispersive properties and sustains hydration reactions over extended periods, potentially leading to a greater volume of hydration products and/or improved crystallinity of the formed phases. It is important to note that an increase in XRD peak intensity can result from either an increase in the quantity of the crystalline phase or an enhancement in its crystallinity and preferred orientation, or a combination thereof [
39]. At 28 days, the notable weakening or disappearance of C
3S and C
2S clinker phase peaks indicates more complete hydration. The persistence of AFt peaks in samples with PCA suggests continued hydration of C
3A without inhibition, further contributing to the refinement of structural integrity. The combined effect of MGA and PCA results in the most defined hydration product peaks in XRD analysis, suggesting enhanced crystallinity and/or quantity of hydration products. This observation, coupled with the measured reduction in setting times (
Table 5), indicates improved hydration kinetics and microstructural development. While direct zeta potential or calorimetry data were not included in this study, the consistent trends in fluidity, strength, and texture analysis further support the synergistic interaction between MGA and PCA in promoting sustained hydration, thereby contributing to improved long-term mechanical performance and microstructural density.
3.3. BET Surface Area Analysis
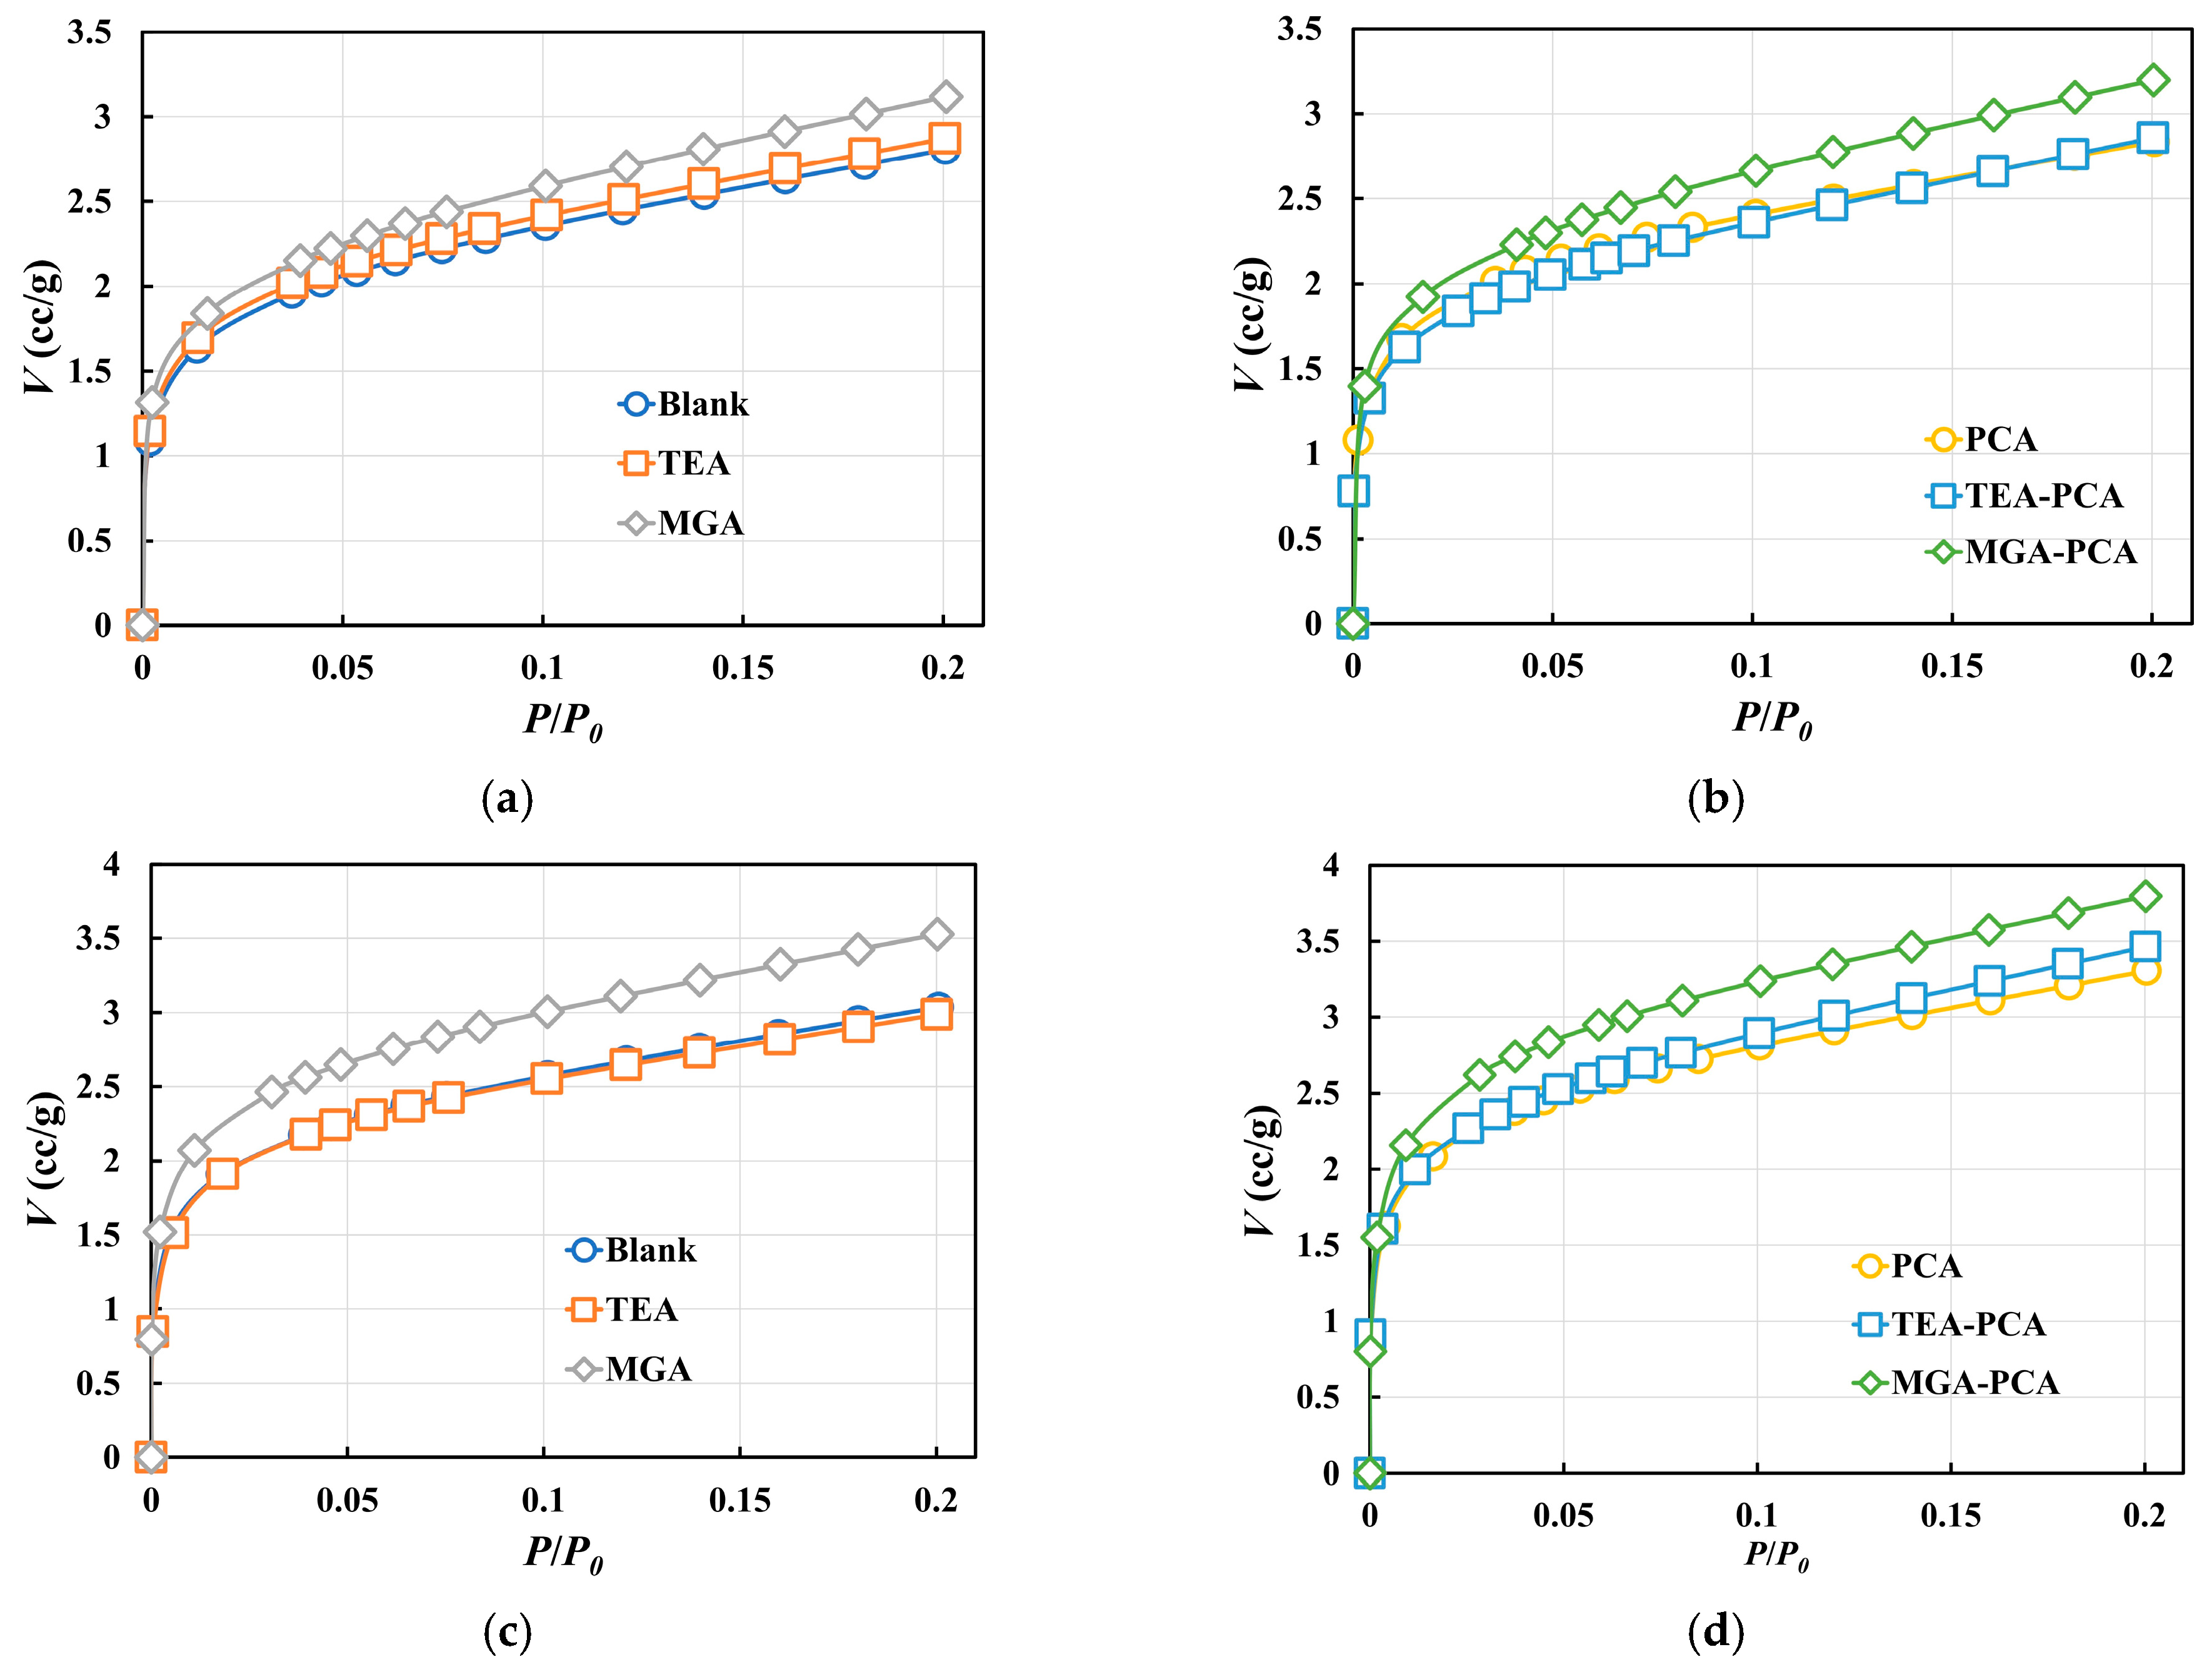
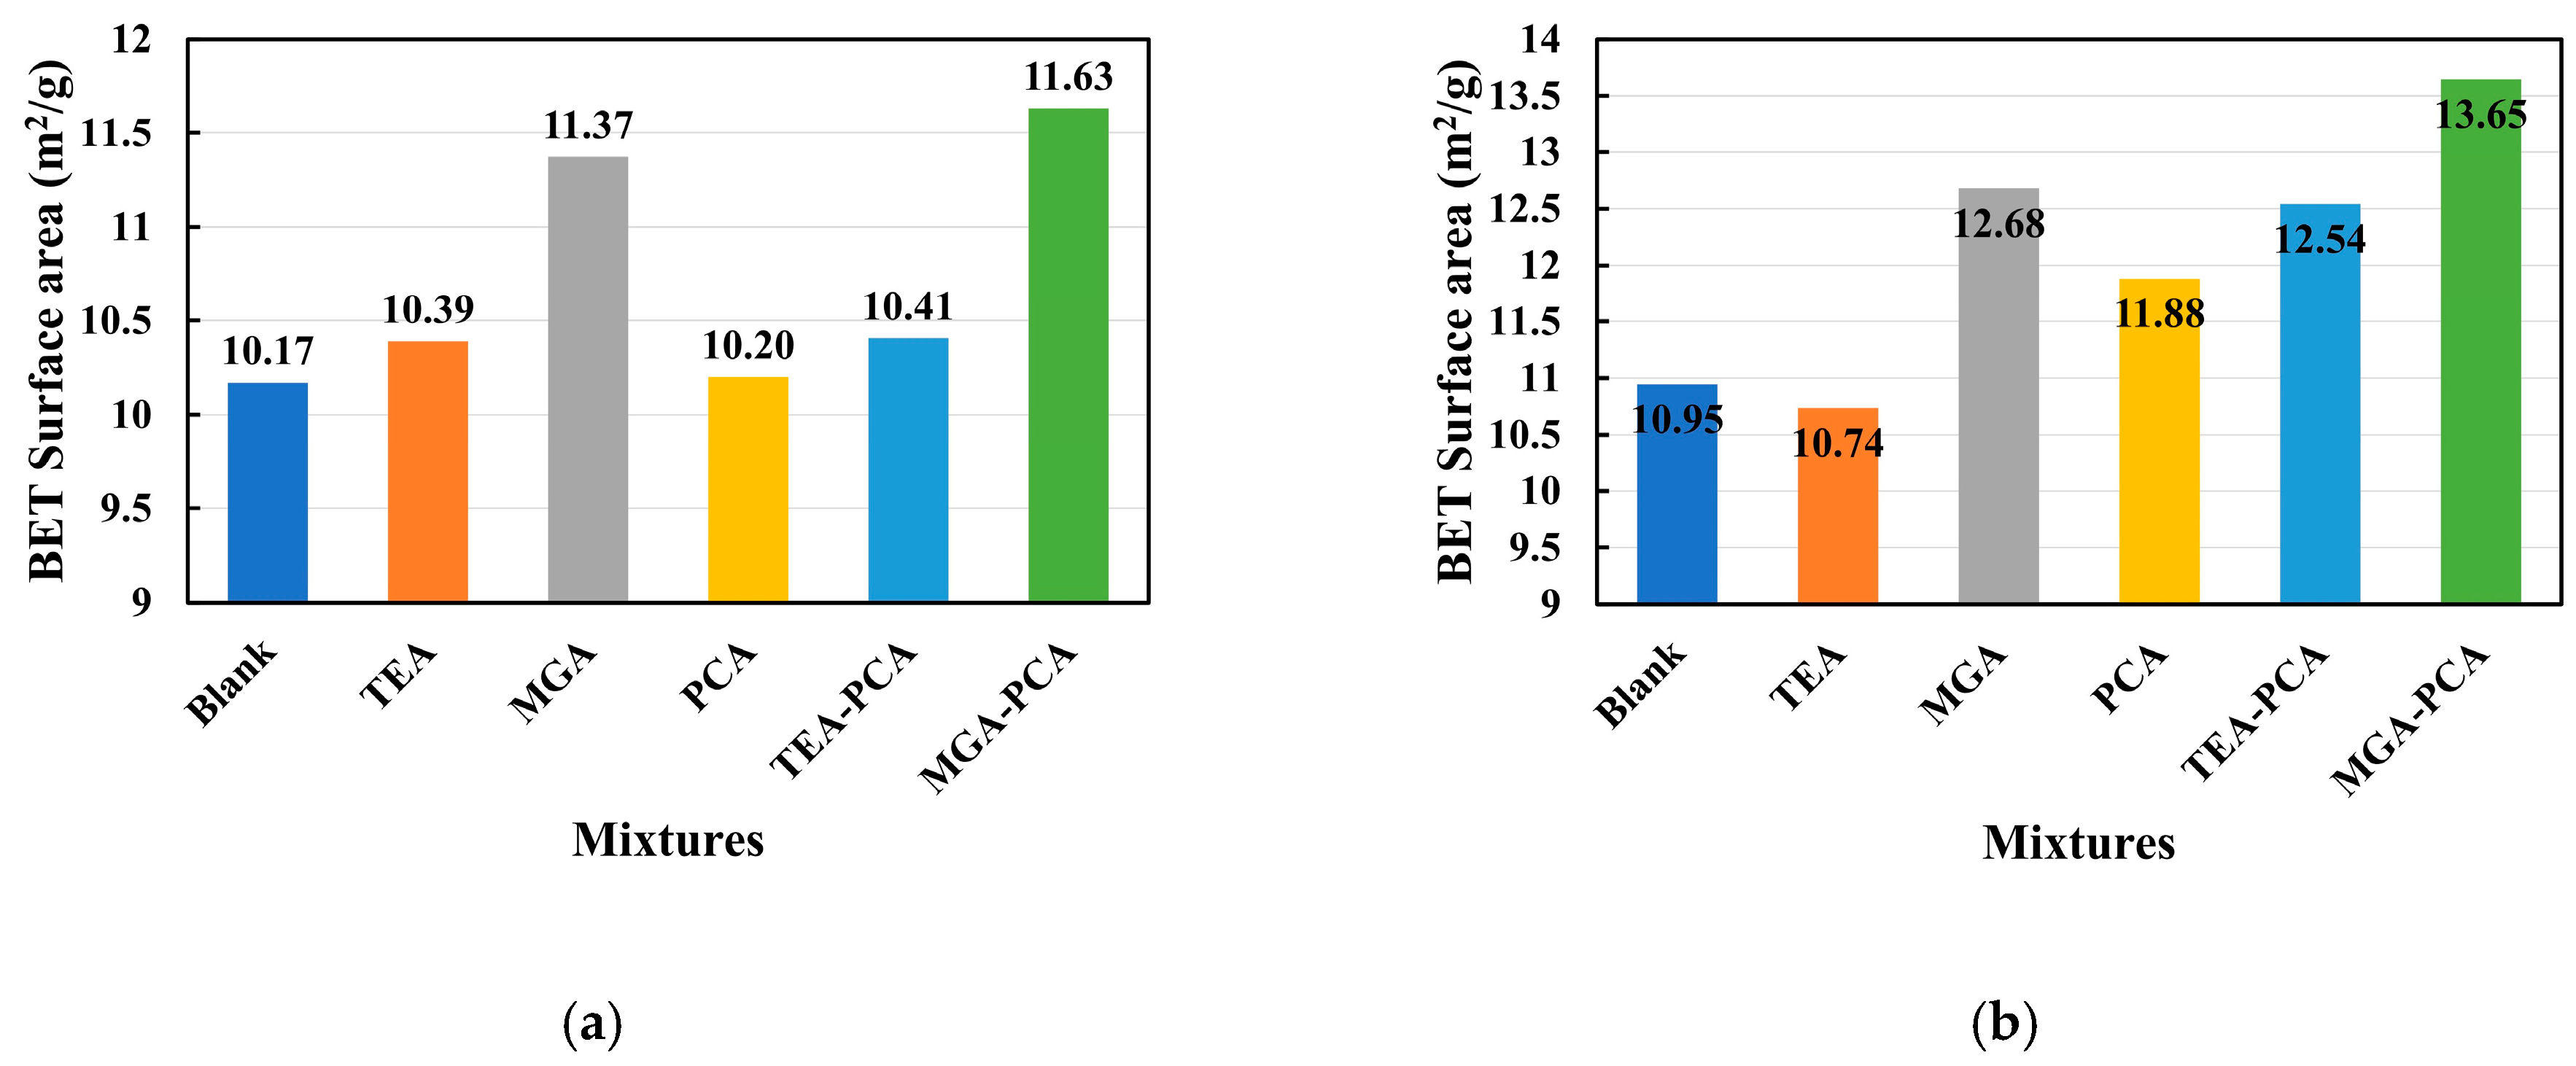
The BET specific surface area tests were conducted on cement pastes incorporating different grinding aids and PCA superplasticizers, with the results presented in
Figure 6 and
Figure 7. The variations in nitrogen adsorption isotherms reflect the evolution of the pore structure. An increase in adsorption volume in the low relative pressure region (
P/P0 < 0.1) indicates the development of more micropores (<2 nm), while an elevation in the medium pressure region (
P/P0 ≈ 0.05–0.35) is associated with the formation of mesopores (2–50 nm).
At 7 days of hydration, the Blank group without PCA superplasticizer exhibited the lowest adsorption volume (
Figure 6a), suggesting a sparsely developed pore structure with weak nitrogen adsorption capacity. In contrast, samples incorporating the grinding aids TEA and MGA showed a significant increase in adsorption volume in the
P/P0 ≈ 0.05–0.2 range, with the MGA group performing more prominently. This phenomenon indicates that grinding aids promote cement particle dispersion and hydration reactions, thereby inducing the formation of more mesoporous structures (2–50 nm) and enhancing multilayer nitrogen adsorption. Upon addition of PCA superplasticizer (
Figure 6b), the adsorption curves of all samples became steeper, with a marked increase in adsorption volume, and the MGA-PCA group achieving the highest value. This suggests that the dispersive effect of PCA synergizes with the activation effect of grinding aids to optimize the pore structure, particularly in the development of micropores (<2 nm) and mesopores.
At 28 days of hydration (
Figure 6c,d), the adsorption volumes of all samples increased compared to those at 7 days, but samples with PCA maintained a significant advantage. Notably, the slope of the adsorption curve for the MGA-PCA group further increased at 28 days, indicating that prolonged hydration time leads to continuous refinement of the pore structure, forming more micropores and mesopores. This change is closely related to the accumulation of cement hydration products.
The BET specific surface area results demonstrate that the incorporation of grinding aids and PCA superplasticizer significantly enhances the specific surface area of cement pastes. At 7 days, the MGA group exhibited a higher BET specific surface area than the TEA and Blank groups, with the MGA-PCA group reaching the highest value, indicating that MGA grinding aid increases effective adsorption sites by optimizing particle distribution and pore structure. At 28 days, the BET specific surface areas of all samples increased, but those with PCA showed greater increments, particularly the MGA-PCA group, which had a significantly higher value than the others. This implies that PCA not only exerts a dispersive effect in the early hydration stage but also continuously promotes the generation of hydration products and pore refinement.
The increase in BET specific surface area is primarily attributed to the formation of calcium silicate hydrate (C-S-H) gel. In the initial stage of cement hydration, grinding aids (such as MGA) reduce particle surface energy, promote cement particle dispersion, and increase the contact area for hydration reactions, thereby accelerating C-S-H gel formation. C-S-H gel possesses a nanoscale pore structure, with a high proportion of micropores and mesopores directly contributing to a larger specific surface area. The addition of PCA superplasticizer further disperses cement particles, reduces agglomeration, enables more uniform hydration reactions, and generates finer C-S-H gel, thereby further refining the pore structure.
As hydration time extends to 28 days, C-S-H gel continues to accumulate, leading to gradual densification of the pore structure and an increased proportion of micropores. This process is particularly pronounced in the MGA-PCA group, where the activation effect of MGA and the dispersive effect of PCA jointly promote uniform distribution of hydration products and optimization of the pore structure, ultimately resulting in a higher BET specific surface area.
3.5. Morphological Characteristics and Fractal Analysis
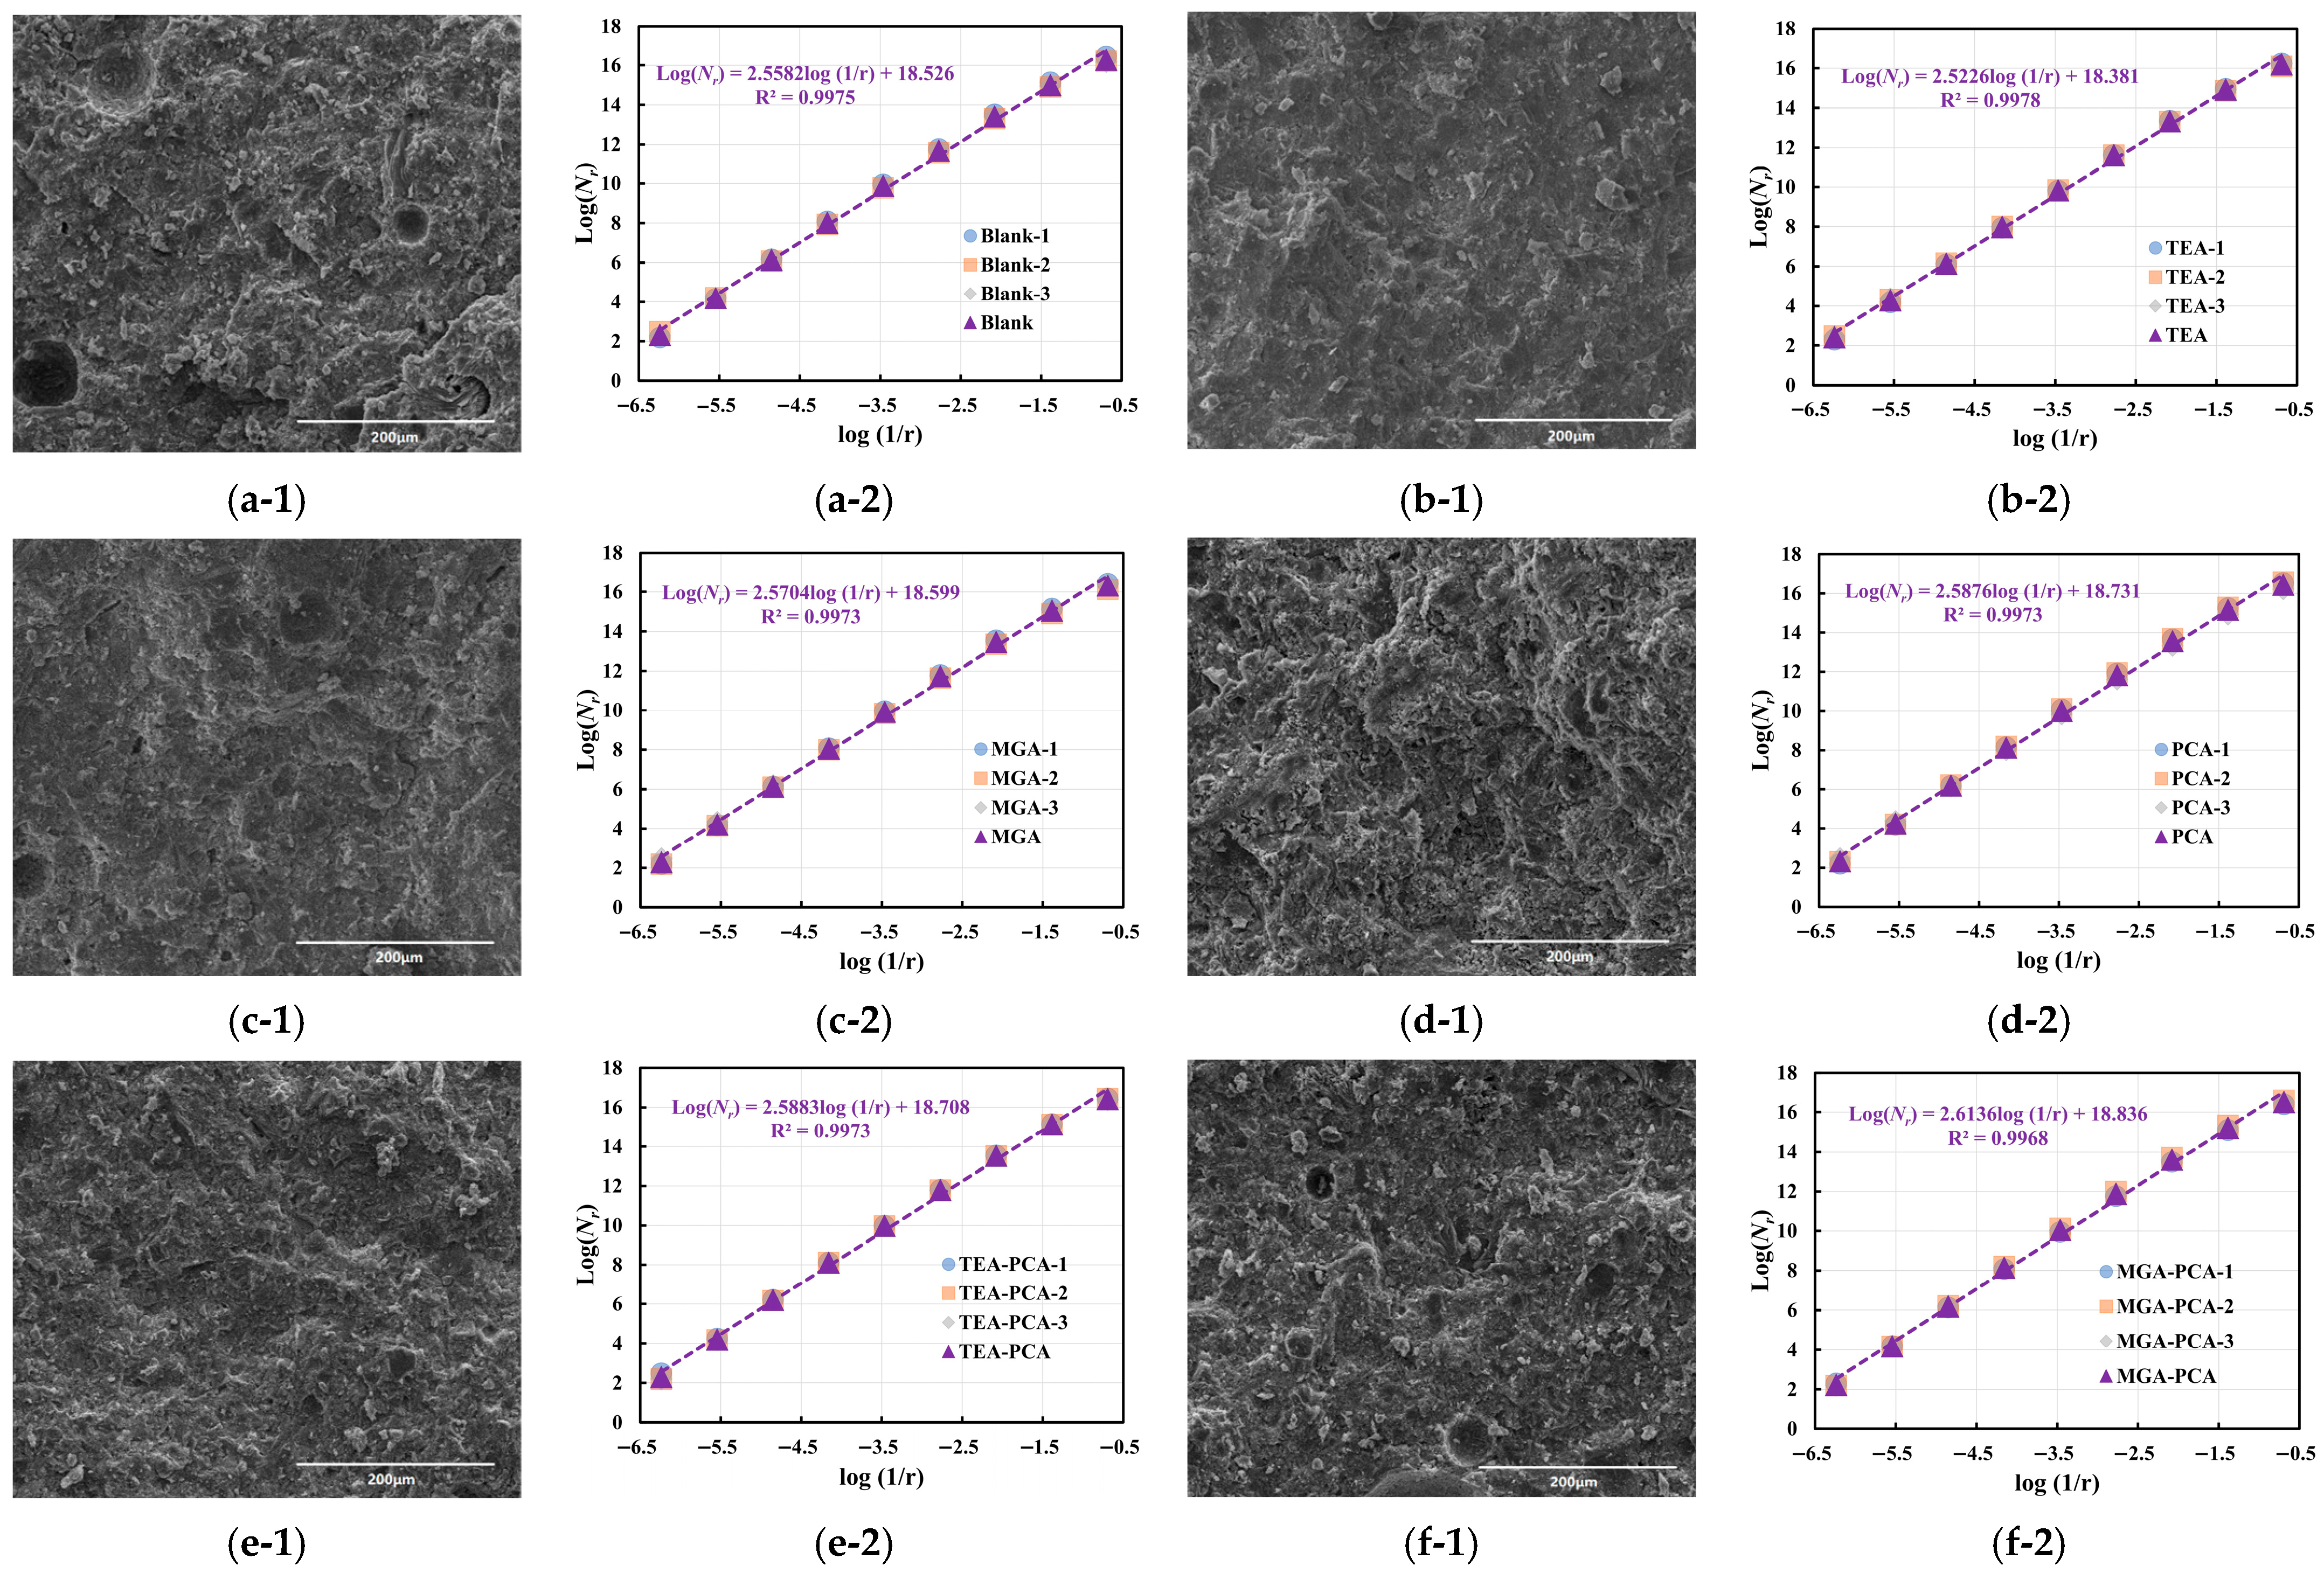
In traditional microstructural investigations of cement-based materials, scanning electron microscopy (SEM) images serve as a pivotal characterization tool, extensively employed to elucidate the morphological attributes of hydration products within cement pastes during the hydration process. Nevertheless, the majority of extant studies on SEM image analysis remain confined to qualitative assessments, relying on researchers’ subjective interpretations through “visual descriptive” approaches, which lack standardized and reproducible quantitative metrics. This methodology exhibits pronounced limitations in unveiling the inherent linkages between microstructure and macroscopic performance, and it falls short of fulfilling the requirements for precision-oriented material design. To mitigate these shortcomings, the present study incorporates image-based grayscale mean analysis and fractal dimension analysis techniques, approaching the problem from both statistical and geometric perspectives to enable quantitative characterization of microstructural complexity in SEM images.
Grayscale analysis leverages information from the image’s grayscale histogram to extract brightness distribution characteristics, thereby indirectly reflecting attributes such as the compactness, porosity, and reaction uniformity of cement hydration products. In contrast, fractal dimension quantifies the complexity and space-filling capability of image boundaries or structural outlines, enabling the capture of material structural evolution features across diverse spatiotemporal scales. In this work, SEM images of various sample groups at 7-day and 28-day hydration ages were systematically evaluated under 500× and 2000× magnifications, with the evolutionary trends and underlying mechanisms analyzed based on the dual metrics of average grayscale value and fractal dimension.
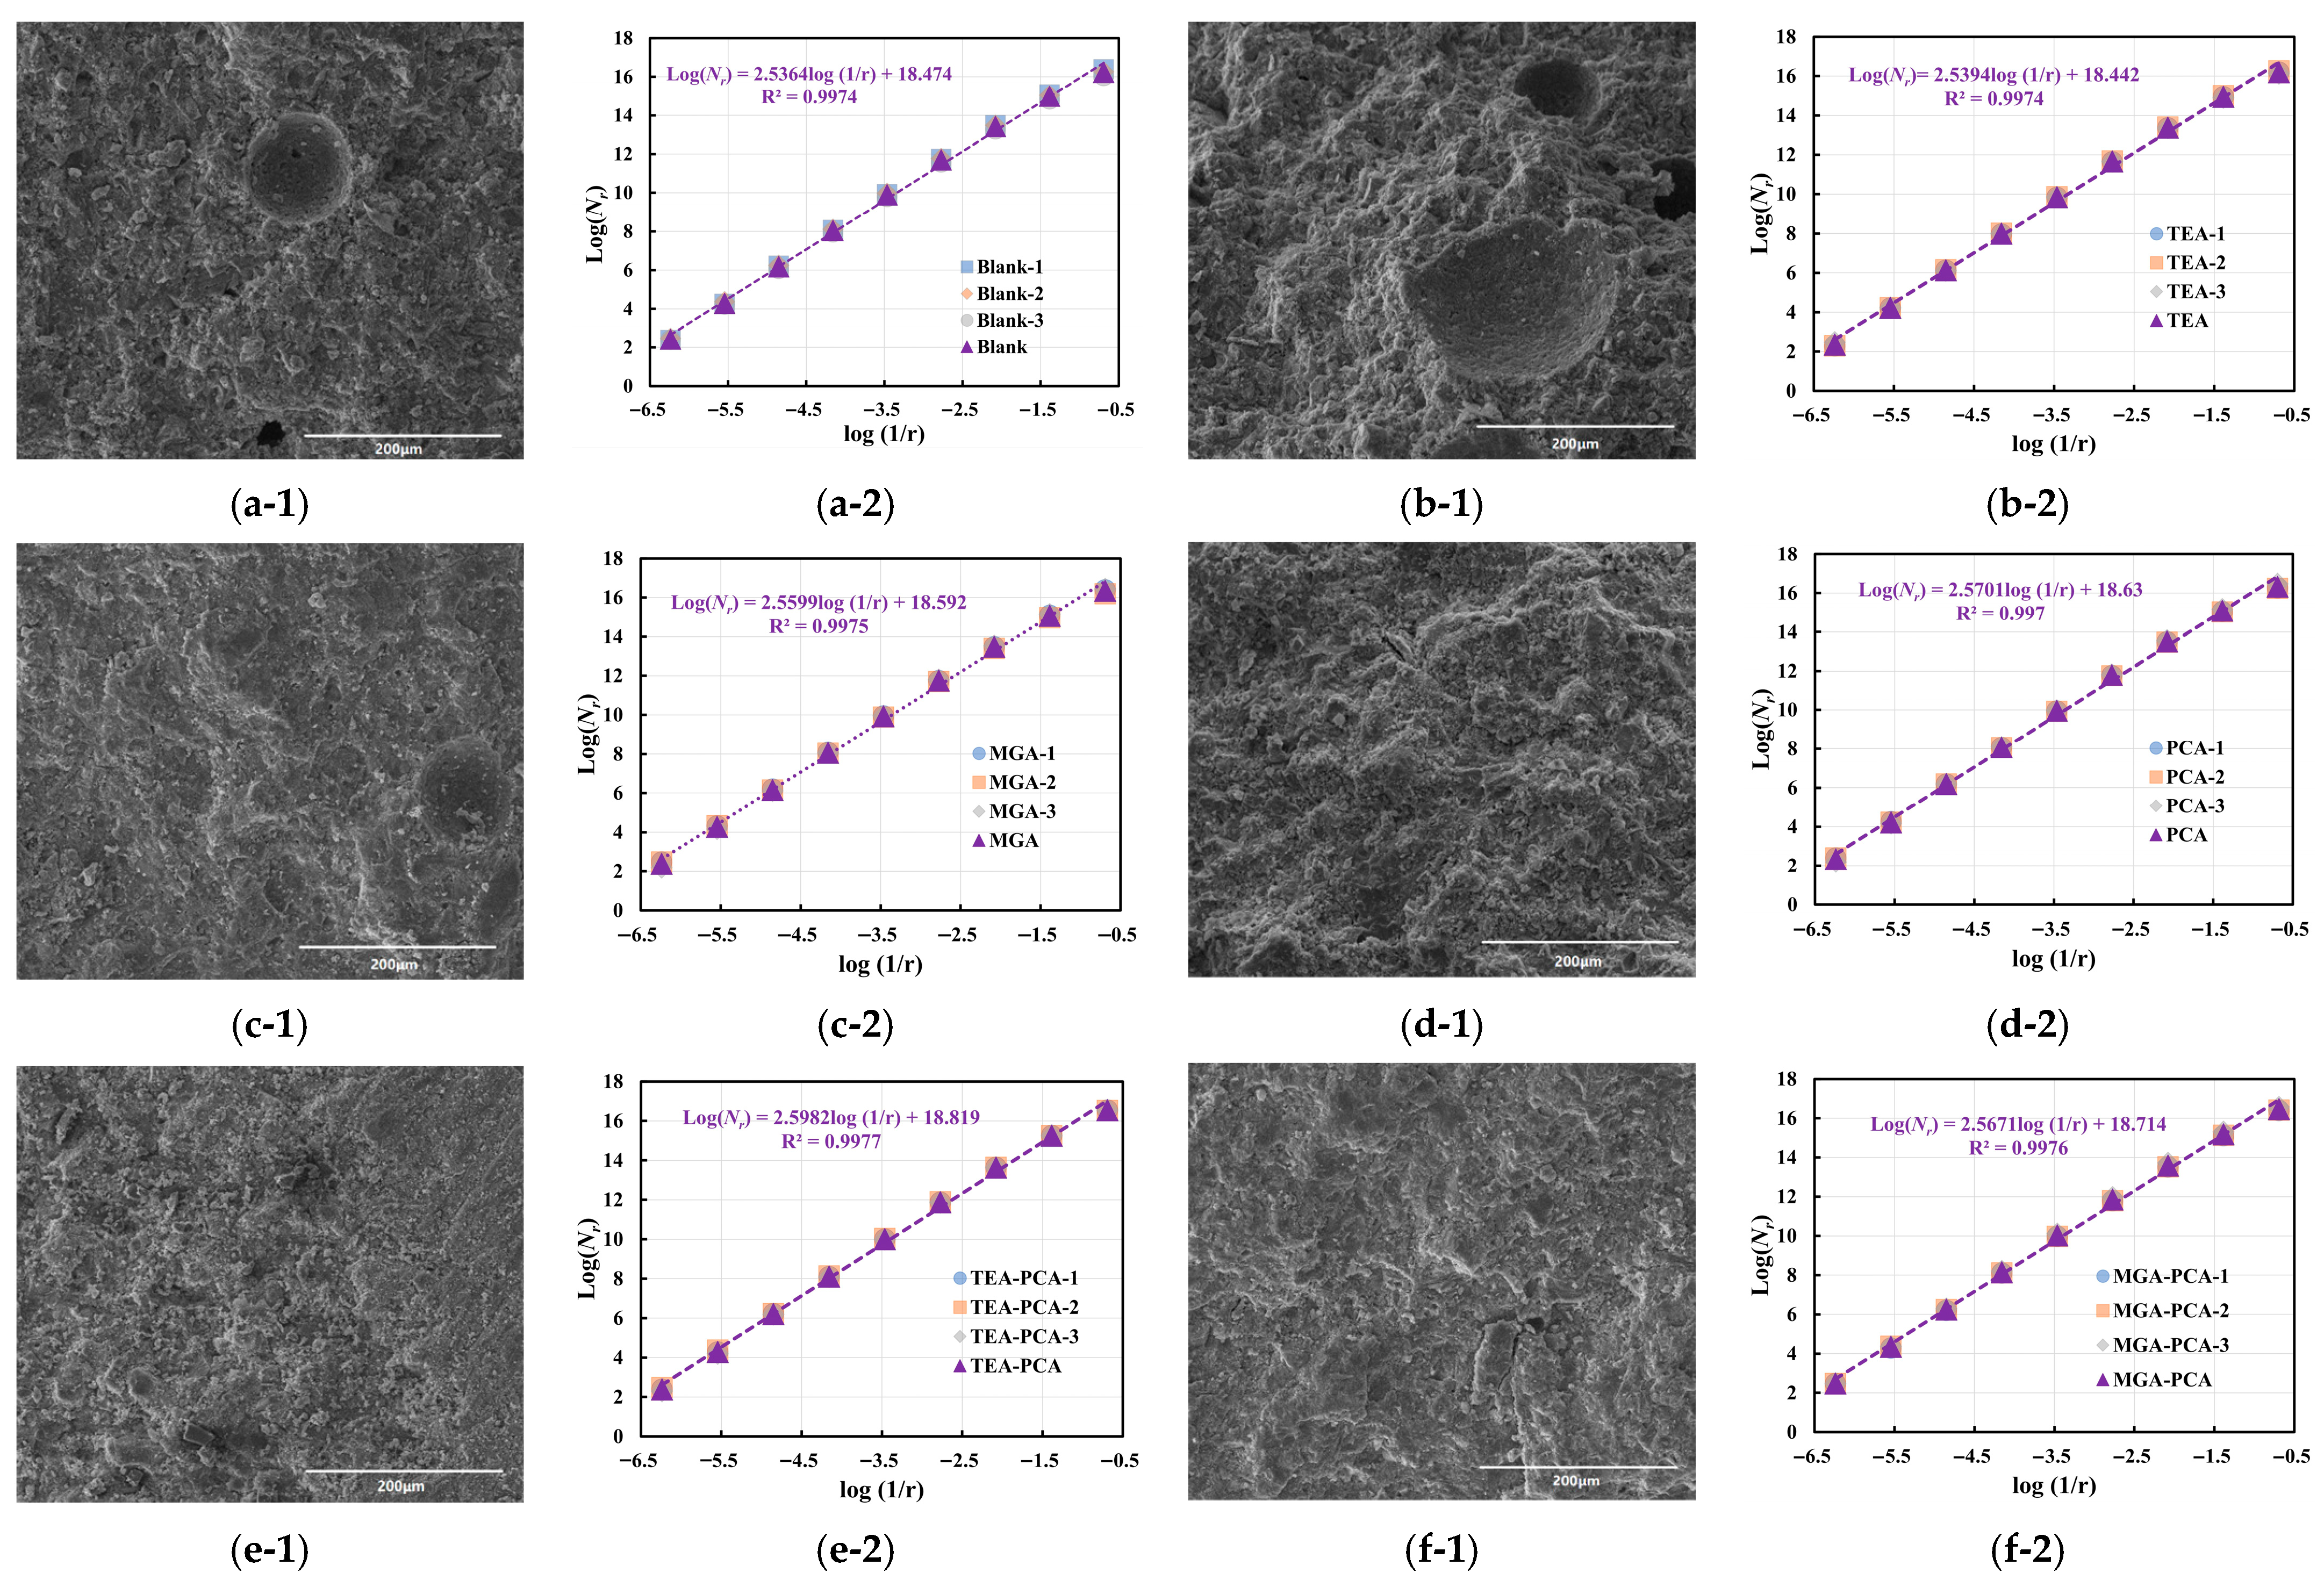
First, the features of the 7-day-old samples under 500× magnification are analyzed (see
Figure 9 and
Table 9). The Blank group exhibits an average grayscale value of 77.5 and a fractal dimension of 2.536, displaying typical early hydration characteristics, where reaction products have not yet fully formed, resulting in a relatively loose structure, lower image brightness, and minimal complexity in structural boundaries. Upon incorporation of TEA, the grayscale value increased slightly to 79.3, and the fractal dimension rose marginally to 2.539. In contrast, the MGA group exhibited more pronounced changes, with the grayscale value rising to 85.2 and the fractal dimension substantially increasing to 2.560. The limited enhancement in fractal dimension (DB) with TEA compared to MGA indeed reflects its weaker influence on microstructural complexity at early ages. This can be mechanistically explained by TEA’s known tendency to preferentially accelerate the hydration of C
3A and C
4AF phases, while potentially retarding C
3S hydration and disrupting the nucleation and growth of calcium hydroxide (CH) [
12,
20,
40]. Such selective acceleration may lead to localized, rapid formation of ettringite and aluminate hydrates without contributing significantly to the overall spatial complexity and interconnectivity of the C–S–H gel network. In contrast, MGA, being an ester-modified derivative of TEA, introduces additional polar groups (e.g., –COOH and –COOR) that improve its compatibility with silicate phases and enhance the chelation of Ca
2+ and Al
3+ ions. This promotes a more uniform and simultaneous hydration of multiple cement phases, leading to a denser and more complex microstructure with higher fractal dimension values [
7]. These mechanistic insights are consistent with our particle size distribution, XRD, and strength results, and are supported by previous studies such as Ji et al. [
7], which highlight the role of functional groups in grinding aids on hydration kinetics and microstructure development.
Further examination of the influence of PCA dosage on the structure of hydration products reveals that the Blank-PCA group experiences a substantial increase in average grayscale value to 84.9, accompanied by a notable reduction in standard deviation to only 1.85, signifying enhanced uniformity in the distribution of reaction products, more consistent image brightness, and an overall trend toward structural densification. Concurrently, its fractal dimension rises to 2.570, demonstrating that PCA can significantly augment the space-filling complexity of the structure even in the early stage. The TEA-PCA group further elevates the grayscale value to 91.8, with a fractal dimension of 2.598—the highest in this series—indicating that the synergistic interaction between TEA and PCA not only accelerates the reaction extent but also generates structural units characterized by greater branching features and nonlinear boundaries. Most notably, the MGA-PCA group achieves the highest grayscale value of 105.3 among all samples, reflecting the strongest brightness response and accumulation of reaction products; although its fractal dimension is slightly lower than that of TEA-PCA (at 2.567), the smaller standard deviation underscores a superior balance between complexity and homogeneity.
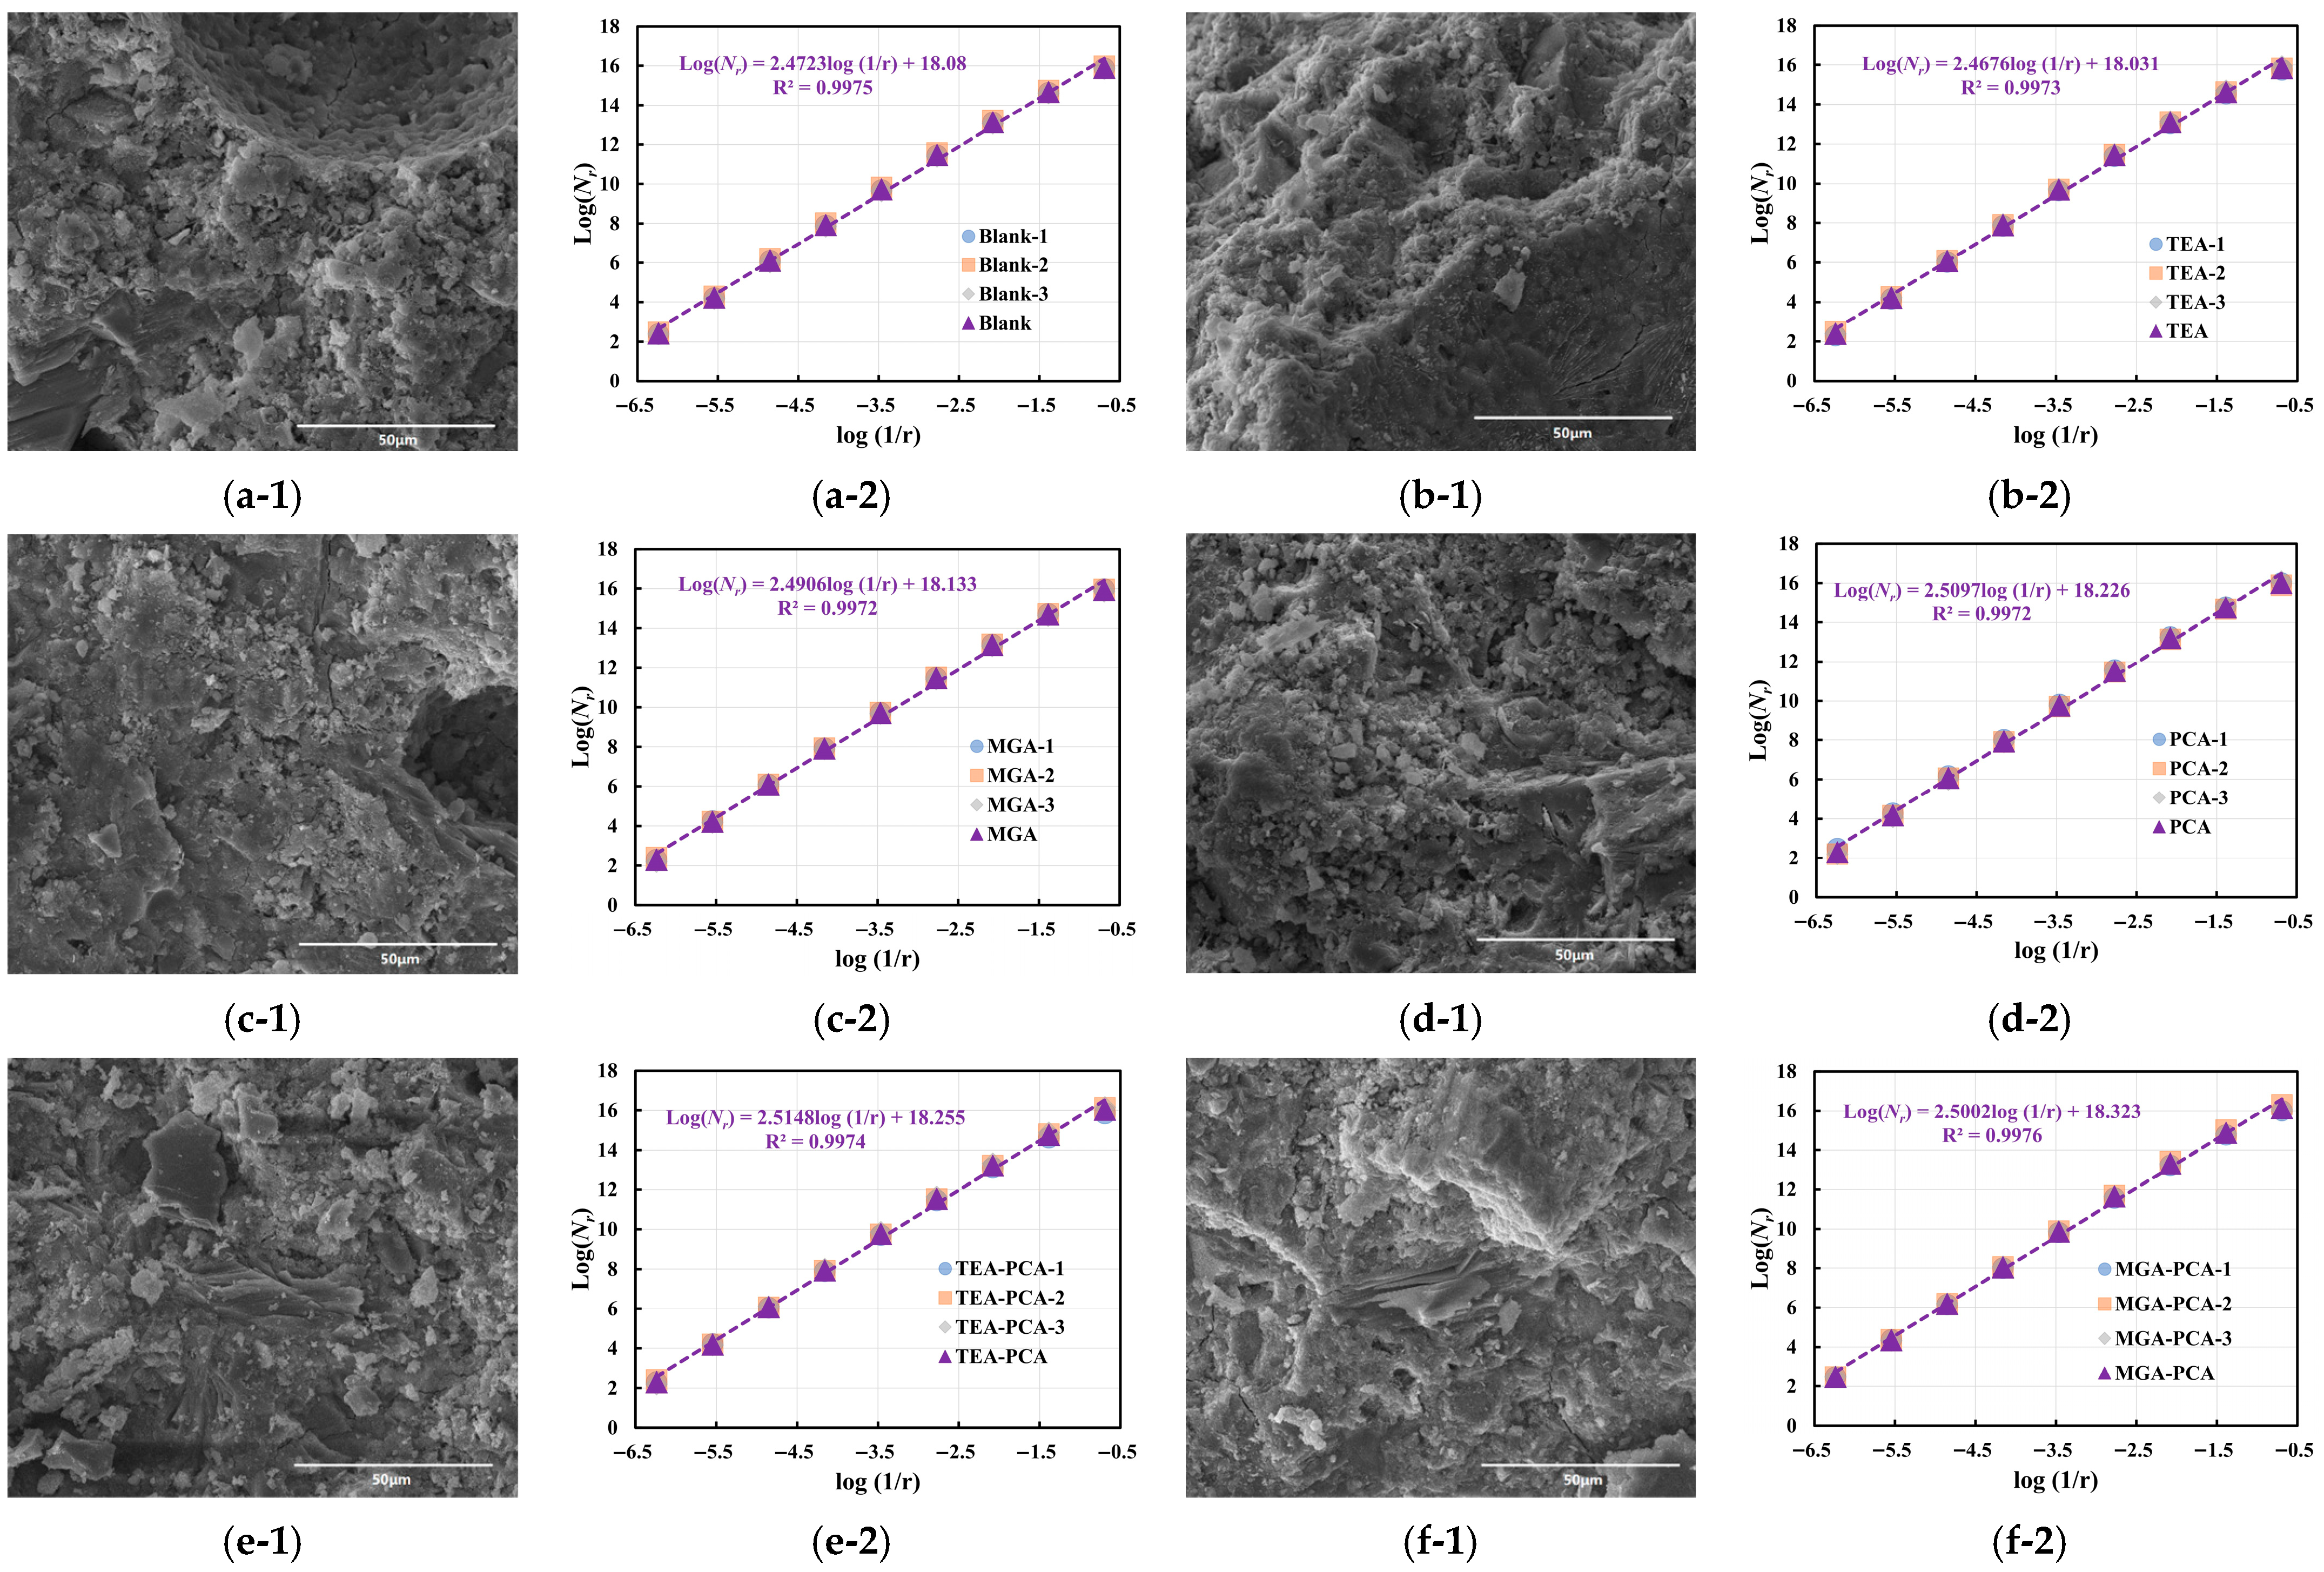
When the magnification is increased to 2000×, as shown in
Figure 10 and
Table 9, the image features exhibit distinct trends. In the Blank group, the grayscale value rises from 77.5 to 88.4, indicating that high-magnification imaging can more precisely reveal the presence of dense regions within the microstructure. However, the fractal dimension decreases to 2.472, with the standard deviation dropping to 0.002, suggesting that structural boundaries in high-magnification images tend toward regularity, with diminished hierarchical perception and enhanced local structural homogeneity. The TEA and MGA samples display similar trends, with grayscale values of 83.3 and 90.6, respectively, and fractal dimensions of 2.468 and 2.491—both lower than their corresponding values at 500×. This implies that under high-resolution conditions, the observed structural units are more refined but exhibit relatively converged complexity.
The PCA-incorporated groups maintain favorable microstructural performance even at 2000× magnification. The Blank-PCA group has a fractal dimension of 2.510, higher than that of the Blank group, indicating that structural boundaries still retain elevated complexity. The TEA-PCA group shows a grayscale value of 90.4 and a fractal dimension of 2.515, demonstrating synchronized enhancements in brightness and complexity. Meanwhile, the MGA-PCA group leads with the highest grayscale value of 108.6 and a fractal dimension of 2.500, collectively characterizing its balanced development of compactness and hierarchical fractal structure at the mesoscale.
At the 28-day hydration age, the microstructures of each sample group exhibit further evolutionary features (see
Figure 11 and
Figure 12 and
Table 10). In the Blank group under 500× magnification, the grayscale value increases from 77.5 at 7 days to 84.6, with the fractal dimension rising from 2.536 to 2.558, illustrating that the ongoing hydration reaction promotes increased formation of reaction products, gradually leading to denser and more complex structures. The TEA group shows a modest increase in grayscale value to 86.6, but its fractal dimension decreases to 2.523, reflecting that while the compactness of the formed reaction products improves, the structural boundaries become smoother, resulting in reduced complexity. In contrast, the MGA group experiences a decline in grayscale value to 71.3, yet its fractal dimension rises to 2.570, indicating that although the compactness of reaction products slightly decreases, their spatial distribution becomes more intricate and complex, presenting stronger multi-scale fractal structural characteristics.
Under the influence of PCA dosage, the Blank-PCA group has a grayscale value of 83.1, close to that of the Blank group, but its fractal dimension further increases to 2.588, signifying a tendency toward structural stability with higher hierarchical complexity. The TEA-PCA group exhibits a slight decrease in grayscale value to 75.5, but the dimension remains at 2.588; meanwhile, the MGA-PCA group demonstrates the optimal structural features, with a grayscale value of 71.9 and the highest fractal dimension of 2.614 among all samples. This trend suggests that the synergistic effect of MGA and PCA at the 28-day age can induce the formation of hydration products with highly complex interwoven networks, despite an overall decline in brightness, resulting in microstructures characterized by excellent structural hierarchy and spatial orderliness.
At 2000× magnification, as shown in
Figure 12, the structural features are further refined, with the Blank group showing a grayscale value of 85.8 and a fractal dimension of 2.491. The TEA group has a grayscale value of 83.0 and a dimension reduced to 2.447, indicating a tendency toward flatter meso-structures. The MGA group experiences a decrease in grayscale value to 80.3, but its dimension increases to 2.503, reflecting maintained complexity in the structure under higher resolution. The PCA-incorporated samples continue to exhibit strong performance, with fractal dimensions of 2.510, 2.502, and 2.521 for the Blank-PCA, TEA-PCA, and MGA-PCA groups, respectively, demonstrating that even under high-resolution conditions, PCA can sustain multi-level structural distributions, particularly in the MGA-PCA group, which still shows the strongest fractal dimension value, verifying the formation of complex crosslinked microstructures during long-term hydration.
Synthesizing the analytical results from the 7-day and 28-day hydration ages reveals that the grayscale values of the samples generally exhibit nonlinear evolution with increasing age; in some samples, the grayscale value peaks in the early stage and may subsequently decline to a certain extent in the later stage due to mechanisms such as rearrangement of hydration products, crystal formation, and morphological reconstruction. In contrast, the fractal dimension provides a more stable reflection of structural complexity, showing a gradual upward trend in multiple samples, indicating a transition from initial random filling to a networked system characterized by hierarchical and nonlinear features. The role of PCA persists throughout both early and late stages, significantly enhancing structural homogeneity and complexity by modulating the hydration kinetics process, particularly when co-incorporated with MGA, yielding the optimal microstructural characterization outcomes.
3.6. GLCM Characteristic Parameters
In the domain of microstructural image analysis, especially in the study of cement-based materials, traditional approaches often rely on singular parameters such as gray-level distribution statistics or fractal dimensions to describe micro-textures. However, these methods exhibit significant limitations in capturing the interrelationships within spatial gray-level distributions. For instance, gray-level value analysis primarily reflects overall brightness or darkness trends within an image, while fractal dimensions, despite illustrating structural complexity, fall short in revealing the regularities and local spatial correlations of image textures. Consequently, achieving high-dimensional and finely detailed quantitative image analysis remains a pivotal challenge in the current research of the microstructures of cement-based materials.
The Gray Level Co-occurrence Matrix (GLCM) emerges as a crucial tool for addressing these challenges. GLCM is a two-dimensional matrix used to statistically characterize image texture features. It provides insights into the joint probability distribution of any two pixels with specific gray values at a defined distance and orientation within an image. From GLCM, a series of statistical parameters can be derived, including Energy, Entropy, Contrast, and Correlation. These parameters correspond to key aspects such as uniformity, complexity, intensity of gray-level differences, and gray-level dependency in textures, thus offering a comprehensive portrayal of the spatial distribution patterns of microstructures from multiple perspectives [
38,
41].
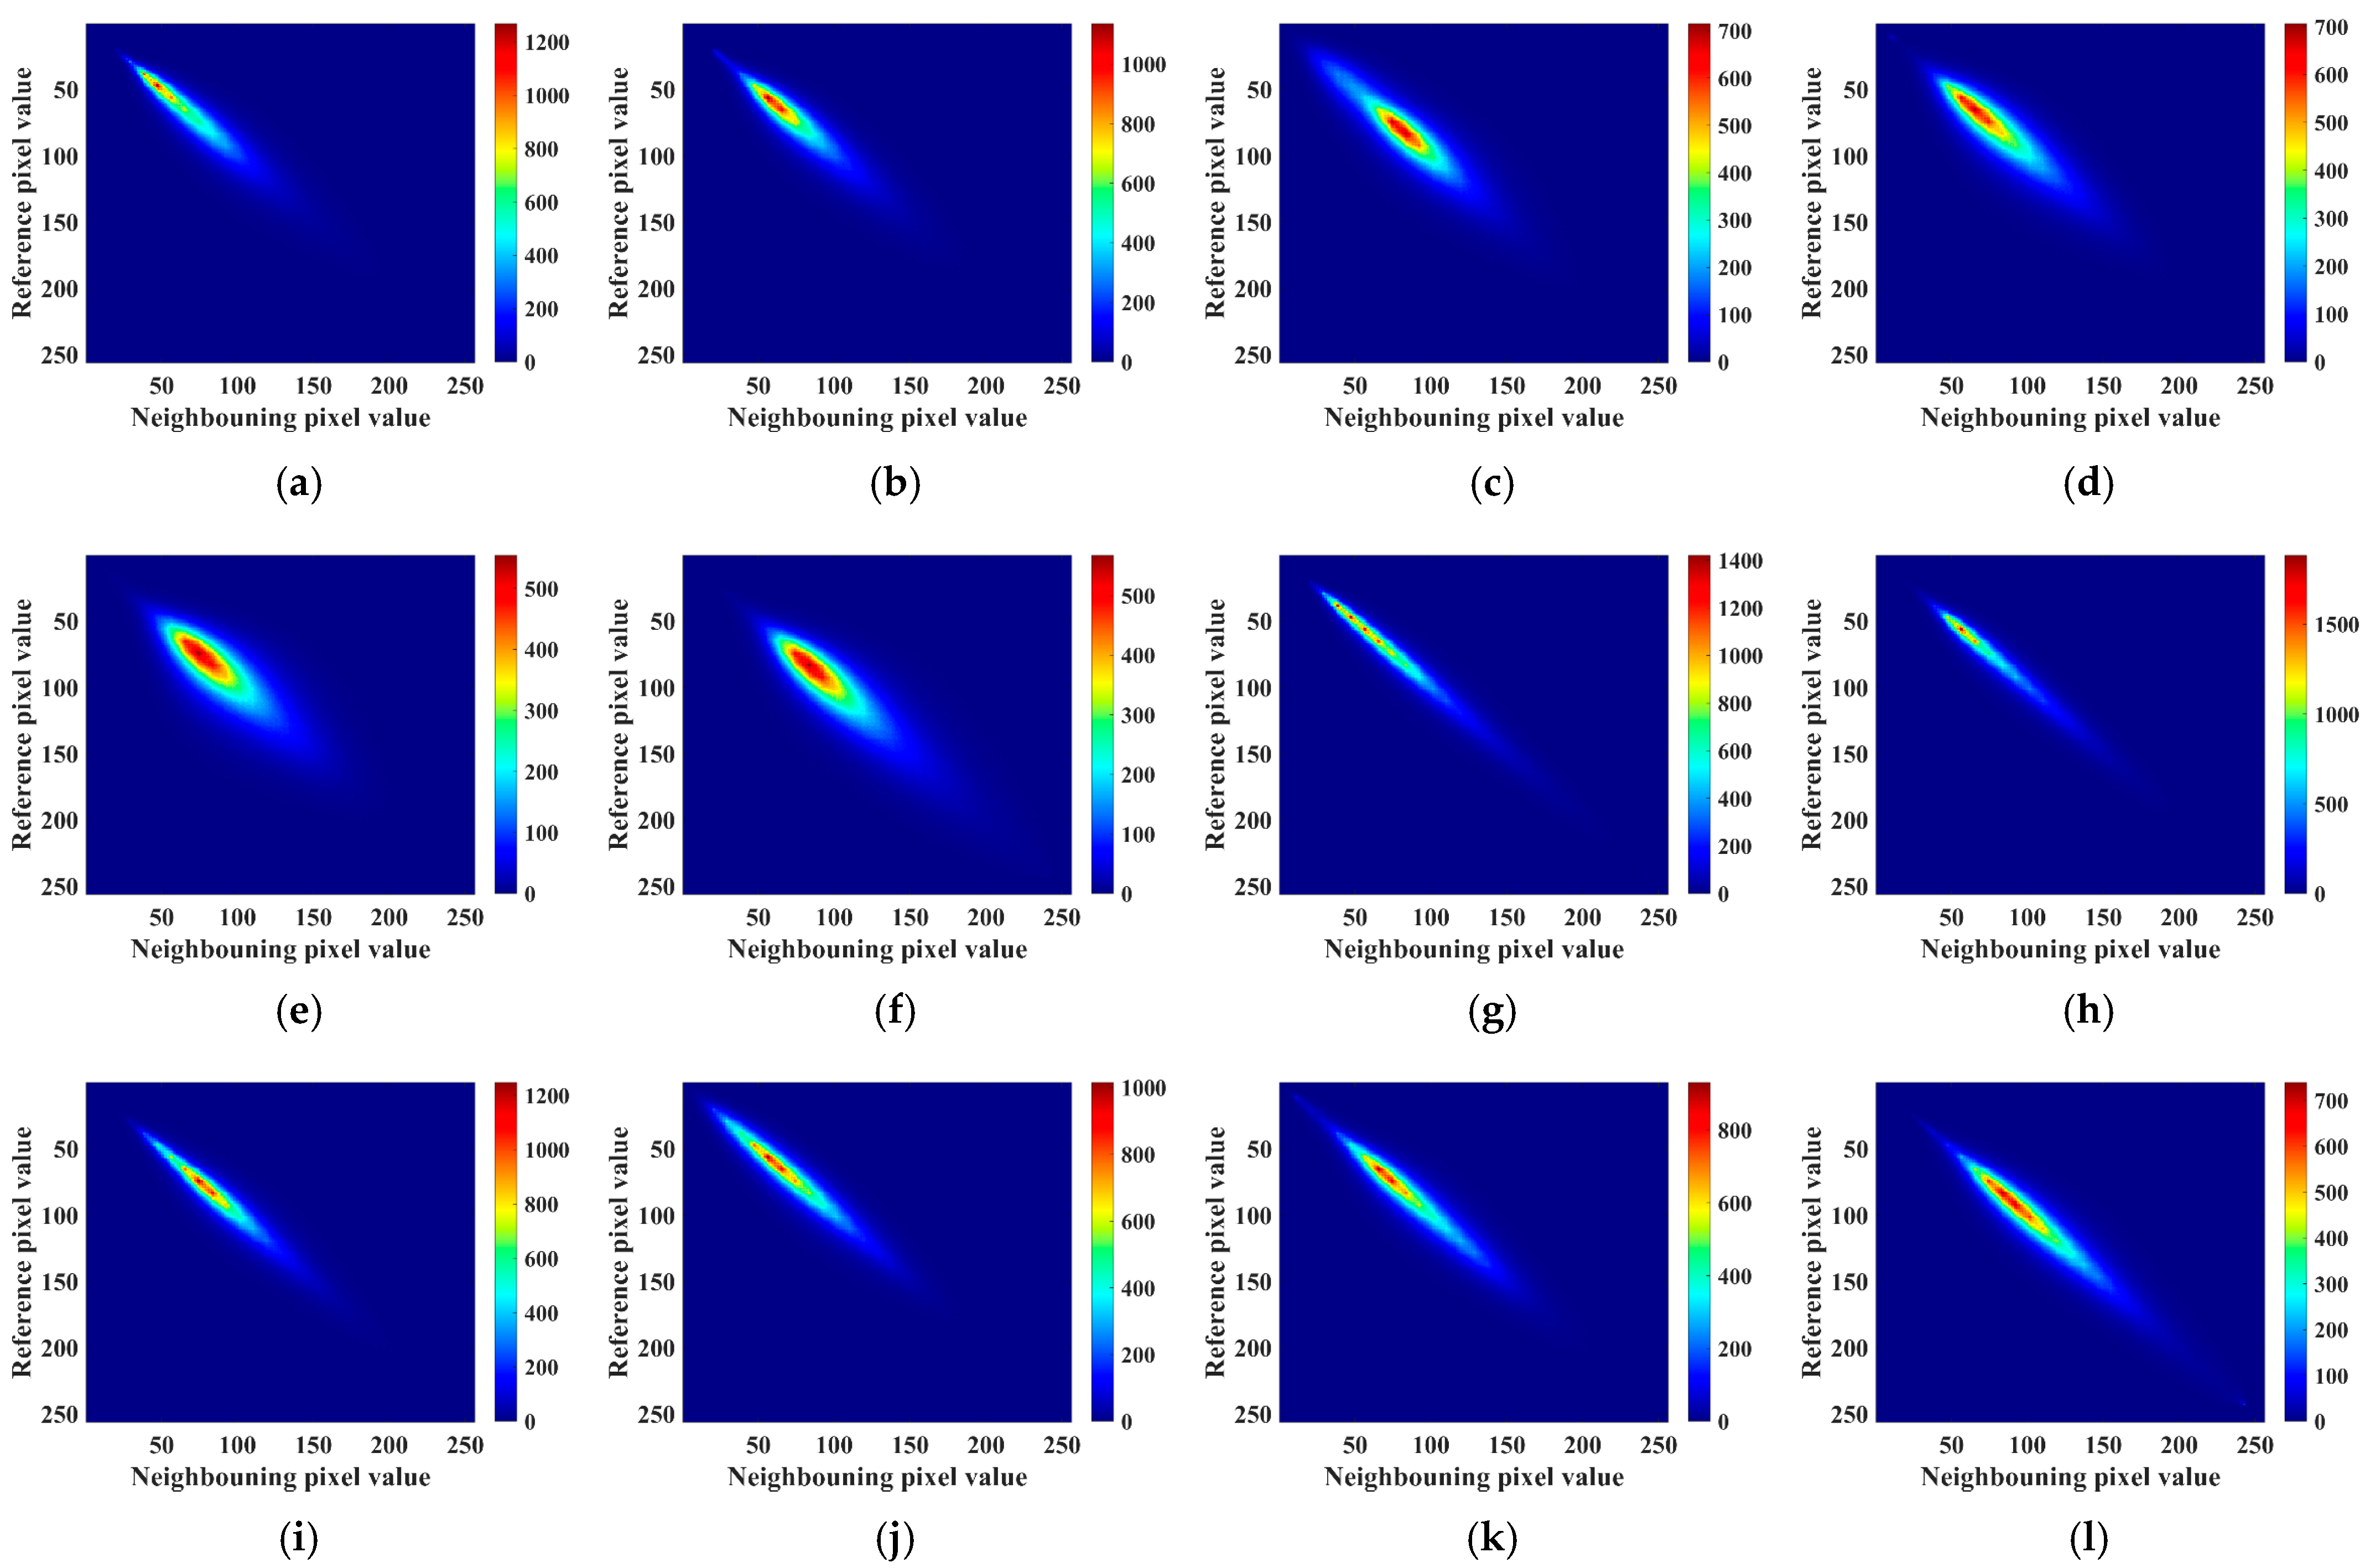
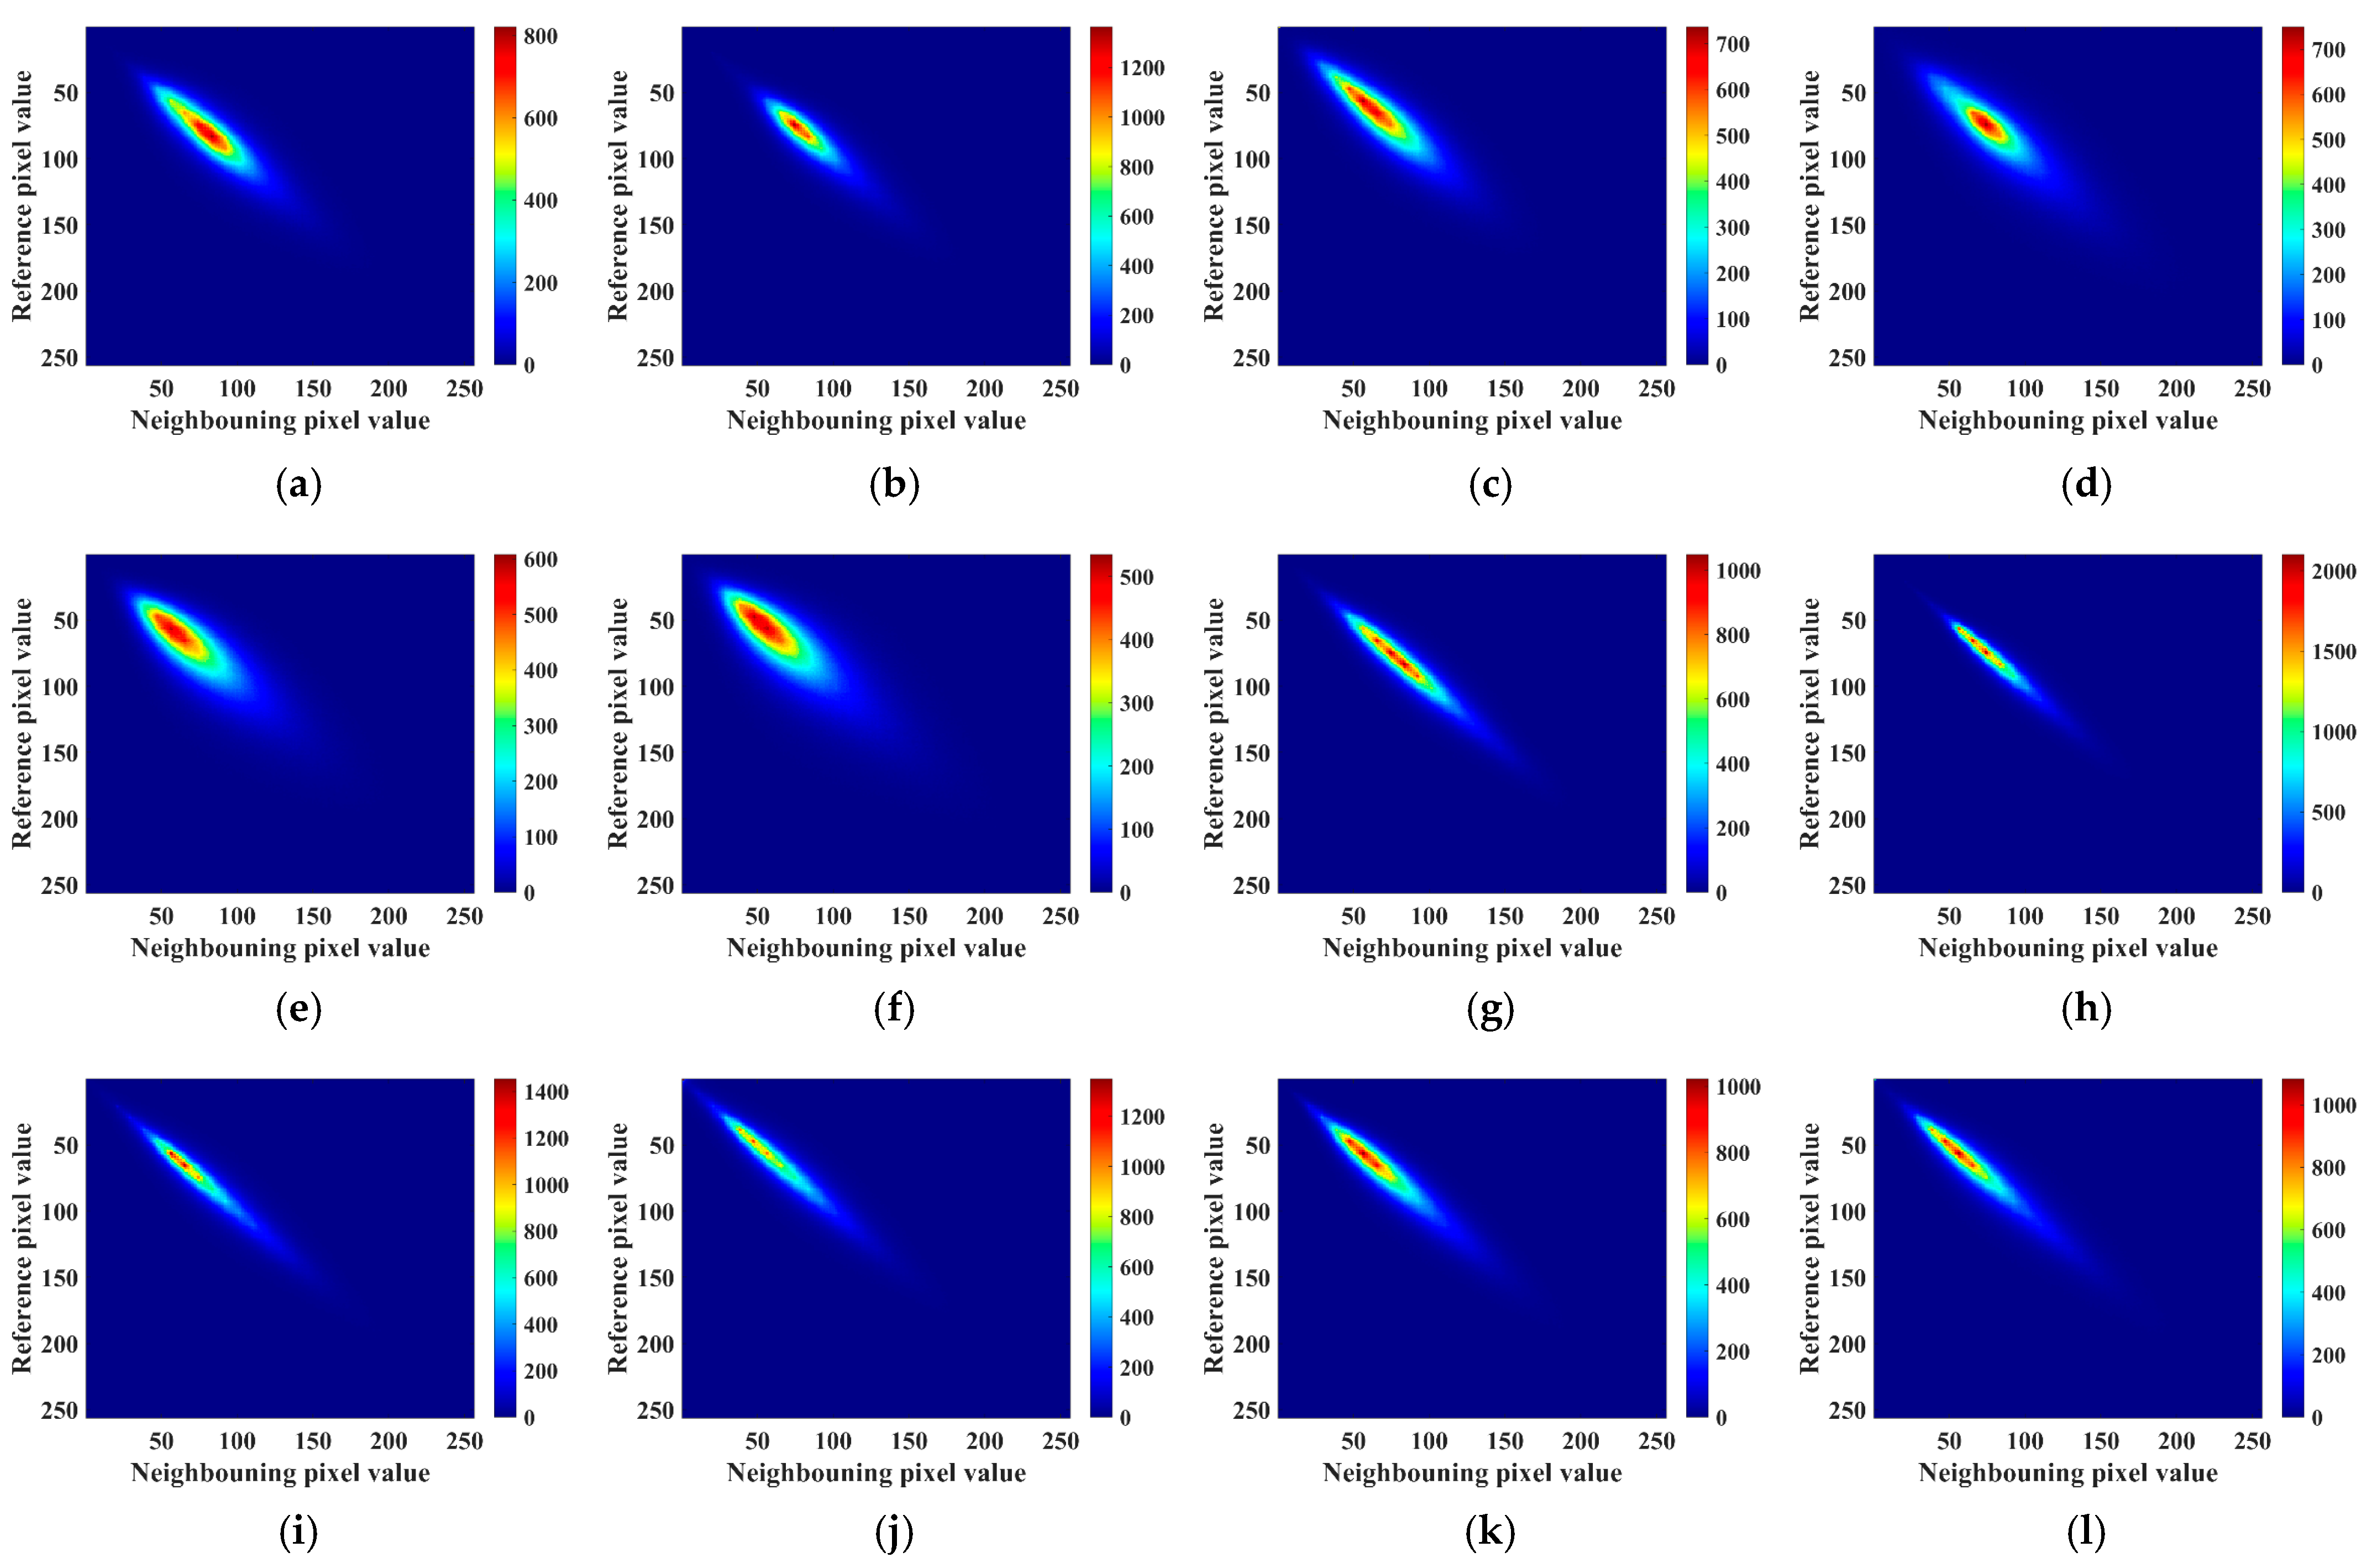
In this study, we focus on the analysis of four characteristic GLCM parameters—Energy, Entropy, Contrast, and Correlation—of SEM images under varying hydration ages (7 days and 28 days), magnifications (500× and 2000×), as shown in
Figure 13 and
Figure 14. Through the statistical variations and inherent logical connections of these parameters, we can deeply unveil the microstructural differences among samples and the mechanisms underpinning their formation, thus providing theoretical support for the regulation and performance enhancement of cement-based material microstructures.
Figure 13 and
Table 11 illustrates the notable differences among samples in Energy, Entropy, Contrast, and Correlation at a 500× magnification, indicating distinct texture features emerging in the microstructure even at the early stages of hydration. For the Energy values, the Blank sample exhibits a value of 5.34 × 10
−4, TEA is at 3.89 × 10
−4, and MGA is lower at 2.87 × 10
−4. Further reduction is observed with the addition of PCA, resulting in values of 2.40 × 10
−4 for Blank-PCA, 2.04 × 10
−4 for TEA-PCA, and 2.14 × 10
−4 for MGA-PCA. Energy represents the repetition and regularity of gray-level pairs in an image; higher values indicate more uniform textures, while lower values suggest greater diversity or uneven distribution. From this perspective, the addition of PCA lowers the Energy values as a whole, reflecting more complex structures of hydration products, irregular particle size, and arrangement, showing more pronounced heterogeneous features. Particularly, TEA-PCA samples exhibit the lowest Energy value, indicating a more irregular structure during initial formation, marked by high reaction activity and rapid generation of hydration products leading to significant local structural differences.
Entropy, as an indicator of information complexity, rises with increasing structural randomness. The Blank group’s Entropy is 11.87, slightly increasing for TEA and MGA (12.16, 12.51), while further increases are noted in the PCA series, with TEA-PCA and MGA-PCA reaching 12.90 and 12.93, respectively. This suggests that the introduction of PCA effectively accelerates hydration reaction rates and spatial heterogeneity, leading to more complex distribution patterns of products. This complexity trend corroborates earlier analyses involving gray-level and fractal dimension assessments.
Regarding Contrast, the Blank sample has a value of 185.24, which increases to 276.15 for MGA, and skyrockets in the TEA-PCA and MGA-PCA samples reaching 404.76 and 359.43. Contrast measures the intensity of gray-level variations, with higher values pointing to sharp transitions between bright and dark areas, indicating distinct structural boundaries. This trend suggests that PCA and MGA facilitate spatial segregation between hydration products and unreacted particles, significantly amplifying contrasts between local dense zones and porous areas in the microstructure.
Correlation, on the other hand, is a measure of gray-level linear dependency. The Blank sample’s correlation coefficient is 0.843, slightly lower for TEA and MGA, while PCA-enhanced samples like TEA-PCA (0.740) and MGA-PCA (0.809) show significant decrease, suggesting diminished linear correlation among gray levels, trending towards structural disorder. The low correlation value in TEA-PCA, combined with its high contrast and entropy, portrays the typical heterogeneous structure morphology during early hydration reactions.
At higher magnification (2000×), the Energy values for all samples noticeably increase, like the Blank group rising from 5.34 × 10⁻⁴ to 5.93 × 10⁻⁴. This change indicates a trend towards uniform texture with magnification, as enhanced resolution reveals finer microstructural details leading to more consistent local gray distribution, thereby increasing regularity. Conversely, Entropy values decrease, signifying reduced complexity. TEA and MGA groups exhibit high Energy and low Entropy traits. Particularly, TEA samples with low contrast (91.62) reflect dense and stable distributions of hydration products. Comparatively, MGA-PCA samples maintain high contrast and Entropy values even under high magnification, signifying sustained structural complexity.
From
Figure 14 and
Table 12, it is evident that hydration age significantly impacts the evolution of structural texture features. At 500× magnification, the Energy of the Blank group declines to 3.76 × 10
−4, while Entropy rises to 12.17 and Contrast climbs to 254.72, indicating continued hydration results in increased product formation and pronounced gray distribution differences. For TEA, Energy increases to 4.75 × 10
−4, Entropy slightly drops to 11.83, and Contrast decreases to 167.54, suggesting more uniform product distribution, blurred boundaries, and an increasingly dense structure.
MGA samples embody stronger complexity, with Contrast soaring to 242.53, Entropy at 12.35, and Energy being lower (3.14 × 10⁻⁴), indicating the structure retains high heterogeneity. Within PCA groups, MGA-PCA samples stand out, with Contrasts at 448.58 and Entropy at 13.03, indicating the most complex microstructural network with significant gray-level differences post prolonged hydration, demonstrating the sample’s intricate spatial structure and multi-scale structural strength. TEA-PCA also shows high Entropy and Contrast, affirming PCA’s role in long-term structural evolution.
At 2000× magnification, Energy values across samples significantly increase, for instance, TEA is at 6.14 × 10⁻⁴ and the Blank group rises to 4.41 × 10⁻⁴, indicating enhanced structural uniformity at local scales. Entropy values generally decrease, ranging from 11.32 to 12.38, indicating diminished complexity. Contrast values also reduce, suggesting blurred microstructural boundaries. Particularly notable is MGA-PCA’s high Contrast (167.28) and Entropy (12.38) at higher magnification, featuring consistent distribution stratification and detailed structural delineation.
The evolutionary dynamics of GLCM parameters reflect interdependent constraints: Energy and Entropy exhibit negative correlation, delineating the dual features of structural uniformity and complexity. Contrast and Entropy show significant positive correlation, indicating more distinct texture boundaries result in more complex imagery. Meanwhile, Correlation is instrumental in regulating structural order, where lower values denote stronger gray-level variation and looser structures.
3.7. Relationship Between Micro-Texture Features and Macro-Features
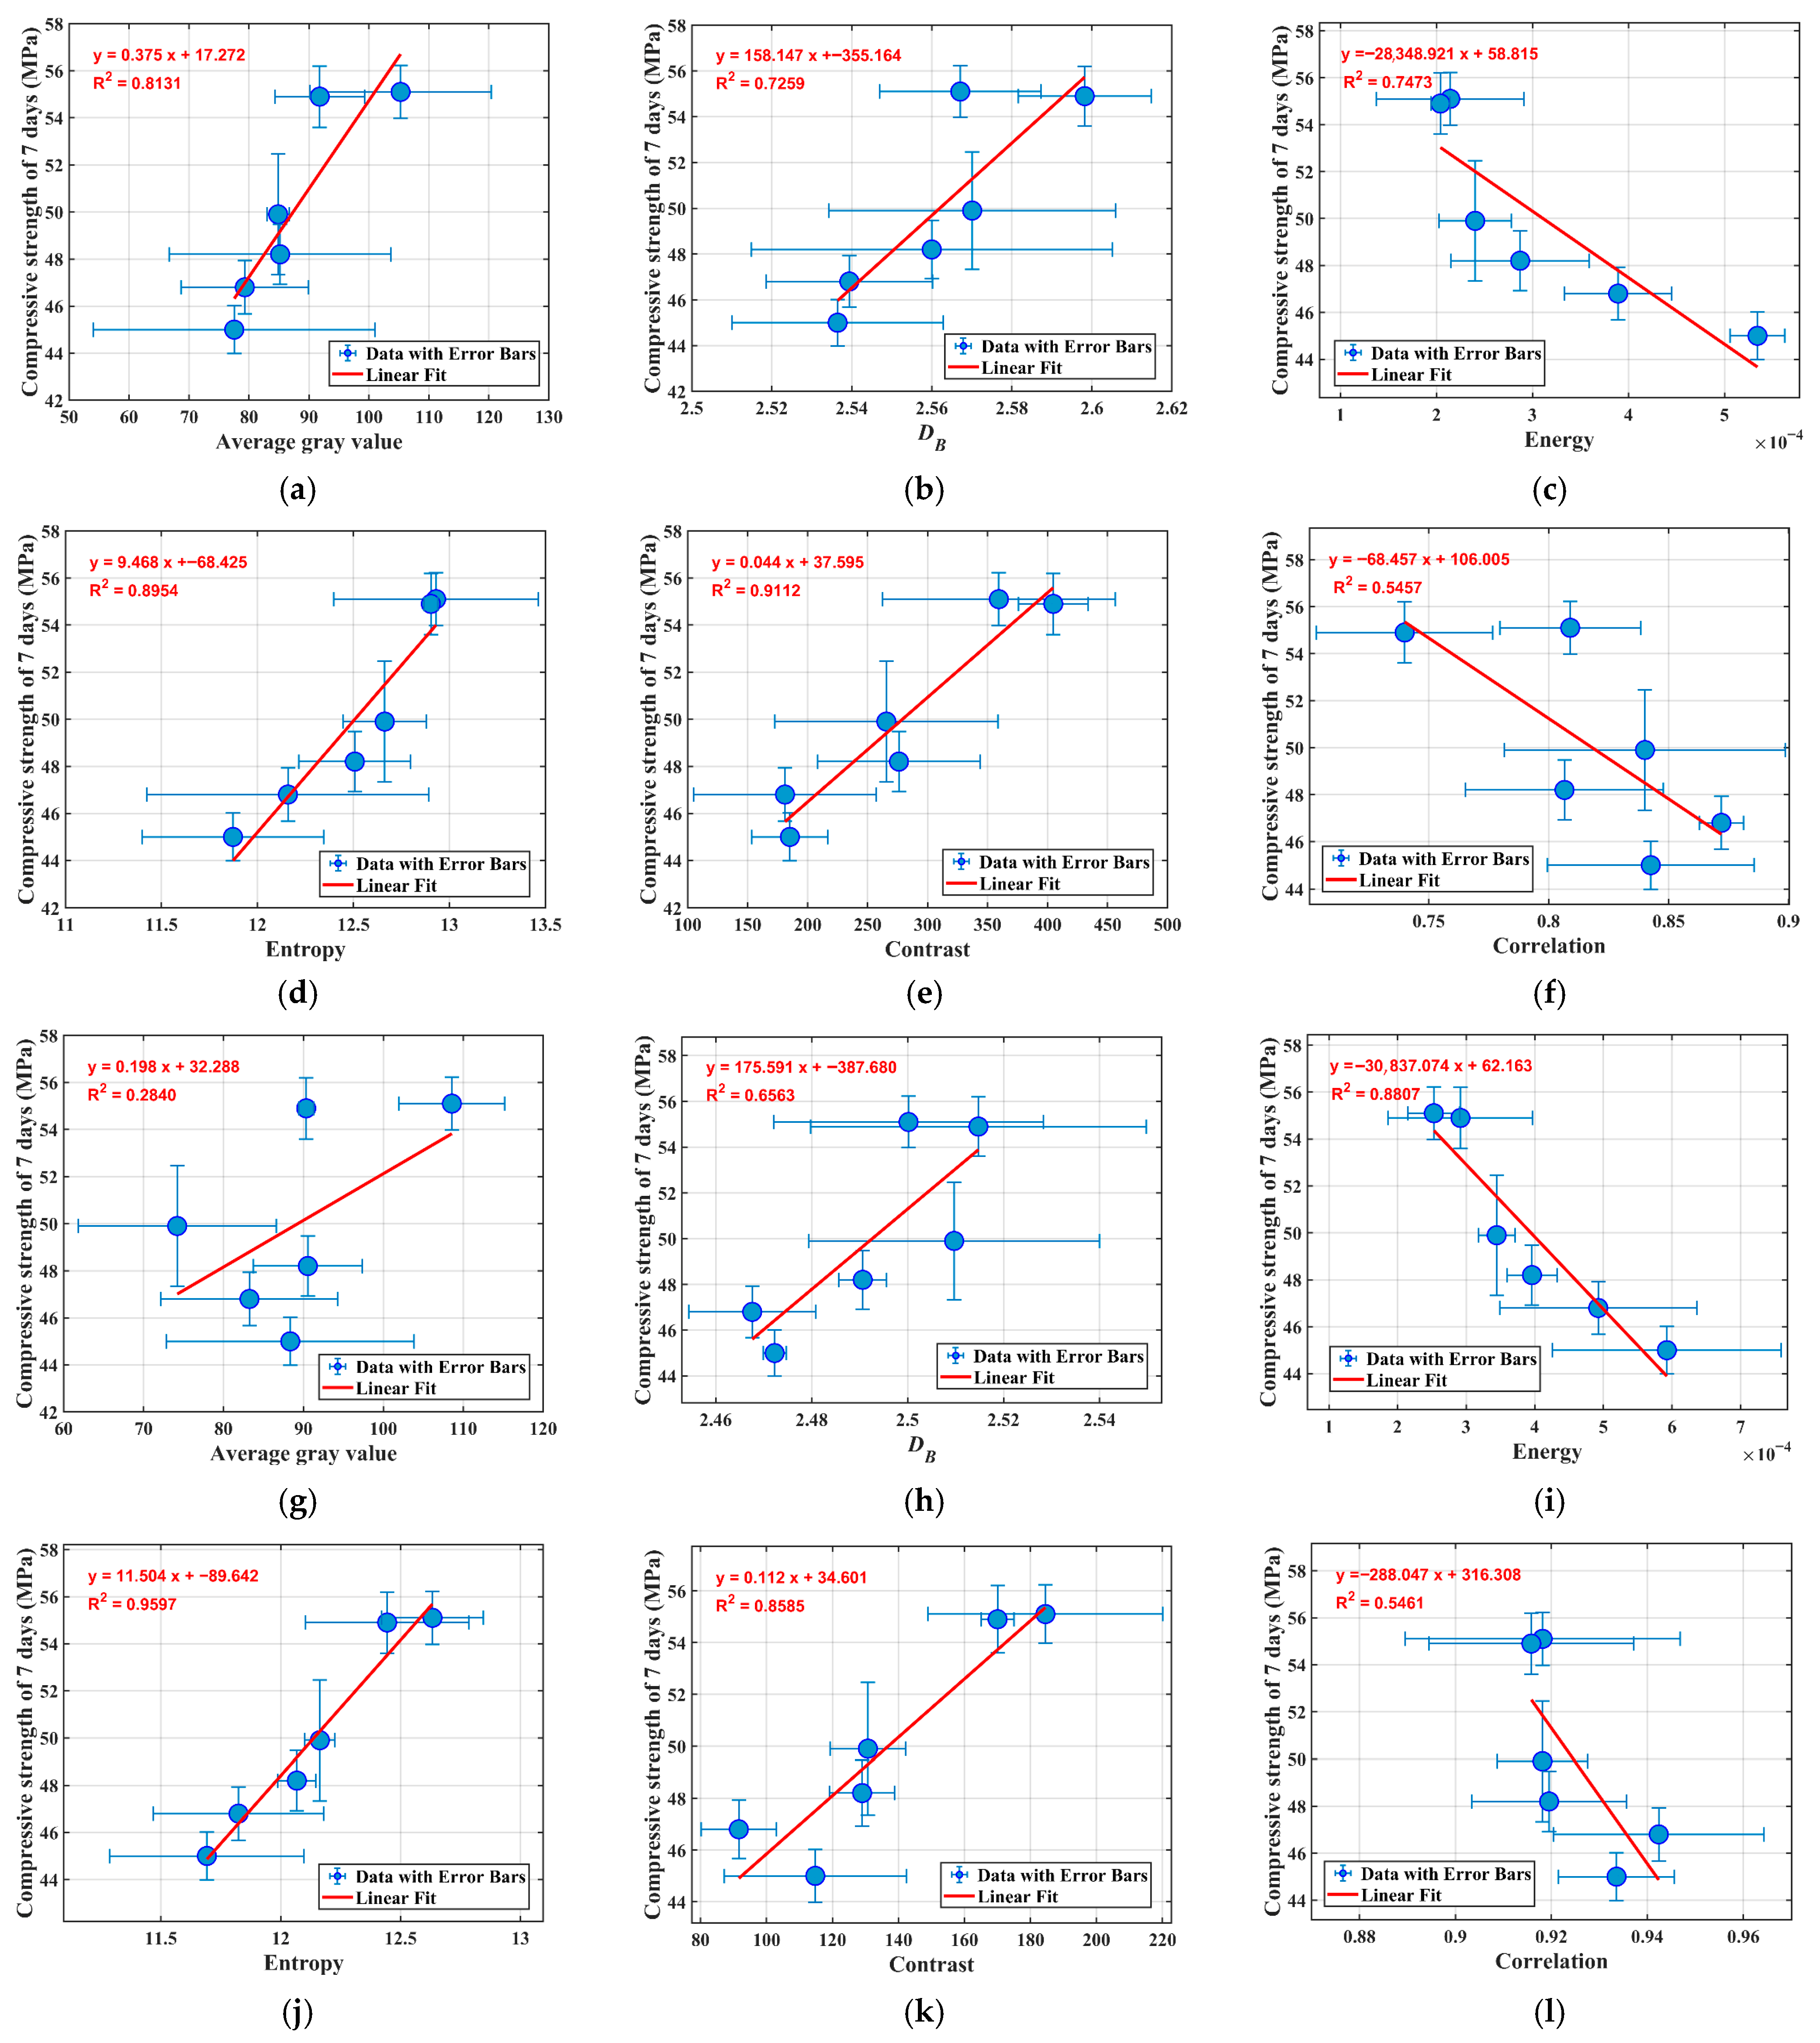
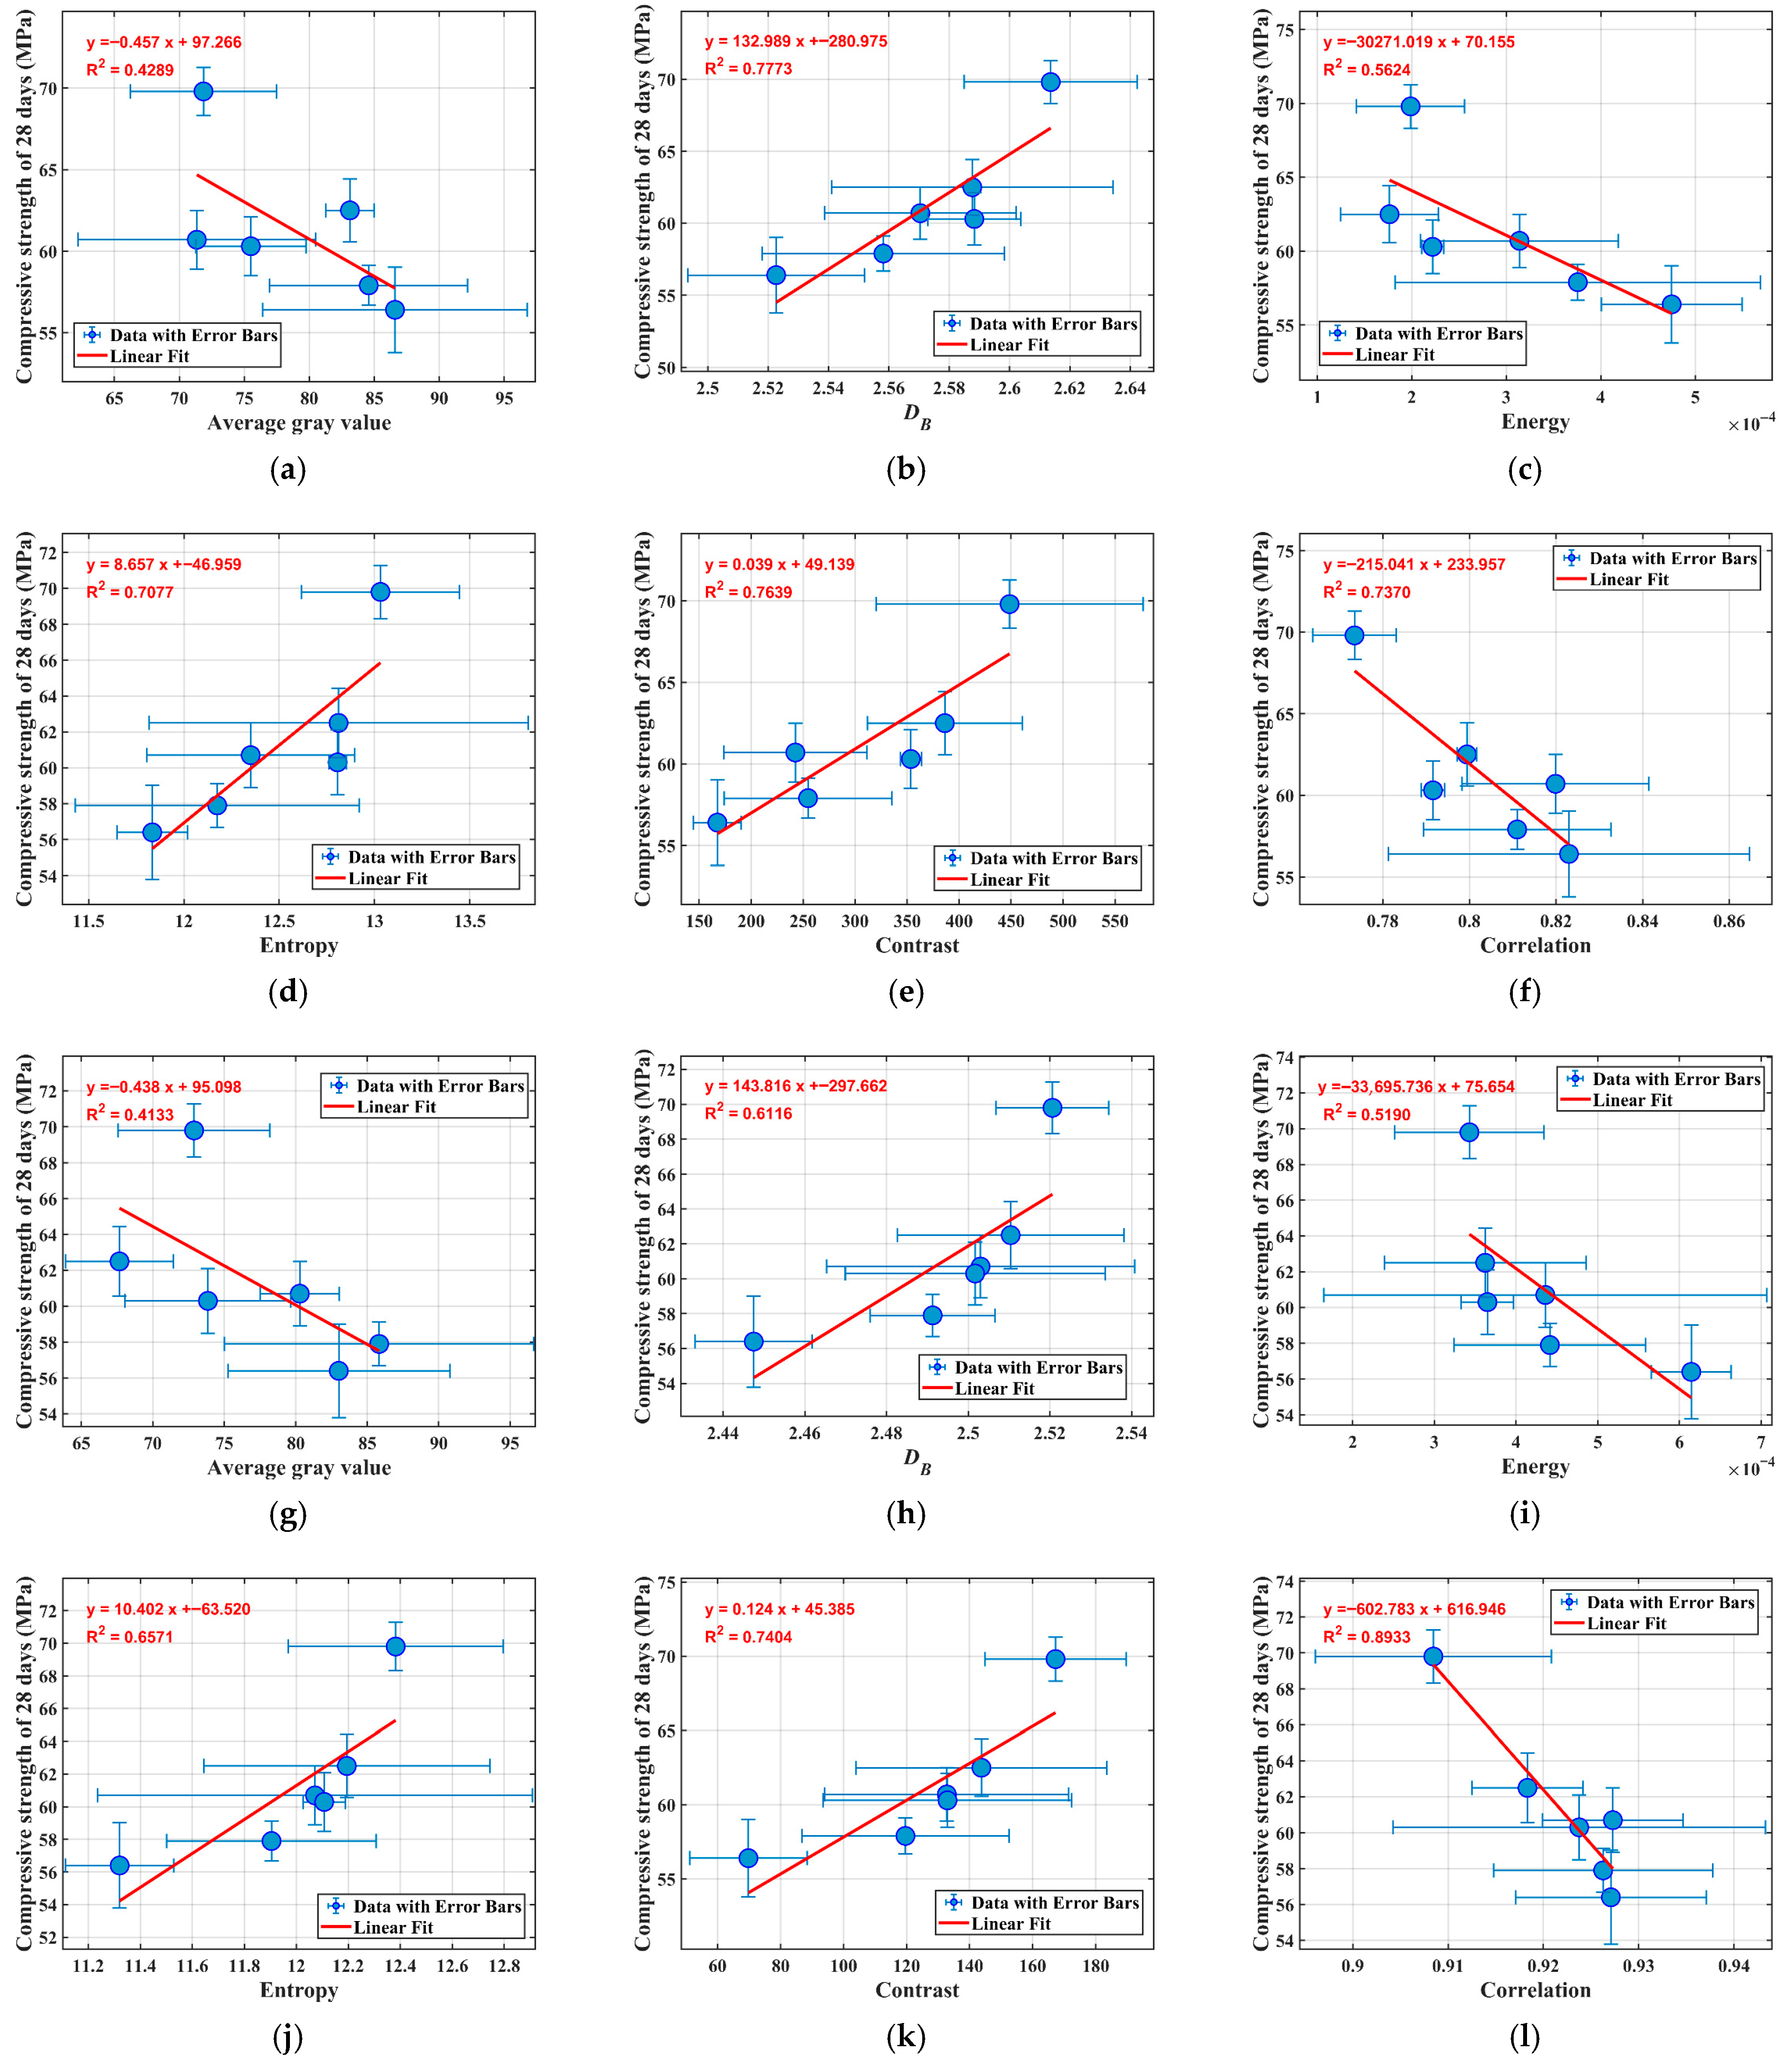
In the quantitative analysis of microstructures in cement-based materials, understanding the correlations between image-derived feature parameters and macroscopic properties holds significant theoretical and practical value. This section delves into how multidimensional parameters extracted from Scanning Electron Microscopy (SEM) images characterize microstructural features and subsequently influence mechanical performance, particularly compressive strength. Based on two representative curing ages (7 days and 28 days), we systematically examine the relationships between average gray value,
DB, and Gray Level Co-occurrence Matrix (GLCM) parameters with compressive strength. Linear regression fittings are employed to determine the coefficient of determination (R
2), which quantifies the proportion of variance in compressive strength that can be explained by each parameter. The analysis draws from SEM images captured at 500× and 2000× magnifications, allowing for a multi-scale perspective, as shown in
Figure 15 and
Figure 16.
From an image composition standpoint, the average gray value essentially reflects the average pixel brightness in the SEM image. In cement-based materials, this brightness variation indirectly indicates the density of the microstructure, the proportion of pores, and the uniformity of reaction product distribution. As illustrated in
Figure 15a,g and
Figure 16a,g, the correlation between average gray value and compressive strength exhibits considerable fluctuation across curing ages. At 7 days, a positive correlation is observed, suggesting that higher gray values (indicative of denser early-age microstructures) align with improved strength development during initial hydration phases. At 28 days, the relationship between average grayscale value and compressive strength shifts to a negative correlation in some cases, with overall R
2 values generally low (<0.5). This reversal can be explained by both microstructural and methodological factors. At early ages (7 days), higher grayscale values typically reflect denser regions enriched in hydration products such as C–S–H gel and ettringite, which support strength development [
42]. By 28 days, however, microstructural reorganization occurs, including CH crystal coarsening, microcracking from autogenous shrinkage, and redistribution of hydration phases [
43]. These processes increase heterogeneity and reduce the linear association between grayscale and strength. In addition, grayscale values are highly sensitive to surface and imaging conditions (e.g., polishing scratches, carbon coating irregularities, beam penetration depth), which may introduce artifacts unrelated to intrinsic properties [
44]. Such sensitivity, combined with the inability of grayscale to distinguish pores from low-density hydrates, explains the consistently weak correlations. Therefore, grayscale alone should be regarded as a non-robust predictor of compressive strength.
In contrast to the average gray value, the fractal dimension (
DB), calculated via box-counting methods, serves as a robust measure of image structural complexity and boundary roughness, as shown in
Figure 15 and
Figure 16. Across all curing ages and magnifications,
DB exhibits consistent positive correlations with compressive strength. Specifically, at 7 days under 500× magnification, R
2 reaches 0.7259. At 2000× for the same age, R
2 is 0.6563, slightly lower but still indicative of a strong relationship. For 28 days, the values are even more pronounced: 0.7773 at 500× and 0.6116 at 2000×. These trends affirm that more complex microstructures, characterized by higher fractal dimensions, enhance space-filling capabilities and pore connectivity, thereby bolstering macroscopic load-bearing capacity.
A notable observation is the superior R2 at 500× compared to 2000× across both ages. This disparity can be dissected from perspectives of image representativeness and information content. At 500× magnification, SEM images capture a wider field of view, encompassing a more representative sample of the microstructure. This includes diverse elements such as multiple hydrate clusters, pore distributions across scales, and interfaces between aggregates and paste. Such holistic representation ensures that DB calculations integrate global complexity, reducing bias from localized anomalies. For instance, the broader view averages out variations in hydration degree across the sample, yielding a DB that more accurately mirrors overall material integrity and thus correlates better with bulk compressive strength. Conversely, 2000× images are inherently localized, focusing on finer details like individual microcracks, crystal facets, or isolated voids. While this granularity reveals high-resolution textures, it diminishes representativeness; the captured area may not reflect the entire specimen’s heterogeneity. Information content at this scale is skewed toward microscale irregularities, where prominent features like microcracks—often artifacts from sample drying or polishing—disproportionately influence DB. Thus, 500× strikes an optimal balance, providing sufficient detail for complexity assessment while maintaining representativeness, making DB a premier parameter for strength prediction
GLCM parameters offer texture-based insights by quantifying spatial relationships between pixel gray levels, capturing aspects like uniformity, randomness, and variability. We analyze four key metrics: Energy, Entropy, Contrast, and Correlation, each revealing distinct microstructural attributes linked to strength.
Energy measures texture uniformity, with lower values indicating dispersed gray distributions and complex, non-homogeneous patterns. In both curing ages, Energy shows significant negative correlations with compressive strength. R
2 values are 0.7473 (7 d, 500×), 0.8807 (7 d, 2000×), 0.5624 (28 d, 500×), and 0.5190 (28 d, 2000×), as reported in
Figure 15c,i and
Figure 16c,i. High R
2 at early ages suggests that low Energy—reflecting intricate interweaving of multi-phase hydrates—fosters dense, load-resistant structures. Lower values at later ages may stem from maturation-induced homogenization, where Energy’s discriminatory power wanes. Notably, 2000× yields higher R
2 at 7 days (0.8807 VS 0.7473), inverting the trend seen in
DB. This occurs because 2000×’s localized view amplifies fine-scale non-uniformities in early microstructures, where hydration is patchy. Such detailed information content enhances Energy’s ability to detect phase disparities that directly impact nascent strength. At 500×, the broader representativeness dilutes these signals, incorporating more averaged uniformity and thus slightly reducing correlation strength.
Entropy: As a measure of disorder, Entropy positively correlates with strength, with high values denoting complex gray transitions reflective of hydration product diversity and spatial heterogeneity. R
2 values are exceptionally high: 0.8954 (7 d, 500×), 0.9597 (7 d, 2000×), 0.7077 (28 d, 500×), and 0.6571 (28 d, 2000×), as reported in
Figure 15d,j and
Figure 16d,j. The peak at 7d, 2000× underscores Entropy’s sensitivity to early-age chaos, where varied hydrates form disorganized yet strong networks. Similarly to Energy, 2000× outperforms at 7 days due to enriched information on microscale entropy sources like needle-like ettringite formations. However, at 28 days, 500× shows better R
2 (0.7077 VS 0.6571), as matured microstructures benefit from global views that capture evolved heterogeneity across larger areas. Representativeness at 500× ensures Entropy integrates macroscale disorder (e.g., pore networks), providing a more holistic link to strength, whereas 2000×’s focus on locals introduces variability from isolated features.
Contrast: Contrast quantifies local intensity variations, with higher values signaling sharp boundaries and clustered aggregates. It mirrors Entropy’s positive trend, though specific R
2 values are not detailed in the base analysis, but inferred to be comparable based on similar patterns. High Contrast implies discontinuous hydrate growth, enhancing local support and crack resistance via stress dispersion channels. The magnification effect likely favors 2000× for early ages, where fine contrasts in crystal boundaries are prominent, boosting information content for correlation, as reported in
Figure 15e,k and
Figure 16e,k. At later ages, 500×’s representativeness captures broader contrast gradients, including interfacial zones, yielding stronger overall fits.
Correlation: This parameter assesses linear dependency in gray levels, with lower values indicating less orderly structures. It exhibits negative correlations, with R
2 of 0.5457 (7 d, 500×), 0.5461 (7 d, 2000×), 0.7370 (28 d, 500×), and 0.8933 (28 d, 2000×), as reported in
Figure 15f,l and
Figure 16f,l. Higher R
2 at later ages (e.g., 0.8933 explaining 89% variance) suggests that reduced Correlation (disorder) in mature pastes correlates with strength via complex networks. Intriguingly, 2000× excels at 28 days, as localized imaging highlights subtle correlations in refined hydrates. At 500×, broader views average out these details, but still provide solid representativeness for global disorder assessment.
All in all, average gray value ranks lowest in efficacy, with average R2 values often below 0.5, highlighting its inadequacy as a standalone predictor. This parameter’s simplicity renders it vulnerable to extraneous factors, such as imaging artifacts or non-structural brightness variations, which dilute its correlation strength. In essence, while all parameters contribute to a multifaceted understanding, DB and Entropy stand out for their high R2, offering the most reliable bridges between microtexture and macrostrength. This hierarchy is not static but modulated by magnification and curing age. At 500×, parameters like DB and Entropy generally achieve higher R2 due to enhanced representativeness—the images serve as microcosms of the bulk material, incorporating statistical diversity in features. This representativeness mitigates outliers, ensuring that extracted parameters reflect intrinsic properties rather than sampling biases. Informationally, the larger field of view at 500× aggregates more data points (pixels), enabling robust statistical computations for fractals and GLCM, which rely on spatial patterns across scales. For DB, this means better approximation of self-similarity over meso-to-micro transitions; for Entropy, it captures entropy from varied phase interactions. In contrast, 2000×’s advantages emerge in parameters sensitive to fine details, like Energy and Correlation at specific ages, where localized information content is paramount. However, its lower representativeness—stemming from a narrower view that might overemphasize anomalies (e.g., a single microcrack dominating the frame)—often results in inflated variability and reduced R2 for holistic metrics like DB.
Despite these advancements and the good results obtained—evidenced by consistent positive/negative trends and R2 values often exceeding 0.7—the representativeness of SEM images remains a critical shortfall. SEM imaging, by nature, captures surface morphologies at high resolution but is profoundly susceptible to artifacts introduced during sample preparation. Processes such as cutting, polishing, drying, and coating can induce micro-cracks, surface roughness, or unevenness, which distort the true microstructure. Informationally, SEM’s electron backscattering emphasizes topography and composition via secondary electrons, but this can amplify noise from charging effects or beam damage, particularly in insulating cement samples. Such noise contaminates GLCM computations, where pixel-pair relationships are sensitive to outliers. These limitations manifest in the observed R2 fluctuations; for example, the lower R2 for mean gray value may partly stem from preparation-induced brightness artifacts rather than intrinsic weaknesses. Similarly, the magnification-dependent drops in DB’s R2 at 2000× highlight how localized artifacts (e.g., polishing scratches appearing as cracks) inflate perceived complexity without corresponding strength benefits, thus diluting correlations.
To mitigate these issues and enhance analytical precision, future research should pivot toward more representative microstructural imaging techniques that offer volumetric, non-destructive, or in situ capabilities. Backscattered Electron (BSE) imaging, an extension of SEM, is a promising alternative. BSE detects atomic number contrasts, providing compositional maps that distinguish phases (e.g., unhydrated clinker from pores) with less topographic bias [
45]. Unlike secondary electron SEM, BSE is less affected by surface roughness, as it penetrates deeper (microns), yielding more representative cross-sections [
46,
47,
48]. Preparation artifacts are minimized through flat polishing and conductive coating, and quantitative BSE analysis (e.g., via thresholding for porosity) can integrate with texture parameters for hybrid models [
49,
50]. Another superior modality is X-ray Computed Tomography (X-CT), which enables three-dimensional reconstruction of internal microstructures without destructive sectioning. X-CT scans entire volumes (mm to cm scales), capturing true representative-ness by averaging heterogeneities across slices [
51,
52]. This volumetric data allows extraction of 3D fractals, porosity networks, and texture analogs (e.g., 3D GLCM extensions), directly linking to mechanical properties via finite element simulations informed by tomographic data [
53,
54,
55]. For cement-based materials, X-CT excels in quantifying 3D pore connectivity, tortuosity, and phase distributions, which are critical for strength prediction [
56,
57].
